 Emrah Arslan1
 Silvia Gaftandzhieva2*Ali Gorgani Firouzjaei3
 Javad Hassannataj Joloudari4,5,6Rositsa Doneva7
- 1Department of Computer Engineering, Faculty of Engineering, KTO Karatay University, Konya, Türkiye
- 2Faculty of Mathematics and Informatics, University of Plovdiv Paisii Hilendarski, Plovdiv, Bulgaria
- 3Department of Industrial and Systems Engineering, Tarbiat Modares University, Tehran, Iran
- 4Faculty of Electrical and Computer Engineering, University of Birjand, Birjand, Iran
- 5Department of Computer Engineering, Bab.C., Islamic Azad University, Babol, Iran
- 6Department of Computer Engineering, Technical and Vocational University (TVU), Tehran, Iran
- 7Faculty of Physics and Technology, University of Plovdiv Paisii Hilendarski, Plovdiv, Bulgaria
Introduction: Early identification of academically at-risk students remains a persistent challenge in higher education, largely due to the limited explainability and adaptability of existing predictive models. Although many early-warning systems rely on behavioral, assessment, or attendance data, their lack of transparent decision-making often reduces trust and limits their practical utility for educators.
Methods: To address this problem, this study proposes Ex-ADA, an Explainable AdaBoost-based framework that integrates the interpretive strength of SHapley Additive exPlanations (SHAP) with the robust ensemble learning capabilities of AdaBoost. Using academic, behavioral, and engagement indicators from 642 students enrolled in the Fundamentals of Programming course at the University of Plovdiv, the framework aims to deliver both high predictive accuracy and human-interpretable insights for data-driven intervention.
Results: Ex-ADA achieves an accuracy of 84.12% and an AUC of 92.31%, outperforming conventional classifiers such as k-nearest neighbor, decision tree, naïve Bayes, and multilayer perceptron. SHAP analyses reveal that attendance, midterm practice performance, and homework completion are the most influential predictors of student success.
Discussion: In addition to global interpretability, the framework provides personalized, instance-level explanations that help instructors understand each student’s risk factors. By bridging predictive analytics with transparent educational decision-making, Ex-ADA demonstrates how explainable ensemble models can enhance early-warning systems and support more effective, timely pedagogical interventions.
1 Introduction
The quick uptake of digital learning environments in recent years has produced enormous volumes of educational data, opening up new avenues for enhancing student retention and teaching efficacy (Cao et al., 2023). The prompt identification of students who may be at-risk of academic dropout due to behavioral and emotional issues is one of the most important issues facing higher education today (Khosa and Olanipekun, 2025). Academic success and institutional retention rates can be significantly increased through prompt detection and tailored intervention, according to a wealth of research (Habley et al., 2012; Berens et al., 2019; Capstick et al., 2019). Therefore, a key component of the creation of intelligent educational systems is predictive modeling utilizing Artificial Intelligence (AI) and Machine Learning (ML) (Ahmed, 2025; Ciolacu et al., 2018; Zawacki-Richter et al., 2019; Lin et al., 2023; Fonda et al., 2024; Hassan et al., 2025). In order to predict student performance, traditional Early-Warning Systems (EWS) usually rely on static indicators like attendance, test results, and demographic information (Holmes, 2025; Ma et al., 2025; Seidel and Kutieleh, 2017).
Nevertheless, these models frequently lack explainability and adaptability, which makes educators less trusting. Explainable Artificial Intelligence (XAI) has become a potent paradigm in recent years to improve the dependability and transparency of machine-based predictions (Gunning, 2017; Arrieta et al., 2020; Das and Rad, 2020; Bui, 2022; Lötsch et al., 2022). By connecting data-driven prediction and pedagogical decision-making, the incorporation of XAI into educational analytics helps teachers comprehend the reasons behind a student’s risk assessment (Minh et al., 2022). The use of AI-driven frameworks to identify and assist students who might be at-risk of academic dropout has been the subject of numerous studies in recent years. As an illustration, Baneres et al. (2019) suggested a Gradual At-Risk (GAR) model that allows teachers to take proactive action by giving them ongoing feedback via predictive dashboards.
Their findings showed that even relatively simple classification algorithms, when properly calibrated, can perform on par with more complex deep learning methods in identifying students likely to struggle in a course. Similarly, other researchers have developed machine learning–based systems for early dropout prediction, demonstrating that timely, data-informed interventions can substantially reduce student attrition (Jokhan et al., 2019; Lee and Chung, 2019; Rahma and Ulfah, 2025).
These contributions highlight the usefulness of developing comprehensible and trustworthy models that successfully convey the underlying causes in addition to identifying risk. Despite these developments, there are still significant drawbacks to the current methods. Accuracy is prioritized over explainability in many predictive models, creating “black-box” systems that are unable to defend their results (Adadi and Berrada, 2018; Albreiki et al., 2021).
Additionally, the heterogeneity of educational datasets, which are often noisy and unbalanced, presents another difficulty for conventional algorithms like logistic regression, decision trees, or Naïve Bayes classifiers (Adnan et al., 2021). To solve these issues, ensemble learning strategies that maintain explainability while enhancing robustness are required.
Ensemble methods like XGBoost, CatBoost, and LightGBM excel in performance but often require extensive hyperparameter tuning and are sensitive to overfitting (Chen and Guestrin, 2016; Ke et al., 2017; Prokhorenkova et al., 2018). In contrast, AdaBoost’s simpler structure and use of weak learners make it more resilient to noise and imbalances in educational datasets, which is crucial for accurate and stable predictions. AdaBoost also integrates better with interpretive of SHapley Additive exPlanations (SHAP) approach, providing clear, interpretable insights, whereas tree-based methods may struggle with transparent attribution (Freund and Schapire, 1997).
SHAP offers consistent, additive attributions based on game theory, providing reliable and reproducible explanations (Lundberg and Lee, 2025). Unlike Local Explainable Model-Agnostic Explanations (LIME) approach, which can produce unstable local approximations, SHAP ensures greater transparency and fairness, which are essential for educational settings where explanations need to be clear and trustworthy for educators (Ribeiro et al., 2016).
Therefore, the combination of AdaBoost with SHAP strikes a balance between predictive performance and transparency, making it a particularly suitable choice for identifying at-risk students. This integration not only improves accuracy but also provides the clear, actionable insights needed for effective educational interventions.
To this end, this study introduces Ex-ADA, an Explainable AdaBoost framework that combines the adaptive ensemble power of AdaBoost with the interpretive strength of SHAP analysis. AdaBoost is a powerful ensemble learning algorithm that iteratively combines multiple weak learners to minimize misclassification errors, making it particularly suitable for complex and unbalanced educational datasets. On the other hand, SHAP, grounded in cooperative game theory, provides a theoretically sound method for quantifying the contribution of each feature to the model’s output. Together, these two techniques form a hybrid system capable of both accurate prediction and transparent reasoning.
The integration of SHAP into AdaBoost offers several advantages for educational prediction tasks. First, it allows educators to identify which academic, behavioral, or engagement factors contribute most to the model’s risk assessment. For instance, features such as prior Grade Point Average (GPA), online participation frequency, or assignment submission patterns can be visualized as explanatory factors, fostering trust in automated decision systems (Azcona et al., 2019). Second, the SHAP framework enables per-student explainability, meaning that for each learner, individualized explanations can be generated. This personalization enhances the model’s utility as a diagnostic and advisory tool rather than a mere classifier (Rico-Juan et al., 2023).
Recent explainable AI frameworks, such as the Rapid Analysis and Detection of At-risk students with AI-based Response (RADAR) system proposed by Embarak and Hawarna (2024), have demonstrated the feasibility of XAI-driven student monitoring. The RADAR system leveraged multimodal data—including learners’ personality traits, academic performance, and soft skills—to achieve an overall accuracy of 82.2% in detecting students at-risk. Importantly, it provided explainable explanations that enabled educators to act based on transparent reasoning rather than opaque model predictions. Similarly, Bui employed theory-guided data science and XAI to enhance explainability in at-risk student prediction, further confirming that explainability plays a critical role in fostering institutional trust and adoption of AI tools in education (Bui, 2022).
The increasing amount of data highlights how explainable, ensemble-based systems, such as Ex-ADA, can bridge the gap between human understanding and algorithmic prediction. AdaBoost guarantees that the model can detect at-risk students with high accuracy and precision while remaining resistant to overfitting. At the same time, SHAP visualizations offer both local and global explainability, giving administrators personalized justifications for focused intervention as well as insights into the most significant risk factors throughout the cohort (Villano et al., 2018; Waheed et al., 2020).
Furthermore, the Ex-ADA framework addresses several challenges unfulfilled by previous models. Unlike traditional EWS that treat all students uniformly, Ex-ADA can adaptively adjust to individual learning trajectories, capturing nonlinear relationships between diverse variables. This approach aligns with the broader trend toward personalized education and data-driven decision-making in higher education (Karadeniz et al., 2019). It also contributes to ethical and transparent AI deployment by ensuring that predictions are explainable and traceable, a growing requirement in academic analytics (Embarak, 2021).
The contributions of this research are threefold:
1. Proposed an AdaBoost framework based on SHAP that achieved 92.31% AUC and 84.12% accuracy for at-risk prediction.
2. Improved the transparency of educational decision-making by providing quantitative and visual SHAP analyses.
3. Promoted explainable and human-centered AI in education by validating Ex-ADA against benchmark models.
4. Determined that the two most important behavioral indicators affecting academic performance were attendance and midterm practice.
The rest of this research is structured as follows. In Section 2, relevant research on ensemble-based and explainable educational prediction models is reviewed. The suggested Ex-ADA methodology is described in detail in Section 3. The experimental evaluation and results are presented and discussed in Section 4. The study’s limitations and possible enhancements are described in Section 5, and the paper’s conclusion and future research directions are suggested in Section 6.
2 Related works
The increasing availability of educational data and advances in artificial intelligence have enabled researchers to develop predictive systems that identify at-risk students early and enable timely interventions. Recent studies combine XAI, ensemble techniques, and machine learning to improve the explainability and accuracy of student dropout prediction. This section examines important representative works that cover explainable, ensemble-based, and AI-driven frameworks, emphasizing their key findings, data sources, and methodological innovations. RADAR is an explainable AI system created by Embarak and Hawarna to identify and track students who are at-risk (Embarak and Hawarna, 2024). The researchers applied features like personality traits, academic performance, and soft skills using decision tree models enhanced with Correlation-based Feature Selection (CFS). With an accuracy of 82.22% and an F1-score of 83.33%, RADAR performed better than conventional early-warning systems. The system gave priority to explainability and transparency in addition to its predictive capabilities, giving educators personalized alerts and useful insights. RADAR is a prime example of how explainable models can convert predictive analytics into useful aids that promote ongoing academic retention and progress. Baneres et al. (2019) created the Early Feedback Prediction System (EFPS) to use data from continuous assessment activities to identify students in first-year university courses who are at-risk. As new grades are released, the GAR model instantly revises its predictions. In terms of explainability and performance, Naïve Bayes outperformed the other tested algorithms, achieving true positive rates of up to 86% and accuracy levels above 80%. Through the integration of prediction outcomes into personalized feedback messages and visual dashboards, EFPS empowers educators and learners to take proactive measures. The study demonstrated how adaptive, lightweight models incorporated into learning management systems can offer scalable, explainable, and actionable early-warning capabilities for higher education.
Berens et al. suggested an Early Detection System (EDS) that uses performance and administrative data to predict student dropout in German universities (Berens et al., 2019). Using the AdaBoost ensemble algorithm, the model integrated logistic regression, neural networks, and decision trees, allowing for flexibility in a variety of institutional contexts. After the first semester, the EDS’s accuracy ranged from 79 to 85%, and by the fourth semester, it had reached 95%. The findings demonstrated that the predictive power of performance data rapidly outpaces that of demographic variables. This study demonstrated how ensemble-based early warning systems can incorporate regularly gathered university data into dropout prediction frameworks that are dependable, affordable, and broadly applicable.
Jokhan et al. (2019) examined a proprietary EWS that was incorporated into Moodle at the University of the South Pacific in order to enhance student performance and engagement. The authors used multiple linear regression to account for 60.8% of performance variance while tracking variables like weekly logins and activity completion rates. Student activity significantly increased after the system was implemented, and surveys showed that more than 90% of respondents were satisfied with the feedback process. The results show how early feedback loops promote positive student behavior and learning outcomes, indicating that behavioral analytics can successfully improve motivation and performance in blended learning environments.
Using information from 165,715 students, Lee and Chung created a comprehensive machine learning-based early warning system to forecast possible high school dropouts in South Korea (Lee and Chung, 2019). To address the severe class imbalance, they employed ensemble classifiers like Random Forest and Boosted decision trees along with the Synthetic Minority Oversampling Technique (SMOTE) oversampling. Based on evaluation using precision-recall curves and Receiver Operating Characteristic (ROC), the boosted decision tree with SMOTE performed the best. The study demonstrated how national-level data in conjunction with ensemble learning can improve educational policy and proactive dropout prevention, and it emphasized the significance of striking a balance between recall and precision when identifying at-risk students.
In recent years, a growing body of research from 2023 to 2025 has demonstrated that advances in ensemble learning and explainable AI extend far beyond educational contexts, offering methodological insights that are highly transferable to student-risk prediction. For instance, Fonda et al. proposed a stacking ensemble framework for stress-level detection in higher education, highlighting how multi-model fusion enhances robustness in behavioral prediction (Fonda et al., 2024). Similarly, Hananto and Srinivasan examined ensemble-based predictive analytics in digital marketing and social-behavioral modeling, respectively, demonstrating the versatility of modern ensemble architectures (Hananto and Srinivasan, 2024). Prasetio and Purbo used explainable classifiers to identify blockchain node patterns, both illustrating how XAI can provide transparent, domain-agnostic decision support (Prasetio and Purbo, 2025). Although these works operate outside the academic-performance domain, their methodological contributions reflect broader advances in explainable and ensemble learning, thereby informing the technical foundations of modern educational early warning systems.
Swamy et al. (2022) contrasted the five most popular explainability techniques: Contrastive Explanation Method (CEM), Diverse Counterfactual Explanations (DiCE), PermutationSHAP, KernelSHAP, and LIME. Deep learning models that predicted success in Massive Open Online Courses (MOOCs) were trained using these techniques (Swamy et al., 2022). They found significant disagreement among the explainers regarding feature importance using engagement and behavioral data, with the explainer-introduced variation outweighing the variation resulting from course differences. This result brought up a crucial warning: the explainer selection has a greater impact on interpretation than the predictive model itself. Their research highlighted the necessity of methodological consistency and rigor in order to guarantee fair, reliable, and stable insights when utilizing XAI tools in educational settings.
In addition to the above, a recent study by Tamsir et al. (2025) applied an AdaBoost model together with SHAP explanations to detect depression among university students. Although their work shares the methodological combination of boosting and SHAP, its objective and data context differ substantially from educational risk prediction. Their clinical-focused formulation does not address course-level academic performance, but it highlights the growing adoption of SHAP-based interpretations across diverse learning-related domains.
Krüger et al. (2023) addressed Brazil’s school dropout issue by creating an enriched dataset from 19 schools and using machine learning models that explain the root causes of dropout in addition to predicting it. Their models produced remarkable results, such as 89% Area Under the Precision–Recall Curve (AUC-PR), 95% precision, 93% recall, and 97% Kolmogorov–Smirnov (KS) values. The framework offered comprehensible explanations that exposed difficulties unique to each stage, such as the greater difficulty of predicting dropout in preschool as opposed to secondary school. The study showed how important it is to support data-driven decision-making in education by fusing robust predictive performance with actionable explainability.
Realinho et al. (2022) developed a multi-source dataset that supports early dropout detection by combining macroeconomic indicators, national admissions data, and university administrative records. The dataset, which included 35 features and 4,424 records, allowed for multi-class classification such as graduate, enrolled, and dropout (Realinho et al., 2022). Because of its extensive reach, educational institutions can investigate the academic and socioeconomic factors that contribute to dropout rates and develop strong predictive models. This contribution offered a fundamental resource for benchmarking machine learning techniques in educational data mining and developing data-driven student support systems.
Psyridou et al. (2024) carried out a long-term study that forecasted upper secondary school dropout years in advance. They assessed 311 features that included academic, cognitive, behavioral, and family-related variables while following roughly 2,000 students from kindergarten through Grade 9. AUCs of 0.65 (Grade 9) and 0.61 (Grade 6) were attained by machine learning models, demonstrating the ability of long-term educational data to detect risk trajectories early. In order to design preventive interventions, the study emphasizes the predictive value of early developmental indicators as well as the policy potential of lifelong educational data.
In order to predict higher education dropouts, Villar and Andrade compared a number of supervised learning algorithms, using SMOTE to address extreme class imbalance and Optuna for hyperparameter optimization (Villar and de Andrade, 2024). Out of all the models tested, LightGBM and CatBoost had the best accuracy and F1-scores. By employing SHAP values to determine the most important features, they were able to close the gap between explainability and predictive power. Their research offered an empirically supported standard for choosing effective algorithms without sacrificing explainability, which is an essential consideration when making decisions about education.
Waheed et al. (2020) investigated using clickstream data from virtual learning environments to predict at-risk students using deep learning. They trained a deep neural network that outperformed logistic regression and SVM baselines with an accuracy of 84–93% by creating behavioral and assessment-related features. Results were significantly enhanced by the addition of historical and evaluation data, and students who reviewed earlier lectures performed better. The study demonstrated how deep neural architectures can help sustainably informed educational strategies and improve early detection.
Liu et al. (2025) introduced EASE-Predict, an ensemble framework that combines SHAP-based explainability with voting and stacking to integrate multiple classifiers. The model, which was trained using data from 4,424 students, had strong AUCs and an accuracy of 77.4% across three outcome categories (Graduate, Enrolled, and Dropout). Scholarships, tuition payment status, and second-semester grades were the main predictors, according to SHAP analysis. An efficient and reliable basis for institutional decision-making and early intervention systems is provided by this combination of group learning and open interpretation.
Rebelo Marcolino et al. (2025) Using Moodle log data, a CatBoost-based framework was improved with NSGA-II optimization and ADASYN resampling to forecast student failure and dropout. After examining 567 course instances, their unified all-weeks model demonstrated strong recall for at-risk learners and average F1-scores of approximately 0–8. Course progress, inactivity streaks, and access frequency were important predictors. The study showed how to combine engagement analytics and optimization to create flexible, weekly monitoring systems that allow for prompt academic interventions.
Even though explainable AI and ensemble learning have advanced quickly in terms of forecasting student performance, many of the current approaches still have significant drawbacks. Most frameworks either provide only a limited amount of transparency regarding the methodology used to derive their predictions, or they have trouble scaling effectively across larger or more diverse datasets. Therefore, there is still a great need for an integrated strategy that can balance true explainability with high predictive accuracy. A unified framework that directly integrates explainability into strong predictive architectures would be a major step toward reliable and useful AI in education, all the while preserving stability and adaptability across various educational contexts.
Despite these substantial advancements, several critical limitations remain unaddressed in the existing body of research. First, although prior studies have explored the utility of boosting algorithms or SHAP-based explanations, they typically treat these components as separate modules, either employing AdaBoost without integrated interpretability or using SHAP only as a post-hoc explanatory layer without examining its interaction with the underlying ensemble process. Second, the majority of explainable frameworks still sacrifice either predictive accuracy or computational stability when applied to heterogeneous, course-level datasets, which limits their practical deployment in educational settings. Third, although recent works from 2023 to 2025 have shown progress in ensemble learning and explainability across domains such as stress prediction and blockchain analytics, these methodological advances have not yet been adapted to the problem of academic risk prediction in a way that jointly optimizes transparency, robustness, and pedagogical usefulness.
As a result, a clear methodological gap persists: there is still no unified framework that integrates boosting and SHAP explanations within a stable and coherent architecture specifically designed for the early identification of academically at-risk students. The reviewed literature yields three key findings that impact the motivation behind Ex-ADA:
1. Boosting and ensemble models consistently improve performance on diverse and unbalanced educational datasets, improving generalization and early detection of learners at-risk.
2. Explainable AI tools, particularly SHAP and related attribution techniques, enable educators to use transparent, locally accurate explanations for customized interventions.
3. Few studies, nevertheless, have closely incorporated the SHAP-based explanation into the actual boosting procedure. The majority of previous studies either (a) give post-hoc explanations to black-box models without evaluating their stability or (b) put explainability ahead of predictive accuracy and flexibility.
3 The proposed methodology
The methodological framework used to develop the suggested predictive model is described in this section. Establishing a rigorous and organized analytical pipeline that can manage real-world educational datasets with incomplete data, outliers, and class imbalance while maintaining explainability and reproducibility is the main goal of this methodology. There are seven steps in the research methodology. In order to guarantee data quality and analytical preparedness, it starts with data importation and preprocessing. To ensure a thorough and objective assessment, the data are then divided into training and testing subsets using a stratified cross-validation technique.
After training and evaluating five supervised learning algorithms, a feature selection process is used to improve efficiency and explainability. A set of established metrics is used to assess the performance of the best-performing model after it has been retrained using the chosen features. Lastly, SHAP is used to conduct explainability analysis, which offers both local and global interpretive insights into the model’s decision-making process. Figure 1 shows a schematic overview of this methodological workflow.

Figure 1. The proposed methodology.
3.1 Dataset description
This subsection describes the dataset used to analyze student performance in the “Fundamentals of Programming” course at the University of Plovdiv “Paisii Hilendarski.” It comprises records for 642 students from the Faculty of Physics and Technology, enrolled in the study programs “Information and Computer Engineering,” “Telecommunications and Information Systems,” and “Technologies in Telecommunications.”
The “Fundamentals of Programming” course combines a traditional in-person format (45 h of lectures and 30 h of exercises) with a supporting online course developed on the Moodle platform to assist students with self-study. The online course is structured into 12 modules, covering key topics from basic programming concepts to advanced topics (Module 1. Programming languages and programs, Module 2. Programming Languages and their implementation, Module 3. Data Abstractions, Module 4. Data processing. Elementary processing, Module 4. Data processing. Elementary processing, Module 5. Structured control abstractions, Module 6. Structural data abstractions, Modules 7. Pointers, dynamic variables, references, Modules 8. Data processing by grouping. Subprogrammes, Modules 9. Recursion in programming, Module 10. Basic algorithms with arrays, Module 11. Structural data abstractions. Sequences (strings), Module 12. Structural Data Abstractions. Structure). Each module, starting from the third, provides theoretical material, example programming code, exercise tasks (with solutions), and homework assignments. The course assessment includes two midterm exams and a final exam.
Data for this study were collected from three distinct data sources and subsequently merged into a single comprehensive dataset:
Online Activity Data: Student engagement with the Moodle course was tracked automatically. This includes the number of views for each type of learning material (lectures, source code, exercises) and the number of submitted homework assignments per module (32,820 records).
Academic Performance Data: The final grades and midterm exam results (theoretical and practical) were retrieved from the university’s student information system (1926 records).
Attendance Data: Student attendance for the in-person classes was manually recorded (19,260 records).
Data from these three sources were merged into a single dataset, resulting in a comprehensive collection of student information and performance metrics. All personal identifiers were anonymized to comply with the European Union’s General Data Protection Regulation (GDPR) and ensure student privacy. The original students’ faculty numbers were replaced with randomly generated unique identifiers. The final dataset contains 642 student records with 50 attributes, covering student demographics, online learning activity, exam results, and attendance. A detailed list of all attributes has been moved to Appendix B and is now provided as Table A1.
This dataset provides a comprehensive and multifaceted depiction of students’ academic engagement, learning behavior, and performance results. Because of its structure, it is possible to investigate intricate connections between online learning activities, attendance, assessment outcomes, and final achievement. This makes it a suitable basis for developing predictive models of student performance.
3.2 Data preprocessing
Since the accuracy, stability, and explainability of the predictive models are directly impacted by the quality of the input data, data preprocessing is an essential part of the suggested methodology. First, imputation techniques intended to reduce information loss were used to methodically address missing values. Parallel to this, zero-variance features were found and eliminated because they might introduce noise and have no discriminatory power. Second, the Interquartile Range (IQR) method was used to identify and remove outliers. By identifying values that fall outside of the dataset’s anticipated range of variability, this method lessens the possibility that they will negatively impact model training and evaluation. The IQR was defined as follows after the first quartile (Q₁) and third quartile (Q₃) for each numerical feature were calculated. The IQR and the outlier detection criteria used in this study are formally defined in Equations 1,2.
If a data point met either of the following criteria, it was deemed an outlier.
The dataset was then cleansed of these identified outliers. Figure 2 shows the presence and extent of extreme values across multiple modules by visualizing the distribution of features with more than 50 detected outliers. The IQR-based analysis revealed that the number of outliers varied greatly between modules, with test-related components having the highest counts. The table summarizing the outlier frequencies for each module has been moved to Appendix B and is now provided as Table A2.

Figure 2. Boxplot of features with a high number of outliers, illustrating the spread and presence of extreme values across multiple variables.
The “Test Programme” modules, particularly Modules 7, 11, and 12, had the highest concentration of outliers, as indicated by Table A2, suggesting that these tests were more variable and subject to performance swings. However, no outliers were found in the attendance records or homework-related modules, indicating a more uniform distribution of data in those areas.
Third, a robust scaling procedure was used to normalize the data while preserving robustness against outliers. This approach ensures stable scaling even when extreme values are present because it depends on the median and interquartile range rather than the mean and standard deviation. Fourth, to find groups of highly correlated features, correlation filtering was used in conjunction with hierarchical clustering and Spearman’s rank correlation coefficient. By identifying redundant variables, this process made it possible to either eliminate them or combine them into representative clusters. Such filtering improves explainability, increases model stability, and lessens multicollinearity. Figure A1, presented in the Appendix A, displays a clustered heatmap that shows the pairwise correlations and the underlying similarity structure among features following zero-variance removal. Figure A1 displays a clustered heatmap that shows the pairwise correlations and the underlying similarity structure among features, visualizing the correlation structure of the educational features following zero-variance removal.
Lastly, the SMOTE was used to address the issue of class imbalance. By creating artificial instances of the minority class, this technique successfully balances the distribution of classes and enhances the model’s ability to generalize across classes.
3.3 K-fold cross-validation
The primary criterion for identifying students at academic risk was the final course grade, which was used to construct the target variable for classification. By setting a threshold of 3 on the final grade, a binary variable called “At_Risk” was produced. Students who received a grade of less than 3 were classified as at-risk (class 1), while those who received a grade of 3 or higher were classified as not at-risk (class 0). A dataset with 283 at-risk students (class 1) and 359 non-at-risk students (class 0) was produced as a result of this process.
Five-fold stratified cross-validation was used to guarantee a thorough and objective assessment of model performance. Five folds were created from the dataset, each maintaining the initial ratio of students who were at-risk and those who were not. In order to ensure that every student record contributed to both training and evaluation, the process was repeated five times, using four folds for training and the remaining fold for testing. This ensured that the results were dependable and broadly applicable. Figure 3 shows how the dataset is systematically separated into training and testing subsets, with each fold acting as validation in turn. It also presents the general structure of the data splitting and the five-fold stratified cross-validation procedure used in this study.

Figure 3. Schematic overview of the five-fold stratified cross-validation setup for the Paisii Hilendarski dataset.
For imbalanced datasets, this stratified approach is especially beneficial because it reduces sampling bias and yields a more accurate estimate of the model’s generalization performance. Additionally, it reduces the possibility of overfitting by testing the model on several data partitions.
3.4 Classification models
Five supervised classification algorithms were used in order to capture a wide range of learning behaviors and complexity. The K-Nearest Neighbors (KNN) algorithm was used as a non-parametric technique that provides a straightforward but efficient baseline by classifying instances according to the majority label of their nearest neighbors. Rule-based decision boundaries were provided by the decision tree algorithm, which is renowned for its explainability and capacity to manage both numerical and categorical variables. In order to improve predictive accuracy, the AdaBoost algorithm was presented as an ensemble learning technique that iteratively combines weak learners to create a strong classifier. A probabilistic classifier that relies on conditional independence between features, Naive Bayes (NB), was chosen due to its high performance in high-dimensional spaces and computational efficiency. Lastly, the performance of a more sophisticated and nonlinear model that could identify complex patterns in the data was investigated using the Multilayer Perceptron (MLP) neural network. To ensure fair and comparable evaluation, all models were trained using the 5-fold cross-validation framework, and their performance was evaluated on the corresponding test folds.
3.5 Feature selection and model re-evaluation
To increase explainability, decrease dimensionality, and boost computational efficiency, a feature selection process was carried out after the initial training phase. Individual features’ importance was calculated using a random forest classifier, and those that contributed to the top 80% of the cumulative importance were kept for further examination. Only the chosen subset of features was used to retrain the top-performing classification model found during the first evaluation. Predictive performance was maintained while model complexity was decreased through this refinement step. After feature selection, ROC analysis was also performed to assess the model’s capacity for discrimination.
3.6 Evaluation metrics
In this study, four performance metrics were used to give a thorough and multifaceted evaluation of the classification models. The overall %age of accurate predictions across all classes was measured using accuracy. In imbalanced classification problems, the AUC metric was chosen as a reliable measure of the model’s discriminative power. A balanced indicator of model performance in terms of false positives and false negatives was provided by the F1-score, which is the harmonic mean of precision and recall. The %age of accurately predicted positive cases among all predicted positives was assessed using precision. To generate consistent and broadly applicable performance estimates, all metrics were calculated for every cross-validation fold and then averaged.
3.7 Explainability of the proposed model
A model Explainability framework was put into place in the last phase to improve accountability, transparency, and confidence in the forecasted results. Because of its solid theoretical underpinnings in cooperative game theory and its capacity to deliver consistent, additive feature attributions, SHAP was chosen as the main explainability technique. Both local and global explanations were derived using SHAP analysis. SHAP summary and bar plots, which rank features according to their overall contribution to the model’s output, were used to evaluate the global feature importance. Using SHAP waterfall plots to break down individual predictions into additive feature contributions and SHAP dependence plots to examine interactions between particular features, local explainability was investigated.
This explainability framework offers a rigorous method for comprehending the model’s internal logic, empowering stakeholders to responsibly and intelligently interpret, validate, and possibly act upon model predictions.
4 Evaluation
This section presents the experimental evaluation of the proposed Ex-ADA framework, emphasizing its explainability, predictive performance, and comparative effectiveness against baseline models. To ensure scalability, computational efficiency, and reproducibility, all experiments were conducted in the Google Colab environment using standard Python-based machine learning libraries. The evaluation process was carefully designed to verify the framework’s accuracy and interpretability in identifying at-risk students within the educational dataset. By combining ensemble learning with model-agnostic explainability, Ex-ADA seeks to provide both reliable quantitative performance and meaningful qualitative insight which are essential components of trustworthy educational AI systems.
4.1 Evaluation metrics
The effectiveness of the model was evaluated in a number of dimensions using the evaluation metrics. Accuracy is a broad indicator of overall performance that quantifies the %age of accurate predictions. However, accuracy alone is insufficient because of the class imbalance present in educational data, where the number of successful students frequently outnumbers those who are at-risk. To capture the subtleties of classification reliability, extra evaluation metrics were added. The precision metric measures the proportion of students who were accurately identified as being at-risk. The F1-score, which is their harmonic mean, offers a fair assessment that penalizes both false positives and false negatives.
As a last metric, AUC was calculated to assess the discriminative power of the model across thresholds. Stronger class separation and a better balance between sensitivity and specificity are indicated by higher AUC values. To minimize evaluation bias and guarantee statistical stability, each metric was averaged across the stratified cross-validation’s five folds. This thorough multi-metric approach highlights both predictive strength and consistency, offering a comprehensive picture of model performance. Equations 3–6 below list the formulas used to determine each evaluation measure.
4.2 Results and analysis
The experimental results show clear differences in the performance of the evaluated classifiers. Five algorithms including K Nearest Neighbors, Decision Tree, AdaBoost, Naïve Bayes, and Multilayer Perceptron were assessed for identifying at-risk students, as illustrated in Figure 4. AdaBoost achieved the highest AUC value of 91.53% in the ROC analysis, indicating strong discriminatory capability between at-risk and non at-risk students. KNN followed with an AUC of 85.09%, demonstrating solid predictive ability although with reduced robustness to noisy samples.

Figure 4. ROC curves of classifiers.
The Decision Tree reached an AUC of 87.38% with competitive accuracy and good interpretability, though it showed sensitivity to small variations in the training set. Naïve Bayes produced an accuracy of 73.20% but had limited discriminative power due to its independence assumptions. The MLP model obtained an AUC of 86.39%, reflecting good generalization but some instability likely caused by initialization and data scaling.
Across most evaluation metrics, AdaBoost again achieved the strongest performance with a test accuracy of 82.72%, precision of 80.56%, and F1 score of 80.37%. KNN trailed closely with slightly lower precision of 71.72%, while the Decision Tree classifier demonstrated balanced performance with precision of 76.34% and accuracy of 81.62%. Although MLP achieved relatively high accuracy of 80.06% and precision of 76.94%, its generalization was affected by high training variance. Naïve Bayes showed the weakest overall performance with an accuracy of 73.20% and precision of 66.19%. These findings confirm the effectiveness of AdaBoost’s adaptive reweighting mechanism, enhanced by SMOTE based oversampling and the preprocessing pipeline.
AdaBoost’s high AUC value of 91.53% further reflects its balanced trade off between sensitivity and specificity. For this reason, it was selected as the central classifier in the proposed Ex ADA framework to support explainability and comparative analysis.
To ensure statistical robustness, standard deviations across the five cross validation folds were calculated. AdaBoost achieved an accuracy of 84.12% ± 1.34 and an AUC of 92.31% ± 0.97, indicating low variance and high stability. Other classifiers also showed consistent variance patterns, confirming that the results are not influenced by sampling fluctuations. Including these dispersion measures increases the credibility of the reported outcomes. The comparative performance of classifiers using 5-fold cross-validation is presented in Table 1.

Table 1. Comparative performance of classifiers using 5-fold cross-validation.
As shown in Table 1, the AdaBoost model is the most reliable and interpretable classifier within the Ex ADA framework, outperforming all competing algorithms across multiple evaluation metrics.
4.3 Explainability of the proposed ex-ADA model
SHAP analysis allows the Ex-ADA framework to combine explainable reasoning with predictive accuracy. The SHAP-based global and local explanations in Figures 5–11 provide a clear understanding of how the AdaBoost model makes decisions. According to the global SHAP bar plot (Figure 5), Attendance (0.0409) and MidTerm2-Practice (0.0390) have the highest mean SHAP values and serve as the strongest indicators of student performance.
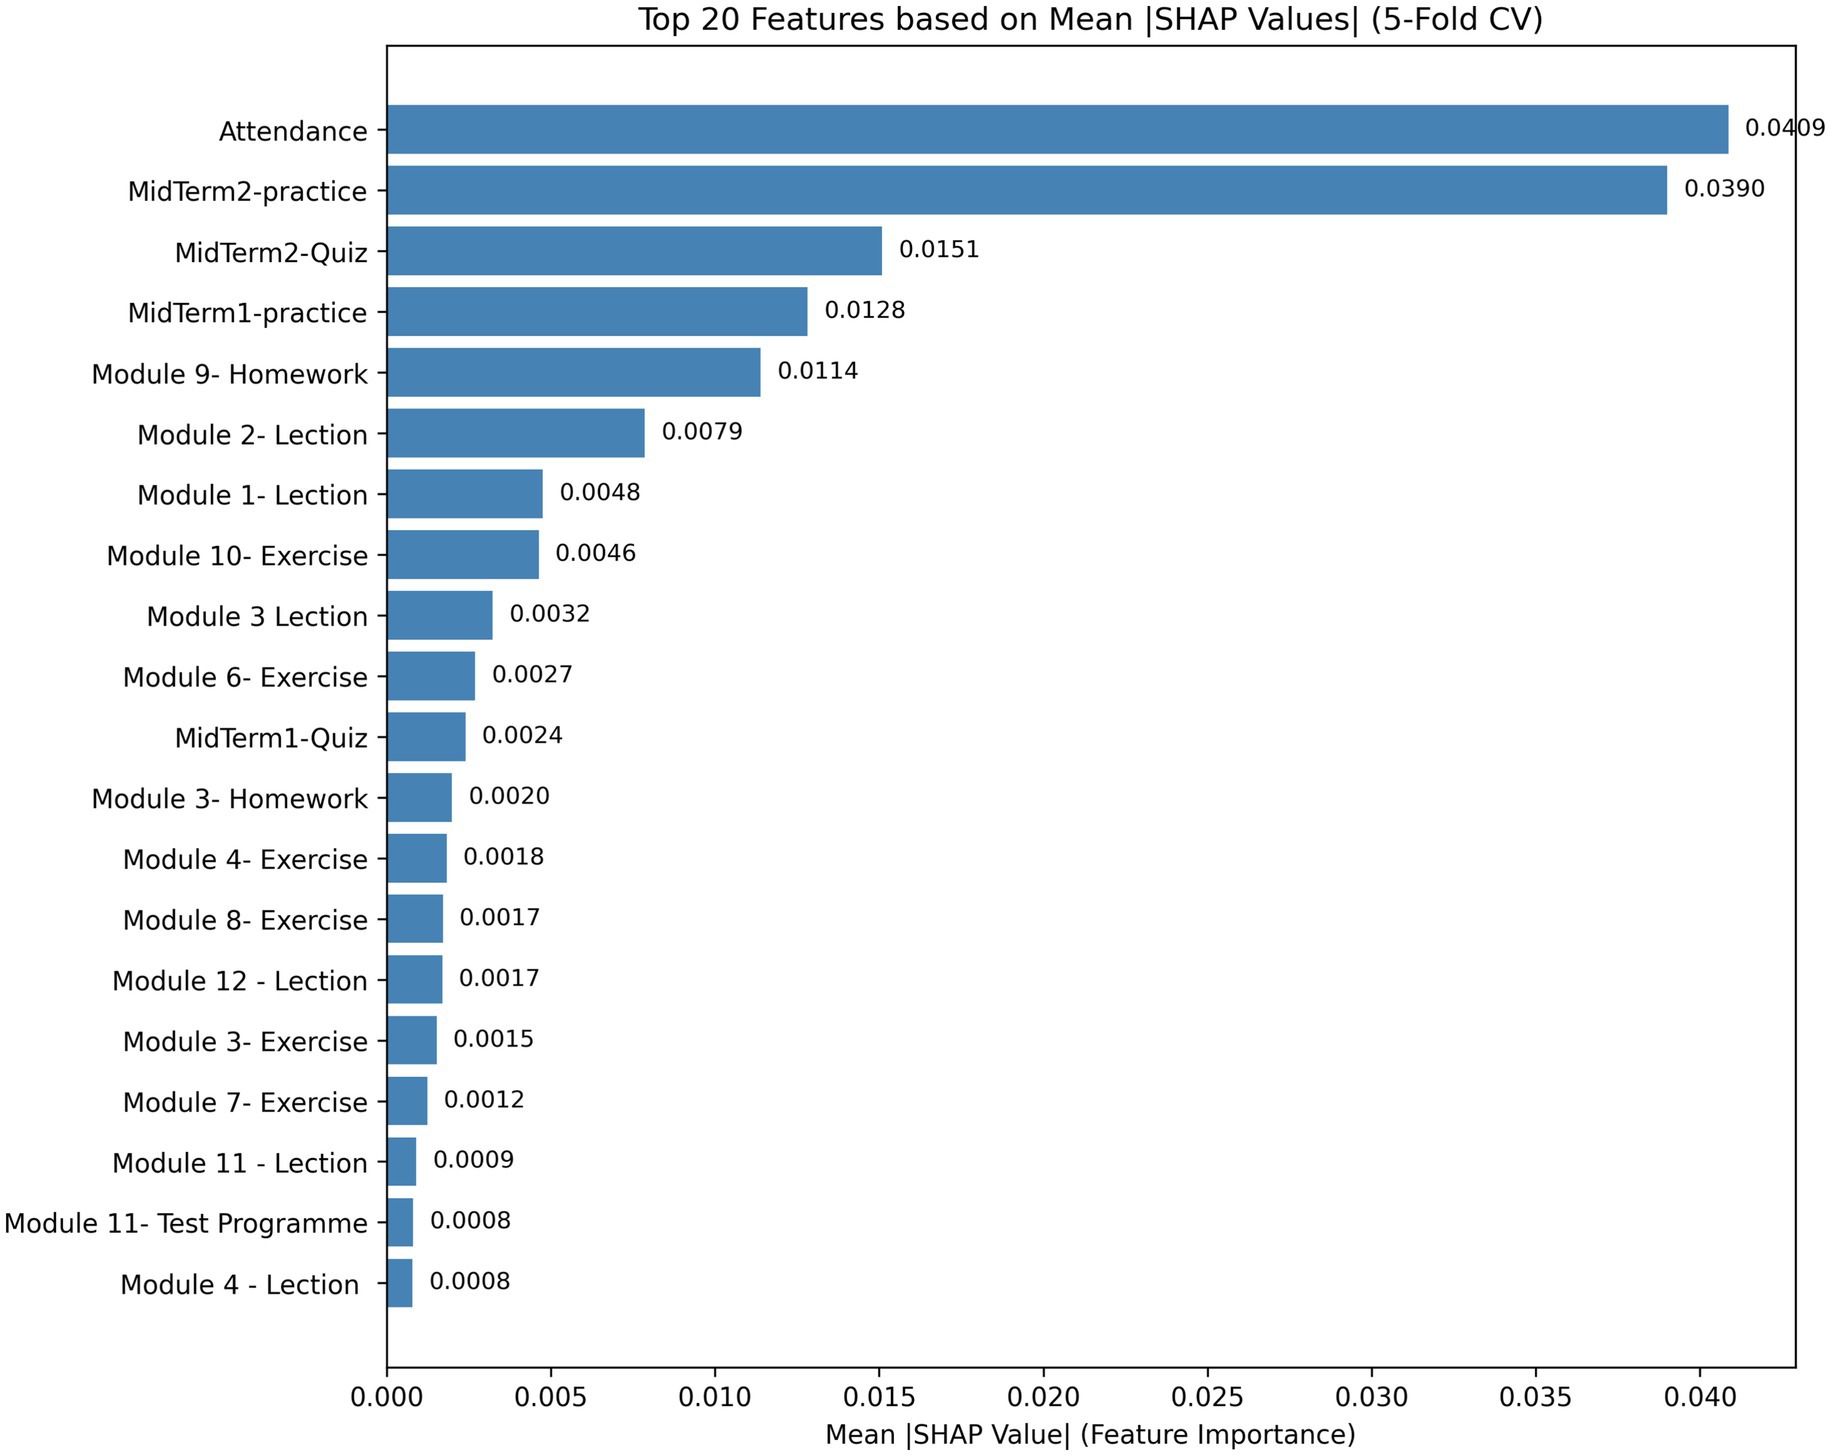
Figure 5. Top 20 features ranked by global SHAP importance.

Figure 6. SHAP dependence plot for MidTerm1-Practice.

Figure 7. SHAP dependence plot for MidTerm2-Practice.

Figure 8. SHAP interaction plot for MidTerm1-Practice and Attendance.

Figure 9. SHAP waterfall plot for an individual prediction.

Figure 10. SHAP decision plot showing cumulative feature effects.

Figure 11. SHAP summary plot showing global feature importance.
The strong influence of MidTerm2-Practice is pedagogically meaningful because the practical activities in the second midterm require cumulative understanding and hands-on skills. Low engagement in these activities often reflects fragmented knowledge, weak problem-solving skills, or declining study habits, all of which correlate with academic risk. Conversely, consistent participation indicates stable learning behaviors and improved mastery, offering educators a clear behavioral signal for early intervention strategies such as targeted tutoring or structured practice sessions. This interpretation is aligned with explainability perspectives that emphasize meaningful human-centered behavioral understanding in model outputs (Coroama and Groza, 2022).
Other features, including Module 9-Homework (0.0114), MidTerm2-Quiz (0.0151), and MidTerm1-Practice (0.0128), also significantly influence predictions, reinforcing the importance of attendance and formative assessments in academic outcomes.
The SHAP dependence plots (Figures 6, 7) illustrate how changes in specific behaviors affect predictions at the local level. For MidTerm1-Practice (Figure 6), low practice scores (below 0.2) produce positive SHAP values (approximately +0.010 to +0.015), indicating increased risk. Higher scores (above 0.5) produce negative SHAP values (approximately −0.015 to −0.020) and reduce risk. The color gradient representing MidTerm2-Quiz performance shows that higher quiz scores slightly mitigate the negative effects of low practical engagement. The nonlinear pattern emphasizes the joint importance of practical and quiz participation in predicting risk.
For MidTerm2-Practice (Figure 7), SHAP values are largely positive (up to +0.04) when practice scores are near 0, indicating high risk. As scores exceed 1.0, SHAP values become negative (approximately −0.04 to −0.06), indicating lower dropout likelihood. The color scale representing Module 5-Exercise shows minimal interaction, confirming that MidTerm2-Practice is an independent and dominant predictor. These results provide educators with actionable insights, highlighting consistent practical performance as an early indicator of engagement and reduced dropout risk.
The SHAP interaction plot (Figure 8) further shows how MidTerm1-Practice and Attendance interact. Students with low attendance and low practical engagement have higher SHAP values (up to +0.015), indicating high risk. Students with high attendance consistently exhibit negative SHAP values, showing that attendance can offset moderate weaknesses in practical performance. This interaction highlights the combined importance of consistent attendance and hands-on engagement in academic persistence.
Figure 9 presents the SHAP waterfall plot for a single prediction. Attendance, Module 9-Homework, and MidTerm2-Practice contribute strongly to reducing the risk, with MidTerm2-Practice showing a notable negative SHAP value (−0.06). Some features such as Module 4-Exercise (+0.01) and MidTerm2-Quiz (+0.02) slightly increase risk, reflecting inconsistent engagement patterns. These contributions shift the model output from the baseline prediction to the final prediction , illustrating how individual behaviors shape model decisions.
The SHAP decision plot in Figure 10 shows the sequential impact of features on a single student’s prediction. The strongest negative contribution comes from MidTerm2-Practice (value = 1.333), indicating a reduced likelihood of being at-risk. Attendance (0.171) and MidTerm1-Practice (92.30%) also help lower the prediction score. Small upward adjustments from Module 1-Lecture and MidTerm2-Quiz suggest localized uncertainty but do not outweigh the protective effects of practice engagement. The overall trajectory decreases from 0.48 to approximately 0.36, improving interpretability by revealing how behavioral evidence drives the decision process.
The global SHAP summary plot (Figure 11) shows the distribution and direction of feature effects for all students. Attendance, MidTerm2-Practice, and MidTerm2-Quiz are the most influential predictors. High attendance and consistent participation in midterm practice produce negative SHAP values and lower risk. Higher quiz scores, however, generally correspond to positive SHAP values, suggesting subtle behavioral patterns such as uneven study habits. Other features such as Module 9-Homework and MidTerm1-Practice also show moderately negative SHAP values, confirming the protective role of consistent coursework.
MidTerm2-Practice, MidTerm2-Quiz, and Attendance are the key factors influencing Ex-ADA’s predictions. Higher engagement in these behaviors is associated with negative SHAP values and lower academic risk, while lower engagement produces positive SHAP values, indicating higher risk. Other variables, such as homework completion and lecture participation, also contribute to predictions, demonstrating the model’s ability to capture complex learning behaviors. Extended SHAP visualizations connect feature interactions, individual-level reasoning, and global distributions, enhancing transparency and interpretability, and providing actionable insights for targeted interventions (Kadir et al., 2023). SHAP values computed across five cross-validation folds showed consistent rankings, and comparison with Random Forest permutation importance confirmed top predictors and methodological convergence, supporting both statistical stability and pedagogical trustworthiness.
4.4 Feature selection and comparative model evaluation
Building on the explainability insights from Figures 5–11, Random Forest feature importance analysis (Figure 12) identifies the most significant predictors, validating SHAP-based findings and guiding model optimization. The top 21 features, contributing to 80% of cumulative importance, highlight Attendance (0.1382) and MidTerm2-Practice (0.1645) as the strongest predictors, followed by MidTerm2-Quiz, MidTerm1-Practice, and MidTerm1-Quiz. This ranking aligns closely with SHAP results, confirming that regular attendance and consistent midterm practice are key behavioral indicators of academic achievement. Homework and exercise activities, particularly from Modules 6, 7, and 9, also contribute significantly, emphasizing the importance of ongoing formative assessment. Active engagement, including lecture participation and performance-oriented tasks, has higher predictive weight than passive learning.

Figure 12. Top 21 predictors contributing to 80% of cumulative importance in student performance.
Combined with SHAP-based analyses, Figure 12 illustrates that the model’s predictive power captures engagement patterns that teachers intuitively recognize as indicators of genuine learning commitment, confirming that Ex-ADA goes beyond statistical accuracy to provide interpretable, behavior-aware predictions.
Five classifiers such as KNN, Decision Tree, AdaBoost, Naive Bayes, and MLP were retrained and evaluated using five-fold cross-validation to assess feature influence, as summarized in Table 2. AdaBoost consistently outperformed other models, achieving an AUC of 92.31%, precision of 82.36%, F1 of 81.95%, and test accuracy of 84.12%. Its robust generalization and balanced handling of false positives and negatives make it particularly suitable for identifying at-risk students. Decision Tree and MLP performed reliably, while Naive Bayes lagged due to independence assumptions. In this feature-selection framework, AdaBoost preserves both explainability and robustness, demonstrating its suitability for educational data mining where transparency and actionable insights are critical. Attendance, midterm practice engagement, and homework consistency emerge as the primary behavioral predictors of academic success.

Table 2. Comparison of classifiers performance on selected features.
5 Limitations of the study
While the Ex-ADA framework demonstrates strong predictive performance and clear explainability, several limitations should be acknowledged to contextualize its generalizability. First, the dataset is derived from a single university course in Fundamentals of Programming, which may restrict the applicability of the model to other institutions or disciplines with different instructional practices and learner characteristics. Future studies using cross-disciplinary and multi-institutional datasets are essential to strengthen external validity.
Second, the model relies primarily on quantitative behavioral indicators such as attendance, midterm performance, and online activity logs. Although informative, these variables do not fully capture cognitive, motivational, or socioemotional dimensions that influence academic achievement. Integrating psychological self-reports, sentiment-based textual data, or affective indicators may provide a more comprehensive representation of student learning behavior.
Third, the explainability component is based on SHAP, which is a post-hoc method. While SHAP offers theoretically grounded interpretations of AdaBoost outputs, it cannot guarantee complete causal transparency. Future work could explore causal modeling approaches or inherently interpretable boosting variants to improve alignment between explanations and true decision mechanisms.
Fourth, similar to most ensemble methods, the computational complexity of Ex-ADA may increase with larger datasets. Although this was manageable in the current study, real-time deployment in institutional early-warning systems may require optimization through distributed or incremental learning.
Fifth, the study did not examine long-term model stability across multiple academic terms. Since learning behaviors change over time, periodic retraining and drift detection would help maintain both accuracy and interpretability.
Finally, ethical considerations must be emphasized. Student data inherently involve privacy-sensitive information, and predictive systems carry the risk of algorithmic bias. Ensuring anonymization, secure data handling, bias monitoring, and responsible use of predictions is essential to prevent unintended harm and to support fair and transparent decision-making.
These limitations outline key directions for future research aimed at improving the scalability, fairness, generalizability, and multidimensional modeling capabilities of Ex-ADA.
6 Conclusion and future work
This study introduced Ex-ADA, an explainable AdaBoost framework enhanced with SHAP to identify and analyze at-risk college students. By combining SHAP-based interpretability with the adaptive learning capacity of AdaBoost, the model effectively balances predictive accuracy and transparency. Ex-ADA achieved an AUC of 92.31%, outperforming traditional classifiers and demonstrating its capacity to capture the behavioral and academic patterns most associated with student performance. The SHAP analysis highlighted attendance, midterm practice engagement, and homework completion as primary indicators of academic success, offering instructors actionable insights into students’ learning behaviors.
Beyond improving prediction, Ex-ADA provides meaningful educational impact by supporting instructors in early intervention. The model’s clear explanations help advisors understand why a student is at-risk and guide timely strategies that promote retention and academic improvement. This positions Ex-ADA as a practical tool for human-centered, data-informed decision-making in higher education.
Future work will focus on expanding the framework’s scope and institutional relevance. Incorporating multimodal learning data, such as emotional or linguistic cues, may deepen the model’s understanding of student engagement. Developing real-time dashboards can further support continuous monitoring and early response in online and blended learning environments. Strengthening the model’s fairness through bias mitigation and exploring causal explainability will enhance its accountability. Finally, validating Ex-ADA across larger, diverse, and longitudinal datasets will be essential to ensure its robustness and applicability within institutional early-warning systems.
Data availability statement
The raw data supporting the conclusions of this article will be made available by the authors, without undue reservation.
Author contributions
EA: Formal analysis, Resources, Writing – original draft, Writing – review & editing. SG: Funding acquisition, Investigation, Project administration, Supervision, Writing – original draft, Writing – review & editing. AG: Writing – original draft, Writing – review & editing. JH: Conceptualization, Methodology, Resources, Software, Validation, Writing – original draft, Writing – review & editing. RD: Investigation, Writing – original draft, Writing – review & editing.
Funding
The author(s) declared that financial support was received for this work and/or its publication. This manuscript is financed by the European Union-NextGenerationEU, through the National Recovery and Resilience Plan of the Republic of Bulgaria, Project No. BG-RRP-2.004-0001-C01.
Conflict of interest
The author(s) declared that this work was conducted in the absence of any commercial or financial relationships that could be construed as a potential conflict of interest.
Generative AI statement
The author(s) declared that Generative AI was not used in the creation of this manuscript.
Any alternative text (alt text) provided alongside figures in this article has been generated by Frontiers with the support of artificial intelligence and reasonable efforts have been made to ensure accuracy, including review by the authors wherever possible. If you identify any issues, please contact us.
Publisher’s note
All claims expressed in this article are solely those of the authors and do not necessarily represent those of their affiliated organizations, or those of the publisher, the editors and the reviewers. Any product that may be evaluated in this article, or claim that may be made by its manufacturer, is not guaranteed or endorsed by the publisher.
Supplementary material
The Supplementary material for this article can be found online at: https://www.frontiersin.org/articles/10.3389/feduc.2025.1728070/full#supplementary-material
References
Adadi, A., and Berrada, M. (2018). Peeking inside the black-box: a survey on explainable artificial intelligence (XAI). IEEE Access 6, 52138–52160. doi: 10.1109/ACCESS.2018.2870052
Adnan, M., Habib, A., Ashraf, J., Mussadiq, S., Raza, A. A., Abid, M., et al. (2021). Predicting at-risk students at different percentages of course length for early intervention using machine learning models. IEEE Access 9, 7519–7539. doi: 10.1109/ACCESS.2021.3049446
Ahmed, S. A. (2025). Reimagining education in the coming decade: what AI reveals about what really matters. Front. Educ. 10:1699106. doi: 10.3389/feduc.2025.1699106
Albreiki, B., Zaki, N., and Alashwal, H. (2021). A systematic literature review of student' performance prediction using machine learning techniques. Educ. Sci. 11:552. doi: 10.3390/educsci11090552
Arrieta, A. B., Díaz-Rodríguez, N., Del Ser, J., Bennetot, A., Tabik, S., Barbado, A., et al. (2020). Explainable artificial intelligence (XAI): concepts, taxonomies, opportunities and challenges toward responsible AI. Inf. Fusion 58, 82–115. doi: 10.1016/j.inffus.2019.12.012
Azcona, D., Hsiao, I.-H., and Smeaton, A.F. (2019). Detecting students-at-risk in computer programming classes with learning analytics from students’ digital footprints. Berlin/Heidelberg, Germany: Springer.
Baneres, D., Rodríguez-Gonzalez, M. E., and Serra, M. (2019). An early feedback prediction system for learners at-risk within a first-year higher education course. IEEE Trans. Learn. Technol. 12, 249–263. doi: 10.1109/TLT.2019.2912167
Berens, J., Schneider, K., Gortz, S., Oster, S., and Burghoff, J. (2019). Early detection of students at risk--predicting student dropouts using administrative student data from German universities and machine learning methods. J. Educ. Data Min. 11, 1–41.
Bui, N. V. P. (2022). Explainable AI (XAI): Improving at-risk student prediction with theory-guided data science, K-means classification, and genetic programming. Ann Arbor, Michigan, USA: Sam Houston State University.
Cao, Y., Liu, Q., and Chen, H. (2023). Utilizing internet analysis technology to conduct data analysis of student attitude survey. Int. J. Inform. Inf. Syst. 6, 47–55. doi: 10.47738/ijiis.v6i2.146
Capstick, M. K., Harrell-Williams, L. M., Cockrum, C. D., and West, S. L. (2019). Exploring the effectiveness of academic coaching for academically at-risk college students. Innov. High. Educ. 44, 219–231. doi: 10.1007/s10755-019-9459-1
Chen, T., and Guestrin, C. 2016. "Xgboost: a scalable tree boosting system", in: Proceedings of the 22nd acm sigkdd international conference on knowledge discovery and data mining), 785–794.
Ciolacu, M., Tehrani, A.F., Binder, L., and Svasta, P.M. 2018. "Education 4.0-artificial intelligence assisted higher education: early recognition system with machine learning to support students' success", in 2018 IEEE 24th international symposium for design and Technology in Electronic Packaging (SIITME), IEEE, 23–30.
Coroama, L., and Groza, A. (2022). “Evaluation metrics in explainable artificial intelligence (XAI)” in International conference on advanced research in technologies, information, innovation and sustainability (Cham, Switzerland: Springer Nature), 401–413.
Das, A., and Rad, P. (2020). Opportunities and challenges in explainable artificial intelligence (XAI): a survey. [Epubh ahead of preprint]. doi: 10.48550/arXiv.2006.11371
Embarak, O. (2021). “Explainable artificial intelligence for services exchange in smart cities” in Explainable artificial intelligence for smart cities Eds. M. Lahby, U. Kose and A.K. Bhoi. (Boca Raton, Florida, USA: CRC Press), 13–30.
Embarak, O. H., and Hawarna, S. (2024). Automated AI-driven system for early detection of at-risk students. Procedia Comput. Sci. 231, 151–160. doi: 10.1016/j.procs.2023.12.187
Fonda, H., Irawan, Y., Melyanti, R., Wahyuni, R., and Muhaimin, A. (2024). A comprehensive stacking ensemble approach for stress level classification in higher education. J. Appl Data Sci 5, 1701–1714. doi: 10.47738/jads.v5i4.388
Freund, Y., and Schapire, R. E. (1997). A decision-theoretic generalization of on-line learning and an application to boosting. J. Comput. Syst. Sci. 55, 119–139. doi: 10.1006/jcss.1997.1504
Gunning, D. (2017). Explainable artificial intelligence (XAI). Defense advanced research projects agency (DARPA), Web 2, 1.
Habley, W. R., Bloom, J. L., and Robbins, S. (2012). Increasing persistence: Research-based strategies for college student success. San Francisco, CA, USA: John Wiley & Sons.
Hananto, A. R., and Srinivasan, B. (2024). Comparative analysis of ensemble learning techniques for purchase prediction in digital promotion through social network advertising. J. Digital Market Digit. Curr. 1, 125–143. doi: 10.47738/jdmdc.v1i2.7
Hassan, A. O., Jamal, I. M., Ahmed, S. D., and Abdullahi, A. U. (2025). Predicting student depression using machine learning: a comparative analysis of machine learning algorithms for early depression detection in students. AITU Sci. Res. J. 4, 28–35. doi: 10.63094/AITUSRJ.25.4.1.4
Jokhan, A., Sharma, B., and Singh, S. (2019). Early warning system as a predictor for student performance in higher education blended courses. Stud. High. Educ. 44, 1900–1911. doi: 10.1080/03075079.2018.1466872
Kadir, M.A., Mosavi, A., and Sonntag, D. (2023). "Evaluation metrics for xai: a review, taxonomy, and practical applications", In 2023 IEEE 27th international conference on intelligent engineering systems (INES): IEEE, Nairobi, Kenya, 000111–000124.
Karadeniz, A., Baneres, D., Rodríguez, M. E., and Guerrero-Roldán, A.-E. (2019). “Enhancing ICT personalized education through a learning intelligent system” in The online, open and flexible higher education conference, 142–147.
Ke, G., Meng, Q., Finley, T., Wang, T., Chen, W., Ma, W., et al. (2017). Lightgbm: a highly efficient gradient boosting decision tree. Adv. Neural Inf. Proces. Syst. 30, 1–9.
Khosa, J., and Olanipekun, A. (2025). Exploring the impact of mixed reality technology on anatomy education for medical students. Int. J. Res. Metaverse 2, 1–13. doi: 10.47738/ijrm.v2i1.18
Krüger, J. G. C., De Souza Britto, A. Jr., and Barddal, J. P. (2023). An explainable machine learning approach for student dropout prediction. Expert Syst. Appl. 233:120933. doi: 10.1016/j.eswa.2023.120933
Lee, S., and Chung, J. Y. (2019). The machine learning-based dropout early warning system for improving the performance of dropout prediction. Appl. Sci. 9:3093. doi: 10.3390/app9153093
Lin, C.-C., Huang, A. Y., and Lu, O. H. (2023). Artificial intelligence in intelligent tutoring systems toward sustainable education: a systematic review. Smart Learn. Environ. 10:41. doi: 10.1186/s40561-023-00260-y
Liu, Z., Zhou, X., and Liu, Y. (2025). Student dropout prediction using ensemble learning with SHAP-based explainable AI analysis. J. Soc. Syst. Policy Anal. 2, 111–132. doi: 10.62762/JSSPA.2025.321501
Lötsch, J., Kringel, D., and Ultsch, A. (2022). Explainable artificial intelligence (XAI) in biomedicine: making AI decisions trustworthy for physicians and patients. BioMedInformatics. 2, 1–17. doi: 10.3390/biomedinformatics2010001
Lundberg, S. M., and Lee, S.-I. (2025). A unified approach to interpreting model predictions. Adv. Neural Inf. Process. Syst. 30, 1–10.
Ma, Z., Zhang, T., Jiang, J., and Wang, L. (2025). Transformational leadership and future work readiness among Chinese vocational college students: AI literacy and career self-regulation as dual mediators. Front. Educ. 10:1664939. doi: 10.3389/feduc.2025.1664939
Minh, D., Wang, H. X., Li, Y. F., and Nguyen, T. N. (2022). Explainable artificial intelligence: a comprehensive review. Artif. Intell. Rev. 55, 3503–3568. doi: 10.1007/s10462-021-10088-y
Prasetio, A. B., and Purbo, O. W. (2025). Blockchain node classification predicting node behavior using machine learning. J. Curr. Res. Blockchain 2, 190–204. doi: 10.47738/jcrb.v2i3.42
Prokhorenkova, L., Gusev, G., Vorobev, A., Dorogush, A. V., and Gulin, A. (2018). CatBoost: unbiased boosting with categorical features. Adv. Neural Inf. Process. Syst. 31, 1–11.
Psyridou, M., Prezja, F., Torppa, M., Lerkkanen, M.-K., Poikkeus, A.-M., and Vasalampi, K. (2024). Machine learning predicts upper secondary education dropout as early as the end of primary school. Sci. Rep. 14:12956. doi: 10.1038/s41598-024-63629-0,
Rahma, F., and Ulfah, S. Z. (2025). Clustering students based on academic performance and social factors: an unsupervised learning approach to identify student patterns. Int. J. Appl. Inf. Manag. 5, 139–154. doi: 10.47738/ijaim.v5i3.109
Realinho, V., Machado, J., Baptista, L., and Martins, M. V. (2022). Predicting student dropout and academic success. Data 7:146. doi: 10.3390/data7110146
Rebelo Marcolino, M., Reis Porto, T., Thompsen Primo, T., Targino, R., Ramos, V., Marques Queiroga, E., et al. (2025). Student dropout prediction through machine learning optimization: insights from moodle log data. Sci. Rep. 15, 1–16. doi: 10.1038/s41598-025-93918-1,
Ribeiro, M.T., Singh, S., and Guestrin, C. (2016). Why should i trust you? explaining the predictions of any classifier, in Proceedings of the 22nd ACM SIGKDD international conference on knowledge discovery and data mining, 1135–1144.
Rico-Juan, J. R., Sánchez-Cartagena, V. M., Valero-Mas, J. J., and Gallego, A. J. (2023). Identifying student profiles within online judge systems using explainable artificial intelligence. IEEE Trans. Learn. Technol. 16, 955–969. doi: 10.1109/TLT.2023.3239110
Seidel, E., and Kutieleh, S. (2017). Using predictive analytics to target and improve first year student attrition. Aust. J. Educ. 61, 200–218. doi: 10.1177/0004944117712310
Swamy, V., Radmehr, B., Krco, N., Marras, M., and Käser, T. (2022). Evaluating the explainers: black-box explainable machine learning for student success prediction in MOOCs. [Epub ahead of print]. doi: 10.48550/arXiv.2207.00551
Tamsir, I.S., Putrada, A.G., and Wicaksono, R.L. (2025). "SHAP for explainable AI in using AdaBoost-based depression detection on academic students", in 2025 international conference on data science and its applications (ICoDSA): IEEE, 795–800.
Villano, R., Harrison, S., Lynch, G., and Chen, G. (2018). Linking early alert systems and student retention: a survival analysis approach. High. Educ. 76, 903–920. doi: 10.1007/s10734-018-0249-y
Villar, A., and De Andrade, C. R. V. (2024). Supervised machine learning algorithms for predicting student dropout and academic success: a comparative study. Discov. Artif. Intell. 4:2. doi: 10.1007/s44163-023-00079-z
Waheed, H., Hassan, S.-U., Aljohani, N. R., Hardman, J., Alelyani, S., and Nawaz, R. (2020). Predicting academic performance of students from VLE big data using deep learning models. Comput. Hum. Behav. 104:106189. doi: 10.1016/j.chb.2019.106189
Keywords: at-risk student prediction, student performance prediction, educational datamining, explainable artificial intelligence, AdaBoost, Shapley additive explanations
Citation: Arslan E, Gaftandzhieva S, Gorgani Firouzjaei A, Hassannataj Joloudari J and Doneva R (2026) Ex-ADA: a SHAP-based explainable AdaBoost framework for predicting at-risk students. Front. Educ. 10:1728070. doi: 10.3389/feduc.2025.1728070
Edited by:
Henry David Mason, Tshwane University of Technology, South AfricaReviewed by:
Kusuma Ayu Laksitowening, Telkom University, IndonesiaTri Wahyuningsih, Satya Wacana Christian University, Indonesia
Copyright © 2026 Arslan, Gaftandzhieva, Gorgani Firouzjaei, Hassannataj Joloudari and Doneva. This is an open-access article distributed under the terms of the Creative Commons Attribution License (CC BY). The use, distribution or reproduction in other forums is permitted, provided the original author(s) and the copyright owner(s) are credited and that the original publication in this journal is cited, in accordance with accepted academic practice. No use, distribution or reproduction is permitted which does not comply with these terms.
*Correspondence: Silvia Gaftandzhieva, c2lzc2l5ODhAdW5pLXBsb3ZkaXYuYmc=