 Melissa M. Rohde
 W. Mike Edmunds2
 Somendra Sharma
- 1Civil and Environmental Engineering Department, Stanford University, Stanford, CA, USA
- 2School of Geography and the Environment, University of Oxford, Oxford, UK
- 3Wells for India, Udaipur, India
Groundwater resources are increasingly being relied on in rural areas for income generation and food security. However, there is currently a lack of simple, yet accessible hydrogeological tools to monitor critical groundwater resources, both for quantity and quality. This is particularly true in developing countries underlain by fractured hard rock aquifers, with low productivities. Electrical conductivity (EC) meters are presented here as an easy-to-use tool that can provide real-time data collection to enhance routine groundwater monitoring. A program was established within a fractured hard rock watershed for over a year in Rajasthan, India to determine the effectiveness and controls of EC as a monitoring tool. Groundwater quality in this region was largely influenced by rainfall, modified by evapotranspiration with recognizable input from water-rock interaction in the later months following the monsoon season. Chloride (Cl−) concentrations were linearly correlated with EC in all of the sampled groundwater, but the strength of the correlation attenuated in the months following the monsoon. Recharge rates were estimated using the chloride mass balance (CMB) approach, and then compared to the recharge rates derived from using EC as a surrogate for Cl− in what is referred to here as the CMB-EC approach. Recharge rates estimated from the CMB and CMB-EC methods were statistically similar (p = 0.44).
Introduction
Access to shallow aquifers via hand-dug open wells and hand-pumped tubewells remains the most common way that rural communities access groundwater for drinking water and irrigation purposes. However, it is these shallow aquifers containing young water (up to a couple of decades in age) that are the most susceptible to inter-annual climate variability (Lapworth et al., 2012). This raises particular concerns for food security and income generation among these vulnerable populations, since agriculture is responsible for 70% of global freshwater consumption and as much as 90% of total freshwater consumption in semi-arid and arid regions. There has been an increasing and alarming dependence on non-renewable groundwater resources for irrigation (Wada et al., 2012), and challenges remain in defining the extent and amounts of renewable resources. Standard hydrogeological methods to quantify groundwater resources are generally cost-prohibitive or inaccessible to many regions, especially in developing countries, which result in uncontrolled use of groundwater. The assessment of groundwater resources in hard rock aquifers is even more problematic due to the large heterogeneity that exists in the lithology and between wells. Hard rock aquifers underlie nearly two-thirds of India and 40% of the land area in sub-Saharan Africa, and provide an important, though limited, water resource for rural communities within these regions. Groundwater-fed irrigation currently supports approximately one billion smallholder farmers in Asia and Africa, and increasing water scarcity has major implications for food security, poverty reduction and income generation (Shah et al., 2007). There is, therefore, a need for reliable tools for routine monitoring and the assessment of critical groundwater resources.
India is the world leader in groundwater use, withdrawing 240–260 km3 annually (Shah, 2005). Groundwater storage loss in NW India has been estimated at 17.7 km3 per year (Rodell et al., 2009), and attributed to intensive agriculture throughout the region. Decentralized groundwater use due to the privatization of wells and small pumps (1–5 horsepower), coupled with a lack of accessible hydrogeological monitoring techniques, has hindered sustainable groundwater management. The Central Ground Water Board (CGWB) of India characterizes the status of groundwater resources by estimating groundwater stress using political administrative boundaries at the block-level. They define groundwater stress as the ratio of net annual groundwater abstraction to net annual groundwater availability, where the net annual groundwater availability over a given land area is a function of groundwater recharge. Groundwater recharge is an areal phenomenon, but can vary spatially depending on the land use, soil type, surface gradient, precipitation variability, and aquifer conditions. This is particularly the case in fractured hard rock aquifers that underlie a majority of India, since groundwater flows through a complex network of fractures and fissures with limited storage that can alter the groundwater recharge and abstraction at the well-to-well scale.
Quantifying recharge is challenging, and if practicable, more than one method should be applied (Scanlon et al., 2002, 2006). There are two main approaches to estimating recharge: physical techniques (water budget approach and water table fluctuation method) and chemical techniques (radioactive tracers: 36Cl and tritium, stable tracers: 18-Oxygen and deuterium, and environmental chloride). Chemical techniques for estimating recharge in semi-arid regions are better suited than physical techniques (Stadler et al., 2010; Lapworth et al., 2012; MacDonald and Edmunds, 2014), since measurements of hydrologic fluxes (i.e., surface water runoff, groundwater flow, and evapotranspiration) are rarely detectable and require numerous spatial and temporal measurements (Allison et al., 1994; de Vries and Simmers, 2002; Scanlon et al., 2002, 2006). In addition to the complexities of recharge estimation in semi-arid climates, large parts of India are also plagued by fractured hard rock aquifers. These fractured hard rock aquifers are difficult to model due to stochastic groundwater flow through non-uniform fractures, but also because quantifying a representative specific yield at the basin or watershed-scale remains a challenge due to the large heterogeneity in the geology and between wells (Rohde et al., 2015). Chemical-based approaches, such as the chloride mass balance (CMB) method, are widely used in intergranular porous sediments (Scanlon et al., 2010; Alcalá and Custodio, 2012). The technique is also being applied to hard rock aquifers (MacDonald and Edmunds, 2014; Rohde et al., 2015), since the chloride signal integrates all the flow pathways that groundwater take to reach a specific well. Although Cl− is relatively low-cost and easy to measure with laboratory availability, it still remains logistically difficult for routine and local groundwater monitoring.
In India, the most common methods to estimate groundwater recharge in hard rock regions are: (1) water table fluctuation method (Healy and Cook, 2002), or (2) rainfall infiltration factor (Ministry of Water Resources, 2009), which uses rainfall data and some assumed percentage infiltration within a given geological setting. The benefits of using the water table fluctuation method is that it can provide annual estimates of groundwater recharge rates and is relatively easy-to-use; however, applying a regional or even basin scale specific yield can lead to recharge uncertainties (Rohde et al., 2015). Likewise, the rainfall infiltration factor is based on the assumption that the infiltration rate is similar across a whole region, where large heterogeneity is likely to spatially exist across different lithologies.
This study investigates the use of specific electrical conductivity (EC) as a surrogate for Cl− in the CMB approach as an alternative chemical approach to obtain recharge rates. The two main goals are to: (1) discern what are the major chemical controls over EC over seasonal changes using data from a pilot monitoring program involving 27 wells; and (2) compare recharge rates derived from the traditional CMB approach using Cl− and a modified CMB-EC approach that substitutes EC in place of Cl−.
Study Site
The Gangeshwar watershed is located within the Udaipur District of Rajasthan, India (Figure 1) and has a total area of 77 km2. This watershed is situated in the Aravalli Hills and is an upstream sub-watershed within the Jaisamand Lake basin and part of the larger Mahi River basin. Bounded between longitudes 73° 45′ E to 74° 25′ E and latitudes 24° 10′ N to 24° 35′ N, the Jaisamand Lake basin is composed of non-perennial rivers. The Gomti River is an important tributary within the Jaisamand Lake Basin, originating in the eastern edges of the Gangeshwar watershed and flowing southwest toward the Jaisamand Lake—Udaipur city's major drinking water supply. Jaisamand Lake basin is currently a pilot site for the Global Network for Water and Development Information for Arid Lands (G-WADI), a UNESCO program that promotes international and regional cooperation to strengthen water management in arid regions (Edmunds et al., 2013).
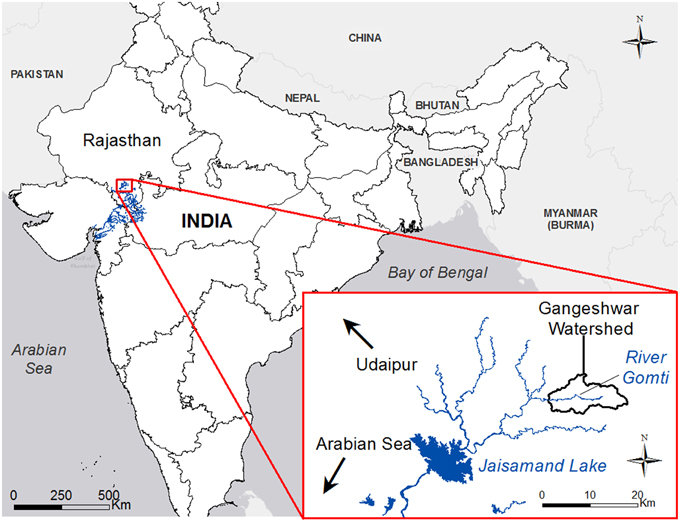
Figure 1. Study site in Rajasthan, India. With kind permission from Springer Science + Business Media: (Rohde et al., 2015).
The Gangeshwar watershed is located in a semi-arid climatic region with a distinct wet and dry period. The monsoon comprises 94% of the total annual rainfall, spanning from mid-June to mid-September. The monsoon rains directly support rain-fed agriculture during the monsoon period, but recharge and storage of monsoon rain serves as a crucial resource for irrigated agriculture during the drier post-monsoon months. The Gangeshwar is underlain by a fractured hard rock unconfined aquifer, part of an Archaean basement complex mainly comprised of migmatites. The Gomti River is the only flowing river located in the watershed and is non-perennial, except for small portions stabilized by the presence of a small dam (locally referred to as an “anicut”). Other streams and tributaries in the Gangeshwar are ephemeral and without storage enhancement structures that only flow during the monsoon rains.
The Gangeshwar is a rural watershed mainly inhabited by tribal villages that rely on agriculture for subsistence and income generation. Land-use is largely agricultural covering ~40% of the watershed's surface area. Native perennial vegetation occupies the remaining surface area and is mainly characterized as forested and open scrubland. Agricultural crops (primarily: maize, rice, wheat, mustard, cotton, pulses, groundnuts, opium) are harvested after the summer monsoon in winter (kharif), in spring (rabi), and more rarely, during the summer (garmi). Groundwater is mainly accessed from open-dug wells and hand-pumped tubewells. Open-dug wells are up to 30 m deep, and tubewells are deeper (~60–100 m). Groundwater is heavily relied on for domestic needs year-round, and for irrigation outside the monsoon season.
Methodology
Sample Collection
A pilot monitoring program involving 27 wells (Figure 2) was established from March 2012 to April 2014 within the Gangeshwar watershed to investigate the relationships between EC and groundwater chemistry over time. Weekly EC measurements were collected at each well and groundwater samples were collected seasonally for chemical analysis at the wells in August 2012 (n = 20), October 2012 (n = 26), December 2012 (n = 27), February 2013 (n = 27), and April 2013 (n = 27). Weekly EC measurements were interpolated using a spline smoothing function to get daily EC measurements, so that an EC measurement for a given day could be compared to groundwater chemistry. EC measurements were taken with a Hanna Instrument DiST® 3 EC Tester (HI98303), with a conductivity range of 0–1999 μS/cm. Groundwater was sampled from existing open hand-dug wells or hand-pump tubewells in village communities using either a steel or plastic bucket. All samples were filter sterilized on site using a 47 mm diameter 0.2 μm Millipore® polycarbonate or cellulose acetate membrane filter. Groundwater samples were collected in 50-mL polypropylene bottles that were rinsed 2–3 times with filtered sample water at each sampling point prior to sampling. Weekly EC measurements and seasonal water table elevations were taken between July 2010 and April 2014 at Well 112. EC measurements were taken with a Hanna Instrument TDS1 (0–999 ppm range) that automatically adjusts EC measurements for temperature variations using an internal sensor and conversion factor of 0.5. TDS measurements were calculated into EC data using the 0.5 conversion factor. A rainfall gauge in Harjibooj Ki Bhagal village in the Gangeshwar was used to monitor rainfall during the 2012 monsoon season. The 27 EC monitored wells were georeferenced with a Global Positioning System (GPS) device and brought into a Geographic Information System (ArcGIS) to generate digital data maps.
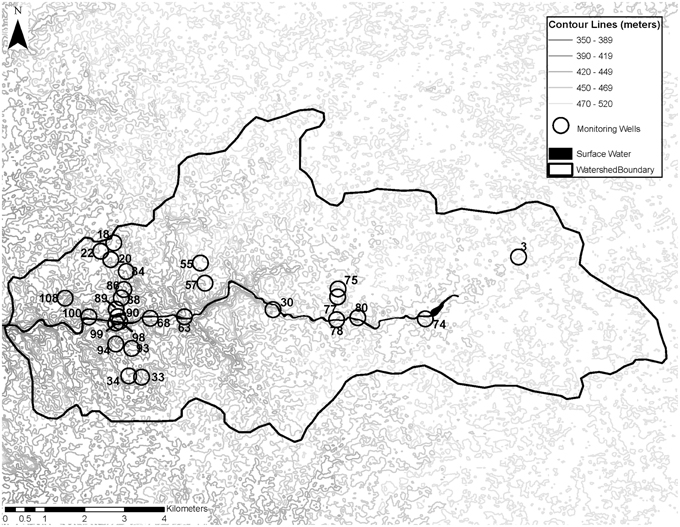
Figure 2. Location of EC monitoring wells for the pilot study within the Gangeshwar watershed. Elevation is contoured every 10 meters.
Geochemical Analysis
Groundwater samples were analyzed for Cl− using Ion Chromatography (Dionex® DX-500) with a detection limit of 0.5 mg/L. Magnesium (Mg2+), sodium (Na+), potassium (K+), and calcium (Ca2+) were analyzed by an Inductively Coupled Plasma Mass Spectrometer (Thermo Scientific® XSERIES 2 ICP-MS) with a detection limit of 0.1 ug/L. Nitrate (NO−3) was analyzed by a Discrete Anlayzer (WestCo® SmartChem 200 DA). Standards and washes were run periodically for each of the analyses, and an analytical error no greater than 5% was accepted for the replicates analyzed within and between runs. All chemical analysis was conducted at the Environmental Measurement 1 (EM-1) Lab in Stanford University.
Groundwater Recharge Rates
Groundwater recharge rates are calculated using the CMB approach:
where P is the amount of rainfall, R is the groundwater recharge rate with units in mm/year, ClRain is the long-term weighted concentration of Cl− in rain, and ClGW is the Cl− concentration of the groundwater from a particular location (Allison and Hughes, 1978; Edmunds et al., 1988). Groundwater recharge rates were determined from groundwater samples taken at different wells collected in the post-monsoon period (October 2012) and the precipitation rate of 725 mm from the preceding monsoon (“Monsoon 2012”). A long-term volume-weighted annual Cl− concentration average from Jodphur with a value of 2 mg/L (Mukhopadhyay et al., 1992) was used for the CMB calculations for groundwater recharge in this study as previously utilized in the Gangeshwar watershed (Rohde et al., 2015) and for the Jaisalmer and Jaipur regions of Rajasthan (Scanlon et al., 2010); this was preferred in comparison to the limited data set available for the watershed.
Results
Groundwater Chemistry Trends
Groundwater chemistry was monitored over 3-month intervals: Aug 2012, Oct 2012, Dec 2012, Feb 2013, and Apr 2013. Mg2+/Ca2+ and Na+/Cl− were selected as proxies to investigate the influence of water-rock interaction (Figure 3). An increase in the Mg2+/Ca2+ ratio of groundwater in the months following the 2012 monsoon period, indicate the likely weathering of ferromagnesian minerals. Thus, groundwater samples taken in the later months exhibited increases in Mg2+ concentration, whereas ratios of Mg2+/Ca2+ in groundwater samples taken during and just after the monsoon were lower (Table 1). Thus, some water-rock interaction is implied in groundwater stored from the last recharged monsoon rains. This is corroborated by the concurrent enrichment of Na+ concentrations in groundwater after the monsoon recharge period (Figure 4; Table 1) that was likely to have derived principally from the progressive weathering of plagioclase feldspar (Na,Ca)(AlSi3O8). The variability of chemical constituents (Table 1) between wells is likely due to spatial heterogeneity in lithologies. The interplay between the monsoon recharge and the ensuing water-rock interactions suggest that groundwater from these shallow wells tend to reflect a low residence time due to the replenishment by the annual monsoon rains.
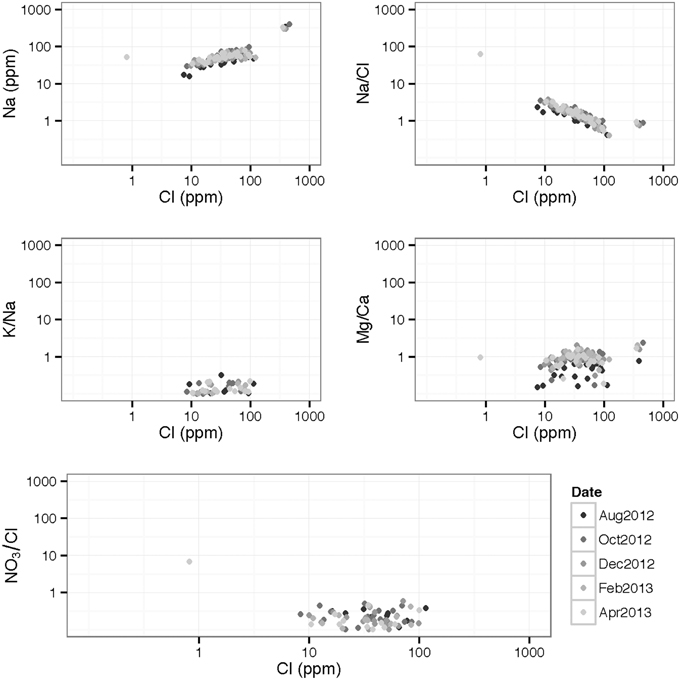
Figure 3. Chemistry trends of groundwater and rainfall.
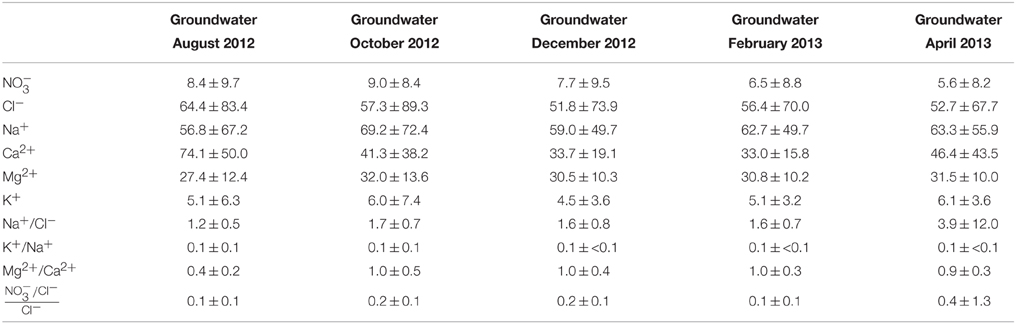
Table 1. Groundwater chemistry averages with one standard deviation.
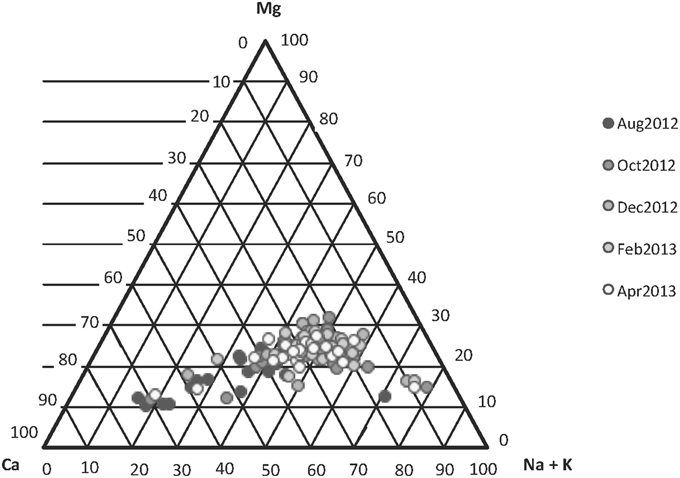
Figure 4. Trilinear plot of inorganic chemistry in the groundwater (circles) and rainfall (triangle) samples.
The application of fertilizers can result in anthropogenically sourced N, P, and K into groundwater during natural and artificial recharge (irrigation) events. Comparing K+/Na+ and NO−3/Cl− in groundwater can provide some evidence for the influence of fertilizer application. There was no distinctive trend between either K+/Na+ and Cl− or NO−3/Cl− and Cl− in the groundwater samples (Table 1). Figure 3 shows very low NO−3/Cl− ratio for most of the samples, with the exception of one outlier from a pre-monsoon April sampling period, which indicates an influence from agricultural activities in the later months after the last monsoon. The similarity in the chemical signatures in the groundwater suggests that contamination by NO−3 and K+ was insignificant.
Relationship Between EC and Cl−
The relationship between EC and ionic concentration is linear for a single solute, but for groundwater where ionic ratios may vary, EC will vary according to the ratios of ionic concentration (Hem, 1985). However, over a small area and in homogenous terrain, a linear relationship of EC and Cl− may be obtained. In the Gangeshwar watershed, EC relates linearly to Cl− concentrations in all of the groundwater samples (R2 = 0.37). Groundwater samples from the post-monsoon period (Aug 2012, Oct 2012, and Dec 2012; R2 = 0.48) were more tightly correlated than the groundwater from the pre-monsoon sampling period (Feb 2013 and Apr 2013; R2 = 0.21; Figure 5). Groundwater from the Oct 2012 post-monsoon period exhibited the largest correlation coefficient (R2 = 0.77) out of all of the sampling periods. The null hypothesis that the correlation coefficients for EC and Cl− concentrations are not correlated (R2 = 0) was proved false (p < 0.001) with a t-test for each dataset combination listed above (e.g., all, post-monsoon period, pre-monsoon period, and Oct 2012 post-monsoon period). This means that the correlation coefficients between EC and Cl− were statistically significant enough to use EC as a substitute for Cl− in the CMB-EC method.
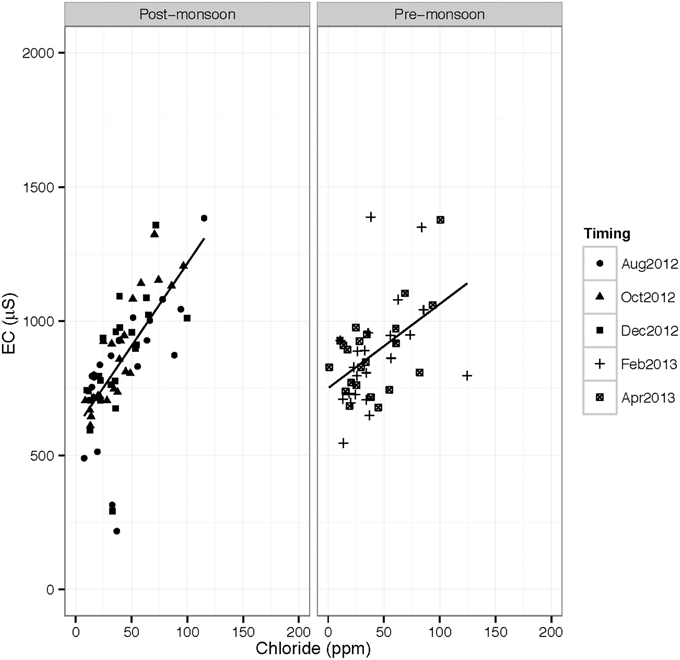
Figure 5. Cl− and EC in groundwater samples from pre-monsoon and post-monsoon periods.
Temporal trends in EC are relatively constant in most of the wells with some exceptions during and after the monsoon season (Figure 6). A drop in EC near the end of the monsoon period existed in some water points (e.g., 18, 20, 22) that are located at higher elevation (upstream of the Gomti River and its tributaries). There were some cases where EC increased during and just after the monsoon in some water points (e.g., 90, 98, and 80) these were located along the Gomti River. Weekly measurements of EC between July 2010 and April 2014 from Well 112 (431 m elevation) show declines during each monsoon period and a concomitant rise in the water table elevation (Figure 7). The decline in EC is more clearly defined during the 2010, 2011, and 2012 monsoon periods, than the 2013 monsoon period. In the months prior to the 2011 and 2012 monsoons, the rate of increase in the groundwater EC distinctly reduces (transition is denoted by a box in Figure 7). This transition point coincides with the harvest of rabi crops and the cultivation of garmi (summer harvest) crops. Most of the fields surrounding this well are left to fallow during the garmi season as opposed to its cultivation in both the kharif (rainfed) and rabi (irrigated) seasons.
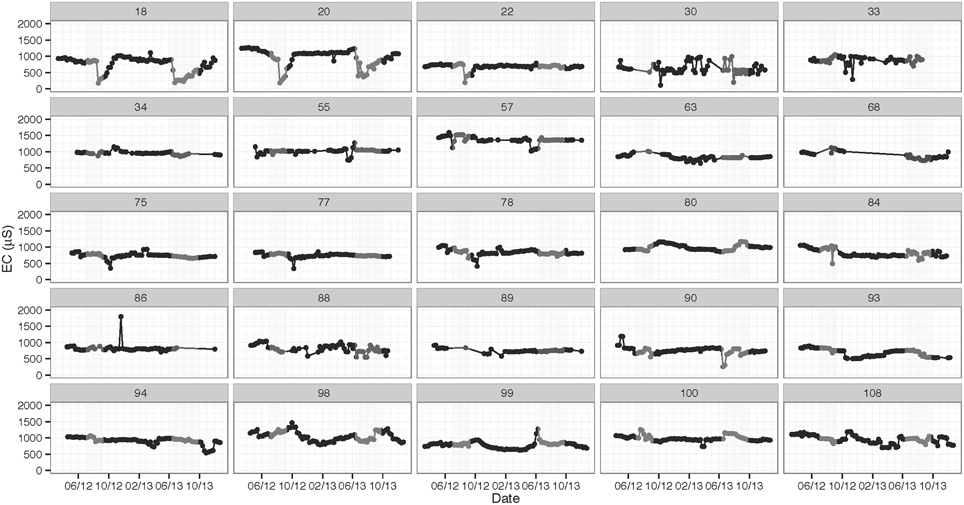
Figure 6. Temporal EC trends at each well site. The date on the x-axis is displayed as month/year, and the shaded areas denote the 2012 and 2013 monsoon seasons.
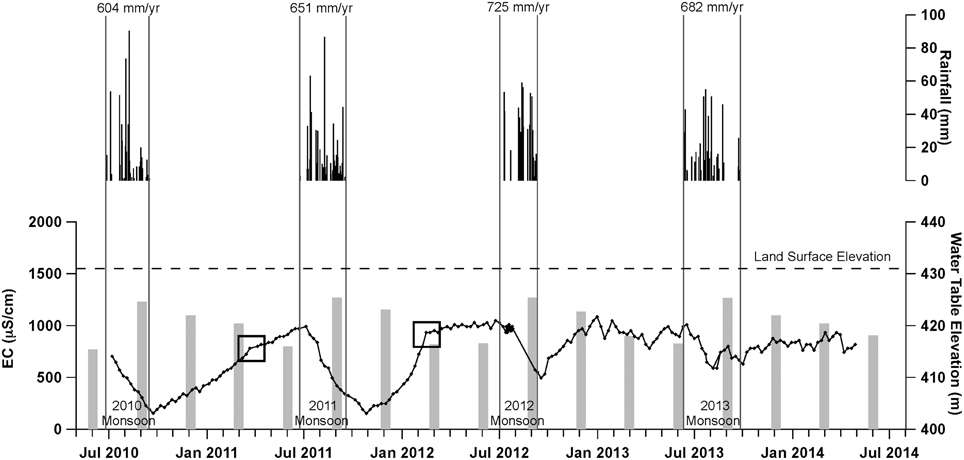
Figure 7. Groundwater response to Rainfall at Well 112. Weekly EC (line) and seasonal water table elevations (bar) are plotted in the lower graph. Boxed EC points indicate a visual change in the rate of increase during the pre-monsoon months. In the top graph, rainfall measurements from Harjibuj Ki Bhagal village are plotted.
CMB versus CMB-EC Recharge Rates
Recharge rates derived from the CMB method using Cl− concentration data from the post-monsoon (Oct 2012) samples ranged from 15.0 to 171.3 mm/year (Table 2). The rainfall rate from the 2012 monsoon was used to calculate recharge in the CMB method. The mean (n = 23) CMB recharge rate for 2012 was calculated as 55.1 mm/year and the median as 38.7 mm/year.
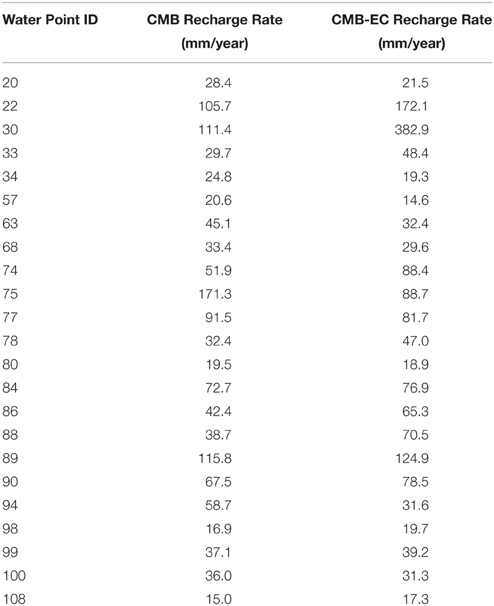
Table 2. Recharge rates at each well site using the CMB and the CMB-EC method.
CMB-EC recharge rates (RRCMB−EC) were estimated by substituting EC measurements for Cl− concentrations in groundwater at each well. EC measurements were converted into a Cl− concentration using the linear relationship between EC and Cl− in the groundwater from the Oct 2012 sampling period:
where P was the 2012 monsoon rainfall (725 mm) and ClRain is the Cl− concentration of rain, using a value of 2.0 mg/L. Cl− concentrations calculated from EC measurements using this regression were positively correlated to actual Cl− concentrations measured on the same samples (p < 0.001; R2 = 0.77). Recharge rates derived from the CMB-EC approach ranged from 15.0 to 382.9 mm/year. The mean recharge rate value was 69.6 mm/year and the median was 47.0 mm/year, which were slightly higher than mean (55.1 mm/year) and median (38.7 mm/year) recharge rates from the CMB approach. Recharge rates derived from the CMB and CMB-EC methods are linearly related in the groundwater samples (p < 0.001; Figure 8). The null hypothesis that the mean recharge rate values from the CMB and CMB-EC are statistically the same was proved true (p = 0.44) with an independent two-group t-test. The three outliers positioned outside the 95% confidence interval surrounding the linear fit in Figure 8 were from water points 94 (below), 75 (below), and 30 (above). There is no clear trend amongst these outliers; however, the outliers below the linear fit were closer than the outlier above. The outlier above (Water point 30) was the only tubewell sampled in this study.
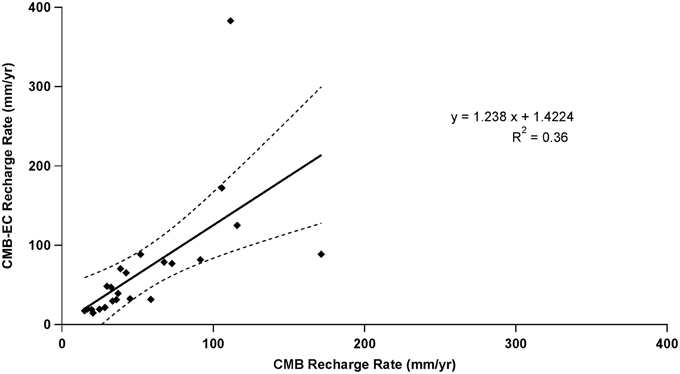
Figure 8. CMB vs. CMB-EC derived Recharge rates. The dotted lines denote the 95% confidence interval around the linear fit (solid line).
Discussion
Electric conductivity measurements are simple, inexpensive and can be used to enhance temporal and spatial hydrologic monitoring. For this reason, EC is already being applied as a hydrologic monitoring tool for different purposes worldwide. Most commonly, EC or total dissolved solutes (TDS) are used as a proxy to monitor water quality standards for drinking water (World Health Organization, 2008). Groundwater quality in coastal areas threatened by seawater intrusion can also easily be monitored with EC due to the large salinity differences between fresh water and seawater (Rhoades et al., 1992; Singhal and Gupta, 2010). Other applications of EC include hydrograph separation, which enables monitoring of rainfall runoff and base flow in surface water within forested (Matsubayashi et al., 1993; Laudon and Slaymaker, 1997; McDonnell et al., 2008) and urban watersheds (Pellerin et al., 2007). Hydrochemical studies also depend on EC as an ancillary proxy along with cation-anion chemical analysis to investigate water-rock interactions. Despite the varied applications of EC in the field of hydrology, there are certainly limitations to its simplistic nature that prevent it from being depended as an a priori tool (Mastrocicco et al., 2011). This is because many of the ions that contribute to the EC signal are non-conservative and react in natural environments.
The application of EC as a tool to monitor groundwater recharge is highly dependent upon knowing the linear relationship between EC and Cl−. In contrast to EC, Cl− is highly conservative in the environment and can be trusted as a tracer for estimating groundwater recharge using the CMB method (Allison, 1988; Edmunds et al., 1988; Zagana et al., 2007). Quantifying the linear relationship between EC and Cl− helps ensure that estimating recharge using the CMB-EC approach is more accurate. In the Gangeshwar watershed, a good correlation between Cl− and EC in groundwater samples from the Oct 2012 period is reflective of newly recharged water from the monsoon rains that have not yet been subjected to prolonged water-rock interactions. In this watershed, groundwater in this unconfined aquifer is likely to have a low residence time of about one year. This is observed in well 112, where a rise in the water table and a concomitant drop in EC mark the replenishment of groundwater each monsoon season. Groundwater replenishment from monsoon rainfall is likely to have different flow pathways and recharge rates due to the heterogeneous network of fractures and fissures in the regolith. This would result in a variation of residence time for the recharge rate between wells, most likely on the days-to-weeks time scale. Residual groundwater that is mature and showing evidence of water-rock interaction could be carried over from year-to-year depending on the connectivity of fractures and the intensity of the monsoon rains. Thus, the baseline groundwater signature expressed as EC in any part of the catchment will be determined by incoming rainfall compositions as well as by mixing with residual (evolved) groundwater. Anthropogenic pollution (not significant here), may also affect the water chemistry.
A statistically significant correlation between EC and Cl− enables EC to be used as a surrogate for Cl− in the CMB-EC method. Recharge rates derived from the CMB and CMB-EC methods are statistically similar, indicating that EC can be used as a monitoring tool for groundwater recharge in regions where the dynamics between EC and Cl− are well understood. This proves particularly advantageous in regions where increased spatial and temporal monitoring is necessary. The simplicity of using EC meters enables continuous monitoring to understand the water storage and progressive amount of recharge.
Conclusion
In this study, EC and Cl− were found to exhibit a strong positive correlation in the pilot monitoring program groundwater samples collected after the replenishment of groundwater from the monsoon rains. Progressive water-rock interactions in the months following the monsoon season were observed to alter groundwater chemistry, such that chemical constituents other than Cl− contributed more to the EC signal. A linear regression of the EC and Cl− relationship from the post-monsoon months was used to substitute EC for Cl− in the CMB approach to estimate recharge rates. A comparison of the recharge rates derived from the CMB and CMB-EC methods are statistically similar, indicating that EC can be used as a surrogate for Cl− in the CMB method, if a strong linear relationship between Cl− and EC exists.
The simplicity of using EC meters to provide real-time data collection makes it a valuable tool for field studies by water users. This is particularly true in countries that lack access to scientific equipment and personnel available to monitor water resource trends in diverse rural landscapes. It provides a simple way to investigate the storage properties of shallow groundwater. It also gives a means for simple monitoring of water quality—to understand the impacts of extreme events, as well as any influences of land use change and the impact of agricultural-related pollution. The present case study was used with local farmers in Rajasthan to help them monitor their wells and understand the significance of changes in the aquifer through the EC approach. EC is presented here as a basic approach to enhance routine groundwater monitoring in fractured hard rock aquifers. It works best in conjunction with other hydrogeological tools to broaden an understanding of groundwater.
Conflict of Interest Statement
The authors declare that the research was conducted in the absence of any commercial or financial relationships that could be construed as a potential conflict of interest.
Acknowledgments
During the processing of this manuscript, our dear colleague and co-author W. Mike Edmunds sadly passed away (April 28, 2015). W. Mike Edmunds played a large role in the conceptualization of this research and its support throughout. His dedication to the field of hydrogeology and his role as a trustee for Wells for India will remain an inspiration to us. We would like to thank Sahyog Sansthan, Wells for India's local partner organization in the long-term cooperation of this study. The collection of field data was made possible with the help of Heeralal Sharma, Suresh Rawat, Prabha Shankar Sharma. We would especially like to thank Om Prakash Sharma at Wells for India for his on-going coordination and assistance with this research. Special thanks go to the following community members that participated in collecting weekly EC measurements for the pilot monitoring program: Shambhulal, Prem Ji, Logarlal, Vaja, Hira, Mira, Laluram Ji, Bhimraj, Joravar, Devilal, Kesha, Bherulal, Kalu, Ramlal, Babrulal, Shambulal, Pitha, Udailal, and Lalu Maharaj. At Stanford University we would like to thank Guangchao Li and Doug Turner at EM-1 Lab. The Borlaug Food Security Fellowship, Haas Center Community Engagement Grant, and a National Science Foundation Graduate Research Fellowship awarded to the first author funded this research.
References
Alcalá, F. J., and Custodio, E. (2012). Spatial average aquifer recharge through atmospheric chloride mass balance and its uncertainty in continental Spain. Hydrol. Process. 28, 218–236. doi: 10.1002/hyp.9556
Allison, G. B. (1988). “A review of some of the physical, chemical and isotopic techniques available for estimating groundwater recharge,” in Estimation of Natural Groundwater Recharge, (Dordrecht: Springer), 49–72. doi: 10.1007/978-94-015-7780-9_4
Allison, G. B., Gee, G. W., and Tyler, S. W. (1994). Vadose-zone techniques for estimating groundwater recharge in arid and semiarid regions. Soil Sci. Soc. Am. J. 58, 6–14. doi: 10.2136/sssaj1994.03615995005800010002x
Allison, G. B., and Hughes, M. W. (1978). The use of environmental chloride and tritium to estimate total recharge to an unconfined aquifer. Aust. J. Soil Res. 16, 181–195. doi: 10.1071/SR9780181
de Vries, J., and Simmers, I. (2002). Groundwater recharge: an overview of processes and challenges. Hydrogeol. J. 10, 5–17. doi: 10.1007/s10040-001-0171-7
Edmunds, W. M., Jayakumar, R., Mishra, A., Salih, A., Sorooshian, S., Wheater, H. S., et al. (2013). G-WADI—the first decade. Sci. Cold Arid Reg. 5, 1–5. doi: 10.3724/SP.J.1226.2013.00001
Edmunds, W. M., Darling, W. G., and Kinniburgh, D. G. (1988). “Solute profile techniques for recharge estimation in semi-arid and arid terrain,” in Estimation of Natural Groundwater Recharge (Dordrecht: Springer), 139–157. doi: 10.1007/978-94-015-7780-9_9
Healy, R., and Cook, P. (2002). Using groundwater levels to estimate recharge. Hydrogeol. J. 10, 91–109. doi: 10.1007/s10040-001-0178-0
Hem, J. D. (1985). Study and Interpretation of the Chemical Characteristics of Natural Water. Alexandria: USGS.
Lapworth, D. J., MacDonald, A. M., Tijani, M. N., Darling, W. G., Gooddy, D. C., Bonsor, H. C., et al. (2012). Residence times of shallow groundwater in West Africa: implications for hydrogeology and resilience to future changes in climate. Hydrogeol. J. 21, 673–686. doi: 10.1007/s10040-012-0925-4
Laudon, H., and Slaymaker, O. (1997). Hydrograph separation using stable isotopes, silica and electrical conductivity: an alpine example. J. Hydrol. 201, 82–101. doi: 10.1016/S0022-1694(97)00030-9
MacDonald, D. M. J., and Edmunds, W. M. (2014). Estimation of groundwater recharge in weathered basement aquifers, southern Zimbabwe; a geochemical approach. Appl. Geochem. 42, 86–100. doi: 10.1016/j.apgeochem.2014.01.003
Mastrocicco, M., Prommer, H., Pasti, L., Palpacelli, S., and Colombani, N. (2011). Evaluation of saline tracer performance during electrical conductivity groundwater monitoring. J. Contam. Hydrol. 123, 157–166. doi: 10.1016/j.jconhyd.2011.01.001
Matsubayashi, U., Velasquez, G. T., and Takagi, F. (1993). Hydrograph separation and flow analysis by specific electrical conductance of water. J. Hydrol. 152, 179–199. doi: 10.1016/0022-1694(93)90145-Y
McDonnell, J. J., Stewart, M. K., and Owens, I. F. (2008). Effect of catchment-scale subsurface mixing on stream isotopic response. Water Resour. Res. 27, 3065–3073. doi: 10.1029/91WR02025
Ministry of Water Resources, G. O. I. (2009). Report of the Ground Water Resource Estimation Committee. Ministry of Water Resources, Government of India. Available online at: http://cgwb.gov.in/documents/gec97.pdf (Accessed August 8, 2013).
Mukhopadhyay, B., Datar, S. V., and Srivastava, H. N. (1992). Precipitation chemistry over the Indian region. Mausam 43, 249–258.
Pellerin, B. A., Wollheim, W. M., Feng, X., and Vörösmarty, C. J. (2007). The application of electrical conductivity as a tracer for hydrograph separation in urban catchments. Hydrol. Process. 22, 1810–1818. doi: 10.1002/hyp.6786
Rhoades, J. D., Kandiah, A., and Mashali, A. M. (1992). The Use of Saline Waters for Crop Production. Rome: FAO.
Rodell, M., Velicogna, I., and Famiglietti, J. S. (2009). Satellite-based estimates of groundwater depletion in India. Nature 460, 999–1002. doi: 10.1038/nature08238
Rohde, M. M., Edmunds, W. M., Freyberg, D., Sharma, O. P., and Sharma, A. (2015). Estimating aquifer recharge in fractured hard rock: analysis of the methodological challenges and application to obtain a water balance (Jaisamand Lake Basin, India). Hydrogeol. J. 1–14. doi: 10.1007/s10040-015-1291-9
Scanlon, B. R., Keese, K. E., Flint, A. L., Flint, L. E., Gaye, C. B., Edmunds, W. M., et al. (2006). Global synthesis of groundwater recharge in semiarid and arid regions. Hydrol. Process. 20, 3335–3370. doi: 10.1002/hyp.6335
Scanlon, B. R., Mukherjee, A., Gates, J., Reedy, R. C., and Sinha, A. K. (2010). Groundwater recharge in natural dune systems and agricultural ecosystems in the Thar Desert region, Rajasthan, India. Hydrogeol. J. 18, 959–972. doi: 10.1007/s10040-009-0555-7
Scanlon, B. R., Healy, R. W., and Cook, P. G. (2002). Choosing appropriate techniques for quantifying groundwater recharge. Hydrogeol. J. 10, 18–39. doi: 10.1007/s10040-001-0176-2
Shah, T. (2005). Groundwater and human development: challenges and opportunities in livelihoods and environment. Water Sci. Technol. 51, 27–37.
Shah, T., Burke, J., and Villholth, K. (2007). “Groundwater: a global assessment of scale and significance,” in Water for Food, Water for Life, ed D. Molden (London: International Water Management Institute), 395–423.
Singhal, B. B. S., and Gupta, R. P. (2010). Applied Hydrogeology of Fractured Rocks. Dordrecht: Springer Science and Business Media. doi: 10.1007/978-90-481-8799-7
Stadler, S., Osenbruck, K., Duijnisveld, W. H., Schwiede, M., and Bottcher, J. (2010). Linking chloride mass balance infiltration rates with chlorofluorocarbon and SF6 groundwater dating in semi-arid settings: potential and limitations. Isotopes Environ. Health Stud. 46, 312–324. doi: 10.1080/10256016.2010.508124
Wada, Y., van Beek, L. P. H., and Bierkens, M. F. P. (2012). Nonsustainable groundwater sustaining irrigation: a global assessment. Water Resour. Res. 48. doi: 10.1029/2011WR010562
World Health Organization (2008). Guidelines for Drinking-water Quality: Recommendations. Geneva: World Health Organization.
Keywords: groundwater recharge, electrical conductivity, fractured hard-rock, agriculture, India
Citation: Rohde MM, Edmunds WM and Sharma S (2015) An accessible hydrogeological tool to monitor critical groundwater resources in hard-rock aquifers. Front. Environ. Sci. 3:67. doi: 10.3389/fenvs.2015.00067
Received: 30 April 2015; Accepted: 02 October 2015;
Published: 26 October 2015.
Edited by:
Saugata Datta, Kansas State University, USAReviewed by:
Saumitra Mukherjee, Jawaharlal Nehru University, IndiaFrantišek Bůzek, Czech Geological Survey, Czech Republic
Alejandra Vanina Volpedo, Universidad de Buenos Aires/Consejo Nacional de Investigaciones Científicas y Técnicas, Argentina
Copyright © 2015 Rohde, Edmunds and Sharma. This is an open-access article distributed under the terms of the Creative Commons Attribution License (CC BY). The use, distribution or reproduction in other forums is permitted, provided the original author(s) or licensor are credited and that the original publication in this journal is cited, in accordance with accepted academic practice. No use, distribution or reproduction is permitted which does not comply with these terms.
*Correspondence: Melissa M. Rohde, bWVscm9oZGVAZ21haWwuY29t