 Ryan S. Renslow1,2
 Bulbul Ahmed1†
 Jamie R. Nuñez2Bin Cao1,2†Paul D. Majors2†
 Jim K. Fredrickson2
 Haluk Beyenal1*
- 1The Gene and Linda Voiland School of Chemical Engineering and Bioengineering, Washington State University, Pullman, WA, United States
- 2Earth and Biological Sciences Directorate, Pacific Northwest National Laboratory, Richland, WA, United States
In this study, we developed a two-dimensional mathematical model to predict substrate utilization and metabolite production rates in Shewanella oneidensis MR-1 biofilm in the presence and absence of uranium (U). In our model, lactate and fumarate are used as the electron donor and the electron acceptor, respectively. The model includes the production of extracellular polymeric substances (EPS). The EPS bound to the cell surface and distributed in the biofilm were considered bound EPS (bEPS) and loosely associated EPS (laEPS), respectively. COMSOL® Multiphysics finite element analysis software was used to solve the model numerically (model file provided in the Supplementary Material). The input variables of the model were the lactate, fumarate, cell, and EPS concentrations, half saturation constant for fumarate, and diffusion coefficients of the substrates and metabolites. To estimate unknown parameters and calibrate the model, we used a custom designed biofilm reactor placed inside a nuclear magnetic resonance (NMR) microimaging and spectroscopy system and measured substrate utilization and metabolite production rates. From these data we estimated the yield coefficients, maximum substrate utilization rate, half saturation constant for lactate, stoichiometric ratio of fumarate and acetate to lactate and stoichiometric ratio of succinate to fumarate. These parameters are critical to predicting the activity of biofilms and are not available in the literature. Lastly, the model was used to predict uranium immobilization in S. oneidensis MR-1 biofilms by considering reduction and adsorption processes in the cells and in the EPS. We found that the majority of immobilization was due to cells, and that EPS was less efficient at immobilizing U. Furthermore, most of the immobilization occurred within the top 10 μm of the biofilm. To the best of our knowledge, this research is one of the first biofilm immobilization mathematical models based on experimental observation. It has the ability to predict the relative contributions to U immobilization of laEPS, bEPS, and cells.
Introduction
Microorganisms interact with minerals available in the environment (Zhou et al., 2014; Ng et al., 2016; Shi et al., 2016). This has led to the field of bioremediation, the study of the insertion and/or manipulation of organisms in certain areas to reduce environmental pollutants. Shewanella oneidensis MR-1 is one type of dissimilatory metal-reducing bacterium that plays an important role in the biogeochemical cycling of many different types of metals and radionuclides (Venkateswaran et al., 1999; Nealson et al., 2002; Marshall et al., 2006; Nealson and Scott, 2006). This organism is capable of utilizing a wide range of electron donors, such as lactate, acetate, pyruvate, formate, and amino acids, and electron acceptors, such as oxygen (O2), fumarate, dimethyl sulfoxide (DMSO), Fe(III), and Mn(IV) (Myers and Nealson, 1988; Nealson and Saffarini, 1994; Tang et al., 2007b; Mclean et al., 2008a; Pinchuk et al., 2011). Because of its respiratory versatility, S. oneidensis MR-1 has been widely investigated as a model organism for heavy metal and radionuclide bioremediation (Myers et al., 2000; Viamajala et al., 2002; Marshall et al., 2006). In this research, we focus on its ability to reduce and immobilize uranium (U), an important contaminant because of its prevalence in the environment and toxicity to many organisms, including humans. Since the biotransformation of metals and radionuclides (e.g., during uranium bioremediation) can impact cellular metabolism (Viamajala et al., 2002, 2004; Tang et al., 2006), it is important to investigate experimentally and theoretically using mathematical models, and understand these changes in order to improve bioremediation techniques and applications.
Previously, the growth kinetics of S. oneidensis under various conditions were investigated using planktonic cultures (Myers and Nealson, 1988; Liu et al., 2005; Tang et al., 2006). A kinetic model was developed to predict substrate utilization, metabolite production, and cell growth using planktonic cultures under varied O2 concentrations (Tang et al., 2007b). However, the predominant mode of life for microorganisms, including S. oneidensis, is in biofilms. A biofilm is a surface- or interface-associated, sessile microbial community embedded in a matrix of self-produced extracellular polymeric substances (EPS) as opposed to planktonic cells, which live independently as individuals, freely suspended in solution (Costerton et al., 1995; O'Toole et al., 2000). Cell metabolism and physiology in biofilms can be significantly different from that in planktonic cultures, especially in the presence of toxic contaminants such as uranium (Harrison et al., 2007; Stewart and Franklin, 2008). It is well known that heavy metals and radionuclides inhibit microbial metabolic activity and cell growth, including those of S. oneidensis (Middleton et al., 2003; Viamajala et al., 2004; Wen, 2008; Cao et al., 2012). Since metal and radionuclide bioremediation is often dependent on cell growth and metabolic activity, mathematical models that predict the microbial biotransformation of contaminants should include cellular metabolism alongside U immobilization. Furthermore, biokinetic parameters (such as biomass yield and maximum U(VI) reduction rate) calculated using planktonic cultures under non-growth conditions have limited ability to predict growth and metabolism in a biofilm.
EPS comprises 50–80% of the total organic content of a biofilm (Nielsen et al., 1997). EPS can either be tightly bound to the cell surface, called bound EPS (bEPS), or distributed in the surrounding environment of the cells in a more soluble form, called loosely associated EPS (laEPS) (Cao et al., 2011b). Recently, we demonstrated the relative contributions of bEPS, laEPS, and cells from Shewanella sp. HRCR-1 biofilms in U(VI) immobilization (Cao et al., 2011b). We found that bEPS and laEPS immobilized U(VI) through both reduction and adsorption. In addition, Marshall et al. (2006) reported that uraninite nanoparticles co-localized with the biofilm-associated matrix as UO2-EPS in S. oneidensis biofilms (Marshall et al., 2006).
Although the importance of the cellular and EPS constituents for U(VI) immobilization has been demonstrated, kinetic information on biofilm growth and cellular metabolism in the presence of U(VI) and U(VI) immobilized in biofilm components (cells, laEPS and bEPS) is limited. Mathematical models have been developed using planktonic cultures of Shewanella sp. to predict the kinetics of U(VI) immobilization under non-growth conditions (Truex et al., 1997; Liu et al., 2002). Truex et al. (1997) used a non-growth Monod model to describe U(VI) reduction kinetics. Liu et al. (2002) used both first-order and Monod kinetic equations to predict U(VI) reduction kinetics and compared the estimated kinetic parameters obtained using the two equations. These models assume that U(VI) is solely reduced by the cells; however, overall U(VI) immobilization can result from microbial reduction as well as other nonreductive chemical and physical processes (Hazen and Tabak, 2005; Wall and Krumholz, 2006; Kumar et al., 2007; Renshaw et al., 2007; Merroun and Selenska-Pobell, 2008), as shown in Figure 1. The stability of U is dependent both upon the mechanism of immobilization (e.g., U(IV) is subject to oxidation and remobilization, and the sorption of complexes to biomass depends on the activity of the biomass) and the biomass structure (e.g., biofilm restricting diffusion and the fraction of EPS in the biomass).
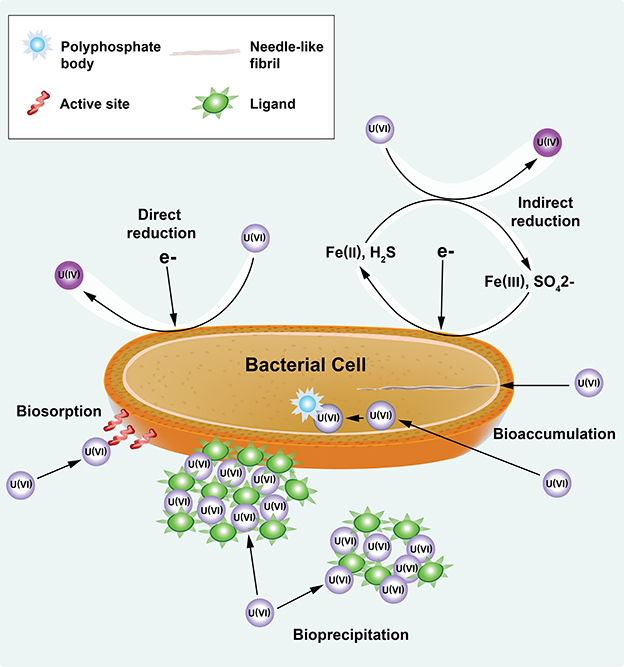
Figure 1. U(VI) immobilization through reductive (direct and indirect reduction) and nonreductive (i.e., biosorption, bioprecipitation, and bioaccumulation) mechanisms of bacteria. Modified from the figure in Emerging Environmental Technologies: Immobilization of Uranium in Groundwater Using Biofilms (Cao et al., 2010), with kind permission from Springer Science+Business Media.
To date, mathematical models predicting U immobilization by the cells in the biofilm and EPS have not been developed. We hypothesize these factors play a significant role in bioremediation and cannot be ignored. A biofilm model could play a critical role in estimating the relative contributions of cells and EPS to total U immobilization. The development of an integrated model has been hindered by the limitations of the experimental techniques required to investigate biofilms and collect necessary experimental data, such as maximum specific growth rates, half saturation constants, cell yields, stoichiometric coefficients, and effective diffusion coefficients. Recently, we developed a nuclear magnetic resonance (NMR) microimaging-capable biofilm reactor which can be used for in situ monitoring of live biofilm metabolism and U immobilization, which allows us to generate these critically needed data (Mclean et al., 2008a,b; Renslow et al., 2010, 2014; Renslow R. S. et al., 2013). Recently, Vogt et al. (2012) has also used magnetic resonance techniques to detect biological uranium reduction (Vogt et al., 2012).
The goal of our work was to develop a two-dimensional mathematical model of S. oneidensis biofilms to predict the fate of U in biofilms (EPS and cellular biomass components) based on experimental data including data obtained using our NMR imaging technique. We developed a two-dimensional model integrated in COMSOL® Multiphysics finite element analysis software. For experimental work we used a custom designed biofilm reactor which allowed for sustained biofilms inside the NMR. S. oneidensis MR-1 biofilms were grown in the biofilm reactor placed in the NMR. After a mature biofilm developed, the in situ metabolite concentrations were measured and the biofilm was characterized. Then, U was added to the feed solution and the same parameters were measured. The model was then calibrated using our experimental data and used to predict in situ substrate utilization and metabolite production rates. Using the model and experimental data, we estimated the yield coefficient, maximum substrate utilization rate, half saturation constant for lactate, stoichiometric ratio of fumarate and acetate to lactate and stoichiometric ratio of succinate to fumarate. Finally, the model was used to predict U immobilization in S. oneidensis MR-1 biofilms by considering reduction and adsorption processes in both the cells and the EPS.
Materials and Methods
Growing S. oneidensis Biofilms
S. oneidensis MR-1 biofilms were grown using a constant depth film fermenter (CDFF) and then transferred to a specially designed NMR biofilm reactor to allow the biofilms to continue to grow inside the NMR biofilm reactor (Figure 2), as described in a previous study (Renslow et al., 2010). Briefly, the biofilms were grown aerobically at 30°C on 5 mm-diameter glass coverslips in the CDFF wells. After growth for ~8 days, the biofilms were aseptically placed into the NMR biofilm reactor. The biofilms were allowed to continue to grow inside the anaerobic biofilm reactor set inside the gas-perfused NMR spectrometer chamber, maintained at 30°C (Figure 2B). The NMR biofilm reactor consisted of a 40 mm-long, 4 mm-wide, and 2 mm-tall Torlon® polyamide-imide plastic case that housed the biofilm on the glass coverslip (Figure 2C). Perfusion lines continuously fed growth medium at 1 ml/h (Figure 2A).
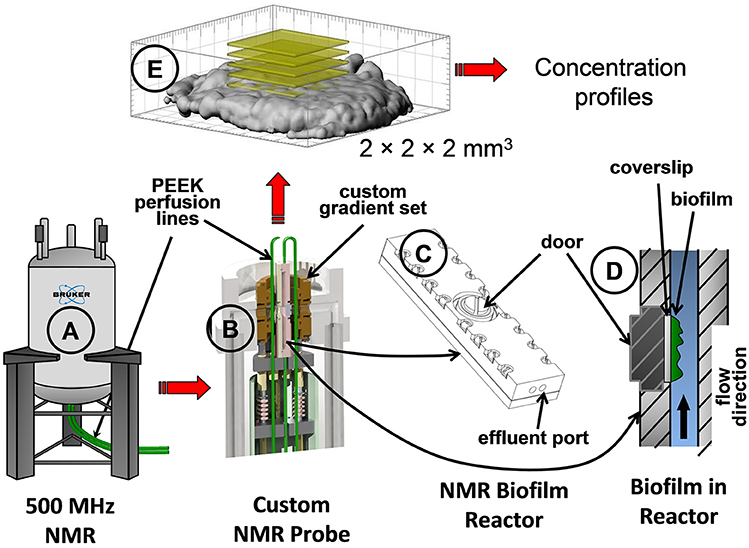
Figure 2. Schematics showing the NMR spectrometer and the NMR biofilm reactor used to grow the S. oneidensis biofilm. Parts shown: (A) the NMR spectrometer, (B) inside view of the custom-made NMR probe with the NMR biofilm reactor, (C) the NMR biofilm reactor, (D) inside view of the NMR biofilm reactor with flow direction, and (E) a 3D magnetic resonance image of an S. oneidensis biofilm with yellow slices demonstrating the location of the bulk metabolite concentration measurements taken within a 2 × 2 × 2 mm3 volume.
NMR Analysis of Substrates and Metabolites
Concentration measurements of substrates and metabolites were performed using a Bruker Avance digital NMR spectrometer (Bruker Instruments, Billerica, MA) with a 11.7-T, 89 mm vertical bore and an actively shielded superconducting magnet at 500.44 MHz for protons (1H), similar to measurements performed by Majors et al. (2005), Mclean et al. (2008a,b), and Renslow et al. (2017). This type of measurement is unique in its ability to determine temporally resolved concentrations of multiple chemical species simultaneously, in situ, non-invasively and without consuming the sample. Absolute concentrations of lactate, acetate, fumarate, and succinate were monitored using 9-min-averaged point resolved spectroscopy (PRESS) with “variable power radio frequency pulses with optimized relaxation delays” (VAPOR) water suppression. The average concentration was measured within a 2 × 2 × 2 mm3 voxel (Figure 2E) centered on the biofilm coverslip under the stop-flow condition. Stop-flow experiments were conducted in which the biofilm was allowed to reach a steady state activity (as measured by metabolite concentrations) under continuous flow, then the flow was abruptly stopped, and the bulk metabolite concentrations were monitored over time with or without U.
Analysis of U Concentrations
NMR effluent samples were collected, and U concentration was measured using a kinetic phosphorescence analyzer (KPA) (Brina and Miller, 1992; Cao et al., 2011b).
Model Development
The two-dimensional model considered an S. oneidensis MR-1 biofilm inside the NMR biofilm reactor. Perfusion lines continuously provided anaerobic growth medium, which flowed around the biofilm in a laminar flow. Lactate and fumarate were fed as the electron donor and electron acceptor, respectively, and acetate and succinate were produced by the biofilm from the oxidation of lactate and the reduction of fumarate, respectively. The medium was continually purged with N2; thus dissolved O2 in the medium was negligible and excluded from the model. Both convection and diffusion of these chemical species were considered. The input variables—inlet substrate and U(VI) concentrations, initial cells, bEPS and laEPS concentration, and biokinetic parameters in the presence or absence of U—are listed in Table 1. During certain simulations, U(VI) was also included. U(VI) was immobilized in all biomass fractions (i.e., cells or EPS), either by reduction to U(IV) or by adsorption. For the initial prediction of U immobilization in biofilms, the input biokinetic parameters relevant to U(VI) adsorption and reduction used in this model are listed in Table 2.
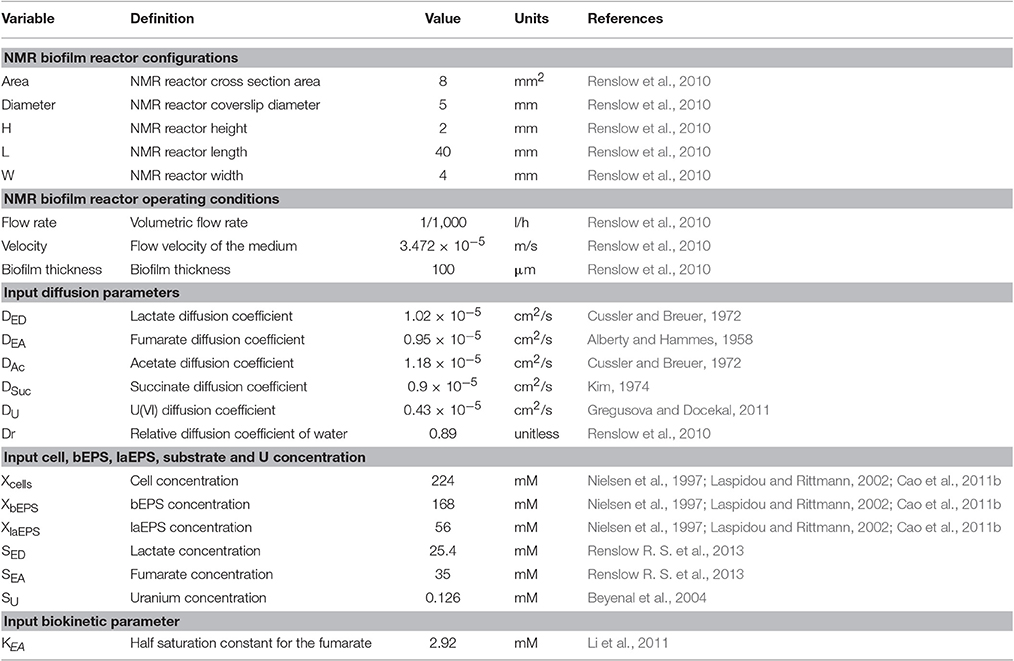
Table 1. NMR biofilm reactor configurations and operating conditions, and model input variables.
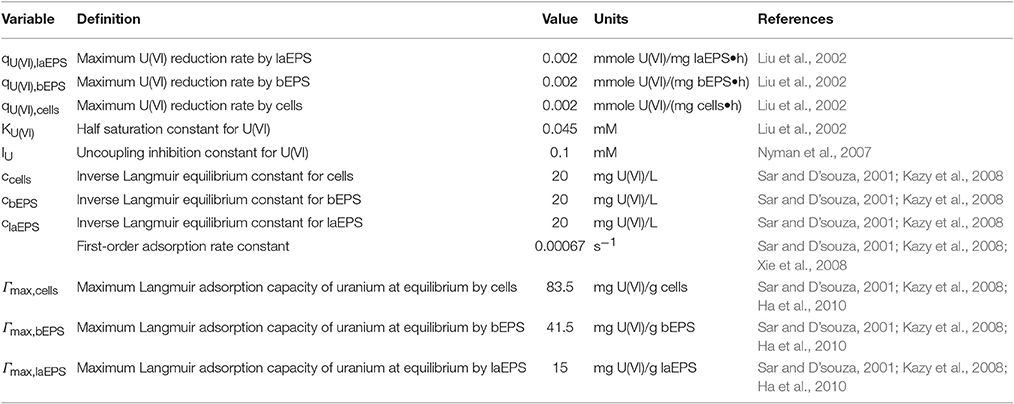
Table 2. Input biokinetic parameters relevant to U(VI) adsorption and reduction used for initial U immobilization prediction.
Assumptions and Reactions
The model is based on these assumptions:
1. U(VI) does not support cell growth as an electron acceptor. An uncoupling inhibition model was applied to account for U inhibition of cellular metabolism.
2. Decay of biomass (cells or EPS) is negligible for the short time scale (3 h for the stop-flow experiment).
3. In the biofilm, cells immobilize U through adsorption and reduction.
4. U immobilization is irreversible for the short time scale. Reoxidation of the reduced U was not considered.
5. The ratio of bEPS to laEPS is 3:1 and EPS compose 50% of the total biomass. This is based on experimental data (Nielsen et al., 1997; Cao et al., 2011b).
In our model we have the following reaction.
Empirical stoichiometric lactate utilization is given in Table 3.
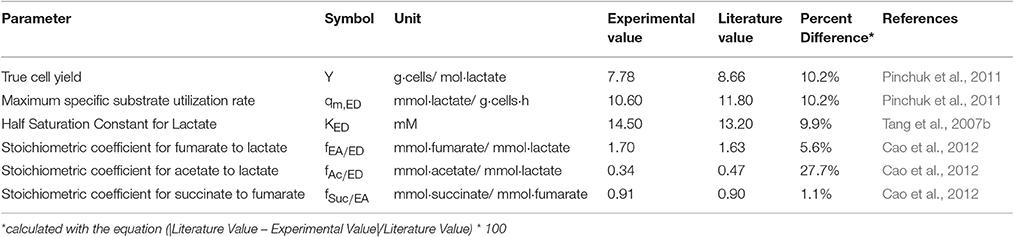
Table 3. Comparisons of parameters estimated from the model with the literature values.
Substrate Utilization Rate
Monod models have been extensively used to describe microbially mediated redox reaction kinetics (Liu et al., 2002; Luo et al., 2007). A dual-substrate multiplicative Monod rate law was used to describe substrate utilization rates because the concentrations of lactate and fumarate both limit the overall growth rate (Bader, 1978). The utilization rate of the electron donor (ED, lactate) and the electron acceptor (EA, fumarate) are expressed as Equations (2) and (3), respectively:
where SED is the concentration of lactate (mM), SEA is the concentration of fumarate (mM), SU is the total concentration of all forms of U (mM), t is time (s), qm,ED is the maximum specific lactate utilization rate by cells (mmole lactate / mmole cells s−1), KED is the half saturation constant for lactate (mM), KEA is the half saturation constant for fumarate (mM), IU is the uncoupling inhibition constant for U (mM), the term IU/(SU+IU) expresses the inhibition of substrate utilization by U, Xcells is the cell concentration (mM), and fEA/ED is the stoichiometric ratio of fumarate to lactate (mmole fumarate/mmole lactate). In the COMSOL® model described in the Model Implementation section below, all biomass densities, including cell concentration, are tracked internally as mM concentrations as opposed to the typically used g/L units. A molar mass of 113 g biomass/mole biomass is used to convert between mass and moles for all biomass, based on an empirical formula for cells and EPS of C5H7O2N (Rittmann and Perry, 2001). This allows for easy tracking of units inside the model, and this is required for the software to operate properly. When needed, we plotted figures using typical units for biomass, such as g/L rather than the units used in COMSOL®.
Cell Growth Kinetics
Microbial cell growth was associated with the consumption of lactate and fumarate present in the system. Dual-substrate multiplicative Monod growth kinetics were used to describe overall cell growth:
where Y is the biomass yield (mmole biomass/mmole lactate) and kbEPS and klaEPS are the fractions of electron donor lactate used for the production of bEPS (mmole bEPS/mmole biomass) and laEPS (mmole laEPS/mmole biomass) present in biofilms, respectively. The term (1-kbEPS-klaEPS) is the fraction of the electron donor used for cell growth (mmole cells/mmole biomass).
Rate of bEPS Production
The formation of bEPS is associated with cell growth, and they are produced in direct proportion to the electron donor utilization rate. The detachment of bEPS is not considered in this model because bEPS is tightly associated with the cells and can in fact be considered a physical extension of the cell surface. Furthermore, the experiments were carried out at a very low Reynolds number (0.1), so bEPS loss is assumed to be negligible. The overall bEPS production rate is described by Equation (5):
where XbEPS is the concentration of bEPS (mM).
Rate of laEPS Production
The formation of laEPS is also associated with cell growth, and they are produced in direct proportion to the electron donor utilization rate. Although, laEPS are biodegradable, can be used as a recyclable electron donor substrate for cell growth, and can be lost through sloughing, these features are excluded from this model. The overall laEPS production rate is expressed by Equation (6):
where XlaEPS is the concentration of laEPS (mM).
U Immobilization in Cells
Cells immobilize U through the adsorption of soluble uranyl ions () and the reduction of soluble uranyl ions to insoluble uraninite (UO2) nanoparticles. Biosorption, bioprecipitation, and bioaccumulation are lumped together as physical adsorption and described using a Langmuir adsorption isotherm (Sar and D'souza, 2001; Kazy et al., 2008; Ha et al., 2010). Because the mechanisms of U reduction are not fully understood, we assume that the U(VI) is first adsorbed and then can be reduced by the cell using electrons from lactate oxidation. This is a process similar to direct U(IV) reduction on the cell surface. U adsorption by cells is given by:
where SU(VI),cells is the concentration of the U(VI) adsorbed to the cells (mM) and Γcells is the adsorption capacity of U (mmole U/mmole cells). The adsorption kinetics are given by:
where the first term in the parentheses is the equilibrium adsorption capacity given by the Langmuir adsorption isotherm, Γmax,cells is the maximum Langmuir adsorption capacity of U at equilibrium (mmole U/mmole cells), k is the first-order adsorption rate constant (s−1), ccells is the inverse Langmuir equilibrium constant (mM), and SU is the U(VI) available to the cells in the biofilm.
U reduction by cells is described by a single-substrate Monod-like equation since cell growth is not dependent on uranium; it is given by:
where SU(IV),cells is the concentration of U(IV) immobilized by the cells (mM), qU(VI),cells is the maximum U(VI) reduction rate by the cells (mmole U(IV)/mmole cells.s), and KU(VI) is the half saturation constant for U(VI) (mM).
The overall U immobilization rate by cells in biofilms is given by:
U Immobilization in bEPS
MtrA, MtrB, MtrC and OmcA are the key proteins involved in extracellular electron transfer in Shewanella sp. and are highly abundant in bEPS (Cao et al., 2011b; Shi et al., 2012), where significant U reduction has been observed.
U adsorption by bEPS is given by:
where SU(VI),bEPS is the concentration of U(VI) adsorbed to the bEPS (mM) and ΓbEPS is the adsorption capacity of uranium (mmole U/mmole bEPS). The adsorption kinetics of bEPS are given by:
where the first term in the parentheses is the equilibrium adsorption capacity given by the Langmuir adsorption isotherm, Γmax,bEPS is the maximum Langmuir adsorption capacity of uranium at equilibrium (mmole U/mmole bEPS), cbEPS is the inverse Langmuir equilibrium constant (mM), and SU is the uranium U(VI) available to the bEPS in the biofilms.
U reduction by bEPS is given by:
where SU(IV),bEPS is the concentration of U(IV) immobilized by the bEPS (mM), qU(VI),bEPS is the maximum U(VI) reduction rate by the bEPS (mmole U(IV)/mmole bEPS.s), and KU(VI) is the half saturation constant for U(VI) (mM).
The overall U immobilization by bEPS in biofilms is given by:
U Immobilization in laEPS
Because of the higher carbohydrate-to-protein ratio in laEPS, laEPS have better biosorption capability. The overall U immobilization in laEPS is dominated by adsorption, with minimal reduction because of the higher polysaccharide content.
U(VI) adsorption by laEPS is given by:
where SU(VI),laEPS is the concentration of U(VI) adsorbed to the laEPS (mM) and ΓlaEPS is the Langmuir adsorption capacity of uranium (mmole U/mmole laEPS).
The adsorption kinetics of laEPS are given by:
where the first term in the parentheses is the equilibrium adsorption capacity given by the Langmuir adsorption isotherm, Γmax,laEPS is the maximum Langmuir adsorption capacity of uranium at equilibrium (mmole U/mmole laEPS), k is the first-order adsorption rate constant (s−1), claEPS is the inverse Langmuir equilibrium constant (mM), and SU is the uranium U(VI) available to the laEPS in the biofilms.
U reduction by laEPS is given by:
where SU(IV),bEPS is the concentration of U(IV) immobilized by laEPS (mM), qU(VI),laEPS is the maximum U(VI) reduction rate by the laEPS (mmole U(IV)/mmole laEPS.s), and KU(VI) is the half saturation constant for U(VI) (mM).
The overall U immobilization by laEPS in biofilms is given by:
U Immobilization in Biofilms
The overall U immobilization in biofilm is expressed by:
Metabolite Production Rates
The acetate production rate is expressed by:
where PAc is the concentration of metabolite acetate (mM), and fAc/ED is the stoichiometric ratio of acetate to lactate (mmole acetate/mmole lactate).
The succinate production rate is expressed by:
where PSuc is the concentration of metabolite succinate (mM) and fSuc/ED is the stoichiometric ratio of succinate to fumarate (mmole succinate/mmole fumarate).
Bulk Solution in the Reactor
There were no chemical or microbial reactions in the bulk phase. Diffusion and advection are described by:
where C represents a substrate or metabolite (mM), DC is the diffusion coefficient of C (cm2/s), l is the length dimension of the NMR biofilm reactor (cm), and uL is the flow velocity of the growth medium (cm/s).
Model Implementation
The model was simulated using COMSOL® Multiphysics (Version 4.4.0.248, COMSOL®, Inc., Burlington, MA, USA), a finite element analysis software package, with the Chemical Reaction Engineering Module. An example COMSOL file with the complete model is provided in the Supplementary Material. The model geometry is comprised of three rectangular domains as shown in Figure 3; the NMR biofilm reactor flow chamber (40 mm by 2 mm), the biofilm (5 mm by 0.1 mm), and the NMR bulk measurement voxel (2 mm by 2 mm).
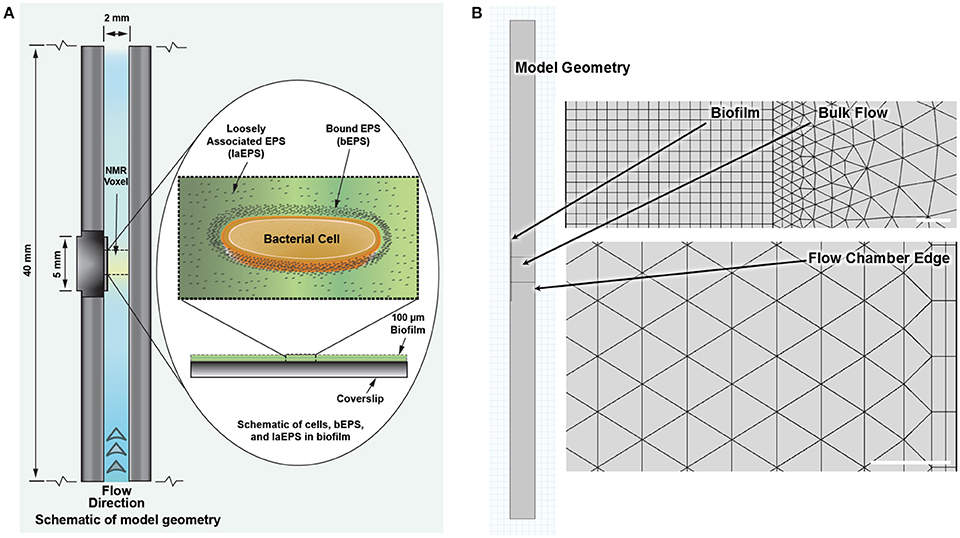
Figure 3. (A) Schematic of the NMR biofilm reactor with biofilm (not to scale). (B) Model geometry to scale as implemented in COMSOL, with representative close-ups of the finite element mesh for the reaction-diffusion physics (top) and the fluid flow physics (bottom). White bars represent 20 μm. Model file with these defined geometries and meshes is provided in the Supplementary Material.
Three coupled physics nodes are used, one Laminar Flow node and two Transport of Diluted Species nodes: one for transport and reaction of soluble species (e.g., SED), and one for reaction of soluble species (e.g., SU(VI)). Incompressible laminar flow is solved in all domains with no-slip wall conditions, except for in the biofilm, where it is assumed that mass transport only occurs via diffusion. The far downfield boundary is the fluid inlet, with a flow rate of 1 ml/h (0 ml/h during stop-flow simulation periods), and a constant parabolic flow profile is given by:
where V is the velocity (cm/h), Q is the volumetric flow rate (ml/h), A is the NMR biofilm reactor cross-sectional area (cm2), and y is the height from the bottom of the NMR biofilm reactor divided by 1 mm (unitless). Laminar flow with no-slip conditions is justified because of the low Reynold's number (0.1) in the NMR biofilm reactor (Renslow et al., 2010). The far upfield boundary is the outlet. The first Transport of Diluted Species node includes all soluble chemical species: lactate, acetate, fumarate, succinate, and U(VI). It is solved for in all domains and includes both convective and diffusive transport; however, the diffusion coefficients in the biofilm are different from those in the remainder of the NMR biofilm reactor (Table 1) and only diffusion (i.e., effective diffusion coefficients, due to biomass diffusion restriction and tortuosity effects) is considered inside the biofilm. The reactor walls are simulated as impermeable horizontal boundaries with no flux. Soluble species convection is coupled to values solved for in the Laminar Flow node. The initial concentrations and inlet concentrations are zero for all species except lactate, fumarate, and U(VI) (during simulations run with U(VI)). Metabolic reactions solved for in this node are contained only within the biofilm; no reactions occur in the NMR biofilm reactor bulk liquid. The second Transport of Diluted Species node is solved for all insoluble species, biomass, and U adsorption capacities; thus it is only applicable to the biofilm domain. Even though the node name implies mass transport, no mass transport was solved for because all species were immobile or insoluble, and only chemical reactions were considered.
Two separate finite element meshes were constructed, each corresponding to a step in the two-step solver: one for the stationary (steady state) flow profile solver and the other for the time-dependent solver. It is possible to uncouple the solving of the flow profile from the other physics nodes because the flow profile does not change over time. Therefore, the steady state flow profile was solved first, and then the stored solution was used for the convection of chemical species in the time-dependent solver. Mesh analysis was done for each mesh, to ensure that enough elements were used to reach an accurate solution. For the initial model testing, an 8-core, 64-bit Microsoft Windows 7 Professional computer with 16 GB of RAM was used. Subsequently, higher-mesh models were run on Chinook, a Hewlett-Packard 163 teraflop/s supercluster, part of the Molecular Science Computing at the Environmental Molecular Sciences Laboratory at the Pacific Northwest National Laboratory. Each of the 2,310 nodes within Chinook had two quad-core AMD Opteron processors, 16 gigabytes of RAM, 350 gigabytes of local disk space, plus InfiniBand Host Channel Adapter. For the stationary solver mesh, the flow velocity at 100 randomly chosen points, selected using Matlab (The MathWorks, Inc., Natick, MA) function rand(): 0.034% modified to provide coordinates located on the NMR biofilm reactor domain, were used to monitor the convergence of the solution as the mesh elements were increased. Figure 4A shows the randomly chosen points. Starting with ~1.7 thousand elements, the number of mesh elements was roughly doubled or tripled each iteration, up to a maximum of ~11.1 million. Figures 4B,C shows that the average velocity and pressure of the 100 points reached asymptotic values, and it was determined that 1.3 million elements offered a balance between time and accuracy. This number of elements resulted in an average velocity solution that was 0.011% (magnitude) (σ: 0.034%) different from the full ~11.1 million element solution and an average pressure solution that was 0.056% (σ: 0.226%) different.

Figure 4. (A) The randomly chosen 100 points to monitor the convergence of the stationary (steady state) flow profile solver solution, (B) the relative average velocity convergence as the number of mesh elements was increased, and (C) the relative average pressure convergence. White dots represent the number of mesh elements used for the subsequent flow profile solutions throughout the manuscript (finite element mesh shown in Figure 3B).
For the time-dependent solver mesh, the concentration of each species was monitored at 300 randomly chosen points: 100 in the NMR biofilm reactor domain (Figure 5A), 100 in the NMR bulk measurement voxel (Figure 5B), and 100 in the biofilm domain (Figure 5C). The selection of these points was done using Matlab, and their selection was controlled to ensure that none of the three sets of 100 points overlapped with the other domains to cause redundancy. Starting with ~20.2 thousand elements, the number of mesh elements was roughly doubled each iteration, up to a maximum of ~3.6 million. Lactate, acetate, and cell concentrations were found to be the dependent variables most sensitive to changes in the number of elements and also the slowest to converge to the asymptotic value; therefore they were used for the mesh selection criteria. Figure 5D shows that the dependent variables reached an asymptotic convergence, and it was determined that ~130 thousand elements offered a balance between time and accuracy. This number of elements resulted in a solution that was 0.005% (σ: 0.007%), 0.034% (σ: 0.050%), and 0.003% (σ: 0.001%) different from the full ~3.6 million element solution for the average lactate concentration, acetate concentration, and cell concentration, respectively.
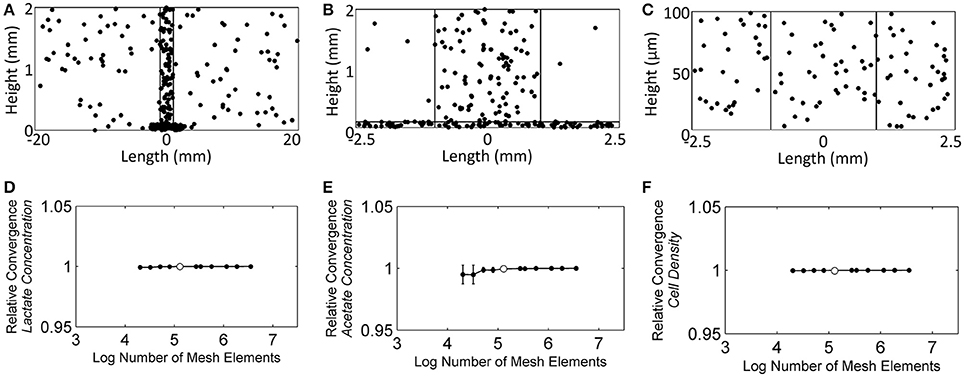
Figure 5. The randomly chosen 300 points to monitor the convergence of the solution, (A) the NMR biofilm reactor domain, (B) the NMR bulk measurement voxel, and (C) the biofilm domain. (D) The relative average lactate concentration convergence as the number of mesh elements was increased, (E) the relative average acetate concentration convergence, and (F) the relative average cell concentration convergence. White dots represent the number of mesh elements used for the subsequent reaction-diffusion solutions throughout the manuscript (finite element mesh shown in Figure 3B).
Data were exported from COMSOL® to a text file. For some graphs, a Python (v2.7.10) script was then written using WinPython (v2.7.10.3) (Raybaut1) to import and graph these data in a basic plot. IPython (v4.0.0) (Fernando Pérez, 2007), a powerful, interactive shell, was used within the Scientific Python Development Environment Spyder (v3.0.0.dev0) (Raybaut, 2009). Two modules were also needed for the processing of data: (i) Numpy (v1.9.3) (Walt et al., 2011) was used to store the data in a matrix that is easy to search and plot; it was also used for its wide variety of functions that can be used to process matrices. (ii) Matplotlib (v1.5.0rc3) (Droettboom et al., 2015) was used to plot the data. These plots were then saved and imported into Adobe Illustrator CS6 (v16.0.5) (Licensors, 2012) for final polishing. For other plots, the data were imported into Matlab for data processing, graphing, and analysis.
Results and Discussion
Substrate Utilization and Metabolite Production Kinetics in the Absence of U under the Stop-Flow Condition
Figure 6 shows the experimental data compared to the model predictions for the experimentally determined substrate (lactate and fumarate) utilization and metabolite (acetate and succinate) production kinetics (as shown in concentration changes over time) for an S. oneidensis MR-1 biofilm under the anaerobic condition (R2 = 0.97). The parameters derived from the experimental data and the values from the literature were not significantly different from each other, except the fAc/ED value, which was significantly lower than the value obtained from a similar experiment by Cao et al. (2012) (Table 3). The maximum specific growth rate calculated from the model cell yield and maximum specific substrate utilization rate was 0.08 h−1, which is close to the reported value of 0.087–0.125 h−1 (Tang et al., 2007a; Hunt et al., 2010). The maximum specific growth rate of bacteria in biofilm is usually close to or identical to that found in suspension cultures (Characklis, 1990; Okabe et al., 1994; Nielsen et al., 1997).
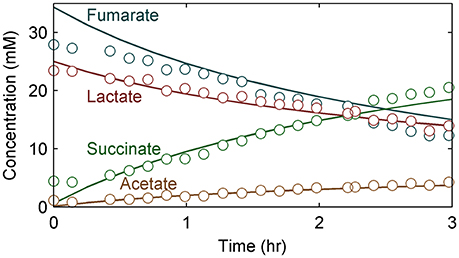
Figure 6. Substrate (lactate and fumarate) and metabolite (acetate and succinate) concentration changes over time for S. oneidensis MR-1 biofilms. Circles represent experimental data; lines represent model values. Time 0 h corresponds to the beginning of the stop-flow experiment in this figure and subsequent figures.
The half saturation constant for lactate (KED = 14.5 mM) was calculated from the model using experimental data. The estimated KED value is comparable with the literature value for S. oneidensis MR-1 under the aerobic condition (13.2 mM) using lactate as the electron donor (Tang et al., 2007b). The experimental values for the stoichiometric coefficients for fEA/ED, fSuc/EA, and fAc/ED were 1.70, 0.91, and 0.34, respectively. The measured values for fEA/ED and fSuc/EA were similar to the literature values of 1.63 and 0.90, respectively, but the fAc/ED value of 0.34 was lower than 0.47, the value obtained from a similar experiment by Cao et al. (2012). The values may be different because S. oneidensis cells incompletely oxidize lactate to acetate with fumarate as the electron acceptor. There are two possible explanations for this: (1) In our experimental setup there is some minimal O2 in the medium, as air slowly diffuses through the tubing into the growth medium, which enables lactate to be completely oxidized to CO2. In our previous work we estimated oxygen intrusion and found that this can be ignored (Renslow R. S. et al., 2013). (2) The discrepancy is due to the metabolic heterogeneity in biofilms, as we assumed constant parameter values throughout, whereas real biofilms have variable metabolic activities based on the microenvironment and variable physiologic state of the cells.
Cells and EPS Production Kinetics in the Absence of U under the Stop-Flow Condition
Figure 7 shows the S. oneidensis MR-1 biofilm cell and EPS density changes over time in the absence of U. These changes were not significant during the short experimental time period. EPS hydrolysis and cell decay were not considered in this model because of the short experimental time frame. Also, cell detachment from the biofilms and loss of bEPS due to diffusion were not considered in this model because the experiment was carried out at a low Reynold's number (0.1) and over a short period of time. Since decay, hydrolysis, and detachment were considered to be negligible, the cell and EPS densities increased with time. Average cell and EPS (bEPS and laEPS) production decreased slightly, possibly because of U inhibition of cell growth.
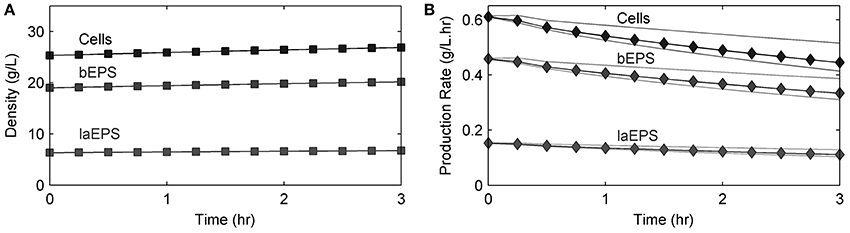
Figure 7. Model results of (A) cells and EPS density changes over time and (B) average cell and EPS production rates (black lines) over time in an S. oneidensis MR-1 biofilm in the absence of U. Gray lines show the minimum and maximum values found within the biofilm.
Substrate Utilization and Metabolite Production Kinetics in the Presence of U under the Stop-Flow Condition
Figure 8 shows the model predictions for substrate (lactate and fumarate) utilization, metabolite (acetate and succinate) production and U(VI) immobilization kinetics (as shown in concentration changes over time) in S. oneidensis MR-1 biofilm. Substrate utilization and metabolite production were minimally affected by the presence of U(VI), most likely because of the short exposure time. The literature parameters relevant to U(VI) adsorption and reduction were used (Table 2) for the initial prediction of the concentration profiles. Our model predicts the actual concentration trends. Figure 9 shows the total accumulation of U (U(IV) + U(VI)) in cells, bEPS, and laEPS over time in an S. oneidensis MR-1 biofilm. The model prediction revealed both EPS and cells play an important role in overall U immobilization.
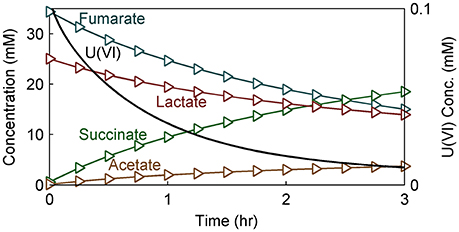
Figure 8. Model results of substrate (lactate and fumarate), metabolite (acetate and succinate), and U(VI) concentration within the NMR measurement voxel over time in modeled S. oneidensis MR-1 biofilm.
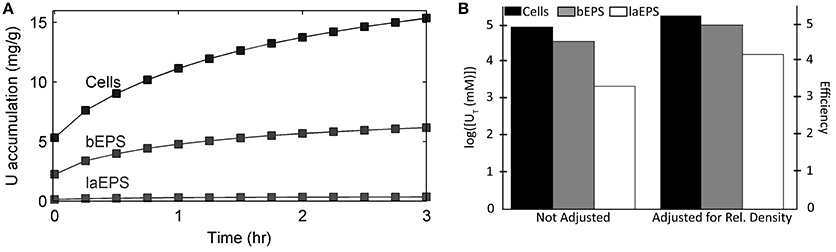
Figure 9. Model results of U accumulation in S. oneidensis MR-1 biofilm cells, bEPS, and laEPS under stop-flow condition. (A) Accumulation over time per total biofilm biomass. (B) Log transformed concentration of U accumulated after 3 h. The bars on the left show the values without any kind of adjustment. The bars on the right show the values divided by the percent abundance of that component. Percent abundance was calculated by dividing the concentration of the single component by the total concentration of the biomass.
Two-Dimensional U Distribution
Figure 10 shows the 2D distribution of each species of U in each of the biomass components after 3 h of exposure. In each case U is bound preferentially at the edges and the top of the biofilm, which is the bulk liquid/biofilm interface (also refer to Figure 11A). U is prevented from penetrating deep into the biofilm by rapid immobilization at the top: 89% of the immobilized U was in the top 10 μm of the biofilm. This was to be expected since experimental results on other biofilms, even other species, immobilizing U have shown U does not penetrate deep into biofilms. This aids in the ability of biofilms to resist toxins relative to planktonic cells and limits U from inhibiting cell growth. Also, by comparing the difference between U(VI) and U(IV) concentrations over time, we can see most U is reduced, even early on in the simulation (Figure 11B). In our model, the majority of uranium present within the biofilm was reduced rather than sorbed. This is similar to results for another dissimilatory metal-reducing bacteria capable of reducing U, Geobacter sulfurreducens (Renslow R. S. et al., 2013; Cologgi et al., 2014). Cologgi et al. (2014) demonstrated that biofilms and EPS provide cells with a physically and chemically protected environment, which is at least partially due to restricted transport of potentially harmful compounds. In conclusion, U did not dramatically affect overall cell growth or metabolism in biofilms, largely because U did not penetrate very far into the biofilm, indicating the protective ability of the biofilm. This is mostly because reduced U is solid and cannot diffuse toward the cell and their toxicity will be limited (Cao et al., 2010, 2011a).
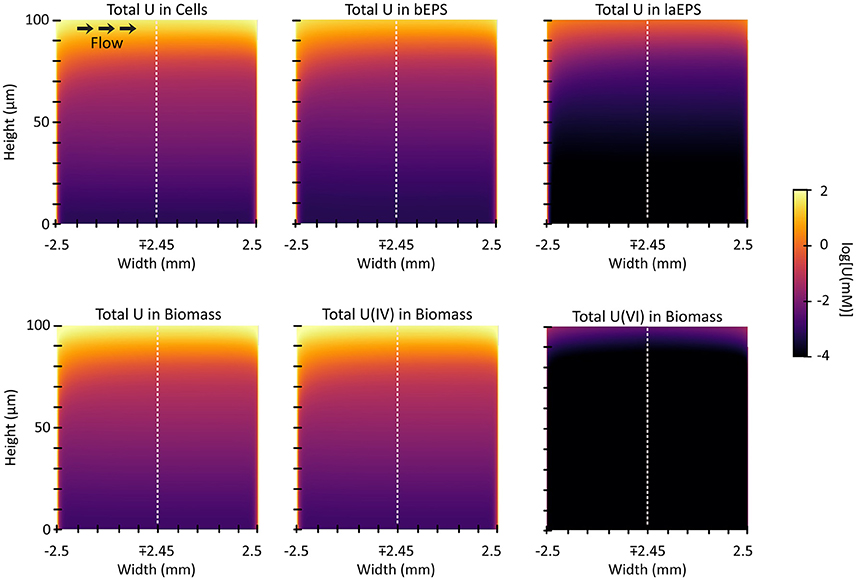
Figure 10. The 2D distribution of U after 3 h of exposure. The top three plots show the total of U species [immobilized U(VI) and reduced U, U(IV)] in each biomass component. The bottom three plots show the total and separate concentrations of the species of U in the biomass (cells and EPS added together).
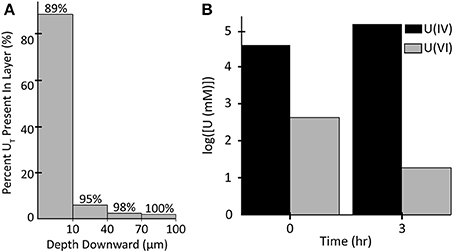
Figure 11. (A) Percentage of the total amount of uranium accumulated in (horizontal) slices of the biofilm after 3 h. The percentage above each bar represents the total percentage of uranium up to that depth. (B) Log transforms of the concentrations of U(IV) and U(VI) in all biomass at 0 and 3 h.
Practical Implications
In this study, experimental data were used to derive important biofilm parameters, develop a 2D model of biofilm immobilizing U, and demonstrate application of this model using an S. oneidensis MR-1 biofilm. This same model can be used for other microbial biofilms immobilizing various metals as long as the biokinetic parameters are available. It can be used to estimate the time needed to saturate the biofilm with metal, estimate the maximum immobilization capacity, and determine the importance of the parameters as described recently (Renslow R. et al., 2013).
Here, we developed a laboratory-based model to predict substrate utilization and metabolite production from the experimental data of a biofilm growing in the absence or presence of uranium. Our model is one of the first steps needed to predict U immobilization in biofilms grown on inert surfaces. However, it will need further improvements to have the capability to include multi-species biofilms growing in the subsurface for practical applications and it needs to be extended to the multi-scale in order to determine the effect of U immobilization on the ecosystem. We believe our model is an important first step based on the experimental data, which could critically contribute toward this long-term goal. Our model is sufficiently robust and flexible that it can be modified to include the multiple species or metabolisms that may exist under bioremediation or natural scenarios such as that at DOE's Rifle and Hanford Sites, respectively (Zachara et al., 2013). However, in order to use it, the researchers need to determine what parameters and respective values need to be used for the field site to make accurate predictions of U fate and transport. For example, biokinetic parameters can be calculated from laboratory scale experiments simulating field conditions. It would be possible to integrate our model with reactive transport models such as the one presented in Zachara et al. (2016) to include microbial bioreductive mechanisms and their impacts on U(VI) transport (Zachara et al., 2016).
Conclusions
With the developed model, we were able to predict substrate utilization and metabolite production from the experimental data on a biofilm growing in the absence or presence of U. From our model predictions, we conclude that
• Although EPS immobilize U, the dominant U immobilization is due to cells. They are the most abundant component within the biofilm and also the most efficient at immobilizing U. As for EPS, bEPS are about 40% as efficient as cells and laEPS are about 2% as efficient as cells at immobilizing U.
• 89% of the immobilized U was in the top 10 μm of the biofilm.
• U did not affect cell growth or metabolism in S. oneidensis biofilms, largely because it did not penetrate far enough into the biofilm studied here.
• The growth kinetics estimated for S. oneidensis biofilms growing without U are not significantly different from those of planktonic cultures.
• Almost all U is reduced to U(IV) rather than simply immobilized. In our model, the majority of uranium present within the biofilm was reduced.
Author Contributions
All authors listed, have made substantial, direct, and intellectual contribution to the work, and approved it for publication.
Conflict of Interest Statement
The authors declare that the research was conducted in the absence of any commercial or financial relationships that could be construed as a potential conflict of interest.
Acknowledgments
The research was supported by the U.S. DOE Office of Biological and Environmental Research under the Subsurface Biogeochemistry Research (SBR) Program (grant DE-FG92-08ER64560), the DOE-BER SBR Program's Scientific Focus Area (SFA) at the Pacific Northwest National Laboratory (PNNL), and a NIEHS/NIH grant (21R01ES017070-01). Beyenal acknowledges partial support from the National Institute of Environmental Health Sciences (grant R25ES23632). A portion of the research was performed in the William R. Wiley Environmental Molecular Sciences Laboratory (EMSL), a national scientific user facility sponsored by the DOE's Office of Biological and Environmental Research and located at PNNL. The COMSOL® calculations were performed using the Chinook supercomputer, part of Molecular Science Computing at EMSL. PNNL is operated by Battelle for the DOE under Contract DE-AC05-76RL01830. RR was supported by a Linus Pauling Distinguished Postdoctoral Fellowship at PNNL and also gratefully acknowledges the financial support provided by the National Institutes of Health (NIH) Protein Biotechnology Training program, grant #T32-GM008336.
Supplementary Material
The Supplementary Material for this article can be found online at: http://journal.frontiersin.org/article/10.3389/fenvs.2017.00030/full#supplementary-material
Footnotes
1. ^Raybaut, P. WinPython [Online]. GitHub. Available: https://winpython.github.io/#overview [Accessed].
References
Alberty, R. A., and Hammes, G. G. (1958). Application of the theory of diffusion-controlled reactions to enzyme kinetics. J. Phys. Chem. 62, 154–159. doi: 10.1021/j150560a005
Bader, F. G. (1978). Analysis of double substrate limited growth. Biotechnol. Bioeng. 20, 183–202. doi: 10.1002/bit.260200203
Beyenal, H., Sani, R. K., Peyton, B. M., Dohnalkova, A. C., Amonette, J. E., and Lewandowski, Z. (2004). Uranium immobilization by sulfate-reducing biofilms. Environ. Sci. Technol. 38, 2067–2074. doi: 10.1021/es0348703
Brina, R., and Miller, A. G. (1992). Direct detection of trace levels of uranium by laser-induced kinetic phosphorimetry. Anal. Chem. 64, 1413–1418. doi: 10.1021/ac00037a020
Cao, B., Ahmed, B., and Beyenal, H. (2010). “Immobilization of uranium in groundwater using biofilms,” in Emerging Environmental Technologies, Vol. II, ed V. Shah (Dordrecht: Springer), 1–37.
Cao, B., Ahmed, B., Kennedy, D. W., Wang, Z. M., Shi, L., Marshall, M. J., et al. (2011a). Contribution of extracellular polymeric substances from Shewanella sp. HRCR-1 biofilms to U(VI) immobilization. Environ. Sci. Technol. 45, 5483–5490. doi: 10.1021/es200095j
Cao, B., Majors, P. D., Ahmed, B., Renslow, R. S., Silvia, C. P., Shi, L., et al. (2012). Biofilm shows spatially stratified metabolic responses to contaminant exposure. Environ. Microbiol. 14, 2901–2910. doi: 10.1111/j.1462-2920.2012.02850.x
Cao, B., Shi, L. A., Brown, R. N., Xiong, Y. J., Fredrickson, J. K., Romine, M. F., et al. (2011b). Extracellular polymeric substances from Shewanella sp. HRCR-1 biofilms: characterization by infrared spectroscopy and proteomics. Environ. Microbiol. 13, 1018–1031. doi: 10.1111/j.1462-2920.2010.02407.x
Characklis, W. G. (1990). “Kinetics of microbial transformations,” in Biofilms, eds W. G. Characklis and K. C. Marshall (New York, NY: John Wiley & Sons, Inc), 233–264.
Cologgi, D. L., Speers, A. M., Bullard, B. A., Kelly, S. D., and Reguera, G. (2014). Enhanced uranium immobilization and reduction by geobacter sulfurreducens biofilms. Appl. Environ. Microbiol. 80, 6638–6646. doi: 10.1128/AEM.02289-14
Costerton, J. W., Lewandowski, Z., Caldwell, D. E., Korber, D. R., and Lappinscott, H. M. (1995). MICROBIAL BIOFILMS. Annu. Rev. Microbiol. 49, 711–745. doi: 10.1146/annurev.mi.49.100195.003431
Cussler, E. L., and Breuer, M. M. (1972). Accelerating diffusion with mixed solvents. AIChE J. 18, 812–816. doi: 10.1002/aic.690180425
Droettboom, M., Hunter, J., Caswell, T. A., Firing, E., Elson, P., Dale, D., et al. (2015). matplotlib: matplotlib v1.5.0. Zenodo.
Fernando Pérez, B. E. G. (2007). IPython: a system for interactive scientific computing. Comput. Sci. Eng. 9, 21–29. doi: 10.1109/MCSE.2007.53
Gregusova, M., and Docekal, B. (2011). New resin gel for uranium determination by diffusive gradient in thin films technique. Anal. Chim. Acta 684, 142–146. doi: 10.1016/j.aca.2010.11.002
Ha, J., Gélabert, A., Spormann, A. M., and Brown Jr, G. E. (2010). Role of extracellular polymeric substances in metal ion complexation on Shewanella oneidensis: batch uptake, thermodynamic modeling, ATR-FTIR, and EXAFS study. Geochim. Cosmochim. Acta 74, 1–15. doi: 10.1016/j.gca.2009.06.031
Harrison, J. J., Ceri, H., and Turner, R. J. (2007). Multimetal resistance and tolerance in microbial biofilms. Nat. Rev. Microbiol. 5, 928–938. doi: 10.1038/nrmicro1774
Hazen, T., and Tabak, H. (2005). Developments in bioremediation of soils and sediments polluted with metals and radionuclides: 2. field research on bioremediation of metals and radionuclides. Rev. Environ. Sci. Bio/Technol. 4, 157–183. doi: 10.1007/s11157-005-2170-y
Hunt, K. A., Flynn, J. M., Naranjo, B., Shikhare, I. D., and Gralnick, J. A. (2010). Substrate-level phosphorylation is the primary source of energy conservation during anaerobic respiration of Shewanella oneidensis strain MR-1. J. Bacteriol. 192, 3345–3351. doi: 10.1128/JB.00090-10
Kazy, S. K., Sar, P., and D'souza, S. F. (2008). Studies on uranium removal by the extracellular polysaccharide of a Pseudomonas aeruginosa Strain. Bioremed. J. 12, 47–57. doi: 10.1080/10889860802052870
Kim, H. (1974). Diffusion studies of the systems water-succinic acid-urea and water-succinic acid at 25°C: the effect of complex formation on the diffusion coefficients of the ternary system. J. Solut. Chem. 3, 271–287. doi: 10.1007/BF00648226
Kumar, R., Singh, S., and Singh, O. V. (2007). Bioremediation of radionuclides: emerging technologies. OMICS 11, 295–304. doi: 10.1089/omi.2007.0013
Laspidou, C. S., and Rittmann, B. E. (2002). Non-steady state modeling of extracellular polymeric substances, soluble microbial products, and active and inert biomass. Water Res. 36, 1983–1992. doi: 10.1016/S0043-1354(01)00414-6
Li, R., Auchtung, J. M., Tiedje, J. M., and Worden, R. M. (2011). Shewanella oneidensis MR-1 chemotaxis in a diffusion gradient chamber. Environ. Sci. Technol. 45, 1014–1020. doi: 10.1021/es102425p
Liu, C., Gorby, Y. A., Zachara, J. M., Fredrickson, J. K., and Brown, C. F. (2002). Reduction kinetics of Fe(III), Co(III), U(VI), Cr(VI), and Tc(VII) in cultures of dissimilatory metal-reducing bacteria. Biotechnol. Bioeng. 80, 637–649. doi: 10.1002/bit.10430
Liu, Y., Gao, W., Wang, Y., Wu, L., Liu, X., Yan, T., et al. (2005). Transcriptome analysis of Shewanella oneidensis MR-1 in response to elevated salt conditions. J. Bacteriol. 187, 2501–2507. doi: 10.1128/JB.187.7.2501-2507.2005
Luo, J., Weber, F. A., Cirpka, O. A., Wu, W. M., Nyman, J. L., Carley, J., et al. (2007). Modeling in-situ uranium(VI) bioreduction by sulfate-reducing bacteria. J. Contam. Hydrol. 92, 129–148. doi: 10.1016/j.jconhyd.2007.01.004
Majors, P. D., Mclean, J. S., Pinchuk, G. E., Fredrickson, J. K., Gorby, Y. A., Minard, K. R., et al. (2005). NMR methods for in situ biofilm metabolism studies. J. Microbiol. Methods 62, 337–344. doi: 10.1016/j.mimet.2005.04.017
Marshall, M. J., Beliaev, A. S., Dohnalkova, A. C., Kennedy, D. W., Shi, L., Wang, Z. M., et al. (2006). c-Type cytochrome-dependent formation of U(IV) nanoparticles by Shewanella oneidensis. PLoS Biol. 4, 1324–1333. doi: 10.1371/journal.pbio.0040268
Mclean, J. S., Majors, P. D., Reardon, C. L., Bilskis, C. L., Reed, S. B., Romine, M. F., et al. (2008a). Investigations of structure and metabolism within Shewanella oneidensis MR-1 biofilms. J. Microbiol. Methods 74, 47–56. doi: 10.1016/j.mimet.2008.02.015
Mclean, J. S., Ona, O. N., and Majors, P. D. (2008b). Correlated biofilm imaging, transport and metabolism measurements via combined nuclear magnetic resonance and confocal microscopy. ISME J. 2, 121–131. doi: 10.1038/ismej.2007.107
Merroun, M. L., and Selenska-Pobell, S. (2008). Bacterial interactions with uranium: an environmental perspective. J. Contam. Hydrol. 102, 285–295. doi: 10.1016/j.jconhyd.2008.09.019
Middleton, S. S., Latmani, R. B., Mackey, M. R., Ellisman, M. H., Tebo, B. M., and Criddle, C. S. (2003). Cometabolism of Cr(VI) by Shewanella oneidensis MR-1 produces cell-associated reduced chromium and inhibits growth. Biotechnol. Bioeng. 83, 627–637. doi: 10.1002/bit.10725
Myers, C. R., Carstens, B. P., Antholine, W. E., and Myers, J. M. (2000). Chromium(VI) reductase activity is associated with the cytoplasmic membrane of anaerobically grown Shewanella putrefaciens MR-1. J. Appl. Microbiol. 88, 98–106. doi: 10.1046/j.1365-2672.2000.00910.x
Myers, C. R., and Nealson, K. (1988). Bacterial manganese reduction and growth with manganese oxide as the sole electron acceptor. Science 240, 1319–1321. doi: 10.1126/science.240.4857.1319
Nealson, K., Belz, A., and Mckee, B. (2002). Breathing metals as a way of life: geobiology in action. Antonie Van Leeuwenhoek 81, 215–222. doi: 10.1023/A:1020518818647
Nealson, K. H., and Saffarini, D. (1994). Iron and manganese in anaerobic respiration - environmental significance, physiology, and regulation. Annu. Rev. Microbiol. 48, 311–343. doi: 10.1146/annurev.mi.48.100194.001523
Nealson, K., and Scott, J. (2006). “Ecophysiology of the Genus Shewanella,” in The Prokaryotes, ed M. Dworkin. (New York, NY: Springer-NY, LLC), 1133–1151.
Ng, D. H. P., Kumar, A., and Cao, B. (2016). Microorganisms meet solid minerals: interactions and biotechnological applications. Appl. Microbiol. Biotechnol. 100, 6935–6946. doi: 10.1007/s00253-016-7678-2
Nielsen, P. H., Jahn, A., and Palmgren, R. (1997). Conceptual model for production and composition of exopolymers in biofilms. Water Sci. Technol. 36, 11–19. doi: 10.1016/S0273-1223(97)00318-1
Nyman, J. L., Wu, H. I., Gentile, M. E., Kitanidis, P. K., and Criddle, C. S. (2007). Inhibition of a U(VI)- and sulfate-reducing consortia by U(VI). Environ. Sci. Technol. 41, 6528–6533. doi: 10.1021/es062985b
Okabe, S., Nielsen, P. H., Jones, W. L., and Characklis, W. G. (1994). Estimation of cellular and extracellular carbon contents in sulfate-reducing bacteria biofilms by lipopolysaccharide assay and epifluorescence microscopic technique. Water Res. 28, 2263–2266. doi: 10.1016/0043-1354(94)90041-8
O'Toole, G., Kaplan, H. B., and Kolter, R. (2000). Biofilm formation as microbial development. Annu. Rev. Microbiol. 54, 49–79. doi: 10.1146/annurev.micro.54.1.49
Pinchuk, G. E., Geydebrekht, O. V., Hill, E. A., Reed, J. L., Konopka, A. E., Beliaev, A. S., et al. (2011). Pyruvate and lactate metabolism by Shewanella oneidensis MR-1 under fermentative, oxygen-limited and fumarate-respiring conditions. Appl. Environ. Microbiol. 77, 8234–8240. doi: 10.1128/aem.05382-11
Raybaut, P. (2009). Spyder - Documentation. Available online at: pythonhosted.org
Renshaw, J. C., Lloyd, J. R., and Livens, F. R. (2007). Microbial interactions with actinides and long-lived fission products. Comptes Rendus Chimie 10, 1067–1077. doi: 10.1016/j.crci.2007.02.013
Renslow, R., Babauta, J., Kuprat, A., Schenk, J., Ivory, C., Fredrickson, J., et al. (2013). Modeling biofilms with dual extracellular electron transfer mechanisms. Phys. Chem. Chem. Phys. 15, 19262–19283. doi: 10.1039/c3cp53759e
Renslow, R. S., Babauta, J. T., Dohnalkova, A. C., Boyanov, M. I., Kemner, K. M., Majors, P. D., et al. (2013). Metabolic spatial variability in electrode-respiring Geobacter sulfurreducens biofilms. Energy Environ. Sci. 6, 1827–1836. doi: 10.1039/c3ee40203g
Renslow, R. S., Babauta, J. T., Majors, P. D., Mehta, H. S., Ewing, R. J., Ewing, T. W., et al. (2014). A biofilm microreactor system for simultaneous electrochemical and nuclear magnetic resonance techniques. Water Sci. Technol. 69, 966–973. doi: 10.2166/wst.2013.802
Renslow, R. S., Majors, P. D., Mclean, J. S., Fredrickson, J. K., Ahmed, B., and Beyenal, H. (2010). In situ effective diffusion coefficient profiles in live biofilms using pulsed-field gradient nuclear magnetic resonance. Biotechnol. Bioeng. 106, 928–937. doi: 10.1002/bit.22755
Renslow, R. S., Marshall, M. J., Tucker, A. E., Chrisler, W. B., and Yu, X. Y. (2017). In situ nuclear magnetic resonance microimaging of live biofilms in a microchannel. Analyst doi: 10.1039/C7AN00078B. [Epub ahead of print].
Rittmann, E. B., and Perry, L. M. (2001). Environmental Biotechnology: Principles and Applications. New York, NY: McGraw-Hill Companies, Inc.
Sar, P., and D'souza, S. F. (2001). Biosorptive uranium uptake by a Pseudomonas strain: characterization and equilibrium studies. J. Chem. Technol. Biotechnol. 76, 1286–1294. doi: 10.1002/jctb.517
Shi, L., Dong, H. L., Reguera, G., Beyenal, H., Lu, A. H., Liu, J., et al. (2016). Extracellular electron transfer mechanisms between microorganisms and minerals. Nat. Rev. Microbiol. 14, 651–662. doi: 10.1038/nrmicro.2016.93
Shi, L., Rosso, K. M., Clarke, T. A., Richardson, D. J., Zachara, J. M., and Fredrickson, J. K. (2012). Molecular underpinnings of Fe(III) oxide reduction by Shewanella oneidensis MR-1. Front. Microbiol. 3:50. doi: 10.3389/fmicb.2012.00050
Stewart, P. S., and Franklin, M. J. (2008). Physiological heterogeneity in biofilms. Nat. Rev. Microbiol. 6, 199–210. doi: 10.1038/nrmicro1838
Tang, Y. J. J., Laidlaw, D., Gani, K., and Keasling, J. D. (2006). Evaluation of the effects of various culture conditions on Cr(VI) reduction by Shewanella oneidensis MR-1 in a novel high-throughput mini-bioreactor. Biotechnol. Bioeng. 95, 176–184. doi: 10.1002/bit.21002
Tang, Y. J., Meadows, A. L., and Keasling, J. D. (2007b). A kinetic model describing Shewanella oneidensis MR-1 growth, substrate consumption, and product secretion. Biotechnol. Bioeng. 96, 125–133. doi: 10.1002/bit.21101
Tang, Y. J., Meadows, A. L., Kirby, J., and Keasling, J. D. (2007a). Anaerobic central metabolic pathways in Shewanella oneidensis MR-1 reinterpreted in the light of isotopic metabolite Labeling. J. Bacteriol. 189, 894–901. doi: 10.1128/jb.00926-06
Truex, M. J., Peyton, B. M., Valentine, N. B., and Gorby, Y. A. (1997). Kinetics of U(VI) reduction by a dissimilatory Fe(III)-reducing bacterium under non-growth conditions. Biotechnol. Bioeng. 55, 490–496. doi: 10.1002/(SICI)1097-0290(19970805)55:3<490::AID-BIT4>3.0.CO;2-7
Venkateswaran, K., Moser, D. P., Dollhopf, M. E., Lies, D. P., Saffarini, D. A., Macgregor, B. J., et al. (1999). Polyphasic taxonomy of the genus Shewanella and description of Shewanella oneidensis sp. Int. J. Syst. Bacteriol. 49, 705–724. doi: 10.1099/00207713-49-2-705
Viamajala, S., Peyton, B. M., Apel, W. A., and Petersen, J. N. (2002). Chromate/nitrite interactions in Shewanella oneidensis MR-1: evidence for multiple hexavalent chromium [Cr(VI)] reduction mechanisms dependent on physiological growth conditions. Biotechnol. Bioeng. 78, 770–778. doi: 10.1002/bit.10261
Viamajala, S., Peyton, B. M., Sani, R. K., Apel, W. A., and Petersen, J. N. (2004). Toxic Effects of Chromium(VI) on Anaerobic and Aerobic Growth of Shewanella oneidensis MR-1. Biotechnol. Prog. 20, 87–95. doi: 10.1021/bp034131q
Vogt, S. J., Stewart, B. D., Seymour, J. D., Peyton, B. M., and Codd, S. L. (2012). Detection of biological uranium reduction using magnetic resonance. Biotechnol. Bioeng. 109, 877–883. doi: 10.1002/bit.24369
Wall, J. D., and Krumholz, L. R. (2006). Uranium reduction. Ann. Rev. Microbiol. 60, 149–166. doi: 10.1146/annurev.micro.59.030804.121357
Walt, S. V. D., Colbert, S. C., and Varoquaux, G. (2011). The NumPy array: a structure for efficient numerical computation. Comput. Sci. Eng. 13, 22–30. doi: 10.1109/MCSE.2011.37
Wen, Y. (2008). Inhibitory Effects Of Uranium(VI) on Bacterial Metabolism and Transcriptional Response of Shewanella oneidensis MR-1 to Uranium Stress. Ph.D. 3302883, Stanford, CA: Stanford University.
Xie, S., Yang, J., Chen, C., Zhang, X., Wang, Q., and Zhang, C. (2008). Study on biosorption kinetics and thermodynamics of uranium by Citrobacter freudii. J. Environ. Radioact. 99, 126–133. doi: 10.1016/j.jenvrad.2007.07.003
Zachara, J. M., Chen, X. Y., Murray, C., and Hammond, G. (2016). River stage influences on uranium transport in a hydrologically dynamic groundwater-surface water transition zone. Water Resour. Res. 52, 1568–1590. doi: 10.1002/2015WR018009
Zachara, J. M., Long, P. E., Bargar, J., Davis, J. A., Fox, P., Fredrickson, J. K., et al. (2013). Persistence of uranium groundwater plumes: contrasting mechanisms at two DOE sites in the groundwater-river interaction zone. J. Contam. Hydrol. 147, 45–72. doi: 10.1016/j.jconhyd.2013.02.001
Keywords: biofilm, bioremediation, EPS, modeling, Shewanella oneidensis, substrate utilization, uranium
Citation: Renslow RS, Ahmed B, Nuñez JR, Cao B, Majors PD, Fredrickson JK and Beyenal H (2017) Modeling Substrate Utilization, Metabolite Production, and Uranium Immobilization in Shewanella oneidensis Biofilms. Front. Environ. Sci. 5:30. doi: 10.3389/fenvs.2017.00030
Received: 26 January 2017; Accepted: 29 May 2017;
Published: 29 June 2017.
Edited by:
Rajesh K. Sani, South Dakota School of Mines and Technology, United StatesReviewed by:
Sema Sevinc Sengor, Southern Methodist University, United StatesTim Magnuson, Idaho State University, United States
Copyright © 2017 Renslow, Ahmed, Nuñez, Cao, Majors, Fredrickson and Beyenal. This is an open-access article distributed under the terms of the Creative Commons Attribution License (CC BY). The use, distribution or reproduction in other forums is permitted, provided the original author(s) or licensor are credited and that the original publication in this journal is cited, in accordance with accepted academic practice. No use, distribution or reproduction is permitted which does not comply with these terms.
*Correspondence: Haluk Beyenal, YmV5ZW5hbEB3c3UuZWR1
†Present Address: Bulbul Ahmed, Xylem Inc., Brown Deer, WI, United States
Bin Cao, School of Civil and Environmental Engineering and Singapore Centre for Environmental Life Sciences Engineering, Nanyang Technological University, Singapore, Singapore
Paul D. Majors, Bruker Biospin Corporation, Billerica, MA, United States