 Michael Riediker
 Yannick Franc4
 Murielle Bochud
- 1Institute of Occupational Medicine Singapore, Singapore, Singapore
- 2Institut Universitaire Romand de Santé au Travail, University of Lausanne, Lausanne, Switzerland
- 3School of Materials Science and Engineering, Nanyang Technological University, Singapore, Singapore
- 4Institut Universitaire de Médecine Sociale et Préventive, University of Lausanne, Lausanne, Switzerland
- 5Federal Office for the Environment, Bern, Switzerland
Introduction: Heart Rate Variability (HRV) reflects the adaptability of the heart to internal and external stimuli. Reduced HRV is a predictor of post-infarction mortality. We previously found in road maintenance workers HRV-increases several hours after exposure to fine particulate matter (PM2.5). This seemed to conflict with studies where PM-exposure acutely reduced HRV. We therefore assessed whether time from exposure to HRV-assessment could explain the differences observed.
Methods: On five non-consecutive days, workers carried nephelometers providing 1-min-interval PM2.5-exposure. Five-min HRV-intervals of SDNN (Standard Deviation of Normal to Normal beat intervals) and pNN50 (Percentage of the interval differences exceeding 50 ms) were extracted from 24-h electrocardiograms (ECGs). Following 60 min PM2.5-exposure, changes in HRV-parameters were assessed during 120-min visually and by regression analysis with control for time at work, at home, and during the night using autoregressive integrating moving average (ARIMA) models to account for autocorrelation of the time-series. Additional controls included changing the time windows and including body mass index (BMI) and age in the models.
Result: Pattern analysis of 12,669 data points showed high modulation of mean, standard deviation (SD), and time trend of HRV (SDNN and pNN50) at low, and much reduced modulation at high PM2.5-exposures. The time trend following exposure was highly symmetrical, resembling a funnel plot. Regression analysis showed significant associations of decreasing SDNN and pNN50 (average, SD, and absolute value of time trend) with increasing PM2.5-exposure, which remained significant when controlling for activity phases. Changing time windows did not change the pattern of response. Including BMI and age did not change the results.
Conclusions: The reduced modulation of HRV following PM2.5-exposure is striking. It suggests strong interference with homeostatic controls. Such an interference would represent a serious bodily burden, and could help explain acute cardiac events. In this model, the increase of HRV several hours later would reflect a recovery response.
Introduction
Heart Rate Variability (HRV) describes the variation of the timing between individual heart beats. It is a consequence of the heart's response to a series of internal and external stimuli such as respiration, baroreceptor feedback loop, and parasympathetic and sympathetic nervous system activity (Billman, 2011; Shaffer et al., 2014). Elevated HRV is a sign for a healthy cardiovascular system, while reduced HRV is a predictor of post-infarct mortality (Billman, 2011), cardiac events in healthy individuals (Tsuji et al., 1996), and incident heart failure in older at-risk adults (Patel et al., 2017). Most commonly assessed are the time- or the frequency-domain of HRV, though a large number of mathematical and statistical approaches are available (Electrophysiology Taskforce Guidelines, 1996; Sassi et al., 2015). Amongst the frequently used time domain parameters are SDNN (Standard Deviation of Normal to Normal beat intervals) and pNN50 (Percentage of the interval differences exceeding 50 ms): SDNN was found to reflect overall autonomic activity and cardiovascular fitness (Electrophysiology Taskforce Guidelines, 1996; Tsuji et al., 1996; Da Silva et al., 2015), While PNN50 is frequently used to assess parasympathetic activity (Ewing et al., 1984; Electrophysiology Taskforce Guidelines, 1996; Tsuji et al., 1996; Mietus et al., 2002).
Fine particulate matter (PM) on roads originates to an important part from traffic and combustion engines which release particles and precursors of secondary aerosols into the air (Riediker et al., 2003; Putaud et al., 2010; Meier et al., 2013). High concentrations occur in particular along busy roads such as highways, which are depending on factors such as traffic counts but also weather and wind (Imhof et al., 2005; Zwack et al., 2011). Workers maintaining the highways will experience exposure to PM2.5 that originates from the general background, from the passing traffic and also the different work tasks (Meier et al., 2013). Exposure to airborne PM is a well-established risk for human health (Brook et al., 2010; Landrigan et al., 2017), in particular fine (PM2.5) and ultrafine PM increases both short- and long-term cardiovascular risk. PM negatively affects cardiovascular risk factors (reviewed by Brook et al., 2010) such as inflammation (Tsai et al., 2012a), sodium regulation by the kidney (Tsai et al., 2012b), pulse pressure (Tsai et al., 2015), and metabolic syndrome (Brook et al., 2013; Devlin et al., 2014). PM is associated with cardiac arrhythmias (Kowalska and Kocot, 2016; Mordukhovich et al., 2016; Song et al., 2016), arrhythmic events are more frequently detected and treated by implanted cardioverter-defibrillators (Dockery et al., 2005; Metzger et al., 2007; Link et al., 2013), and people spending time in traffic are more likely to suffer a heart attack within the hour (Peters et al., 2004). In line with these ill-health effects of PM was the observation that PM2.5 exposure is associated with reduced HRV: in controlled exposure of rats to PM2.5, HRV was reduced during ongoing exposure (Wagner et al., 2014). In a series of epidemiological (Pope et al., 2003; Wu et al., 2010; Huang et al., 2014; Nyhan et al., 2014; Mordukhovich et al., 2015; Lee et al., 2016) as well as controlled PM-exposure (Devlin et al., 2003; Weichenthal et al., 2014; Cole-Hunter et al., 2015; Hemmingsen et al., 2015) studies, small reductions in HRV within an hour after PM exposure were observed. However, a recent meta-analysis of panel studies investigating HRV effects of PM2.5 (Buteau and Goldberg, 2016) questioned the association between PM2.5 and frequently used indices of HRV. Indeed, in our own two studies in healthy workers, we had found increased HRV (SDNN and PNN50) in the morning after exposure to traffic particles (Riediker et al., 2004a,b; Riediker, 2007; Meier et al., 2014). In the study with highway patrol troopers, we had also assessed an intermediary point at the end of the working day, which was well after peak rush hour exposure (Riediker et al., 2004a). At that intermediary point, no associations between PM2.5 and HRV were observed. The time from exposure to HRV analysis varies strongly between studies, an aspect that was not further assessed in the aforementioned review (Buteau and Goldberg, 2016). In this study, we aimed to understand if differences in time from exposure until the HRV-response assessment could explain the differences in HRV-association with PM2.5. For this purpose, we assessed the immediate HRV response to particles by analyzing the time-series of electrocardiograms (ECGs) and PM2.5 obtained in the highway maintenance workers study (Meier et al., 2014) where we had found increases of HRV in the morning after exposure. In addition, we aimed to better understand the way HRV was acutely changed and thus assessed (in addition to changes in average HRV) also the modulation of HRV over a 2-h time window following exposure and the time-trend of the series of 5-min averages of HRV during this time window.
Methods
We analyzed PM2.5-exposure and ECG data collected from a panel of 18 healthy male Swiss highway maintenance workers from 10 different maintenance centers in western Switzerland. The study was approved by the Ethics Committee of the University of Lausanne. All subjects gave written informed consent prior to participation in the study. The here presented analysis focused on the effects of continuously measured PM2.5 on HRV. The methodology to collect exposure (Meier et al., 2013) and health (Meier et al., 2014) data was previously described in detail. Briefly, subjects were equipped in the morning before the start of their work with small devices to record ECG and personal PM2.5-exposure for 24-h. Twelve ECG leads were attached by a trained researcher, then connected to a. digital ECG Holter monitor recorder (H12+ Digital, Mortara Instrument, Inc., Milwaukee, WI, USA).The high-resolution ECG records were afterwards processed with H-Scribe+ software, and inspected manually by an experienced cardiologist (Wayne E. Cascio, U.S. EPA, Chapel Hill, NC, USA) to remove artifacts and non-normal beats. Processed ECG-derived HRV data was recorded at 5-min resolution. PM2.5 was measured at 1-min resolution by light scattering nephelometers (DataRam pDR1000, Thermo Scientific, Waltham, MA, USA). This averaging time gives a precision of ±0.2% of reading or ±0.005 mg/m3, whichever is larger (manufacturer specification). We further improved the readout by correcting if for humidity (Richards, 1999). The monitor was attached to the body near the breathing zone while the worker was awake; and placed on the bed side table during sleep. The 1-min recordings were condensed into 5-min average intervals so that they matched the time intervals of the ECGs. Logbooks were used to identify activity phases at work, at home and at night, defined as the time between 22:00 and 06:00. Subjects participated up to five times on non-consecutive days.
Statistical Analyses
From the time-series of PM2.5 recordings, moving average concentrations were calculated for 60-min time-windows. From the HRV-recordings (5-min interval SDNN and pNN50), the following summary variables were calculated for moving time-windows of 120 min: mean HRV-value, Standard Deviation (SD) of the HRV, the time-trend (expressed as the slope over time) of HRV during this time window and the absolute value of the time trend. These HRV summary-variables were compared to the preceding PM2.5-exposure (example shown in Figure 1). The time intervals were defined based on the hypothesis that effects would occur already within the first 2-h after exposure, and the attempt to have a sufficiently large number of data-points per interval to allow for a robust assessment. The consequences of changing the averaging intervals were tested in a sensitivity analysis. The influence of activity phase at the moment of exposure (at work, home, or night) was assessed both, by stratification and calculation of the effect estimates for each strata, and by including activity phase as a co-factor in the models. The ARIMA methodology was used to account for second-order autocorrelation of the time-series. The models were computed individually for each person and the resulting coefficients were combined using a meta-analysis approach to obtain the population coefficients and variances. To account for the skewed distribution, PM2.5 was log-transformed (in basis 2) when fitting the models. To enable a comparison among results involving different cardiac parameters, all these parameters were standardized for each individual by subtracting the mean from the individual observations and dividing the difference by the parameter's SD. The potential influence of age and body mass index (BMI) on the individuals' effect estimates was assessed by using Spearman rank test. Calculations were performed using the basic functions of the R statistical software package Forecast version 7.3.
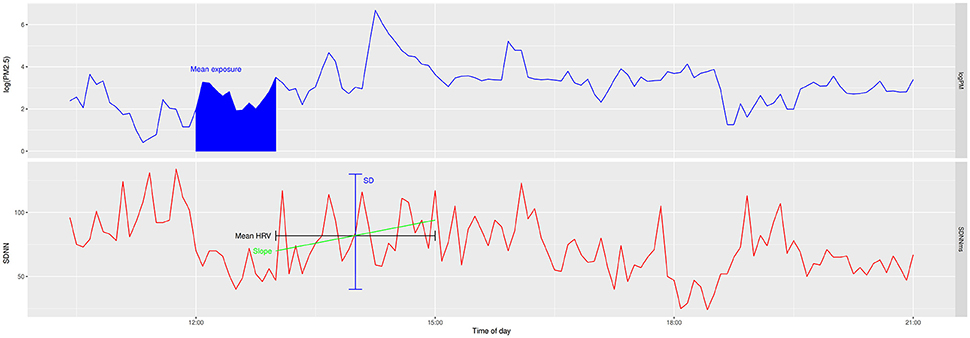
Figure 1. Example of a time series of PM2.5 and HRV of one 24-h recording of one subject. Upper: PM2.5, Lower: SDNN. The mean exposure over 1-h was compared to mean, standard deviation (SD), and slope of HRV in the 2-h following the exposure.
Results
Data were collected on 50 days from 18 workers, resulting in 88 personal observation-days. On 77 of these days both, valid PM2.5 and HRV data were available to calculate HRV and PM2.5 parameters. The resulting 12,669 ECG data points and matching exposure data were used for analysis (summarized in Table 1). Mean PM2.5-exposure at work was about double than that at home and about four times the night values. SDNN during wake phases was slightly smaller than during the night, pNN50 was lowest at work and highest during the night.

Table 1. Summary statistics of assessed data.
Plotting mean and SD of 120 min of SDNN and pNN50 against 60 min of preceding PM2.5-exposure (Figure 2) showed a wide range of values at low concentrations and a smaller range at higher concentrations, while visually, there was no clear difference in mean value for different exposure levels. The SD of 5-min HRV over the 2-h following exposure showed a similar pattern as the mean (Figure 2). However, plotting the time trend of SDNN and pNN50 following the different exposure levels (Figure 2) revealed a very symmetrical pattern of time trend-values being highly variable at low exposure and close to zero at elevated exposures, yielding a typical appearance of a funnel plot. This pattern was highly significant, as revealed in the regression analysis below. A similar pattern was observed for all activity phases (work, home, night).
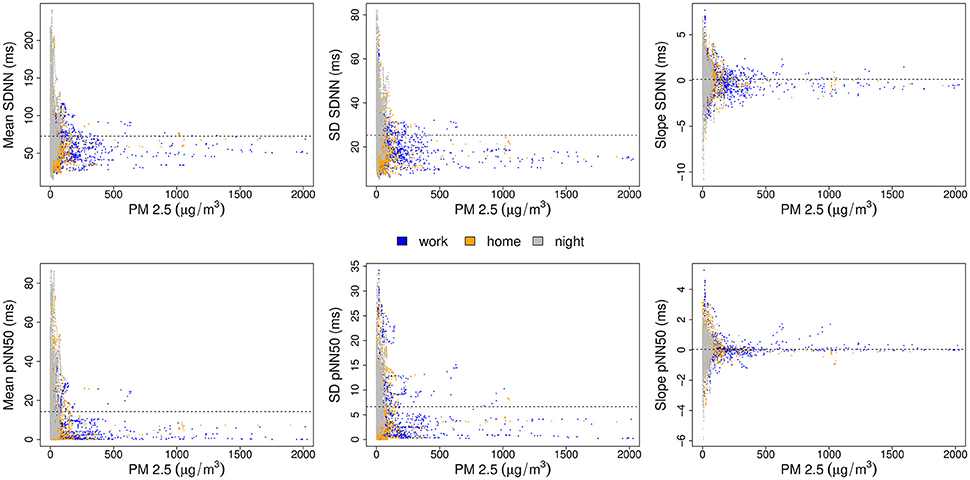
Figure 2. Comparison of HRV parameters SDNN (top) and pNN50 (bottom) after PM2.5-exposure: Average HRV (Left), the standard deviation of HRV (Middle), and the time trend of HRV following exposure (Right). A dotted line shows the arithmetic average of the HRV variable, colors code the different activity phases.
Regression analysis of SDNN and pNN50 parameters (mean, SD and absolute value of the time trend) against exposure (Table 2) showed significant negative PM2.5 effect estimates for all three parameters of SDNN and pNN50. Control for activity phases at work, at home and during the night reduced the effect estimates but all remained significant at the 5% significance level. Neither age nor BMI were statistically significantly related to the individual effect estimates. Stratified analyses also show significant effect estimates in most strata (Table 3).
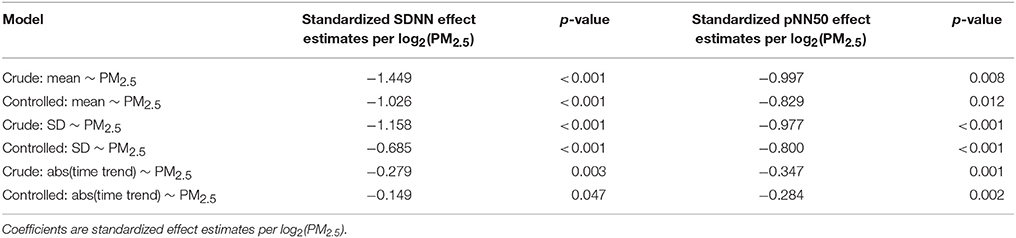
Table 2. Association of 1-h exposure to PM2.5 with mean, SD, and absolute value of the time trend of SDNN and pNN50 (controlled for activity phase) in the following 2-h.
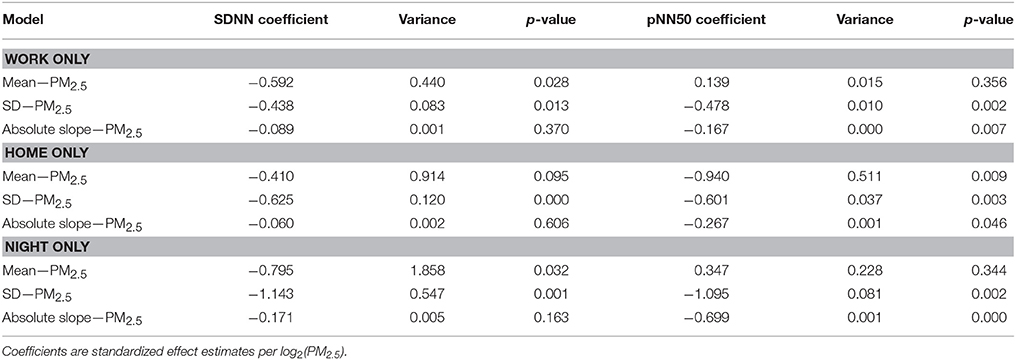
Table 3. Stratification by activity phase of the analysis of the association of short-term exposure to PM2.5 for mean, SD, and absolute value of the slope of SDNN and pNN50.
In a sensitivity analysis, the influence of the averaging times was tested by shortening and increasing the intervals. The visual pattern remained similar at all tested interval lengths and combinations (examples of tested variants shown in Figure 3). The effect estimates (all tested combinations shown in Table 4) for mean and SD of SDNN and pNN50 remained significant in most tested variants, while the absolute value of the time trends of SDNN and pNN50 were significant only for the longer time windows after control for activity (at least 40 min of exposure, at least 80 min of HRV).
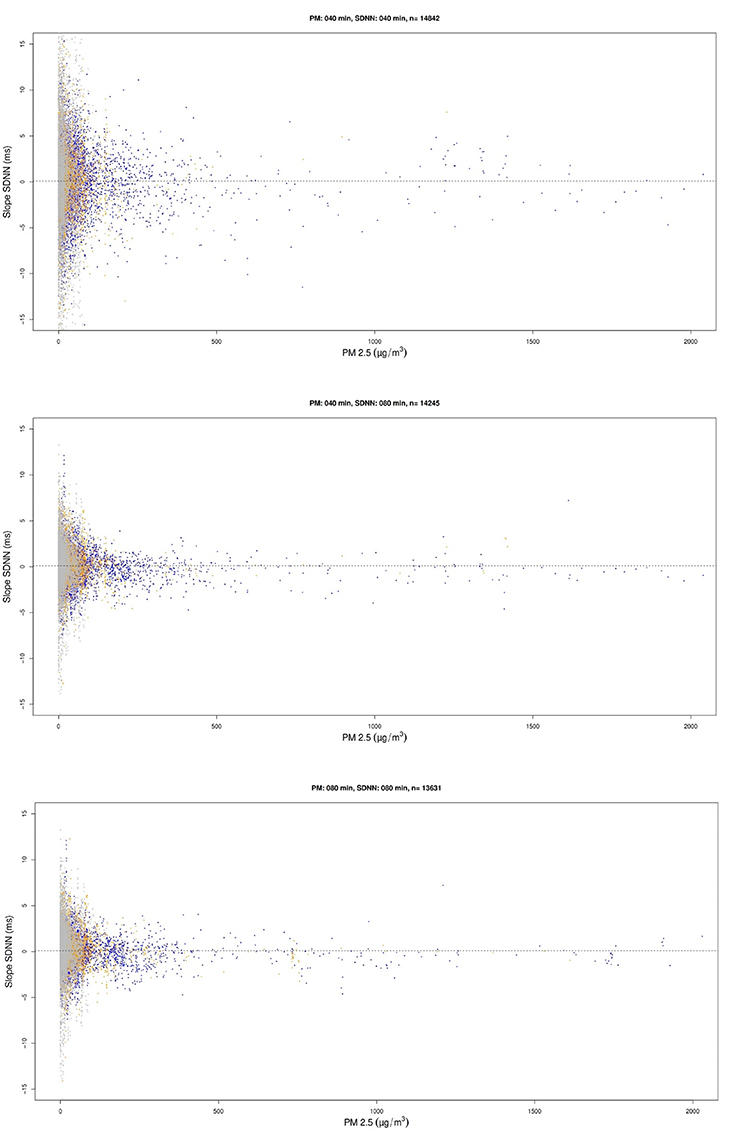
Figure 3. Examples of the scatterplots comparing exposure and time trend (slope over time) for other averaging time windows for the absolute values of the time trend of SDNN, created as part of the sensitivity analysis.
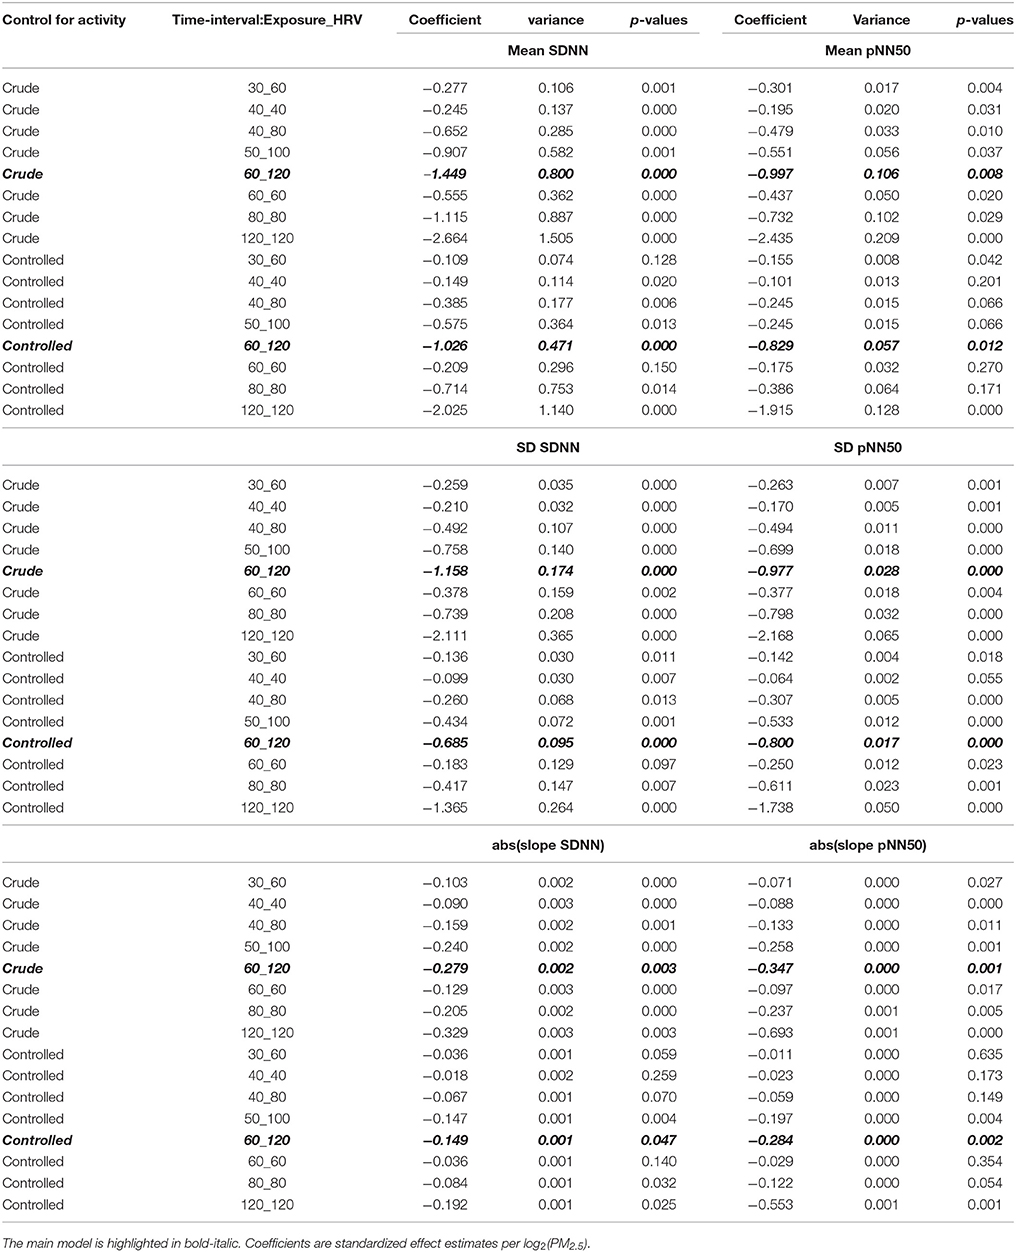
Table 4. Analysis of the sensitivity of the effect estimates to changing the averaging times of PM2.5-exposure and HRV-values, with and without control for activity phases.
Discussion
Acute exposure to PM2.5 was followed by reduced HRV, which is in agreement with previous studies (Pope et al., 2003; Wu et al., 2010; Huang et al., 2014; Nyhan et al., 2014; Mordukhovich et al., 2015; Lee et al., 2016). Different from those studies, we also assessed whether HRV shows a time-trend to increase or decrease after high exposures. The scatterplots showing the time trends of SDNN and pNN50 vs. PM2.5 have a remarkable appearance of a “funnel plot”: whereas we had approximately as many increasing and decreasing time trends, compensating each other and averaging zero, whatever the value of PM2.5, the values of the time trends (whether increasing or decreasing) were consistently distributed over a wide range for low exposures and distributed in a very narrow range for high exposures (Figure 2).
The pattern of reduced modulation of HRV at elevated PM2.5-levels exists for all three activity phases assessed (work, home, at night), though the pattern is easiest to be recognized visually for the working hours. This is remarkable because the exposure at home and at night is representing what the normal (Swiss) population experiences, which is quite low. In contrast, the working exposure is reflective of the workplace along the highways with occasionally very high exposure levels (Riediker et al., 2003; Meier et al., 2013). In many major cities in low-income countries around the globe similar. Concentrations are at similar or even higher levels than those found at the workplace of these Swiss highway maintenance teams (Landrigan et al., 2017). The here observed striking work-time effects can be expected in those city dwellers. Our findings raise serious questions about the long-term health of the populations of such cities, who are continuously exposed to such levels. However, note that our study was limited to a small sample of healthy male Swiss adults of good socioeconomic status. It would seem necessary to assess whether other population groups such as females, children, other ethnicities, unhealthy, and lower socioeconomic status may respond differently to the same level of exposure.
The decrease of both, average SDNN and PNN50 can be interpreted as a reduced autonomic activity (Ewing et al., 1984; Electrophysiology Taskforce Guidelines, 1996; Mietus et al., 2002). This type of acute response was reported by other groups before (Devlin et al., 2003; Pope et al., 2003; Wu et al., 2010; Huang et al., 2014; Nyhan et al., 2014; Wagner et al., 2014; Weichenthal et al., 2014; Cole-Hunter et al., 2015; Hemmingsen et al., 2015; Mordukhovich et al., 2015; Lee et al., 2016). Interestingly, SDNN at high exposure levels is just slightly below the average SDNN, while PNN50 drops to near zero, which is suggestive of mostly parasympathetic withdrawal. Our analysis also shows that the random modulation of HRV (SD and time trend of SDNN and PNN50) is strongly reduced following elevated PM2.5-exposure, suggesting that this interference with regulatory autonomic mechanisms lasts for a while. PM2.5 was previously reported to interfere with salt regulation (Tsai et al., 2012b), vascular function (Hemmingsen et al., 2015), and blood pressure (Tsai et al., 2015). It would be interesting to experimentally study if this could be a possible explanation for the observed reduced modulation of HRV over the 2-h window. Acutely altered HRV often represents a disturbance of normal homeostatic processes (Billman, 2011), which can pose a serious health concern especially for people having elevated cardiovascular risk factors such as those with previous infarction or existing arrhythmic disorders (Tsuji et al., 1996; Clyne et al., 2016; Patel et al., 2017).
The acute decrease of HRV following exposure identified in the regression analysis confirms our hypothesis that changing the time from exposure to HRV-response assessment explains the difference in direction observed in our previous analyses in the same road maintenance workers (Meier et al., 2014) and also other healthy individuals (Riediker et al., 2004a), where we observed an increase in mean HRV associated with exposure to PM2.5 in the morning after exposure. Taken together, the previous analyses (Riediker et al., 2004a; Meier et al., 2014) and this one are in support of the idea that immediately after exposure, air pollutants disturb cardiac function, which will fade after a few hours and be followed later on by a recovery response.
Another novel, and possibly troubling new insight of our analysis is the observed funnel plot-like reduced modulation of HRV following exposure. It supports the idea of an interference with homeostatic control mechanisms. It seems to pose a serious health risk if such a strong response was observed in people with already partly derailed control mechanisms, such as those having pre-existing cardiovascular disease, previous infarction, heart failure, or arrhythmic disorders. The acute impairment of homeostatic control would also explain the later occurring increase of HRV observed in the same workers (Meier et al., 2014) and also in an independent populations of healthy highway patrol men (Riediker et al., 2004a), which would represent the period of homeostatic recovery.
Availability of Data and Material
The datasets used and analyzed during the current study are available from the corresponding author on reasonable request.
Author Contributions
All authors contributed to the writing of the article. MR: led the analysis and led the writing of the article; YF: conducted the statistical analysis and created figures and tables; VR: reviewed and contributed to the statistical planning and interpretation; RM: collected the health and exposure data, prepared the database, and helped with the statistical analysis; MB: contributed to the statistical assessment and provided homeostasis interpretation; WEC treated the ECG recordings, extracted 5-min HRV data, and contributed to the cardiac interpretation of the findings.
Funding
Data analyzed in this study was collected as part of a study sponsored by the Swiss National Science Foundation (PDFMP3_124954). The here presented data analysis was sponsored by the Institute for Work and Health, University of Lausanne, Lausanne, Switzerland.
Conflict of Interest Statement
The authors declare that the research was conducted in the absence of any commercial or financial relationships that could be construed as a potential conflict of interest.
Acknowledgments
We thank Wayne E. Cascio of the National Health and Environmental Effects Research Laboratory, U.S. Environmental Protection Agency for his important support in the initial data collection. He also gave valuable input to the interpretation of the findings of the here presented analysis.
References
Billman, G. E. (2011). Heart rate variability - a historical perspective. Front. Physiol. 2:86. doi: 10.3389/fphys.2011.00086
Brook, R. D., Rajagopalan, S., Pope, C. A., Brook, J. R., Bhatnagar, A., Diez-Roux, A. V., et al. (2010). Particulate matter air pollution and cardiovascular disease: an update to the scientific statement from the american heart association. Circulation 121, 2331–2378. doi: 10.1161/CIR.0b013e3181dbece1
Brook, R. D., Xu, X., Bard, R. L., Dvonch, J. T., Morishita, M., Kaciroti, N., et al. (2013). Reduced metabolic insulin sensitivity following sub-acute exposures to low levels of ambient fine particulate matter air pollution. Sci. Total Environ. 448, 66–71. doi: 10.1016/j.scitotenv.2012.07.034
Buteau, S., and Goldberg, M. S. (2016). A structured review of panel studies used to investigate associations between ambient air pollution and heart rate variability. Environ. Res. 148, 207–247. doi: 10.1016/j.envres.2016.03.013
Clyne, N., Hellberg, M., Kouidi, E., Deligiannis, A., and Höglund, P. (2016). Relationship between declining glomerular filtration rate and measures of cardiac and vascular autonomic neuropathy. Nephrology 21, 1047–1055. doi: 10.1111/nep.12706
Cole-Hunter, T., Weichenthal, S., Kubesch, N., Foraster, M., Carrasco-Turigas, G., Bouso, L., et al. (2015). Impact of traffic-related air pollution on acute changes in cardiac autonomic modulation during rest and physical activity: a cross-over study. J. Expo. Sci. Environ. Epidemiol. 26, 133–140. doi: 10.1038/jes.2015.66
Da Silva, V. P., De Oliveira, N. A., Silveira, H., Mello, R. G., and Deslandes, A. C. (2015). Heart rate variability indexes as a marker of chronic adaptation in athletes: a systematic review. Ann. Noninvasive Electrocardiol. 20, 108–118. doi: 10.1111/anec.12237
Devlin, R. B., Ghio, A. J., Kehrl, H., Sanders, G., and Cascio, W. (2003). Elderly humans exposed to concentrated air pollution particles have decreased heart rate variability. Eur. Respir. J. Suppl. 40, 76s−80s. doi: 10.1183/09031936.03.00402403
Devlin, R. B., Smith, C. B., Schmitt, M. T., Rappold, A. G., Hinderliter, A., Graff, D., et al. (2014). Controlled exposure of humans with metabolic syndrome to concentrated ultrafine ambient particulate matter causes cardiovascular effects. Toxicol. Sci. 140, 61–72. doi: 10.1093/toxsci/kfu063
Dockery, D. W., Luttmann-Gibson, H., Rich, D. Q., Link, M. S., Schwartz, J. D., Gold, D. R., et al. (2005). Particulate air pollution and nonfatal cardiac events. Part II. Association of air pollution with confirmed arrhythmias recorded by implanted defibrillators. Res. Rep. Health Effects Inst. 83–126; discussion: 127–148.
Electrophysiology Taskforce Guidelines (1996). Heart rate variability: standards of measurement, physiological interpretation and clinical use. Eur. Heart J. 17, 354–381. doi: 10.1093/oxfordjournals.eurheartj.a014868
Ewing, D. J., Neilson, J. M., and Travis, P. (1984). New method for assessing cardiac parasympathetic activity using 24 hour electrocardiograms. Br. Heart J. 52, 396–402. doi: 10.1136/hrt.52.4.396
Hemmingsen, J. G., Rissler, J., Lykkesfeldt, J., Sallsten, G., Kristiansen, J., Moller, P. P., et al. (2015). Controlled exposure to particulate matter from urban street air is associated with decreased vasodilation and heart rate variability in overweight and older adults. Part. Fibre Toxicol. 12:6. doi: 10.1186/s12989-015-0081-9
Huang, Y.-L., Chen, H.-W., Han, B.-C., Liu, C.-W., Chuang, H.-C., Lin, L.-Y., et al. (2014). Personal exposure to household particulate matter, household activities and heart rate variability among housewives. PLoS ONE 9:e89969. doi: 10.1371/journal.pone.0089969
Imhof, D., Weingartner, E., Ordónez, C., Gehrig, R., Hill, M., Buchmann, B., et al. (2005). Real-world emission factors of fine and ultrafine aerosol particles for different traffic situations in Switzerland. Environ. Sci. Technol. 39, 8341–8350. doi: 10.1021/es048925s
Kowalska, M., and Kocot, K. (2016). Short-term exposure to ambient fine particulate matter (PM2,5 and PM10) and the risk of heart rhythm abnormalities and stroke. Postepy Hig. Med. Dosw. 70, 1017–1025. doi: 10.5604/17322693.1220389
Landrigan, P. J., Fuller, R., Acosta, N. J. R., Adeyi, O., Arnold, R., Basu, N., et al. (2017). The lancet commission on pollution and health. Lancet. doi: 10.1016/S0140-6736(17)32345-0. [Epub ahead of print].
Lee, M.-S., Eum, K.-D., Rodrigues, E. G., Magari, S. R., Fang, S. C., Modest, G. A., et al. (2016). Effects of personal exposure to ambient fine particulate matter on acute change in nocturnal heart rate variability in subjects without overt heart disease. Am. J. Cardiol. 117, 151–156. doi: 10.1016/j.amjcard.2015.10.015
Link, M. S., Luttmann-Gibson, H., Schwartz, J., Mittleman, M. A., Wessler, B., Gold, D. R., et al. (2013). Acute exposure to air pollution triggers atrial fibrillation. J. Am. Coll. Cardiol. 62, 816–825. doi: 10.1016/j.jacc.2013.05.043
Meier, R., Cascio, W. E., Danuser, B., and Riediker, M. (2013). Exposure of highway maintenance workers to fine particulate matter and noise. Annu. Occup. Hyg. 57, 992–1004. doi: 10.1093/annhyg/met018
Meier, R., Cascio, W. E., Ghio, A. J., Wild, P., Danuser, B., and Riediker, M. (2014). Associations of short-term particle and noise exposures with markers of cardiovascular and respiratory health among highway maintenance workers. Environ. Health Perspect. 122, 726–732. doi: 10.1289/ehp.1307100
Metzger, K. B., Klein, M., Flanders, W. D., Peel, J. L., Mulholland, J. A., Langberg, J. J., et al. (2007). Ambient air pollution and cardiac arrhythmias in patients with implantable defibrillators. Epidemiology 18, 585–592. doi: 10.1097/EDE.0b013e318124ff0e
Mietus, J. E., Peng, C.-K., Henry, I., Goldsmith, R. L., and Goldberger, A. L. (2002). The pNNx files: re-examining a widely used heart rate variability measure. Heart 88, 378–380. doi: 10.1136/heart.88.4.378
Mordukhovich, I., Coull, B., Kloog, I., Koutrakis, P., Vokonas, P., and Schwartz, J. (2015). Exposure to sub-chronic and long-term particulate air pollution and heart rate variability in an elderly cohort: the Normative Aging Study. Environ. Health 14:87. doi: 10.1186/s12940-015-0074-z
Mordukhovich, I., Kloog, I., Coull, B., Koutrakis, P., Vokonas, P., and Schwartz, J. (2016). Association between particulate air pollution and QT interval duration in an elderly cohort. Epidemiology 27, 284–290. doi: 10.1097/EDE.0000000000000424
Nyhan, M., McNabola, A., and Misstear, B. (2014). Comparison of particulate matter dose and acute heart rate variability response in cyclists, pedestrians, bus and train passengers. Sci. Total Environ. 468–469, 821–831. doi: 10.1016/j.scitotenv.2013.08.096
Patel, V. N., Pierce, B. R., Bodapati, R. K., Brown, D. L., Ives, D. G., and Stein, P. K. (2017). Association of holter-derived heart rate variability parameters with the development of congestive heart failure in the cardiovascular health study. JACC Hear Fail 5, 423–431. doi: 10.1016/j.jchf.2016.12.015
Peters, A., von Klot, S., Heier, M., Trentinaglia, I., Hörmann, A., Wichmann, H. E., et al. (2004). Exposure to traffic and the onset of myocardial infarction. N. Engl. J. Med. 351, 1721–1730. doi: 10.1056/NEJMoa040203
Pope, C. A., Hansen, M. L., Long, R. W., Nielsen, K. R., Eatough, N. L., Wilson, W. E., et al. (2003). Ambient particulate air pollution, heart rate variability, and blood markers of inflammation in a panel of elderly subjects. Environ. Health Perspect. 112, 339–345. doi: 10.1289/ehp.6588
Putaud, J. P., Van Dingenen, R., Alastuey, A., Bauer, H., Birmili, W., Cyrys, J., et al. (2010). A European aerosol phenomenology - 3: physical and chemical characteristics of particulate matter from 60 rural, urban, and kerbside sites across Europe. Atmos. Environ. 44, 1308–1320. doi: 10.1016/j.atmosenv.2009.12.011
Richards, L. (1999). Optical properties of the San Joaquin Valley aerosol collected during the 1995 integrated monitoring study. Atmos. Environ. 33, 4787–4795. doi: 10.1016/S1352-2310(99)00267-8
Riediker, M. (2007). Cardiovascular effects of fine particulate matter components in highway patrol officers. Inhal. Toxicol. 19(Suppl. 1), 99–105. doi: 10.1080/08958370701495238
Riediker, M., Cascio, W. E., Griggs, T. R., Herbst, M. C., Bromberg, P. A., Neas, L., et al. (2004a). Particulate matter exposure in cars is associated with cardiovascular effects in healthy young men. Am. J. Respir. Crit. Care Med. 169, 934–940. doi: 10.1164/rccm.200310-1463OC
Riediker, M., Devlin, R. B., Griggs, T. R., Herbst, M. C., Bromberg, P. A., Williams, R. W., et al. (2004b). Cardiovascular effects in patrol officers are associated with fine particulate matter from brake wear and engine emissions. Part. Fibre Toxicol. 1:2. doi: 10.1186/1743-8977-1-2
Riediker, M., Williams, R., Devlin, R., Griggs, T., and Bromberg, P. A. (2003). Exposure to particulate matter, volatile organic compounds, and other air pollutants inside patrol cars. Environ. Sci. Technol. 37, 2084–2093. doi: 10.1021/es026264y
Sassi, R., Cerutti, S., Lombardi, F., Malik, M., Huikuri, H. V., Peng, C. K., et al. (2015). Advances in heart rate variability signal analysis: joint position statement by the e-cardiology ESC working group and the european heart rhythm association co-endorsed by the Asia Pacific heart rhythm society. Europace 17, 1341–1353. doi: 10.1093/europace/euv015
Shaffer, F., McCraty, R., and Zerr, C. L. (2014). A healthy heart is not a metronome: an integrative review of the heart's anatomy and heart rate variability. Front. Psychol. 5:1040. doi: 10.3389/fpsyg.2014.01040
Song, X., Liu, Y., Hu, Y., Zhao, X., Tian, J., Ding, G., et al. (2016). Short-term exposure to air pollution and cardiac arrhythmia: a meta-analysis and systematic review. Int. J. Environ. Res. Public Health 13:642. doi: 10.3390/ijerph13070642
Tsai, D.-H., Amyai, N., Marques-Vidal, P., Wang, J.-L., Riediker, M., Mooser, V., et al. (2012a). Effects of particulate matter on inflammatory markers in the general adult population. Part. Fibre Toxicol. 9:24. doi: 10.1186/1743-8977-9-24
Tsai, D.-H., Guessous, I., Riediker, M., Paccaud, F., Gaspoz, J.-M., Theler, J.-M., et al. (2015). Short-term effects of particulate matters on pulse pressure in two general population studies. J. Hypertens. 33, 1144–1152. doi: 10.1097/HJH.0000000000000533
Tsai, D. H., Riediker, M., Wuerzner, G., Maillard, M., Marques-Vidal, P., Paccaud, F., et al. (2012b). Short-term increase in particulate matter blunts nocturnal blood pressure dipping and daytime urinary sodium excretion. Hypertension 60, 1061–1069. doi: 10.1161/HYPERTENSIONAHA.112.195370
Tsuji, H., Larson, M. G., Venditti, F. J. Jr., Manders, E. S., Evans, J. C., Feldman, C. L., et al. (1996). Impact of reduced heart rate variability on risk for cardiac events. Circulation 94, 2850–2855. doi: 10.1161/01.CIR.94.11.2850
Wagner, J. G., Kamal, A. S., Morishita, M., Dvonch, J. T., Harkema, J. R., and Rohr, A. C. (2014). PM2.5-induced cardiovascular dysregulation in rats is associated with elemental carbon and temperature-resolved carbon subfractions. Part. Fibre Toxicol. 11:25. doi: 10.1186/1743-8977-11-25
Weichenthal, S., Hatzopoulou, M., and Goldberg, M. S. (2014). Exposure to traffic-related air pollution during physical activity and acute changes in blood pressure, autonomic and micro-vascular function in women: a cross-over study. Part. Fibre Toxicol. 11:70. doi: 10.1186/s12989-014-0070-4
Wu, C., Kuo, I.-C., Su, T.-C., Li, Y.-R., Lin, L.-Y., Chan, C.-C., et al. (2010). Effects of personal exposure to particulate matter and ozone on arterial stiffness and heart rate variability in healthy adults. Am. J. Epidemiol. 171, 1299–1309. doi: 10.1093/aje/kwq060
Keywords: heart rate variability, fine particulate matter, acute exposure, homeostatic interference, ARIMA methodology
Citation: Riediker M, Franc Y, Bochud M, Meier R and Rousson V (2018) Exposure to Fine Particulate Matter Leads to Rapid Heart Rate Variability Changes. Front. Environ. Sci. 6:2. doi: 10.3389/fenvs.2018.00002
Received: 25 September 2017; Accepted: 08 January 2018;
Published: 25 January 2018.
Edited by:
Maurice Millet, Université de Strasbourg, FranceReviewed by:
Eduardo Landulfo, Instituto de Pesquisas Energéticas e Nucleares (CNEN), BrazilSatish Vutukuru, North Carolina State University, United States
Copyright © 2018 Riediker, Franc, Bochud, Meier and Rousson. This is an open-access article distributed under the terms of the Creative Commons Attribution License (CC BY). The use, distribution or reproduction in other forums is permitted, provided the original author(s) or licensor are credited and that the original publication in this journal is cited, in accordance with accepted academic practice. No use, distribution or reproduction is permitted which does not comply with these terms.
*Correspondence: Michael Riediker, bWljaGFlbC5yaWVkaWtlckBhbHVtbmkuZXRoei5jaA==