 Christine B. Georgakakos
 Chelsea K. Morris
- Biological and Environmental Engineering, Cornell University, Ithaca, NY, United States
Many nutrient mitigation best management practices (BMP) are promoted by state and federal agencies to protect water quality from animal agriculture. The measured effectiveness of these is highly variable in the research literature. Here, we establish pre- and post-BMP monitoring to evaluate the effectiveness of fencing out cattle from the riparian zone on water quality, specifically, phosphorus (P) loads and concentrations. We collected water samples year-round both before and after a cattle exclusion was established at a small mixed dairy and beef cattle pasture where cattle have historically grazed with unrestricted access to first and second order streams, and analyzed for soluble reactive and total P. Immediately after fence construction, we observed a significant reduction in total P in the stream but not in soluble reactive P. We also observed the development of new runoff source areas and short-circuiting of the riparian buffer as well as repeated presence of cows in the fenced-out area, all of which may diminish the potential effectiveness of this practice. Because BMPs will perform uniquely given climate and landscape position and how managers maintain them, we suggest the need for more nuanced guidance for future BMP designs to ensure successful outcomes.
Introduction
Toxic algal blooms can impact drinking water supplies and recreation on lakes due to their effects on wildlife and humans (Correll, 1998). Harmful algal blooms are a rising issue across the US (US House of Representatives, 2014), with New York State (NYS), in particular, making some important changes. New York State's Water Quality Rapid Response Team, under direction of the governor and Department of Environmental Conservation, has begun steps to implement a serious effort to reduce harmful algal blooms according to the 12th Proposal of the State of the State (NY Executive Branch, 2018). Harmful algal blooms and associated eutrophication result from high nutrient inputs to freshwater bodies. Harmful algal blooms are defined broadly as the growth of toxin producing algae. Eutrophication results from an excessive nutrient load to a water body, often leading to anoxic conditions. Limnological systems are frequently phosphorus (P) limited (e.g., Anderson et al., 2002), leading to an acute focus on how to reduce P loadings, in particular to protect water quality. The P equilibrium in lakes complicates management of this nutrient because P sorbs to sediment particles, is incorporated into algal and bacterial biomass, and exists in biologically available ionic forms (Correll, 1998; Chislock et al., 2013). This equilibrium makes managing for sediment-bound and biologically available P equally important. The anoxic zones that can accompany eutrophication in lakes push the equilibrium to favor desorbing sediment-bound P into the water column, exacerbating the P problem if sediments have sequestered large amounts of P (Holdren and Armstrong, 1980; Howarth et al., 2011). Agriculture has been identified as a high contributor of P to lakes and the streams that feed them, and is therefore one important area to implement phosphorus reducing management strategies (e.g., Drolc and Zagorc Koncan, 2002; Ulén et al., 2007).
Avoiding fertilization, manure spreading, or fecal deposition in areas that are likely to generate runoff mitigates non-point source pollution (Walter et al., 2000; Thodsen et al., 2015; Winchell et al., 2015; Knighton et al., 2017a). Within nutrient-rich parts of a watershed (e.g., areas that receive animal manure), the areas that are most prone to soil saturation, including streams, disproportionately contribute more nutrients to streams than other parts of the landscape (e.g., Archibald et al., 2014; Lerch et al., 2015; Peukert et al., 2016). In designing best management practices (BMPs) to reduce non-point source pollution, it is therefore reasonable to focus resources on these hydrologically sensitive areas.
Riparian buffers, or uncultivated borders to streams, are prescribed for several reasons to mitigate nutrient pollution from agricultural fields. One reason is because streams and their riparian zones disproportionately generate runoff due to high soil moisture. Riparian buffers therefore are prescribed to reduce transport of pollutants that could have been deposited within the buffer area, if the buffer area were not protected. A second application is allowing the buffer to slow overland flow and allow for deposition and degradation of nutrients. A cattle exclusion area as applied around a stream is referred to as a cattle-excluded riparian buffer and aims to address both of these nutrient transport mechanisms. This practice is generally recommended for the purpose of eliminating fecal deposition directly into streams and reducing sediment suspension from cattle traffic (Miller et al., 2010). Cow behavior appears to have significant impacts on site hydrology. In their search for shade and water cattle may continue to compact soils near streams and increase the risk of runoff (Trimble and Mendel, 1995).
Many studies have found riparian buffers reduce P loading to streams from cropped agricultural fields (Patty et al., 1997; Aguiar et al., 2015; Mander et al., 2017; Zhang et al., 2017). Suggested widths for those buffers are highly variable in the literature (e.g., Lee et al., 2003, 2004). Implementation of riparian buffers has traditionally followed a blanket approach of including either the flood plain of a 100-year design storm or 25–50 ft of undisturbed forest to buffer streams (e.g., NYS Department of Environmental Conservation., 2015). However, this broad approach does not account for nuances of topography, livestock rotation, or variable source areas that may contribute more pollutant loads at different points during the year (Walter et al., 2000). Walter et al. (2009) recommend creating riparian buffers of flexible widths to account for variable source areas.
Within a riparian buffer, mechanisms for P removal are sediment deposition, sorption to sediment particles, chemical precipitation or conversion, plant uptake, and biological immobilization via incorporation into organisms. However, rates and reaction potentials of these processes depend on soil type, degree of P saturation, buffer width, vegetation type, and management conditions of the buffer region (Hoffmann et al., 2009).
Total P pollution is reported to be reduced with the implementation of riparian buffers (McKergow et al., 2003; Miller et al., 2010; Shukla et al., 2011). However, as P accumulates in buffer sediments, the ability of the buffer to reduce P pollution diminishes with time unless a management strategy, such as removing plant material that has accumulated P, is implemented (Dodd and Sharpley, 2015). Reports of soluble reactive P reduction by riparian buffers, however, are inconsistent. Some studies report soluble reactive P removal (Abu-Zrieg et al., 2003; Lee et al., 2003), while others report soluble reactive P generation (Makin et al., 2007; Hoffmann et al., 2009). For a diversity of reasons, riparian buffers are sometimes ineffective in reducing nutrient loads to streams. One such reason, relevant to this study, is point sources, such as tile drains, bypassing riparian buffers and routing water directly to streams or other receiving waters.
In this study we assess the effectiveness of a cattle-excluded riparian buffer on reducing total and soluble reactive P loads and concentrations to a small headwater stream by comparing pre- and post-BMP installation. We also include qualitative observations that may be relevant to BMP effectiveness.
Methods
Site Description
Our study site was a small active cattle pasture in the Finger Lakes region of NYS with a small headwater stream dividing the pasture (Figure 1). The farm in this study experienced several landscape alterations that are expected on a dynamic farm, such as changes in pasture boundaries, type of cow grazed, and integrity of fencing. These changes complicate nutrient runoff analysis, so we present here the results of a cattle exclusion riparian buffer in light of typical farm management and changes. The objective of this study is to characterize phosphorus and sediment dynamics under conditions seen in practice, i.e., including each of these complicating factors.
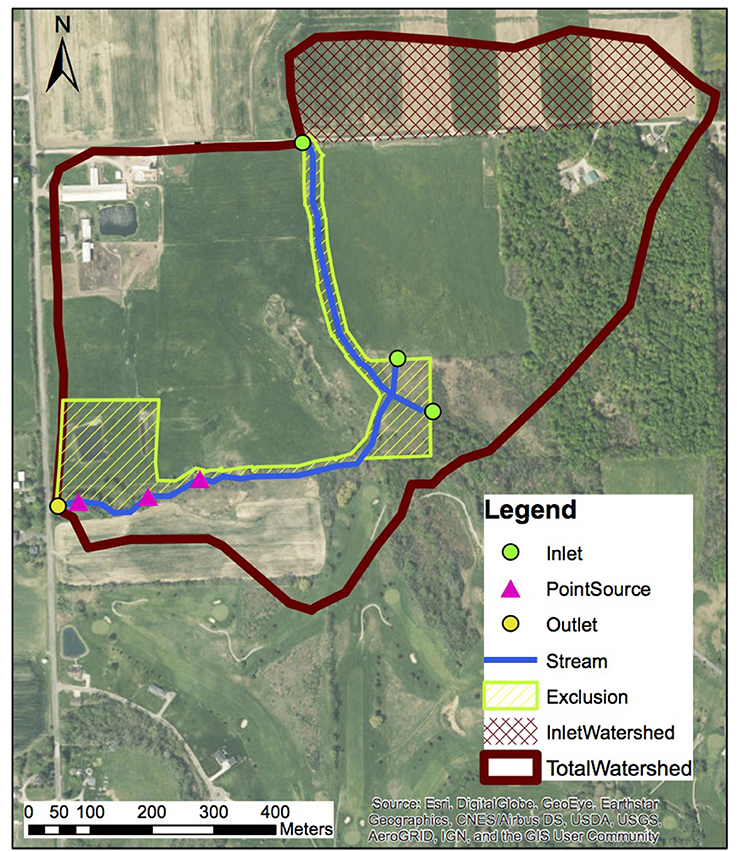
Figure 1. Study watershed. Inlet watershed comprises of fields draining into a road ditch that feeds the inlet of the stream. Northern watershed boundary has been significantly altered from natural flow regime by agricultural infrastructure development. In the subsequent discussion point sources of pond effluent, tile drainage, and cow generated saturated areas correspond with point sources from west to east respectively in the figure above. This image was taken pre-BMP implementation. The three renovated settling ponds are located in the boxed exclusion area near the stream outlet and collect manure overflow from the manure pit shown in the north-western corner of the watershed. Of the three inlets, only the northern-most inlet point is used as the inlet in this study. This map was created using ArcGIS software by Esri. ArcGIS and ArcMap are the intellectual property of Esri and are used here under license (ESRI, 2011).
The climate is temperate with snow-influenced runoff in the spring. The annual rainfall during the study period was recorded in Auburn, NY (10.5 km from the study site) and collected from the National Oceanic and Atmospheric Administration's National Center for Environmental Information (NOAA National Center for Environmental Information, 2018). Pre-BMP monitoring occurred during 2014 and 2015, with 1.21 and 1.23 m of annual precipitation respectively. Post-BMP monitoring occurred in 2017 through March 2018, with the annual 2017 precipitation at 1.29 m.
The watershed contributing flow to the inlet of the study reach was 9.5 ha, while the total watershed contributing flow at the outlet of the stream from the farm property is 65.2 ha. There are two additional springs contributing flow along the stream reach, with 12.4 and 8.3 ha in each drainage. The stream reach is 953 m long, and the cattle exclusion buffer width is 14 m. The total watershed is 20% forested with the remainder being pasture and cropped land; the inlet watershed (Figure 1) is 100% fertilized corn and hay.
The farm is a small mixed dairy and beef cattle operation with an average of about 100 cows over the study period. This particular farm was identified as a possibly high contributor of P to the waterway, and was therefore chosen by the local Soil and Water Conservation District to receive several BMPs to reduce P pollution to the surface water system.
The initially envisioned BMP was only a cattle-excluded riparian buffer. However, as a result of identifying a highly P-enriched tile drain, the BMP also included renovation of an existing in-series settling pond system. The pond system had been degraded, presumably due to the cattle, such that water from some treatment ponds was being directed into the drain. The cattle-exclusion fence surrounds all streams that cross and border the property and the renovated settling ponds. The pond system was renovated by adding an additional in-series settling pond, and routing contaminated water from manure overflow to the first of three in-series ponds (Figure 1). This study focuses on the impacts of the cattle-excluded riparian buffer. However, we acknowledge that the impact of the renovations on this property on phosphorus loading reduction would be greater when accounting for all BMP renovations. To primarily analyze the impacts of the riparian buffer on the reach, all in stream nutrient calculations correspond to samples immediately upstream of where the pond point source mixes with the stream.
Sampling Methods
Grab samples were taken from the stream and pipes discharging into the stream year round and analyzed for total phosphorus (TP), soluble reactive phosphorus (SRP), and total suspended solids (TSS). One year of sample analysis pre-BMP was deemed sufficient in accordance with former cattle exclusion studies (e.g., Sheffield et al., 1997). A total of 78 grab samples, 51 pre-BMP and 27 post-BMP, were taken at the outlet. Pre-BMP samples were distributed seasonally: 7, 25, 11, and 4 samples for spring, summer, fall and winter months, respectively. Similarly, post-BMP samples were seasonally distributed with 4, 12, 8, and 3 samples for spring, summer, fall and winter, respectively. Winter was sampled less frequently because cows were not in the pasture. The grab sampling method was chosen to obtain non-storm event samples so to highlight the impact of the buffer during the majority of the year rather than the inability of the buffer to entrap contaminants during high flows. Grab sampling is a method accessible to farms more so than other more continuous data collection techniques, which enables research like this study to be applied widely. Samples were collected using plastic Nalgene 200–1,000 mL bottles, stored on ice during transport, and prepared for TP, SRP, and TSS analysis in the lab. Samples were taken at a minimum frequency of once per month and a maximum frequency of once per week during both pre and post BMP monitoring.
Instantaneous discharge measurements were taken 9 times between the two sampling periods. Because interpretation of concentration data alone is limiting, we turned to a simple stream flow model, validated for this region, and used our few flow measurements to calibrate the seven model parameters. Parameters were initialized with values used in the Owasco watershed, the basin that encompasses the farm and our catchment (Archibald et al., 2014). Calibrating a regional model with only a few measurements and prior estimates of model parameters has been used in ungauged catchments before (Rojas-Serna et al., 2006). The modeled discharge values were used to calculate P and sediment loads.
Analysis Methods
Total Phosphorus and Soluble Reactive Phosphorus
Samples were filtered the same day of sampling for SRP and acidified using sulfuric acid to prevent algal and bacterial growth. TP samples were acidified with sulfuric acid day of sampling, then fully digested using persulfate solution paired with sulfuric acid (USEPA, 1978) and filtered after digestion. All samples were filtered using 0.45 μm filter paper before analysis. All samples were stored at 4°C until sample analysis. Phosphorus analysis was done on an automated wet chemistry analyzer (FS3000; Xylem Analytics O.I. Analytical, Beverly, Massachusetts) screening for phosphate anions () in SRP and digested TP samples. Reagents for analysis were ammonium molybdate, ascorbic acid, sulfuric acid, and potassium antimonyl tartate (USEPA, 1978). Each run was calibrated using 0.005, 0.05, 0.5, 5, and 10 ppm potassium phosphate standards, with all R2 values of the standard curves between 0.999800 and 0.999999.
Total Suspended Solids
At both the inlet and outlet of the stream reach, pre-BMP and post-BMP samples were analyzed for total suspended solids (TSS). Water volume filtered for TSS analysis ranged from 100 to 500 ml depending on visual clarity of the water. All filters were 0.45 μm Whatman glass fiber filters (cat. no. 1826-047). Immediately following filtration, filters were oven dried at 60°C for 24 h.
Statistical Analysis
Data analysis was completed using R-studio (version 1.0.136) for data visualization and statistical analysis. Statistical testing for comparing samples from pre and post-BMP periods was preformed using a Wilcox Rank Sum test (two-sided Mann-Whitney test) after determination that data was not normally distributed following Shapiro-Wilks normality tests. The null hypothesis was that loads and concentrations of P and TSS did not differ, while the alternative hypotheses was that samples from pre and post-BMP monitoring experienced a shift in value. For the following discussion, significance is defined by p < 0.05.
To normalize differences in runoff volume and changes in P flowing into the reach on any sample day, TP, SRP, and TSS load accumulations were calculated to define effectiveness of the buffer over the course of the entire reach. Load accumulation is calculated by first modeling the flow at the inlet and outlet of the system using JoFlow (Archibald et al., 2014) in the R EcoHydRology package. This model was chosen due to its representation of regionally relevant hydrological mechanisms and good agreement with distributed and watershed hydrological monitoring (Archibald et al., 2014; Knighton et al., 2017a,b). The forcing data for this model are precipitation, maximum and minimum daily air temperatures, latitude, and day of the year. The parameters of mean annual wind speed, the initial abstraction for surface water pooling, minimum daily curve number, time to peak, maximum potential evapotranspiration, the recession coefficient, ground albedo, and a coefficient for the curve number's relationship to the soil water were calibrated to this watershed using the Dynamically Dimensioned Search (DDS) generated by Tolson and Shoemaker (2007). The Nash-Suticliff Efficiency Coefficient (NSE) (Nash and Sutcliffe, 1970) objective function was used to determine model fit to observed discharge. We generated the NSE from the natural log of the data to remove heteroscedasiticty of the underlying residuals. Equation 1 gives the relationship used.
where Simi refers to simulated daily flow and Obsi refers to the observed flow on the same day.
Load Calculations
Watershed area was delineated using ArcGIS from 1927 UTM projection 18N (NYS, 1927) initially, however modifications to the landscape by agricultural water routing and road ditch installation have drastically changed the local hydrology from what was captured in the DEM. The ArcGIS delineated watershed was manually adjusted to match the true hydrologic patter of the region after walking the watershed boundary.
Stream discharge measurements were made 9 times over the course of the study, and used to calibrate simulated continuous flow. The JoFlow (Archibald et al., 2014) model used pre-defined or calibrated input parameters shown in Table 1. JoFlow was used to obtain daily discharges, which were in turn used to calculate daily loads of TSS and P from grab samples on the same day. No samples were used to model P or TSS loads on days other than the days they were taken. We chose to model stream flow because discharge data can be difficult for farms to gather, and on-farm research contributes an important practical perspective missed by many laboratory run experiments.
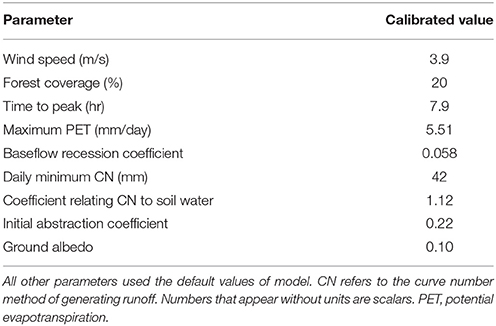
Table 1. Calibrated parameter values obtained by running DDS.
With watershed flows from JoFlow, TP, SRP, and TSS load accumulations were then calculated from Equation (2).
where Load Accumulation is in g/day, Cout and Cin are concentrations flowing out of and into the system, respectively (g/L), and Qout and Qin are volumetric flows at the outlet and inlet, respectively (L/day).
The relationship between flow and loading was plotted to visually determine changes in loading between pre- and post-BMP samples across flow rates. A simple linear regression was fit to the data, and intercepts and slopes compared to address differences between conditions. All linear models were preformed on log-transformed data.
Results
Discharge Results
The calibrated JoFlow parameters are shown in Table 1. These parameters were the only parameters modified from default parameters outlined by Archibald et al. (2014). NSE calibration points are shown in Figure 2 with corresponding modeled and observed flows. After calibration, stream flow is modeled for entire study duration along with soil water and snow water equivalent (Figure 3).
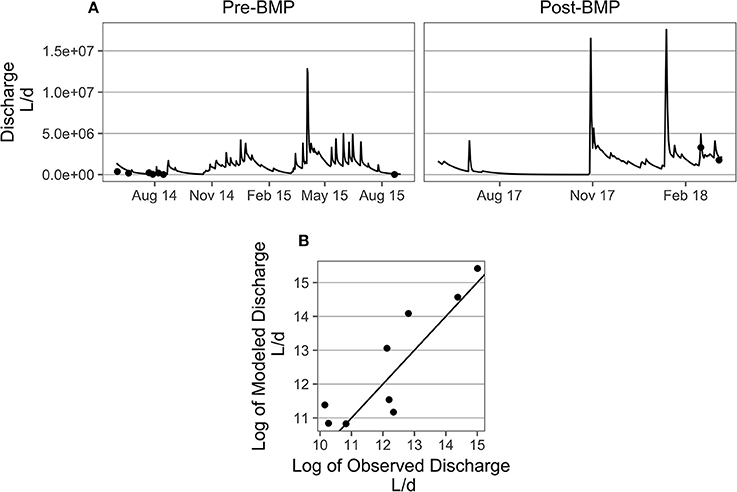
Figure 2. (A) Observed and simulated flow values (mm/d) (points and lines, respectively) over study duration. (B) represents the relationship between observed to simulated flow on a log-log plot to ensure the model fits well for the more frequent low flow scenarios. The line shown is the 1 to 1 line between simulated and observed flows. NSE = 0.82.
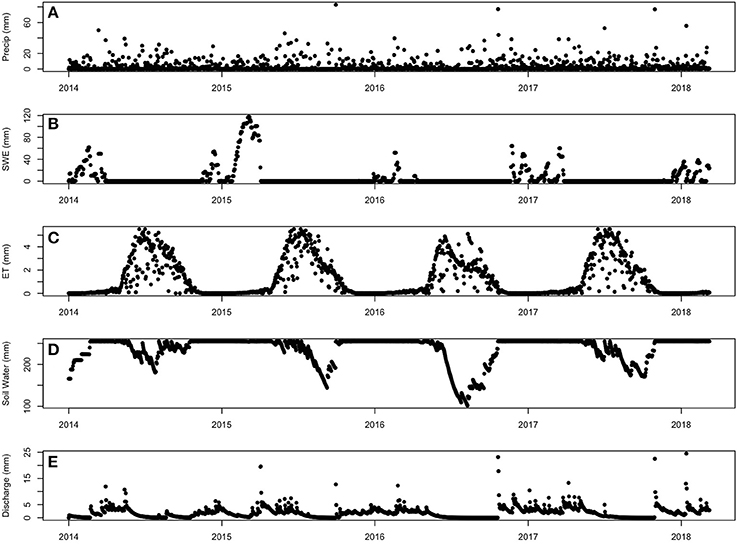
Figure 3. Daily precipitation data (A) used to model SWE (snow water equivalent) (B), ET (evapotranspiration) (C), soil water (D), and discharge (E). All plots include both pre- and post-BMP sampling regimes. Pre-BMP sampling occurred 2014–2015, post-BMP sampling corresponds to 2017–2018.
According to Moriasi et al. (2007), an NSE value above 0.7 is accepted to fit the observed values well. Our NSE value of 0.82 allows us to be confident in the simulated flow values. Simulated flow is then used to calculate TP, SRP, and TSS load accumulations.
Water Quality Results
Concentrations
SRP concentrations at the outlet after BMP implementation were not significantly different than pre-BMP conditions (Figure 4A, p-value = 0.48). Pre-BMP SRP concentrations ranged from 0.025 to 0.287 mg/L. The SRP concentrations in the post-BMP period were between 0.012 and 0.786 mg/L. Median SRP concentration values at the watershed outlet are 0.07 mg/L and 0.08 mg/L for pre- and post-BMP respectively. All water quality results are summarized in Table 2.
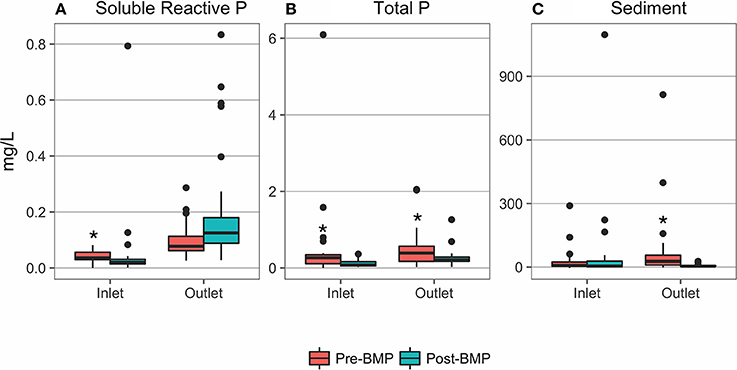
Figure 4. SRP (A), TP (B) concentrations, and TSS (C) observed at stream inlets and outlets. TP and TSS concentrations are significantly different (as indicated by an asterisk, *), but SRP concentrations are unchanged. N = 51 for pre-BMP samples and n = 27 for post-BMP samples.
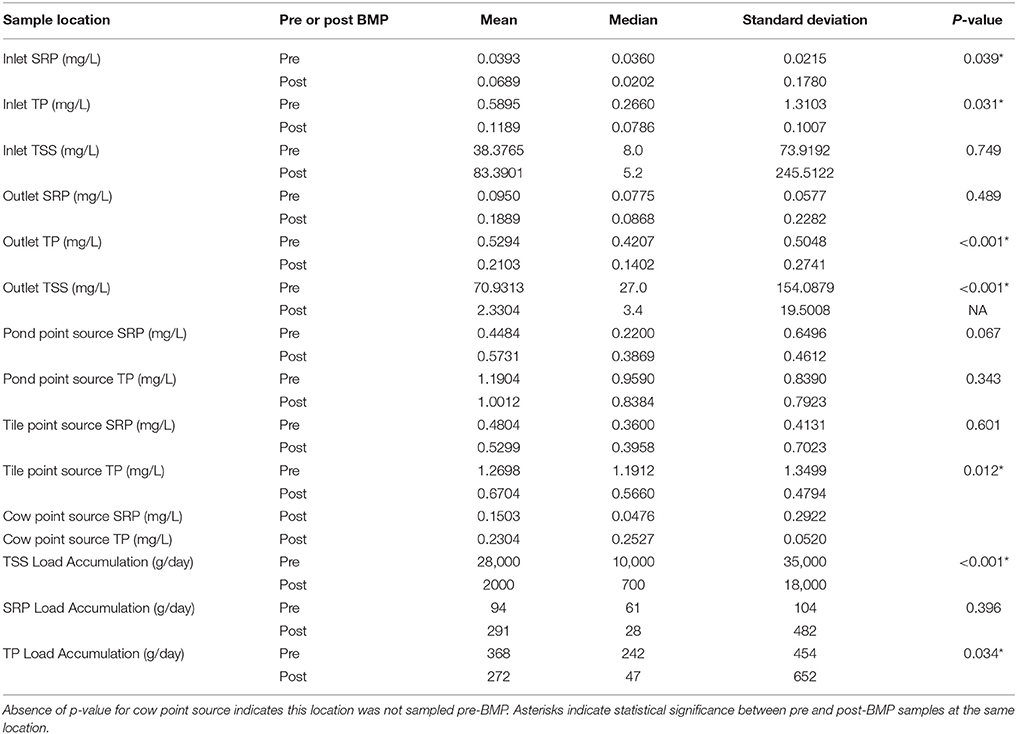
Table 2. Summary statistics for concentrations and accumulated loads for TP, SRP, and TSS; p-values refer to significance in change of observed value between pre and post-BMP samples.
TP concentrations after BMP implementation were significantly lower than pre-BMP conditions at the outlet, 0.022–2.06 mg/L before BMP construction and 0.024–1.27 mg/L after (Figure 4B, p-value < 0.001). Median TP concentration values at the watershed outlet are 0.42 and 0.14 mg/L for pre- and post-BMP respectively.
Outlet TSS concentration values ranged from 2.0 to 814.0 mg/L and 1.1 to 21.0 mg/L for pre- and post-BMP respectively. The median values at the outlet were 27 and 3.4 mg/L for pre and post-BMP samples respectively, demonstrating a significant reduction in TSS (Figure 4C, p-value < 0.001)
Inlet concentrations of SRP ranged from 0.030 to 0.082 mg/L for pre-BMP samples and 0.002 to 0.79 for post-BMP samples. TP concentrations ranged from 0.017 to 6.09 mg/L for inlet samples from pre-BMP samples and 0.024 to 0.365 mg/L for post BMP samples. Both TP and SRP differences at the inlet were significant (p-value = 0.038 and 0.031 for SRP and TP, respectively). TSS concentrations ranged from 2.0 to 290 mg/L pre-BMP construction and 1.2 to 1,096 mg/L post-BMP construction, and were not significantly different at the watershed inlet (Figure 4C, p-value = 0.749). Median TSS concentrations at the inlet were 8.0 and 5.2 mg/L for pre- and post-BMP samples respectively. Due to fluctuations in inflowing P between pre- and post-BMP sampling, load accumulations (g/day) were calculated as a metric of buffer effectiveness in stream P reduction.
Load Accumulations
Phosphorus loading analyses are meant to eliminate the effect of yearly variations in flow (i.e., weather) that could obscure the impact of the BMP on P loads at the outlet. The TP and TSS load accumulations over the course of the reach are significantly reduced after the installation of the cattle-excluded buffer (p-values of < 0.001 and 0.033, respectively). However, the SRP load accumulation reduction is not significant (p-value = 0.396; Figure 5). Because particulate P is a large component of TP, the reduction in TSS likely accounts for a large part of the TP reduction. The median load accumulations for TP are 242 and 47 g/day for pre- and post-BMP respectively. Median load accumulations for SRP are 61 and 28 g/day for pre- and post-BMP respectively. Median TSS load accumulations are 10 and 0.6 kg/day for pre- and post-BMP respectively. The variation in the data is also reduced in both TP and TSS from pre to post-BMP indicating a more predictable P dynamic after the BMP implementation. However, SRP again departs from the TP and TSS trend and shows an increase in variation post-BMP (Table 2).
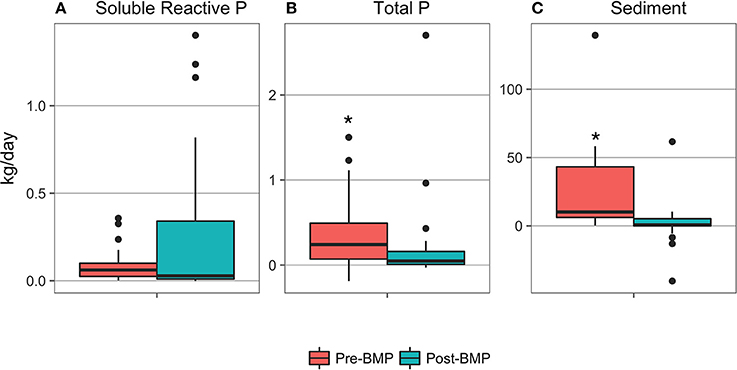
Figure 5. Soluble reactive phosphorus (A), total phosphorus (B), and total suspended solids (C) loading accumulated across the site before and after the cattle excluded buffer was in place. TP and TSS accumulations are significantly different (as indicated by an asterisk, *), but SRP accumulation is unchanged. N = 25 for pre-BMP samples and n = 24 for post-BMP samples. A negative load accumulation indicates reduction of P or TSS load over the course of the reach.
High Phosphorus Sources
Three point sources were identified along the stream reach as significant P sources: two observed in both the pre- and post-BMP periods, and one in only the post-BMP period. The pond effluent point source (Figure 6) discharges from the in series ponds intended to treat intercepted manure pit overflow while the tile drain collects subsurface flow and directs it to the stream. This point source discharges downstream of our outlet sample, but is included here as an example of a point source that frequently contaminates agricultural streams. The cow point source is flow from a cow-generated saturated area (currently outside of the buffer area) that short circuits the riparian buffer. Post-BMP samples from all three sources were higher in TP and SRP than the inlet, the other major direct input to the stream (Figure 6). Median concentrations for the point sources and inlet SRP concentrations were 0.38, 0.39, 0.04, and 0.02 mg/L for point sources from the pond, tile drain, cow-generated saturated area and inlet respectively. Median concentrations for the point sources and inlet TP concentrations were 0.83, 0.56, 0.25, and 0.07 mg/L. Data shown are concentrations rather than loads due to the difficulty in estimating discharge from these sources.
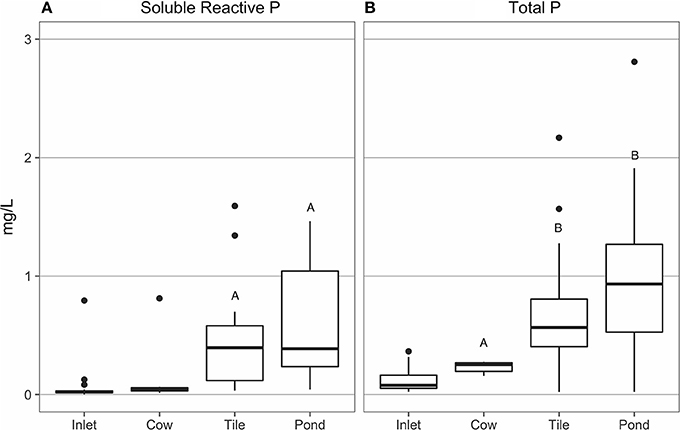
Figure 6. Post-BMP SRP (A) and TP (B) concentrations from point sources along the stream reach. Statistical difference is noted by “A' and “B” above (all TP data p-values < 0.01). Point sources came from pond effluent (Pond, n = 29), a tile drain (Tile, n = 27), and a cow-generated saturated area (Cow, n = 8). Inlet is included for reference (n = 24).
Pre- and post-BMP point source comparisons for the pond and tile drain (Figure 7) indicate SRP concentrations decreased, though not significantly, in the pond (Figure 7, p-value = 0.067), while the tile drain did not experience a reduction in SRP (Figure 7, p-value = 0.601). The reduction in SRP from the pond effluent indicates that pond renovations may have helped reduce P from the farm, but the tile drain continues to discharge highly polluted water directly into the stream.
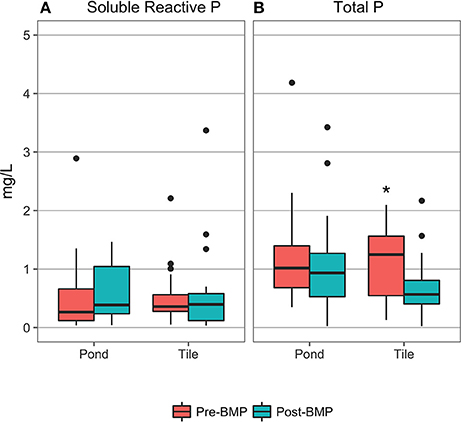
Figure 7. Point source SRP (A) and TP (B) concentrations pre- and post-BMP installation. Pond and Tile correspond with Pond and Tile sources from Figure 6. Statistical differences are noted by an asterisk (*). N = 24, 28 for pre- and post-BMP samples at source 1. N = 24, 28 for pre- and post-BMP samples taken from Source 2, respectively.
The cow-generated point source was generated post-BMP and does not have pre-BMP monitoring data. Median SRP concentrations for pre- and post-BMP pond point source are 0.22 and 0.38 mg/L respectively, and median SRP concentrations for pre- and post-BMP tile drain point source are 0.36 and 0.40 mg/L respectively.
Total phosphorus is not reduced when comparing pre- and post-BMP concentrations at the pond point source (p-value = 0.343). Median TP values for the pond point source are 0.96 and 0.84 mg/L respectively for pre- and post-BMP. However, total phosphorus is reduced at the tile drain point source (p-value = 0.011). Median TP values at the tile drain point source are 1.19 and 0.57 mg/L for pre- and post-BMP respectively.
Anecdotally, the discharge volume was greater in the tile drain than the pond effluent. The pond effluent was nearly zero for much of the summer during post-BMP monitoring and was dry for the summer during pre-BMP monitoring. The tile drain flowed continuously during both monitoring periods. The cow-impacted saturated area likely generated the least amount of runoff over the study period. This would indicate that the tile drain may have the largest impact on P accumulation over the reach, the pond effluent an intermediate impact, and the cow impacted area the smallest impact when considering load in addition to concentration. Of the three sources, the tile drain appears to have impacted the P accumulation over the reach the most.
There were 2 additional flow sources to the system, one from a forested wetland and one from a perennially wet spot at the toe-slope of a hill. None of these sources were not significantly different from the inlet when comparing SRP (all p-values > 0.3). The springs were sampled 24 times each in the post-BMP monitoring period. These springs were not taken to be the inlet samples because occasionally cows were pastured further upstream. All sources but one were not significantly different when considering TP (all p-values < 0.1). The one source that was different (p-value = 0.03) flowed from a forested wetland with TSS comprising mostly of organic matter. This organic matter settled out before mixing with the main stem, and therefore did not influence total stream phosphorus dynamics significantly.
Load Accumulation Across Discharges
The relationships between load and flow for TP, SRP, and TSS are not the same when comparing pre- and post-BMP data. TP and TSS load accumulations post-BMP are reduced in comparison with pre-BMP load accumulations. However, like concentration and load, we do not see a difference in the management practice in its effect on SRP as a function of discharge.
The cattle excluded riparian buffer appears to have the largest influence on TP and TSS loads at low flows, while at high flows the impact of the buffer is reduced (Figures 8A,C). SRP appears to have no significant change as a result of the buffer system (Figure 8B). The equations for the regression lines in Figure 8 are in Table 3 with the associated errors of each estimate.
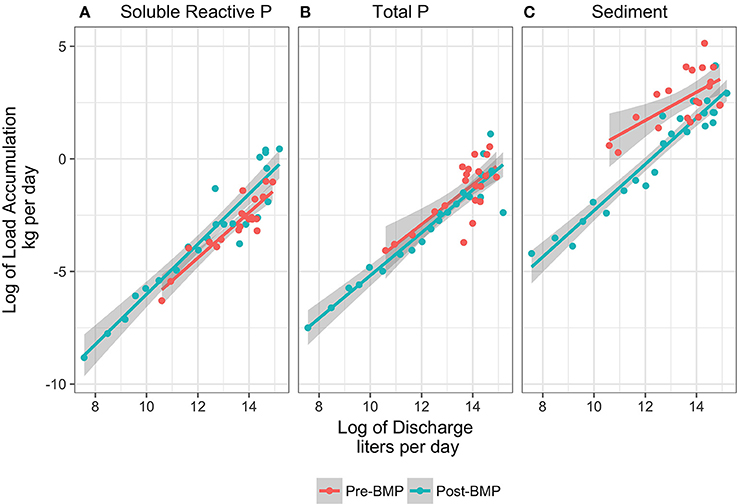
Figure 8. SRP (A), TP (B), TSS (C) load accumulations over the reach are plotted against discharge on a log-log scale. Pre-BMP accumulations are plotted in red while post-BMP accumulations are plotted in blue. Points represent observed accumulations while lines represent the simple linear regression model for the data. Gray shaded zones represent error associated with the best-fit lines for each time period. Table 3 outlines statistics of the linear regressions.
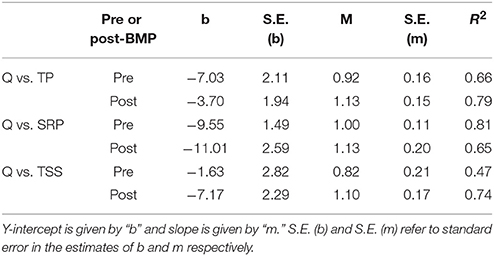
Table 3. Coefficients of regression lines in Figure 8 (log-transformed relationships).
Discussion
In all concentration and load comparisons, TP was significantly reduced with the addition of the cattle exclusion area. This observation follows those results found by several previous studies (e.g., McKergow et al., 2003; Miller et al., 2010; Shukla et al., 2011). The observed reduction in inflowing TP could have several explanations: (1) direct P input and sediment suspension is reduced by the limited cow access to upland streams and riparian areas, (2) mobile P and sediment is trapped by riparian buffer sediments and/or via chemically- and biologically-mediated processes, before reaching the stream. The reduction in TSS loading post-BMP implementation, suggests that either or both mechanisms are present. However, if these two factors were the only factors controlling stream P, we would expect SRP to be reduced as well. Our observation of minimal impact on SRP follows the results Hoffmann et al. (2009) and Makin et al. (2007). Non-significant reduction in SRP may suggest that the source has not been completely addressed by the cattle exclusion area. For example, there could be accumulated P in the soils that continues to be slowly released over time, thus, mitigating the BMPs immediate impact on SRP.
A legacy problem is presented by soils with high P contents, as are common in this area (Ketterings et al., 2005). Legacy pollution issues arise when a certain pollutant has saturated or highly contaminated an area, such that it continues to provide pollution to the system after the incoming pollution source has stopped or been reduced. Desorption of soluble P accumulated in sediments into overland flow may continue for years beyond BMP construction (Sharpley et al., 2013). The reach load accumulations observed in this study were collected in the year following buffer implementation, but if legacy contamination is contributing SRP at this site, we expect the load to diminish with time.
Desorption of SRP from enriched soils could explain our non-significant drop in stream SRP, but in the absence of soil P measurements, we cannot conclude its influence on stream SRP relative to the point sources. Yet, we stress that our findings demonstrate stream SRP is less influenced by the installation of riparian buffer cattle exclusions than is stream TP. Care should be exercised in concluding when and what water quality impact this BMP will have on a specific site.
We observed several point sources with high concentrations of SRP of water entering the stream. The riparian zone is short-circuited by the flow of point source 3 (Figure 6), bypassing the biological or physical processes expected to occur in the riparian buffer (e.g., Schultz et al., 1995). Additionally, ponded water at the edge of the pasture short-circuited the buffers in a concentrated flow paths, discharging directly to the stream. Areas where short circuiting occurred were likely wetter than average due to their relative low position in the landscape and the heavy traffic of cows, which, in combination, reduced vegetation growth and infiltration capacity in these areas and created wet spots that expanded through the season, similar to observations of Nguyen et al. (1998).
Our monitoring after cattle exclusion buffer area installation revealed management issues that we suspect reduce the water quality gains of the riparian buffer. First, the continued, albeit unpredictable, presence of cows inside the fenced riparian area could slow observed impact of the riparian area. Of the 27 times this site was sampled after the installation of the exclusion fences, cows were found 5 times within the cow-exclusion area. No significant spikes in stream P levels accompanied these cow entrances when comparing days that the cows gained entrance to the stream and those in which they were successfully excluded. Inside the cow-exclusion area, the cows likely trample riparian vegetation, re-suspend sediment, and potentially directly defecate into the stream. Despite suspected negative impacts of cow entry into cattle-excluded buffer areas, we still calculate significant TP and TSS load reductions.
We expect that a wetter climate leads to more frequently saturated soils and greater nutrient runoff (Walter et al., 2000). Therefore, because post-BMP monitoring occurred in a wetter year compared to pre-BMP monitoring, it is possible that when assessing yearly loads the practice would demonstrate greater water quality gains across two monitoring periods with similar rainfall (in the case of this study, 2014–2015).
Another issue observed pertaining to reduced effectiveness of the cow exclusion area was the concentrated flow path generated from new saturated areas within the cow pastures, through the riparian buffers, and into the stream (e.g., point source 3). Other studies (e.g., Pankau et al., 2012) have made similar observations in cropped landscapes, indicating the dynamic management of riparian buffers is critical for their intended functionality. Changes in microtopography due to cattle traffic around fences and water sources were observed in this study. The cow-generated saturated areas (origins of concentrated flow paths) grew in area over the duration of the sampling period in 2017. Cows repeatedly trampled wet areas, expanding the saturated zones over time and likely reducing infiltration capacity through compaction (Nguyen et al., 1998). These areas tended to be near gates and walk ways, though they were also in shadier, moister, lowland areas that may have attracted cows during hot summer months. In order for the cattle-excluded riparian buffer to be maximally effective, exclusion areas need to be adjusted to include new areas likely to be saturated and those that arise. We recognize the logistical difficulty of modifying fence positions with traditional fencing methods. Solutions to this issue may include a combination of more frequent pasture rotation and movable fencing. Without inclusion of these saturated areas into cattle-excluded riparian buffer areas pollutants essentially become connected to the stream via preferential overland flow paths.
The final issue brought forth by this study, is that point sources of P that may be contributing significant loads to the system are not solved by cattle-excluded buffers. The tile-drain with high SRP discharge concentrations into the stream supports previous research on P transport in subsurface water flow (King et al., 2015), and should be considered when assessing farm scale nutrient management. In order to significantly reduce all loads to the surface water system, these point sources need to be assessed for their potential interactions (or lack there of) with BMPs.
Limitations
As is the nature of on-farm research, there are a multitude of factors that impede the generalizability of the results. We believe that on-farm sampling encounters many of the obstacles seen, but not researched, in farm management, and tells the broader story of BMPs in the landscape.
Because the precipitation conditions of the pre-BMP sampling period were drier than post-BMP monitoring period, we will not make an estimate of percent reduction that occurred as a result of the cattle exclusion riparian buffer. We anticipate that the actual reduction in phosphorus load accumulation would be greater when comparing post-BMP to pre-BMP, if our sampling periods shared the same precipitation conditions (Dougherty et al., 2004).
Point source discharges were monitored neither during pre- nor post-BMP monitoring periods due to rapid, and sometimes transient, generation of some of these points and difficulty in modeling source areas. To assess the total impact of the buffer versus these point sources, we needed to calculate P loads, which require discharges measurements for the duration of the experiment. Similarly, soil P observations, which we did not collect, could be used to parse the impact of the direct effect of cows in stream from the pollution caused by enriched soils. Regular soil P measurements over time could be useful in projecting when legacy P contamination will end.
Because grab samples did not capture storm events, these data should not be used to generate yearly averages with and without riparian buffer cattle exclusions. Our study objective was to assess buffer reduction on reach P and TSS during conditions the buffer would be anticipated to have the greatest effectiveness, i.e., moderate to low flow events (Meals and Hopkins, 2002).
Conclusion
In spite of the mixed water quality results, we continue to support the implementation of cattle-excluded riparian buffers. Although we found a lack of a significant reduction of SRP with the implementation of a cattle-excluded riparian buffer, this does not preclude the BMP from having a positive environmental benefit. We hypothesize that the reduction in TP will, over longer time scales, reduce SRP additions to the system from desorption from suspended sediments.
The construction of a riparian buffer cattle exclusion at this site showed significant reduction in TP and TSS even with the discovery of new, and unmitigated, point sources. Controlling for hydrologic patterns and landscape manipulations, this BMP could demonstrate even higher reductions of phosphorus loads. We have chosen to include the point source additions in our analysis to more accurately capture farm dynamics.
Buffers provide benefits beyond water quality including wildlife habitat and stream shading. The sediment reductions observed at this site are important to the health of this agricultural watershed. Reducing the transport of sediment-bound P is important for downstream lakes where P can later desorb and contribute to prolong eutrophic conditions via internal P cycling within lakes.
It is important to be aware of the additional, unmitigated sources of SRP on grazed pastures. To increase the water quality benefit, we recommend including the following in conjunction with the implementation of a cattle exclusion riparian buffer: (1) identify point sources along the reach, and work to reduce nutrient loads from those sources as well, (2) extend the buffered area to include likely variable source areas that create preferential flowpaths through the buffer, and (3) modify cattle exclusions as new saturated, runoff-generating areas develop within pastures.
Data Availability Statement
The raw data supporting the conclusions of this manuscript will be made available by the authors, without undue reservation, to any qualified researcher.
Author Contributions
CG contributed to data collection, statistical analysis and manuscript drafting. CM contributed to data collection and significant manuscript revision and editing. MW coordinated project idea and scope and revised the manuscript.
Funding
This manuscript was made possible through funding authorized under section 104b of the Water Resources Research Act, administered by the US Geological Survey and the Sagi Ram Dairy Engineering Award.
Conflict of Interest Statement
The authors declare that the research was conducted in the absence of any commercial or financial relationships that could be construed as a potential conflict of interest.
The reviewer JF and handling editor declared their shared affiliation
Acknowledgments
We would like to thank the Cayuga County Soil and Water District for inviting us to participate in this study and for acting as liaison between researchers and stakeholders, especially Jason Cuddeback for his collaboration throughout this project. We would also like to thank Clare O'Connor, Erin Menzies, and Shiela Saia for their assistance in sample collection and James Knighton for his assistance modeling stream flow.
References
Abu-Zrieg, M., Rudra, R., Whiteley, H., Lalonde, M., and Kaushik, N. (2003). Surface water quality: phosphorus removal in vegetated filter strips. J. Environ. Qual. 32, 613–619. doi: 10.2134/jeq2003.6130
Aguiar, T. R. Jr., Rasera, K., Parron, L. M., Brito, A. G., and Ferreira, M. T. (2015). Nutrient removal effectiveness by riparian buffer zones in rural temperate watersheds: the impact of no-till crops practices. Ag. Water Mgt. 149, 74–80. doi: 10.1016/j.agwat.2014.10.031
Anderson, D., Glibert, P., and Burkholder, J. (2002). Harmful algal blooms and eutrophication: nutrient sources, composition, and consequences. Estuaries 25, 704–726. doi: 10.1007/BF02804901
Archibald, J., Buchanan, B., Fuka, D., Georgakakos, C., Lyon, S., and Walter, M. T. (2014). A simple, regionally parameterized model for predicting nonpoint source areas in the northeastern US. J. Hydro. 1, 74–92. doi: 10.1016/j.ejrh.2014.06.003
Chislock, M. F., Doster, E., Zitomer, R. A., and Wilson, A. E. (2013). Eutrophication: causes, consequences, and controls in aquatic ecosystems. Nat. Educ. Knowl. 4:10.
Correll, D. L. (1998). The role of phosphorus in the eutrophication of receiving waters: a review. J. Environ. Qual. 27, 261–266.
Dodd, R., and Sharpley, A. (2015). Conservation practice effectiveness and adoption: unintended consequences and implications for sustainable phosphorus management. Nut. Cyc. Agroeco. 104, 373–392. doi: 10.1007/s10705-015-9748-8
Dougherty, W, J., Fleming, N, K., Cox, J, W., and Chittleborough, D. J. (2004). Phosphorus transfer in surface runoff from intensive pasture systems at various scales: a review. J. Environ. Qual. 33, 1973–1988. doi: 10.2134/jeq2004.1973
Drolc, A., and Zagorc Koncan, J. (2002). Estimation of sources of total phosphorus in a river basin and assessment of alternatives for river pollution reduction. Environ. Internat. 28, 393–400. doi: 10.1016/S0160-4120(02)00062-4
ESRI (2011). ArcGIS Desktop: Release 10.4.1. Redlands, CA. Environmental Systems Research Institute.
Hoffmann, C. C., Kjaergaard, C., Uusi-Kämppä, J., Hansen, H. C., and Kronvang, B. (2009). Phosphorus retention in riparian buffers: review of their efficiency. J. Environ. Qual. 38,1942–1955. doi: 10.2134/jeq2008.0087
Holdren, G., and Armstrong, D. (1980). Factors affecting phosphorus release from intact lake sediment cores. Am. Chem. Soc. 14, 79–87. doi: 10.1021/es60161a014
Howarth, R., Chan, F., Garnier, J., Doney, S., Marino, R., and Billen, G. (2011). Coupled biogeochemical cycles: eutrofication and hypoxia in temperate estuaries and coastal marine ecosystems. Front. Eco. Environ. 9, 18–26. doi: 10.1890/100008
Ketterings, Q. M., Kahabka, J. E., and Reid, W. S. (2005). Trends in phosphorus fertility of New York agricultural land. J. Soil Water Conserv. 60, 10–20.
King, K. W., Williams, M. R., Macrae, M. L., Fausey, N. R., Frankenberger, J., Smith, D. R., et al. (2015). Phosphorus transport in agricultural subsurface drainage: a review. J. Environ. Qual. 44, 467–485. doi: 10.2134/jeq2014.04.0163
Knighton, J. O., Saia, S. M., Morris, C. K., Archiblad, J. A., and Walter, M. T. (2017b). Ecohydrologic considerations for modeling of stable water isotopes in a small intermittent watershed. Hydro. Process. 31, 2438–2452. doi: 10.1002/hyp.11194
Knighton, J., Pluer, E. M., Prestigiacomo, A. R., Effler, S. W., and Walter, M. T. (2017a). Topographic wetness guided dairy manure applications to reduce stream nutrient loads in Central New York, USA. J. Hydro. 14, 67–82. doi: 10.1016/j.ejrh.2017.11.003
Lee, K., Isenhart, T., and Shultz, R. (2003). Sediment and nutrient removal in an established multi-species riparian buffer. J. Soil Water Conserv. 58, 1–8.
Lee, P., Smyth, C., and Boutin, S. (2004). Quantitative review of riparian buffer width and guidelines from Canada and the United States. J. Environ. Mgt. 70, 165–180. doi: 10.1016/j.jenvman.2003.11.009
Lerch, R. N., Kitchen, N. R., Baffaut, C., and Vories, E. D. (2015). Long-term agroecosystem research in the central Mississippi river basin: goodwater creek experimental watershed and regional nutrient water quality data. J. Environ. Qual. 44, 37–43. doi: 10.2134/jeq2013.12.0518
Makin, K., Ngandu, D., Barden, C., Hutchinson, S., and Geyer, W. (2007). Grass-shrub riparian buffer removal of sediment, phosphors, and nitrogen from simulated runoff. J. Am. Water Res. Assoc. 43, 1108–1116. doi: 10.1111/j.1752-1688.2007.00090.x
Mander, Ü., Tournebize, J., Tonderski, K., Verhoeven, J. T., and Mitsch, W. J. (2017). Planning and establishment principles for constructed wetlands and riparian buffer zones in agricultural catchments. Eco. Eng. 103, 296–300. doi: 10.1016/j.ecoleng.2016.12.006
McKergow, L., Weaver, D., Prosser, I., Grayson, R., and Reed, A. (2003). Before and after riparian management: sediment and nutrient exports from a small agricultural catchment, Wester Australia. J. Hydro. 270, 253–272. doi: 10.1016/S0022-1694(02)00286-X
Meals, D. W., and Hopkins, R. B. (2002). Phosphorus reductions following riparian restoration in two agricultural watersheds in Vermont, USA. Water Sci. Tech. 45, 51–60. doi: 10.2166/wst.2002.0203
Miller, J., Chanasyk, D., Crutis, T., and Willms, W. (2010). Influence of stream bank fencing on the environmental quality of cattle-excluded pastures. J. Environ. Qual. 39, 991–1000. doi: 10.2134/jeq2009.0233
Moriasi, D. N., Arnold, J. G., Van Liew, M. W., Bingner, R. L., Harmel, R. D., and Veith, T. L. (2007). Model evaluation guidelines for systematic quantification of accuracy in watershed simulations. Trans. ASABE. 50, 885–900. doi: 10.13031/2013.23153
Nash, J., and Sutcliffe, J. (1970). River flow forecasting through conceptual models part I – A discussion of principles. J. Hydro. 10, 282–290. doi: 10.1016/0022-1694(70)90255-6
Nguyen, M., Sheath, G., Smith, C., and Cooper, A. (1998). Impact of cattle treading on hill land: 2. Soil physical properties and contaminant runoff. N. Zeal. J. Agr. Res. 41, 279–290. doi: 10.1080/00288233.1998.9513312
NOAA National Center for Environmental Information (2018). Daily Summary Observations. Auburn, NY. Available online at: https://gis.ncdc.noaa.gov/maps/ncei#app=cdo
NY Executive Branch (2018). 12th Proposal: Protecting New York's Lakes from Harmful Algal Blooms. Albany, NY: State of the State Proposals.
NYS Department of Environmental Conservation (ed). (2015). NYS Stormwater Design Manual. Available online at: https://www.dec.ny.gov/docs/water_pdf/swdm2015entire.pdf
NYS (1927). Digital Elevation Model. Owasco, NY: 10m DEM. Available online at: https://gis.ny.gov/
Pankau, R., Schoonover, J., Williard, K., and Edwards, P. (2012). Concentrated flow paths in riparian buffer zones of southern Illinois. Agrofor. Sys. 84, 191–205. doi: 10.1007/s10457-011-9457-5
Patty, L., Réal, B., and Gril, J. (1997). The use of grassed buffer strips to remove Pesticides, nitrate, and soluble phosphorus compounds from runoff water. Pestic. Sci. 49, 243–251. doi: 10.1002/(SICI)1096-9063(199703)49:3<243::AID-PS510>3.0.CO;2-8
Peukert, S., Griffith, B. A., Murray, P. J., Macleod, C. J., and Brazier, R. E. (2016). Spatial variation in soil properties and diffuse losses between and within grassland fields with similar short-term management. Eur. J. Soil Sci. 67, 386–396 doi: 10.1111/ejss.12351
Rojas-Serna, C., Michel, C., Perrin, C., Andreassian, V., Hall, A., Chahinian, N., et al. (2006). Ungauged Catchments: How to Make the Most of a Few Streamflow Measurements? Vol, 307 IAHS Publication.
Schultz, R., Collettil, J., Isenhart, T., Simpkins, W., Mize, C., and Thompson, M. (1995). Design and placement of a multi-species riparian buffer strip system. Agrofor. Sys. 29, 201–226. doi: 10.1007/BF00704869
Sharpley, A., Jarvie, H. P., Buda, A., May, L., Spears, B., and Kleinman, P. (2013). Phosphorus legacy: overcoming the effects of past management practices to mitigate future water quality impairment. J. Environ. Qual. 42, 1308–1326. doi: 10.2134/jeq2013.03.0098
Sheffield, R. E., Mostaghimi, S., Vaughan, D. H., Collins, E. R., and Allen, V. G. (1997). Off-stream water sources for grazing cattle as a stream bank stabilization and water quality BMP. Transactions of the ASAE, 40, 595–604. doi: 10.13031/2013.21318
Shukla, S., Goswami, D., Graham, W., Hodges, A., Christman, M., and Knowles, J. (2011). Water quality effectiveness of ditch fencing and culvert crossing in the Okeechobee basin, southern Florida, USA. Eco. Eng. 37, 1158–1163. doi: 10.1016/j.ecoleng.2011.02.013
Thodsen, H., Andersen, H. E., Blicher-Mathiesen, G., and Trolle, D. (2015). The combined effects of fertilizer reduction on high risk areas and increased fertilization on low risk areas, investigated using the SWAT model for a Danish catchment Acta Agriculturae Scandinavica. Sect. B Soil Plant Sci. 65(Suppl. 2), 217–227. doi: 10.1080/09064710.2015.1010564
Tolson, B., and Shoemaker, C. (2007). Dynamically dimensioned search algorithm for computationally efficient watershed model calibration. Water Res. Res. 43:W01413. doi: 10.1029/2005WR004723
Trimble, S., and Mendel, A. (1995). The cow as a geomorphic agent – a critical review. Geomorphology 13, 233–253. doi: 10.1016/0169-555X(95)00028-4
Ulén, B., Bechmann, M., Fölster, J., Jarvie, H., and Tunney, H. (2007). Agriculture as a phosphorus source for eutrophication in the north-west European countries, Normway, Sweden, United Kingdom and Ireland: a review. Soil Use Manag. 23, 5–15. doi: 10.1111/j.1475-2743.2007.00115.x
US House of Representatives (2014). “Harmful Algal Bloom and Hypoxia Research and Control Amendments Act of 2014, S. 1254,” in 113th Congress, 2nd Session (Washington, DC).
USEPA (US Environmental Protection Agency) (1978). Method 365.3. Phosphorous, All Forms (Colorimetric, Ascorbic Acid, Two Reagent). Washington, DC: US EPA.
Walter, M. T., Walter, M. F., Brooks, E. S., Steenhuis, T. S., Boll, J., and Weiler, K. (2000). Hydrologically sensitive areas: variable source area hydrology implications for water quality risk assessment. J. Soil Water Conserv. 55, 277–284.
Walter, M., Archibald, J., Buchanan, B., Dahlke, H., Easton, Z., Marjerison, R., Shaw, S., et al. (2009). New paradigm for sizing riparian buffers to reduce risks of polluted storm water: practical synthesis. J. Irr. Drain. Eng. 135, 200–209. doi: 10.1061/(ASCE)0733-9437(2009)135:2(200)
Winchell, M. F., Folle, S., Meals, D., Moore, J., Srinivasan, R., and Howe, E. A. (2015). Using SWAT for sub-field identification of phosphorus critical source areas in a saturation excess runoff region. Hydrol. Sci. J. 60, 844–862. doi: 10.1080/02626667.2014.980262
Keywords: total phosphorus, soluble reactive phosphorus, total suspended solids, riparian buffer, cattle exclusion, best management practice
Citation: Georgakakos CB, Morris CK and Walter MT (2018) Challenges and Opportunities With On-Farm Research: Total and Soluble Reactive Stream Phosphorus Before and After Implementation of a Cattle-Exclusion, Riparian Buffer. Front. Environ. Sci. 6:71. doi: 10.3389/fenvs.2018.00071
Received: 03 April 2018; Accepted: 15 June 2018;
Published: 05 July 2018.
Edited by:
Don Ross, University of Vermont, United StatesReviewed by:
Joshua Faulkner, University of Vermont, United StatesDaniela Businelli, University of Perugia, Italy
Copyright © 2018 Georgakakos, Morris and Walter. This is an open-access article distributed under the terms of the Creative Commons Attribution License (CC BY). The use, distribution or reproduction in other forums is permitted, provided the original author(s) and the copyright owner(s) are credited and that the original publication in this journal is cited, in accordance with accepted academic practice. No use, distribution or reproduction is permitted which does not comply with these terms.
*Correspondence: Christine B. Georgakakos, Y2JnNDZAY29ybmVsbC5lZHU=