 Elena A. Mikhailova1*
 Christopher J. Post1
 Patrick D. Gerard2
 Mark A. Schlautman3
 Michael P. Cope4Garth R. Groshans1Roxanne Y. Stiglitz5
 Hamdi A. Zurqani1,6John M. Galbraith7
- 1Department of Forestry and Environmental Conservation, Clemson University, Clemson, SC, United States
- 2Department of Mathematical Sciences, Clemson University, Clemson, SC, United States
- 3Department of Environmental Engineering and Earth Sciences, Clemson University, Clemson, SC, United States
- 4Soil Health Institute, Morrisville, NC, United States
- 5Department of Biology, Francis Marion University, Florence, SC, United States
- 6Department of Soil and Water Sciences, University of Tripoli, Tripoli, Libya
- 7Department of Crop and Soil Environmental Sciences, Virginia Polytechnic Institute and State University, Blacksburg, VA, United States
Lithospheric-derived resources such as soil texture and coarse fragments are key soil physical properties that contribute to ecosystem services (ES), which can be valued based on “soil” or “mineral” stocks. Soil survey data provides an inexpensive alternative to detailed field measurements which are often labor-intensive, time-consuming, and costly to obtain. However, both field and soil survey data contain heterogeneous information with a certain level of variability and uncertainty in data. This study compares the potential of using field measurements and information from the Soil Survey Geographic database (SSURGO) for coarse fragments (CF), sand (S), silt (Si), clay (C), and texture class (TC) in the surface soil (Ap horizon) for the 147-hectare Cornell University Willsboro Research Farm, NY. Maps were created based on following methods: (a) utilizing data from the SSURGO database for individual soil map unit (SMU) at the field site and using representative or reported values across individual SMU; (b) averaging the field data within a specific SMU boundary and using the averaged value across the SMU; and (c) interpolating field data within the farm boundaries based on the individual soil cores. This study demonstrates the important distinction between mapping using the “crisp” boundaries of SSURGO databases compared to the actual spatial heterogeneity of field interpolated data. Maps of CF, S, Si, C, and TC values derived from interpolated field core samples were dissimilar to maps derived by using averaged core results or SSURGO values over the SMUs. Dissimilarities in the maps of CF, S, Si, C, and TC can be attributed to several factors (e.g., official soil series data being collected from “type locations” outside of the study areas). Correlation plot of clay estimates for each SMU showed statistically significant correlations between SSURGO and field-averaged (r = 0.823, p = 0.003) and field-interpolated clay (r = 0.584, p = 0.028) estimates, but no correlation was found for CF, S, and Si. Ecosystem services provided by quantitative data such as CF, S, Si, and C may not be independent from each other and other soil properties. Key soil properties should also include categorical data, such as texture class, which is used for another key soil property–available soil water ratings. Current valuation of soil texture is often linked to specific mineral commodities, which does not always address the issue of soil based valuation including indirect use value.
Introduction
Frameworks to assess ecosystem services (ES) are being developed in soil science to highlight key soil properties that provide previously unidentified (or unquantified) benefits to ecosystems (Turner and Daily, 2008). Soil texture (percent of sand, silt, and clay) and the presence of coarse fragments have been identified as key soil properties for provisioning, regulating, cultural, and supporting services in connection with the United Nations (UN) Sustainable Development Goals (SDGs) (Table 1; Adhikari and Hartemink, 2016; Wood et al., 2017). These soil physical properties are commonly used to describe and classify soils worldwide, but there is limited information on their actual use to assess ecosystem services.
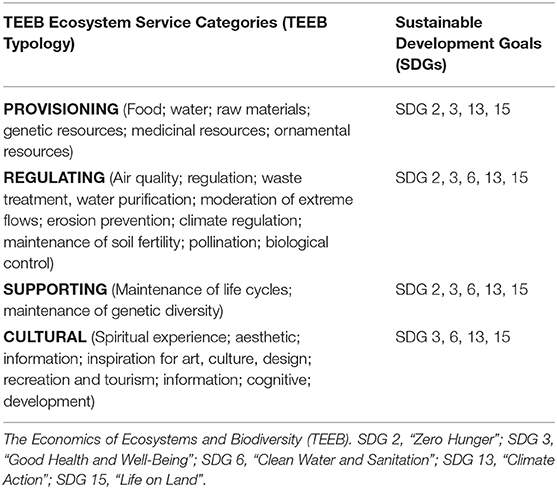
Table 1. Connection between ecosystem services and selected Sustainable Development Goals (SDGs) in relation to soil texture (adapted from Wood et al., 2017).
Soil texture is an inherent soil property related to the mineral fraction (<2 mm in size), which is derived from lithosphere (Figure 1). Soil texture can be defined informally as the way the soil “feels” or using a more formal definition as the proportion of sand, silt, and clay (excluding organic matter and carbonates) in <2 mm particle fraction. Soil texture can be determined qualitatively (texture by feel analysis) or quantitatively (hydrometer, pipette methods, etc.; Gee and Bauder, 1986). There are various uses and interpretations of sand, silt, clay and coarse fragments, for example: name of soil separate with a specific diameter limit (e.g., clay is <0.002 mm in size, etc.), soil texture class (e.g., sandy clay, etc.), rock fragment (%) modifier of texture (e.g., gravelly, etc.; U.S. Department of Agriculture, 2017). The coarse fraction is not part of the formal definition of soil texture since texture applies to the particle fraction <2 mm in size. In addition to particle size separation, soil texture commonly implies a general relationship between particle size and kinds of minerals present (e.g., sand is primarily composed of quartz; clay is primarily composed of secondary silicate minerals, etc.; Figure 2).
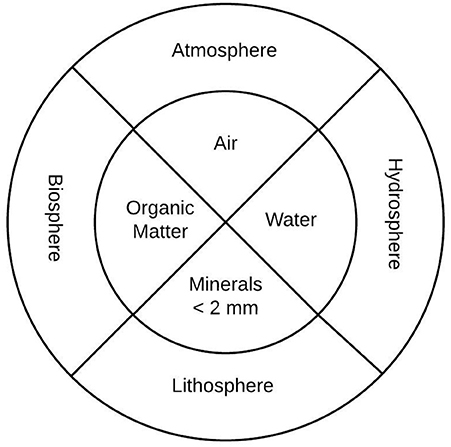
Figure 1. Soil texture is an inherent soil property related to the mineral fraction (<2 mm in size), which is derived from lithosphere.
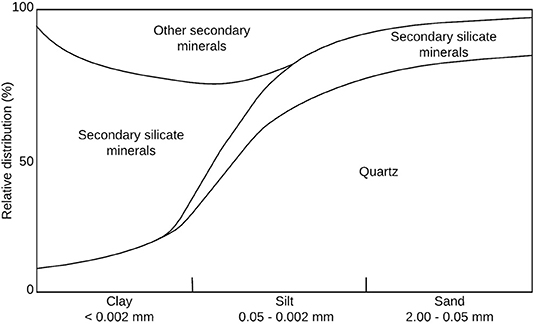
Figure 2. General relationship between particle size and kinds of minerals present (adapted from Brady and Weil, 2002).
Contribution of lithospheric resources (e.g., soil texture, etc.) to soil ES can be examined using a combined social-ecological system proposed by Jones et al. (2016) (Table 2). Based on this system, lithospheric capital can be “natural” (minimum human impact), “natural + human derived” (e.g., agricultural, peri-urban areas, etc.), and “human-derived” (e.g., urban areas, etc.). Lithospheric stocks are quantifiable amounts of material with units defined in a spatial context, and can be measured as separate pure constituent stocks (e.g., 100% sand, 100% silt, 100% clay) or as composite stock (e.g., loam with various proportions of sand, silt, and clay). Flows into or from stocks represent quantities or proportions per unit area per unit of time (e.g., illuvial accumulation of clay in the Bt horizon, etc.). Stocks are often examined on a mass basis, but soil texture is customarily expressed as proportions of the whole, therefore when discussing stocks and changes in stocks for soil texture, it is most useful to use proportions of a total. It is not clear that a mass basis would support a greater understanding of soil texture stocks.
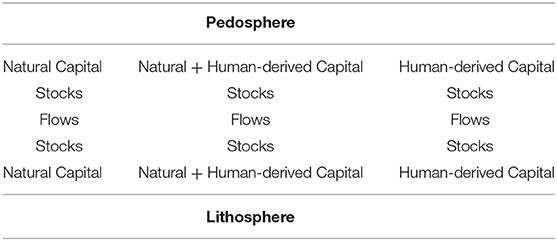
Table 2. The building blocks of a systems approach to describing lithosphere and pedosphere ecosystem services exchange (modified from Jones et al., 2016).
Analysis of ecosystem services provided by sand, silt, clay, and coarse fragments should specify if these key soil properties are used as separate pure constituent stocks and/or as composite stocks, the context of use (e.g., size, mineralogy, etc.) and type of valuation (e.g., based on “soil” or “mineral” derived commodities, etc.). Mineral derived commodities related to texture (e.g., clays and their types: bentonite, kaolin, etc.) are commonly extracted from lithological, mineral deposits, which are tracked in terms of production and use (U.S. Geological Survey, 2017) (Figure 3). Current research often refers to these mineral derived commodities to represent soil ES (Table 3), but most likely these commodities were derived from mineral deposits.
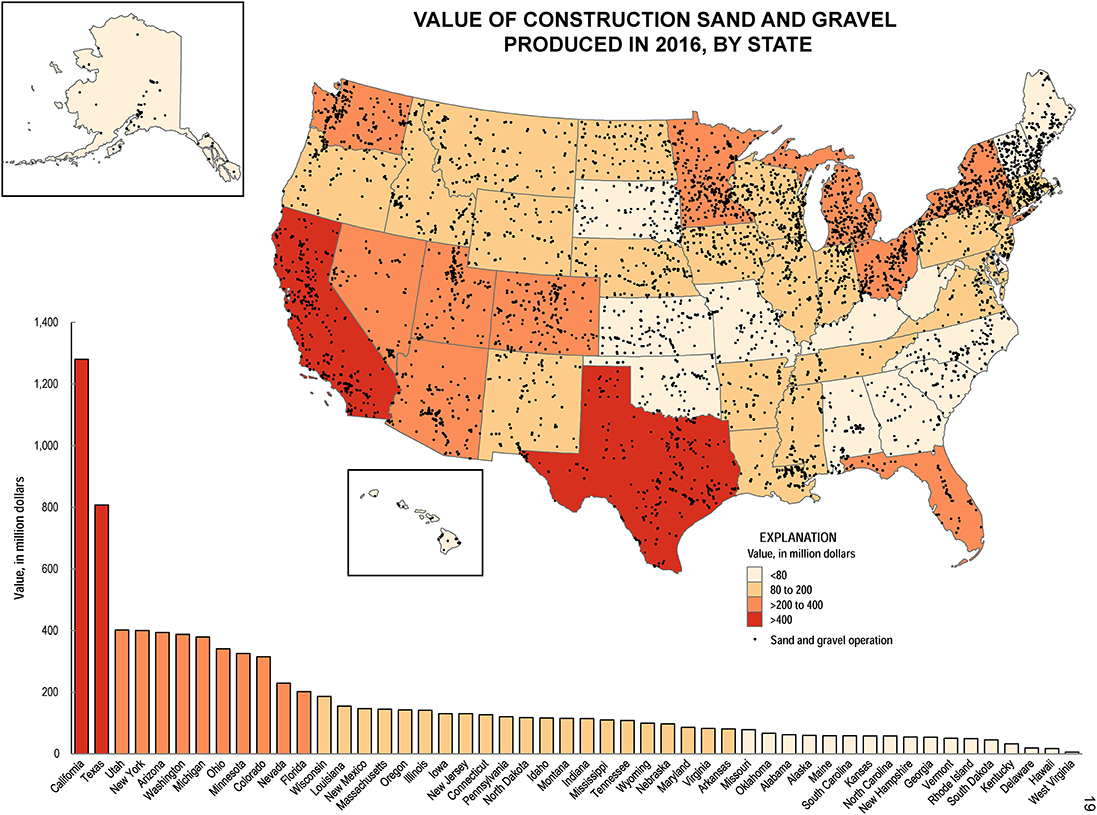
Figure 3. Information about the value of construction sand and gravel from the Mineral Commodities Summary (U.S. Geological Survey, 2017).
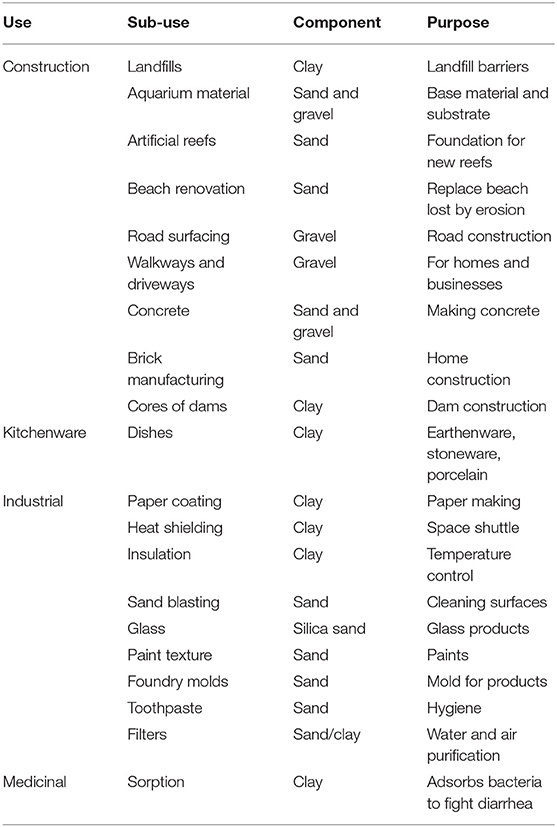
Table 3. Examples of “mineral” derived commodities in relation to sand, clay, and gravel (adapted from Comerford et al., 2013).
Soil texture is quantified in the soil databases, but its monetary value is difficult to assess directly since its components (sand, silt, and clay) are not economical to extract as pure mineral commodities. The ES value of soil texture is recognized in the scientific sense and in association with other soil properties (e.g., available water, infiltration, hydraulic conductivity, etc.). Previous research has shown a wide use of soil texture and coarse fragments in agricultural research with specific benefits obtained from these properties by living organisms. The following examples represent some of the benefits living organisms obtain from texture and coarse fragments based on four categories of ES (Millennium Ecosystem Assessment, 2005) (Table 4):
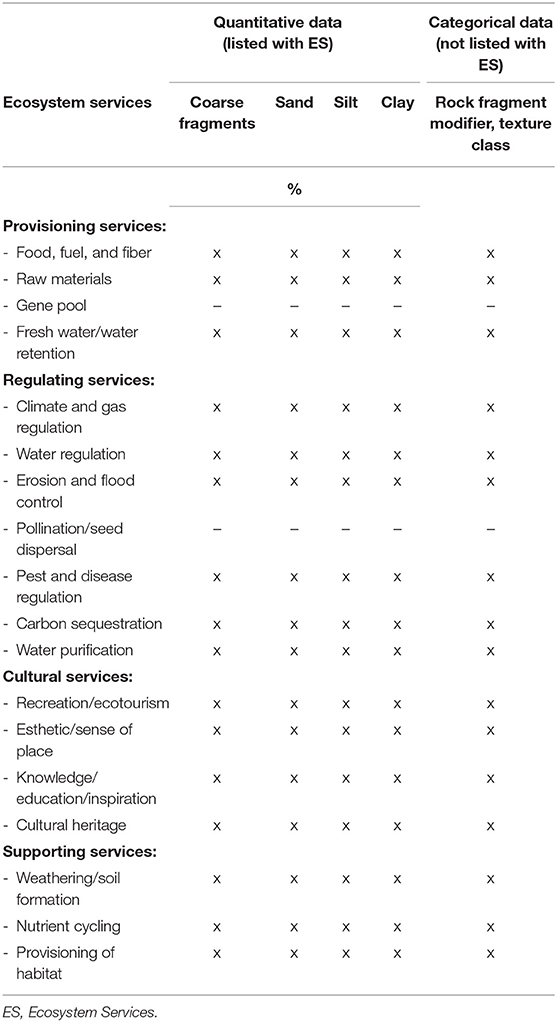
Table 4. List of ecosystem services related to coarse fragments, sand, silt, clay, and texture class.
Provisioning services are products derived from ecosystems (e.g., food, water, raw materials, etc.; Millennium Ecosystem Assessment, 2005). For example, soil texture influences food production because different crops prefer different soil textures (e.g., root vegetables prefer sandy soils; Gibberd et al., 2003); soil with specific texture can be used as raw materials (e.g., “fill” material in urban environments; Jim, 1998); soil texture influences water retention and plant available water (e.g., soil texture is used for soil water retention estimation; Martin et al., 2005; Mikhailova et al., 2018a). Tóth et al. (2013) mapped availability of coarse texture, stones, and gravel in the soils of the European Union (EU) for construction purposes.
Regulating services are benefits derived from the regulation of ecosystem processes (e.g., air quality, waste treatment, etc.; Millennium Ecosystem Assessment, 2005). For example, soil texture is important in climate and gas regulation (e.g., methane emissions in rice production; Brye et al., 2013); water regulation (e.g., water and salt movement under irrigation; Wang et al., 2016; Cole et al., 2017); erosion and flood control (e.g., vulnerability to water erosion; Bonilla and Johnson, 2012); carbon sequestration (Gami et al., 2009); water purification (Karathanasis et al., 2006); and overall soil health (Mikhailova et al., 2018b). Spatial analysis of soil texture can aide in guiding site-specific strategies for controlling pest populations (e.g., root nematode populations can be strongly influenced by sand, silt, and clay content, which may be spatially structured as indicated by soil map-units) (Avendano et al., 2004).
Cultural services are non-material enjoyment people obtain from ecosystems (e.g., spiritual experience, aesthetic, etc.; Millennium Ecosystem Assessment, 2005). A Japanese art form called Dorodango utilizes soils of different texture and mineralogy to form a moist ball of soil with the hand that slowly dries as more soil is added and eventually the surface is polished with a cloth. The final result is a nearly perfect sphere of shining soil. The process is often used as a form of self-reflection and meditation, though many have used the techniques to teach soil mineralogy and texture (Georgeson and Payler, 2013; Hartemink et al., 2014). Soil texture is important in the “rice culture” of South Carolina (Carney, 2000). Rice is one of the largest crops grown globally for consumption. For cultivation, the soil texture must be favorable for water retention and therefore the majority of rice crops are grown in soils with a clayey texture to limit the amount of water lost through percolation (Chapagain and Hoekstra, 2011).
Supporting services are services, which support all other ES (e.g., maintenance of life cycles and genetic diversity, etc.; Millennium Ecosystem Assessment, 2005). These include services such as weathering and soil formation (e.g., development of an argillic horizon; Phillips, 2007); nutrient cycling (e.g., total organic carbon and nitrogen; Bechtold and Naiman, 2006), and provisioning of habitat (e.g., abundance of the European earthworm is influenced by the clay content of the soil; Baker et al., 1998).
The SSURGO database is based on soil information gathered by the National Cooperative Soil Survey (NCSS) based on field estimates, ranges of properties that fit within the taxonomic class, and laboratory analyses compiled from USDA-NRCS and university (PEDON) databases (Soil Survey Staff, 2017). The data is displayed by soil map unit (SMU) for most areas in the United States (U.S.) and its Territories, Commonwealths, and Island Nations (Soil Survey Staff, 2017). Soil map units describe soils and other spatial components found in predictable locations across the landscape with unique properties, interpretations, and productivity (Soil Survey Staff, 2017). The SMUs are typically labeled based on the major component or components (Soil Survey Staff, 2017). Soil maps are available at scales ranging from 1:12,000 to 1:63,360 (Soil Survey Staff, 2017). Currently, the SSURGO database provides quantitative information for coarse fragments (CF), sand (S), silt (Si), and clay (C) by layers that must be correlated to describe soil horizons. SSURGO reports three related values for each attribute as “low,” “representative value” (RV), and “high” values. The “low” and “high” values is the typical range of values of the attribute in the SMU, or soil horizon, while the RV is an average or expected value of the attribute in the SMU, or soil horizon (Soil Survey Staff, 2017) in the survey area. Another source of data for components of SSURGO map units is the Official Soil Series (OSD) database. The OSD database contains a description of each soil series. The typifying pedon for the series describes the amount of rock fragments and the texture class for each soil horizon, and the OSD also gives ranges of soil properties for each genetic horizon (e.g., A, E, Bt1, Bt2, etc.). Data in the OSD description are used to correlate the layers of SSURGO data and provide more specific horizon data than SSURGO. Both data sources are ubiquitous in extent for use anywhere in the U.S. with existing soil surveys, and contain data that can be substituted for on-site sampled data that is not always available.
The issue of soil heterogeneity has been extensively studied for various applications (e.g., geotechnical, agricultural fields, etc.), and it is commonly classified into two main categories: lithological and inherent spatial soil variability (Elkateb et al., 2003; Zhou et al., 2017). Lithological heterogeneity commonly relates to lithological inclusions within the soil in contrast to the inherent spatial soil variability, which is the variation of soil properties from one point (Elkateb et al., 2003).
This study compares mapping surface soil texture from SSURGO databases to actual field measurements within SMUs. Many farm and/or field-scale ES studies use SSURGO, but the error associated with this database is often not quantified or is simply unknown (Fortin and Moon, 1999; Jiang et al., 2007). The surface soil (Ap) horizon is particularly important in agriculture and the provisioning ES (Chandler et al., 2018; Mikhailova et al., 2018a). The aims of this study were to: (1) map averaged and interpolated values for CF, S, Si, and C resulting from soil core measurements taken within SSURGO SMU boundaries, (2) compare field estimates of CF, S, Si, and C with estimates based on existing SSURGO database information, and (3) discuss the potential of using soil texture in the ES framework evaluation at the farm scale.
Materials and Methods
The Accounting Framework
Lithospheric-derived resources such as soil texture and coarse fragments can be valued as “soil” or “mineral” stocks (Table 5). Lithospheric stocks are quantifiable amounts of material with units defined in a spatial context, and can be measured as separate pure constituent stocks (e.g., 100 % sand, 100% silt, 100% clay) or as composite stock (e.g., loam with various proportions of sand, silt, and clay) with direct-use utilization. On the other hand, soil texture as a “soil” stock is commonly associated with indirect-use utilization (e.g., matrix for available water, soil infiltration, etc.). Table 5 provides an accounting framework for valuation of soil texture.
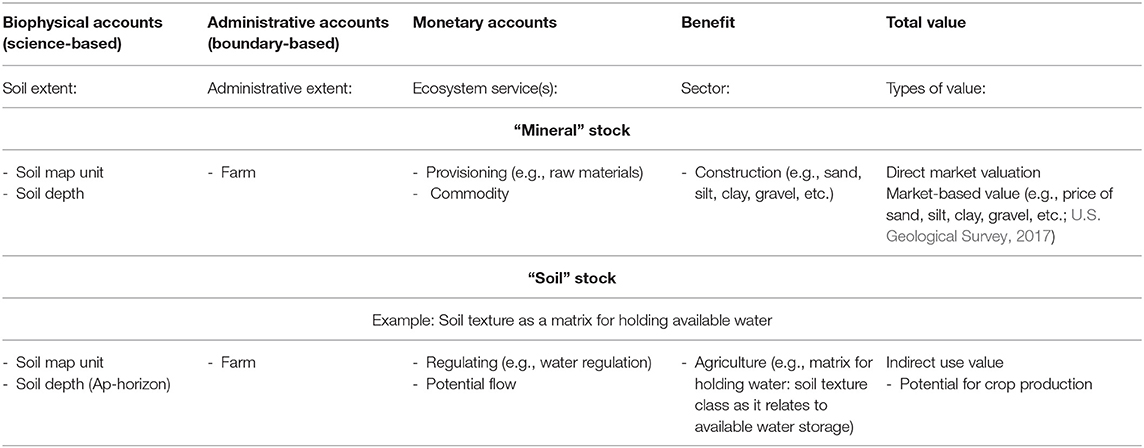
Table 5. Conceptual overview of the soil texture and coarse fragment accounting framework (“mineral” vs. “soil” stock) with examples related to the Willsboro farm, NY, United States.
Study Area
The Willsboro Research Farm (located near Willsboro, NY, USA in the NE part of New York State) is maintained by the Cornell University Agricultural Experiment Station (Sogbedji et al., 2001). The 147-hectare site consists of relatively flat to rolling topography and is found on Willsboro point next to Lake Champlain (Mikhailova et al., 1996). The site has ~150 days growing season with temperate climate (Mikhailova et al., 1996). Highly variable soils are found throughout the farm because of glacial deposits (e.g., sands, clays, and glacial till) which represent soil orders Inceptisols, Entisols, and Alfisols (Table 6).
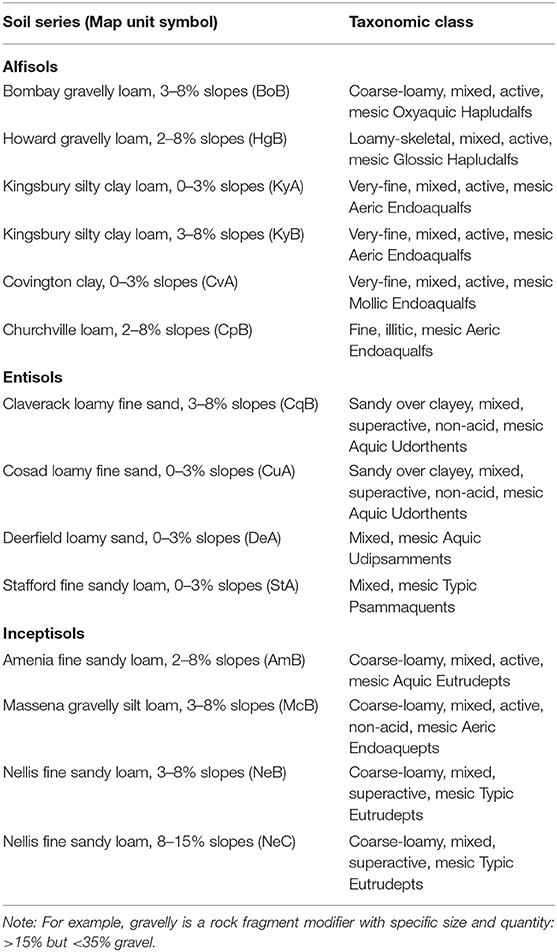
Table 6. Soil types within Willsboro Farm with corresponding coarse fragments and particle size information included in map unit symbol and family category of taxonomic class.
Soil Sampling and Laboratory Analysis
A total of 54 soil cores were taken by laying out a surveyed grid sample pattern on the farm fields in the summer of 1995 where each grid was 137.16 m by 137.16 m (Cole et al., 2017). A professional land surveyor determined elevations for each sample location by using a Total Station (Set 2C SOKKISHA) tied to a local benchmark with a standard deviation of ±3 mm (Mikhailova et al., 1996). A Giddings hydraulic soil sampler (Model GSR-T-S) was used with plastic liners (4.5 cm diameter) to obtain undisturbed soil cores. The soil cores were of variable depth because of the available sample depth possible with the sampler (Mikhailova et al., 1996).
Soil cores were stored before processing by placing them vertically in a refrigerator at 1°C (Mikhailova et al., 1996). Soil cores were separated by horizons and coarse fragments (soil sample percent >2 mm) were measured. Soil samples were tested for an effervescence reaction using weak HCl. Soil samples consisting of the sectioned cores, with coarse fragments removed, were air-dried, and then ground and processed through a 2 mm sieve. The pipette method was used to determine particle-size distribution of this <2 mm fraction after first treating for removal of organic matter (using 30% H2O2) and carbonates and soluble salts (using 1 M NaOAc at a pH of 5; Gee and Bauder, 1986). This study only used the surface soil (Ap horizon) samples.
On-Line Soil Data and Spatial Analysis
Surface soil (Ap horizon) RV of S, Si and C (in %) were obtained directly from the SSURGO database (available from web browser search for “ssurgo data”). The soil texture class was determined from texture triangle (Cole et al., 2017). Content of CF (in %) for the surface soil were obtained from SSURGO or the OSD for the dominant soil in each SMU. Data from OSDs were found by web browser search for “official soil series database” or by typing the name of the soil series searched for in a web browser (e.g., “Bombay series”).
Boundaries and composition of the SMUs were obtained from the online SSURGO source at scale of 1:12,000 and mapped in ArcGIS 10.4 (Environmental Systems Research Institute, 2016). The SMUs at the Willsboro Research Farm all had only one dominant soil. SSURGO and OSD values for each SMU were then applied to the corresponding SMU areas using ArcGIS 10.3 (Environmental Systems Research Institute, 2016). From the field measurements, the average CF (%), S (%), Si (%), and C (%) of soil cores taken from within each SMU were applied evenly across the SMU. In a similar fashion, CF (%), S (%), Si (%), and C (%) values were calculated by multiplying the SMU-averaged content values by the corresponding SMU area.
Inverse distance squared weighting (IDW) from the 12 nearest sampling points was utilized to interpolate results from the 54 soil cores across the study area using a 1 m grid cell size in ArcGIS 10.3 (Environmental Systems Research Institute, 2016). This resulted in maps that estimated CF (%), S (%), Si (%), and C (%) for each 1 m2 of the field site. SSURGO SMU boundaries were used to assign the interpolated values to a SMU name. Inverse distance weighting (IDW) is a deterministic, spatial interpolation method, which is commonly used in many GIS software packages (Lu and Wong, 2008; Li and Heap, 2011, 2014). Although kriging methods generally are preferred over IDW when working with spatially clustered data, IDW methods tend to work well with regularly gridded data (e.g., Isaaks and Srivastava, 1989; Li and Heap, 2011, 2014). Inverse distance weighting is efficient computationally and generally is considered to be highly suitable for sparse data collected on a regular grid (Li and Heap, 2014).
Results and Discussion
Soils have been recognized as a key regulator of ecosystem functions but their value is rarely quantified. Quantitative assessment of soil ecosystem services and its value at various spatial scales requires use of soil survey databases and/or field data (Adewopo et al., 2014; Dominati et al., 2014). Shrinking financial resources dedicated to soil science research (Adewopo et al., 2014) require a close examination of utility of soil survey databases compared to field data, which is expensive to collect and analyze. There are advantages and disadvantages of using already existing soil survey databases for ecosystem services assessment. Advantages of using these databases include: (1) readily available at no cost, (2) soil data is collected and analyzed using standardized procedures, (3) soil maps are also created using standardized procedures at known scales, (4) soil databases and maps are often integrated with other spatial data sources related to land cover and use, and 5) represents a respected source of information. Disadvantages of using these soil databases include: (1) lack of detailed spatial resolution, (2) not designed for integration with ecosystem services, (3) crisp boundaries that do not necessarily represent natural conditions, (4) often created with limited field data, (5) focus on “shallow” soil, (6) data can be extrapolated instead of measured with depth, (7) static, and (8) not dynamic in temporal sense (Baveye et al., 2016; Small et al., 2017). Among soil properties, soil texture and mineralogy play a crucial role in the soil natural capital (Palm et al., 2007).
Coarse Fragments and Rock Modifiers
Coarse fragments (%) are important for ecosystem services assessment, and can be obtained from the OSD soil map unit name (e.g., Bombay gravelly loam contain >15% but <35% of coarse fragments of gravel size class), or from soil profile descriptions for individual soil horizons of each series (Table 6). For example, for the Bombay soil series description (Official Series Description database), the Ap horizon in the typifying pedon description has 20% gravel and 5% cobbles. The rock fragment (RF) texture modifiers based on size and shape class and quantity (e.g., gravelly, very cobbly, extremely stony, etc.) can be derived using the data from SSURGO map unit names (e.g., Bombay gravelly loam), or from the OSD typifying pedon, or from on-site field measurements (e.g., Bombay gravelly loam contain >15% but <35% of coarse fragments of gravel size class), or from soil profile descriptions. Coarse fraction (%) derived from SSURGO and obtained in the field did not agree. Field data CF values were higher for Entisols and Inceptisols than SSURGO values (Figure 4). Correlation plot of CF estimates for each SMU revealed no statistically significant correlations between SSURGO and field-averaged (r = 0.466, p = 0.174) and field-interpolated CF (r = 0.146, p = 0.618) estimates (Figure 5A).
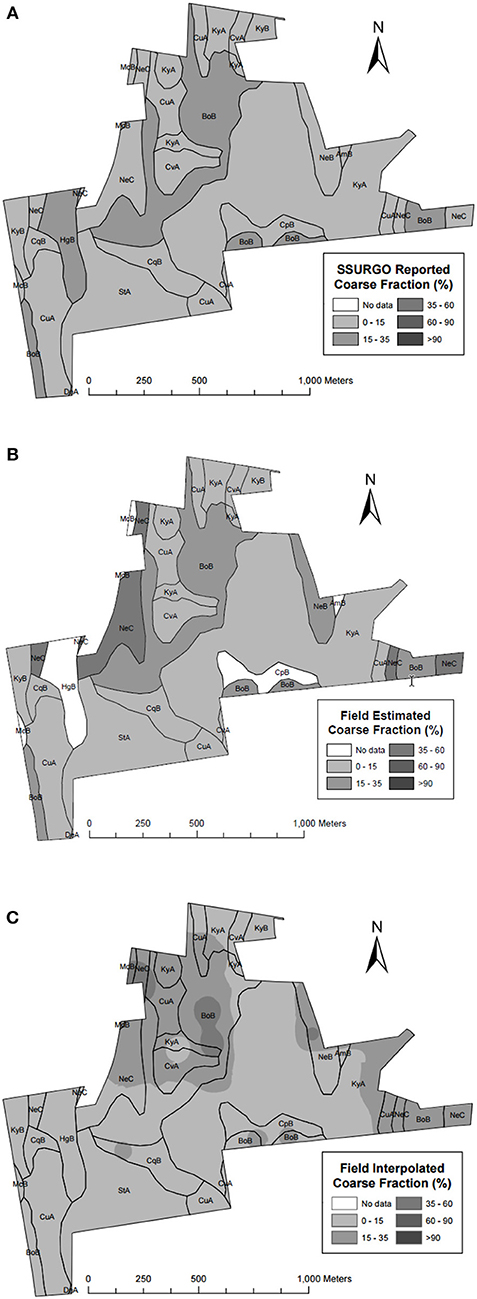
Figure 4. Coarse fraction (CF) content (%): (A) from SSURGO representative values for each SMU, (B) from soil core sample results averaged over SMUs, and (C) interpolated from soil core sample results. In the middle figure only, some SMUs did not have soil cores taken from them and therefore appear as zero in the map.
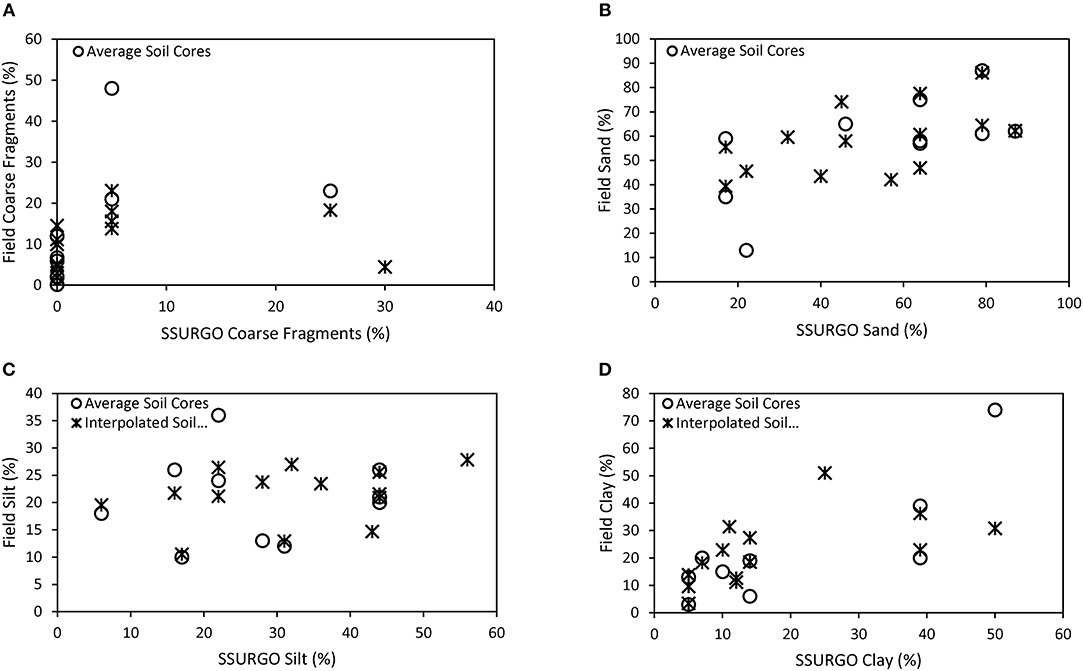
Figure 5. Bivariate correlation plots of: (A) coarse fragments, (B) sand, (C) silt, and (D) clay for field results vs. SSURGO results for each SMU.
In terms of ES, CF (%) is listed in ES framework as quantitative data. However, rock fragment (RF) texture modifiers are currently not included in the framework even though these data are available from SSURGO, OSD, and field measurements. Rock fragment modifiers play an important role in ES such as providing cultural services. For example, soils of the Willsboro farm formerly contained large amounts of stones, which were used to build typical “New England stone walls” and provide numerous cultural services (e.g., esthetic sense of place and cultural heritage, etc.; Thorson, 2004). According to Thorson (2004), stone walls were the biggest investment on a farm and became the “defining element” of the Northeast's landscape symbolizing the shift to an agricultural economy.
Comparison of Field Sampling and Soil Survey Database for Sand, Silt, Clay, and Texture Class
Sand (%) is reported in SSURGO data and can be obtained from field measurements as well. Sand (%) derived from SSURGO and obtained in the field were both variable (Figure 6) with field data reporting values for sand within the ranges reported by SSURGO (Figure 6). Correlation plot of sand estimates for each SMU revealed statistically significant correlations between SSURGO and field-averaged (r = 0.668, p = 0.035) and field-interpolated sand (r = 0.531, p = 0.051) estimates (Figure 5B).
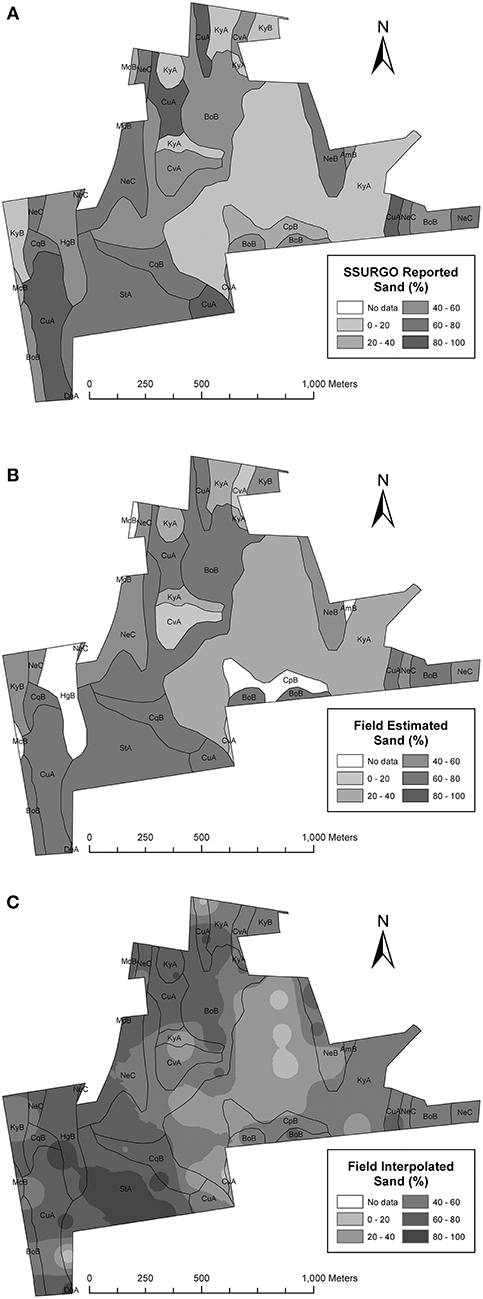
Figure 6. Sand (S) fraction (%): (A) from SSURGO representative values for each SMU, (B) from soil core sample results averaged over SMUs, and (C) interpolated from soil core sample results. In the middle figure only, some SMUs did not have soil cores taken from them and therefore appear as zero in the map.
Silt (%) derived from SSURGO and obtained in the field were both variable (Figure 7) with field data reporting values for silt lower than values reported by SSURGO (Figure 7). Correlation plot of silt estimates for each SMU revealed no statistically significant correlations between SSURGO and field-averaged (r = 0.057, p = 0.876) and field-interpolated silt (r = 0.304, p = 0.291) estimates (Figure 5C).
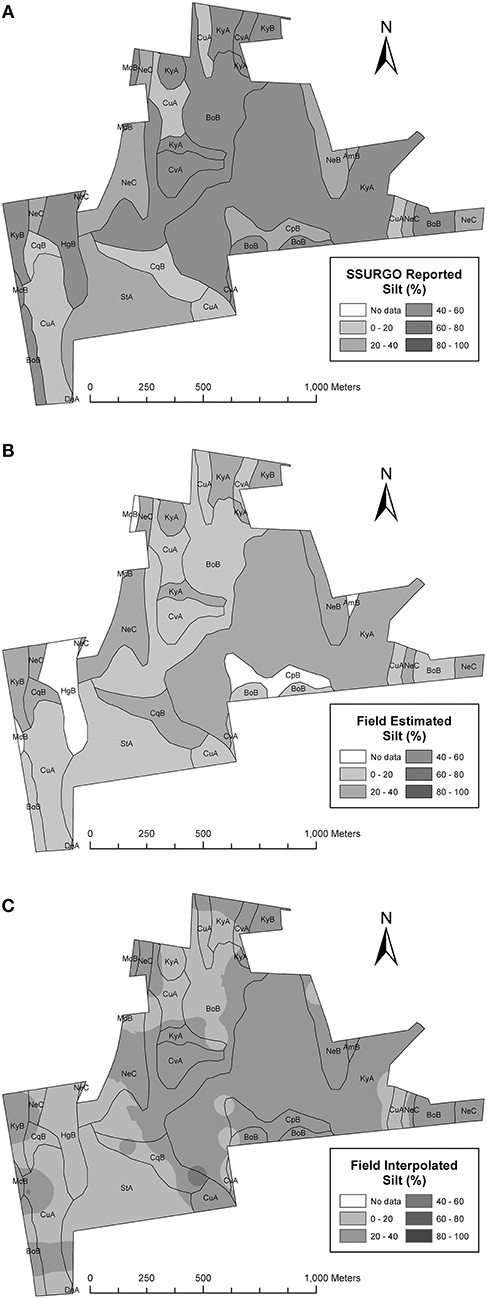
Figure 7. Silt (Si) fraction (%): (A) from SSURGO representative values for each SMU, (B) from soil core sample results averaged over SMUs, and (C) interpolated from soil core sample results. In the middle figure only, some SMUs did not have soil cores taken from them and therefore appear as zero in the map.
Clay (%) derived from SSURGO and obtained in the field were both variable (Figure 8) with field data reporting values for clay higher than values reported by SSURGO for CvA soil map unit (Figure 8). Correlation plot of clay estimates for each SMU revealed statistically significant correlations between SSURGO and field-averaged (r = 0.823, p = 0.003) and field-interpolated clay (r = 0.584, p = 0.028) estimates (Figure 5D).
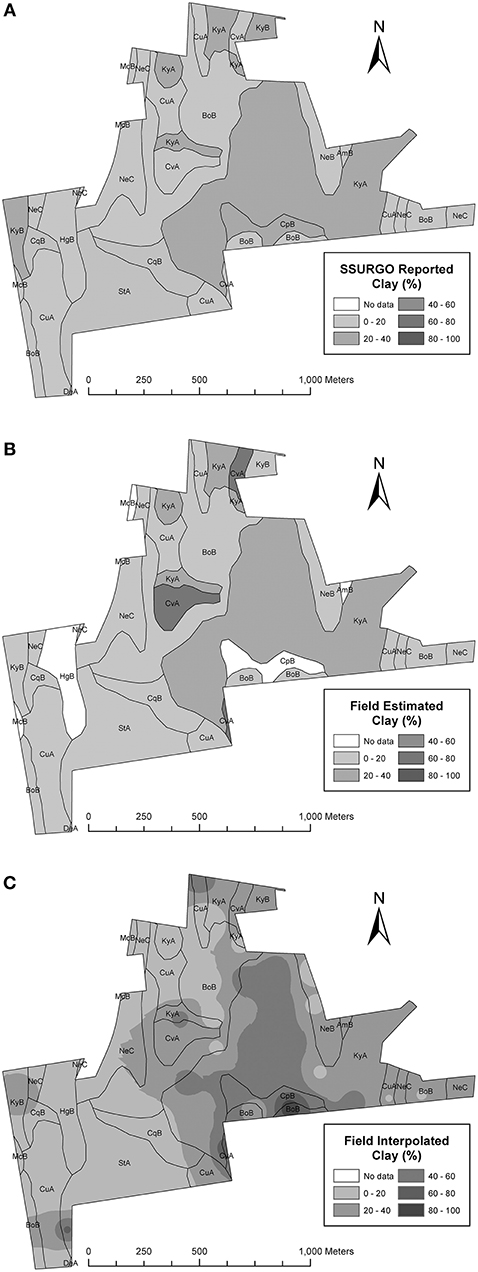
Figure 8. Clay (C) fraction (%): (A) from SSURGO representative values for each SMU, (B) from soil core sample results averaged over SMUs, and (C) interpolated from soil core sample results. In the middle figure only, some SMUs did not have soil cores taken from them and therefore appear as zero in the map.
Soil texture class (categorical data) is currently not included in the ecosystem services framework, but it is commonly used by soil scientists and provided in SSURGO when there is only one dominant soil in the SMU, in OSD, and in field soil descriptions. Texture classes for many of the soil map units on the farm were different based on SSURGO data vs. field-measured estimates (Figure 9).
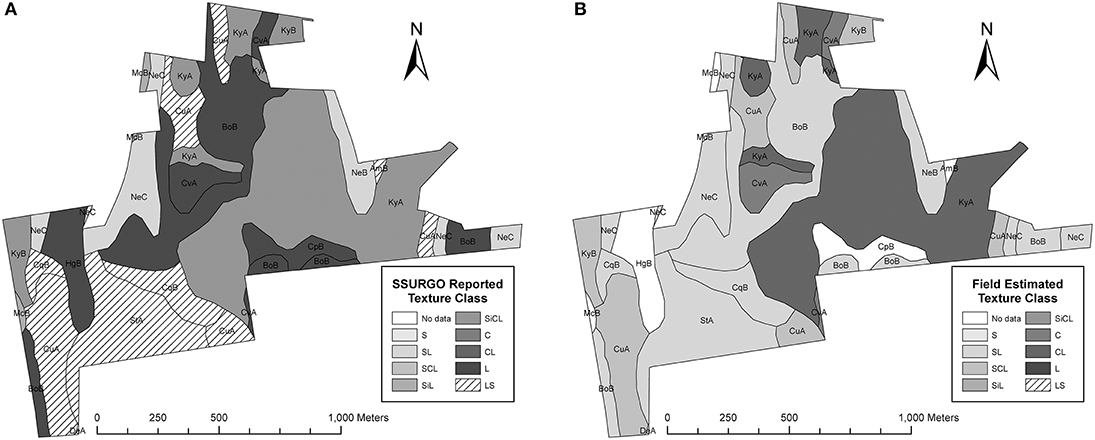
Figure 9. Soil texture class: (A) from SSURGO representative values for each SMU, (B) from soil core sample results averaged over SMUs. S, sand; LS, loamy sand; SL, sandy loam; L, loam; SiL, silt loam; SCL, sandy clay loam; CL, clay loam; SiCL, silty clay loam; C, clay.
Soil texture determines the surface area, porosity, nutrient, and water holding capacity, water infiltration, etc., necessary for ecosystem processes (Parton et al., 1987; Palm et al., 2007; Cole et al., 2017). Several experiments conducted at the Willsboro Research Farm demonstrate the significance of soil texture in providing ecosystem services. For example, the grass biomass yields of Switchgrass (“Cave-in-Rock”) and cool-season grasses (CSG) tall fescue (endophyte-infected, “KY-31”) and reed canarygrass (“Rival”) were higher on the clay than the sandy soils at the Cornell Baker Research Farm at Willsboro, NY (Cherney et al., 2013). Soil texture was a significant factor in nitrogen transformation rates with the cropping history of alfalfa (Medicago sativa), grass sod (primarily fescue Festuca rubra) with denitrification rates higher for the clay site compared to the sand site (Sogbedji et al., 2001). Soil texture class is also important in field assessments of infiltration rate, hydraulic conductivity, available water, soil interpretations (e.g., construction limitations, etc.), erosion potential (Karathanasis et al., 2013), and merits inclusion in the ecosystem services framework (Mikhailova et al., 2018a).
Challenges in Assessing Ecosystem Services of Sand, Silt, Clay, Coarse Fragments, and Soil Texture
Soil texture often relates to the mineral composition of soil. For example, sand is composed primarily of quartz, SiO2, which provides limited plant nutrients in contrast to clay which can be a significant source of various nutrients as a result of weathering. Assessing ecosystem services of sand, silt, clay, coarse fragments, and texture is a challenging and complex task, because it can be “soil” or “mineral” stocks. Although these soil properties are extensively described and quantified in the existing soil databases they are often linked to the “mineral” commodities instead of “soil” stocks. For example, Comerford et al. (2013) list numerous uses of soil materials/particles derived from “shallow to deep subsoils” (Table 3), but most likely these materials/particles are mined from mineral deposits (e.g., sand and gravel deposits are found on beaches, rivers, and streams). These “mineral” commodities are often monitored and valued on a regular basis in contrast to the “soil” commodities. For example, Mineral Commodities Summaries (U.S. Geological Survey, 2017) provide annual reports for clays, sand and gravel (construction, industrial), stone (crushed, dimension) mined from specific operations, and used primarily for industrial and constructions purposes (Figure 3). For example, New York ranked 14th in 2016 in terms of value of non-fuel mineral production in the United States with stone (crushed), sand and gravel (construction), and clays (common) listed as some principle minerals mined from various operations. The “soil” derived material/particles commodities are often not economical to “mine” as “mineral” commodities from the soil and that is why they are not included in the standard Mineral Commodities Summaries (U.S. Geological Survey, 2017). Soil mineral particles as “soil” stocks can be used/mined over and over (e.g., as a matrix for plant growth) in contrast to “mineral” commodities, which are often used as one-time use commodities with the exception when they are recycled. The difference between soil texture as a “mineral” or “soil” stock can be incorporated into the accounting framework (Table 5). For example, surface soil texture at the Willsboro Farm can be a source of sand for construction purposes, which can be valued based on available commodity prices for construction sand (U.S. Geological Survey, 2017). On the other hand, the value of soil texture at the Willsboro Farm in relation to plant available water (Mikhailova et al., 2018a), and infiltration rate (Cole et al., 2017) is linked to indirect use value (Table 7). Table 8 demonstrates the lithosphere-pedosphere-hydrosphere ecosystem services exchange, stocks, goods, flows, and ownership at the farm scale. Lithosphere provides pedosphere with mineral fraction (<2 mm in size) which serves as a matrix for holding available water provided by hydrosphere via ecosystem services flow. Since this study is conducted at the farm scale it creates an intricate ownership interplay since both lithospheric and pedospheric stocks are private within the farm boundaries, and hydrospheric resources are common-pool resources since they are not restricted by the farm boundaries. In this case available water attached to the soil particles is a tangible source of water (benefit obtained from regulation of hydrospheric ecosystem services) that can be consumed by crops (Ban et al., 2015). Su et al. (2018) stressed the important of “disentangling” the intricate links and processes essential to ES.
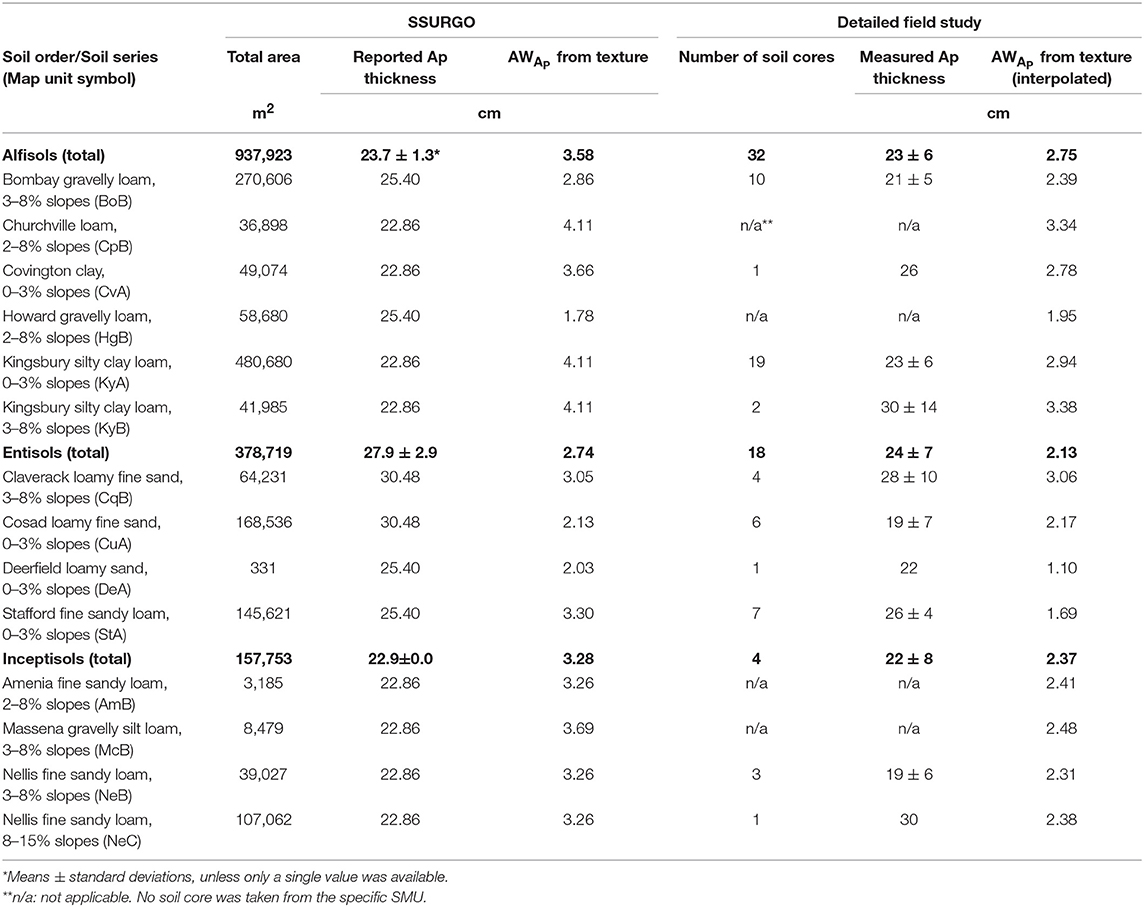
Table 7. Example of the effect of spatial heterogeneity of soil texture on the available water for the Ap horizon (AWAp) by soil type and soil order from SSURGO and detailed field study (modified from Mikhailova et al., 2018a).
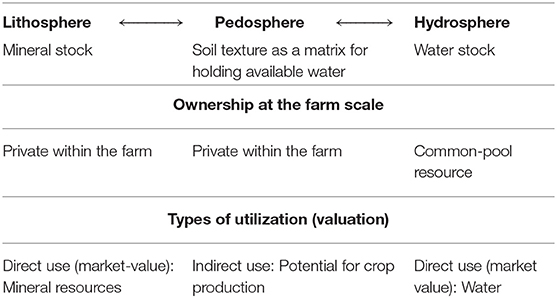
Table 8. Lithosphere-pedosphere-hydrosphere ecosystem services exchange, stocks, goods, flows (represented by arrows), and ownership at the farm scale in relation to soil texture and available water.
According to Grunwald et al. (2011), there are numerous limitations in using existing soil survey databases (including SSURGO). Soils are commonly mapped based on a typical pedon physical and chemical description and by identifying boundaries between different soil types. Grunwald et al. (2011) refers to these boundaries as “double crisp” because this spatial soil data is categorized by “crisp” map unit boundaries and “crisp” soil classes which do not represent soil physical and chemical property variation or allow for error assessment or uncertainty evaluation. Our study demonstrates the important distinction between mapping using the “crisp” boundary soil SSURGO databases (Figures 4A, 6A, 7A, 8A) compared to the actual spatial heterogeneity of field interpolated data (Figures 4C, 6C, 7C, 8C). Because of how the SSURGO databases were constructed at a typical scale of 1:12,000 using the polygon soil boundaries, they fail to represent actual field-scale variation in soil texture and coarse fraction which is clearly evident when the SSURGO and field interpolated maps are compared. This may affect both spatial and overall estimates of these soil physical properties as they relate to ecosystem services.
Conclusions
Lithospheric-derived resources such as soil texture and coarse fragments are key soil physical properties that contribute to ecosystem services (ES), which can be valued based on “soil” or “mineral” stocks. These stocks can be measured and valued as separate constituent stocks (e.g., % sand, % silt, % clay) or as composite (total) stocks: sand (%) + silt (%) + clay (%) = 100% (e.g., soil texture classes: loam, silty clay loam, etc.). For soil texture as a “mineral” stock, government Mineral Commodities Summaries provide annual reports for clays, sand and gravel (construction, industrial), stone (crushed, dimension) mined from specific operations, and used primarily for industrial and construction purposes. For soil texture as a “soil” stock, SSURGO data of CF (%), S (%), Si (%), and C (%) at the SMU can be used for soil ecosystem framework assessment, especially regarding sand and clay fractions. Categorical data (rock fragment, and texture class) are not currently included in the ecosystem services framework, but provide important information commonly used in agriculture and environmental science and therefore should be incorporated. Visual comparison shows that the SSURGO data differs from the higher resolution interpolated soil property maps based on field data. Care needs to be taken when deriving ecosystem services from existing soil databases (e.g., SSURGO) because they often provide limited information on both the physical property variability and spatial variability. The resolution of soil data needed to accurately estimate soil ecosystem services depends on the type of service and its relation to other environmental attributes. Soil maps in the future need to be represented at the same spatial resolution as the related land cover which is often mapped at a higher spatial resolution (e.g., 30 m pixel) with a known accuracy. Soil texture is often linked to other soil properties, which are valued based on indirect-use opposed to direct-use valuation.
Author Contributions
EM: conceptualization. EM and MS: methodology. MC and HZ: visualization, EM, CP, MS, PG, GG, RS, and JG: writing–review and editing.
Funding
Clemson University provided funding for this study. Technical Contribution No. 6528 of the Clemson University Experiment Station. This material is based upon work supported by NIFA/USDA, under project number SC-1700541.
Conflict of Interest Statement
The authors declare that the research was conducted in the absence of any commercial or financial relationships that could be construed as a potential conflict of interest.
References
Adewopo, J. B., VanZomeren, C., Bhomia, R. K., Almaraz, M., Bacon, A. R., Eggleston, E., et al. (2014). Top-ranked priority research questions for soil science in the 21st century. Soil Sci. Soc. Am. J. 78, 337–347. doi: 10.2136/sssaj2013.07.0291
Adhikari, K., and Hartemink, A. (2016). Linking soils to ecosystem services – a global review. Geoderma 262, 101–111. doi: 10.1016/j.geoderma.2015.08.009
Avendano, F., Pierce, F. J., Schabenberger, O., and Melakeberhan, H. (2004). The spatial distribution of soybean cyst nematode in relation to soil texture and soil map unit. Agron. J. 96, 181–194. doi: 10.2134/agronj2004.1810
Baker, G. H., Carter, P. J., Curry, J. P., Cultreri, O., and Beck, A. (1998). Clay content of soil and its influence on the abundance of Aporrectodea trapezoides Dugès (Lumbricidae). Appl. Soil Ecol. 9, 333–337. doi: 10.1016/S0929-1393(98)00085-7
Ban, N. C., Evans, L. S., Nenadovic, M., and Schoon, M. (2015). Interplay of multiple goods, ecosystem services, and property rights in large social-ecological marine protected areas. Ecol. Soc. 20:2. doi: 10.5751/ES-07857-200402
Baveye, P. C., Baveye, J., and Gowdy, J. (2016). Soil “ecosystem” services and natural capital: critical appraisal of research on uncertain ground. Front. Ecol. Environ. 4:41. doi: 10.3389/fenvs.2016.00041
Bechtold, J. S., and Naiman, R. J. (2006). Soil texture and nitrogen mineralization potential across a riparian toposequence in a semi-arid savanna. Soil Biol. Biochem. 38, 1325–1333. doi: 10.1016/j.soilbio.2005.09.028
Bonilla, C. A., and Johnson, O. I. (2012). Soil erodibility and its correlation with soil properties in Central Chile. Geoderma 189, 116–123. doi: 10.1016/j.geoderma.2012.05.005
Brady, N. C., and Weil, R. R. (2002). The Nature and Properties of Soils, 13th Edn. Upper Saddle River, NJ: Prentice Hall.
Brye, K. R., Rogers, C. W., Smartt, A. D., and Norman, R. J. (2013). Soil texture effects on methane emissions from direct-seeded, delayed-flood rice production in Arkansas. Soil Sci. 178, 519–529. doi: 10.1097/SS.0000000000000020
Carney, J. (2000). The African origins of Carolina rice culture. Ecumene 7, 125–149. doi: 10.1177/096746080000700201
Chandler, R. D., Mikhailova, E. A., Post, C. J., Moysey, S. M. J., Schlautman, M. A., Sharp, J. L., et al. (2018). Integrating soil analyses with frameworks for ecosystem services and organizational hierarchy of soil systems. Commun. Soil Sci. Plant Anal. 49, 1835–1843. doi: 10.1080/00103624.2018.1474919
Chapagain, A. K., and Hoekstra, A. Y. (2011). The blue, green and grey water footprint of rice from production and consumption perspectives. Ecol. Econ. 70, 749–758. doi: 10.1016/j.ecolecon.2010.11.012
Cherney, J. H., Paddock, K. M., Ketterings, Q., Davis, M. D., and Cherney, D. J. R. (2013). Grass Biomass Composition as influenced by Fertility. Bioenergy Information Sheet #13. Available online at: www.grassbioenergy.org
Cole, S., Mikhailova, E., Post, C., Privette, C., Schlautman, M. A., and Cope, M. (2017). Comparing SSURGO data versus geospatial field measurements to estimate soil texture and infiltration rate classes in glaciated soils. Commun. Soil Sci. Plant Anal. 48, 1309–1318. doi: 10.1080/00103624.2017.1341916
Comerford, N. B., Franzluebbers, A. J., Stromberger, M. E., Morris, L., Markewitz, D., and Moore, R. (2013). Assessment and evaluation of soil ecosystem services. Soil Horizons. 54. doi: 10.2136/sh12-10-0028
Dominati, E., Mackay, A., Green, S., and Patterson, M. (2014). A soil change-based methodology for the quantification and valuation of ecosystem services from agro-ecosystems: a case study of pastoral agriculture in New Zealand. Ecol. Econ. 100, 119–129. doi: 10.1016/j.ecolecon.2014.02.008
Elkateb, T., Chalaturnyk, R., and Robertson, P. K. (2003). An overview of soil heterogeneity: quantification and implications on geotechnical field problems. Can. Geotech. J. 40, 1–15. doi: 10.1139/t02-090
Environmental Systems Research Institute (2016). ArcGIS Desktop: Release 10.3. Redlands, CA: Environmental Systems Research Institute.
Fortin, M.-C., and Moon, D. E. (1999). Errors associated with the use of soil survey data for estimating plant-available water at a regional scale. Agronomy J. 91, 984–990. doi: 10.2134/agronj1999.916984x
Gami, S. K., Lauren, J. G., and Duxbury, J. M. (2009). Influence of soil texture and cultivation on carbon and nitrogen levels in soils of the eastern Indo-Gangetic Plains. Geoderma 153, 304–311. doi: 10.1016/j.geoderma.2009.08.003
Gee, G. W., and Bauder, J. W. (1986). “Particle-size analysis,” in Methods of Soil Analysis. Part 1, 2nd Edn, ed A. Klute (Madison, WI: Agron. Monogr. 9. ASA and SSSA, 383–411.
Georgeson, J., and Payler, J. (2013). International Perspectives on Early Childhood Education and Care. Two Penn Plaza, NY: Open University Press. p. 244.
Gibberd, M. R., McKay, A. G., Calder, T. C., and Turner, N. C. (2003). Limitations to carrot (Daucus carota L.) productivity when grown with reduced rates of frequent irrigation on a free-draining, sandy soil. Aust. J. Agr. Res. 54, 499–506. doi: 10.1071/AR02127
Grunwald, S., Thompson, J. A., and Boettinger, J. L. (2011). Digital soil mapping and modeling at continental scales: finding solutions to global issues. Soil Sci. Soc. Am. J. 75, 1201–1213. doi: 10.2136/sssaj2011.0025
Hartemink, A. E., Balks, M. R., Chen, Z. C., Drohan, P., Field, D. J., Krasilnikov, P., et al. (2014). The joy of teaching soil science. Geoderma 217–218, 1–9. doi: 10.1016/j.geoderma.2013.10.016
Isaaks, E. H., and Srivastava, R. M. (1989). Applied Geostatistics. New York, NY: Oxford University Press.
Jiang, P., Anderson, S. H., Kitchen, N. R., Sudduth, K., and Sadler, E. J. (2007). Estimating plant-available water capacity for claypan landscapes using apparent electrical conductivity. Soil Sci. Soc. Am. J. 71, 1902–1908. doi: 10.2136/sssaj2007.0011
Jim, C. Y. (1998). Urban soil characteristics and limitations for landscape planting in Hong Kong. Landsc. Urban Plan. 40, 235–249. doi: 10.1016/S0169-2046(97)00117-5
Jones, L., Norton, L., Austin, Z., Browne, A. L., Donovan, D., Emmett, B. A., et al. (2016). Stocks and flows of natural and human-derived capital in ecosystem services. Land Use Policy 52, 151–162. doi: 10.1016/j.landusepol.2015.12.014
Karathanasis, A. D., Galbraith, J. M., Shaw, J. N., and Thompson, J. A. (2013). Handbook for Collegiate Soils Contest. Available online at http://james_thompson.plantandsoil.wvu.edu/r/download/168020 (accessed November 02, 2016).
Karathanasis, A. D., Mueller, T. G., Boone, B., and Thompson, Y. L. (2006). Nutrient removal from septic effluents as affected by soil thickness and texture. J. Water Health 4, 177–195. doi: 10.2166/wh.2006.0015
Li, J., and Heap, A. (2011). A review of comparative studies of spatial interpolation methods in environmental sciences: performance and impact factors. Ecol. Inform. 6, 228–241. doi: 10.1016/j.ecoinf.2010.12.003
Li, J., and Heap, A. (2014). Spatial interpolation methods applied in the environmental sciences: a review. Environ. Modell. Softw. 53, 173–189. doi: 10.1016/j.envsoft.2013.12.008
Lu, G. Y., and Wong, D. W. (2008). An adaptive inverse-distance weighting spatial interpolation technique. Comput. and Geosci. 34, 1044–1055. doi: 10.1016/j.cageo.2007.07.010
Martin, M. A., Pachepsky, Y. A., Rey, J. -M., Taguas, J., and Rawls, W.J. (2005). Balanced entropy index to characterize soil texture for soil water retention estimation. Soil Sci. 170, 759–766. doi: 10.1097/01.ss.0000190507.10804.47
Mikhailova, E. A., Post, C. J., Chandler, R. D., Cole, S. A., Weaver, J. R., Zurqani, H. A., et al. (2018a). Estimating plant-available water in the Ap horizon using geospatial analysis of field and SSURGO data. Commun. Soil Sci. Plant Anal. 49, 1119–1127. doi: 10.1080/00103624.2018.1448864
Mikhailova, E. A., Post, C. J., Schlautman, M. A., Galbraith, J. M., and Zurqani, H. A. (2018b). Usability of soil survey soil texture data for soil health indicator scoring. Commun. Soil Sci. Plant Anal. 49, 1826–1834. doi: 10.1080/00103624.2018.1474918
Mikhailova, E. A., Van Es, H. M., Lucey, R. F., DeGloria, S. D., Schwager, S. J., and Post, C. J. (1996). Soil Characterization Data for Selected Pedons from the Willsboro Farm, Essex County, New York. Research Series R96-5. Ithaca, NY: Department of Soil, Crop, and Atmospheric Sciences, Cornell University. p. 14853.
Millennium Ecosystem Assessment (2005). Ecosystems and Human Well-Being: Synthesis. Washington, DC: Island Press. p. 155.
Palm, C., Sanchez, P., Ahamed, S., and Awiti, A. (2007). Soils: A contemporary perspective. Annu. Rev. Environ. Resour. 32, 99–129. doi: 10.1146/annurev.energy.31.020105.100307
Parton, W., Schimel, D. S., Cole, C. V., and Ojima, D. S. (1987). Analysis of factors controlling soil organic matter levels in Great Plains grasslands. Soil Sci. Soc. Am. J. 51, 1173–1179. doi: 10.2136/sssaj1987.03615995005100050015x
Phillips, J. D. (2007). Development of texture contrast soils by a combination of bioturbation and translocation. Catena 70, 92–104. doi: 10.1016/j.catena.2006.08.002
Small, N., Munday, M., and Durance, I. (2017). The challenge of valuing ecosystem services that have no material benefits. Global Environ. Chang. 44, 57–67. doi: 10.1016/j.gloenvcha.2017.03.005
Sogbedji, J. M., Van Es, H. M., and Hutson, J. L. (2001). N fate and transport under variable cropping history and fertilizer rate on loamy sand and clay loam soils: I. Calibration of the LEACHMN model. Plant Soil 229, 57–70. doi: 10.1023/A:1004875116644
Soil Survey Staff (2017). Natural Resources Conservation Service, United States Department of Agriculture. Web Soil Survey. Available online at: https://websoilsurvey.sc.egov.usda.gov/ (accessed March 30, 2017).
Su, C., Liu, H., and Wang, S. (2018). A process-based framework for soil ecosystem services study and management. Sci. Total Environ. 627, 282–289. doi: 10.1016/j.scitotenv.2018.01.244
Thorson, R. (2004). Stone by Stone: The Magnificent History in New England's Stone Walls. New York, NY: Walker and Company.
Tóth, G., Gardi, C., Bódis, K., Ivits, É., Aksoy, E., Jones, A., et al. (2013). Continental-scale assessment of provisioning soil functions in Europe. Ecol. Process. 2:32. doi: 10.1186/2192-1709-2-32
Turner, R. K., and Daily, G. C. (2008). The ecosystem services framework and natural capital conservation. Environ. Res. Econ. 39, 25–35. doi: 10.1007/s10640-007-9176-6
U.S. Department of Agriculture Natural Resources Conservation Service. (2017). National Soil Survey Handbook, Title 430-VI. Available online at: http://www.nrcs.usda.gov/wps/portal/nrcs/detail/soils/ref/?cid=nrcs142p2_054242 (accessed March 20, 2017).
U.S. Geological Survey (2017). Mineral Commodity Summaries 2017: U.S. Geological Survey. p. 202. doi: 10.3133/70180197
Wang, J. J., Huang, Y. F., and Long, H. Y. (2016). Water and salt movement in different soil textures under various negative irrigating pressures. J. Integr. Agr. 15, 1874–1882. doi: 10.1016/S2095-3119(15)61209-6
Wood, S. L., Jones, S. K., Johnson, J. A., Brauman, K. A., Chaplin-Kramer, R., Fremier, A., et al. (2017). Distilling the role of ecosystem services in the Sustainable Development Goals. Ecosyt. Serv. 29, 70–82. doi: 10.1016/j.ecoser.2017.10.010
Keywords: geographic information systems (GIS), lithosphere, minerals, particle size, soil survey geographic database (SSURGO)
Citation: Mikhailova EA, Post CJ, Gerard PD, Schlautman MA, Cope MP, Groshans GR, Stiglitz RY, Zurqani HA and Galbraith JM (2019) Comparing Field Sampling and Soil Survey Database for Spatial Heterogeneity in Surface Soil Granulometry: Implications for Ecosystem Services Assessment. Front. Environ. Sci. 7:128. doi: 10.3389/fenvs.2019.00128
Received: 30 January 2019; Accepted: 19 August 2019;
Published: 18 September 2019.
Edited by:
Philippe C. Baveye, AgroParisTech Institut des Sciences et Industries du Vivant et de L'environnement, FranceReviewed by:
Sunday Ewele Obalum, University of Nigeria, Nsukka, NigeriaMaxime Fossey, INRA Centre Bretagne-Normandie, France
Copyright © 2019 Mikhailova, Post, Gerard, Schlautman, Cope, Groshans, Stiglitz, Zurqani and Galbraith. This is an open-access article distributed under the terms of the Creative Commons Attribution License (CC BY). The use, distribution or reproduction in other forums is permitted, provided the original author(s) and the copyright owner(s) are credited and that the original publication in this journal is cited, in accordance with accepted academic practice. No use, distribution or reproduction is permitted which does not comply with these terms.
*Correspondence: Elena A. Mikhailova, ZWxlYW5hbUBjbGVtc29uLmVkdQ==