 Malayika M. Cincotta1
 Julia N. Perdrial1*
 Aaron Shavitz1
 Arianna Libenson1
 Maxwell Landsman-Gerjoi1Nicolas Perdrial1
 Jesse Armfield1
 Thomas Adler1
 James B. Shanley2
- 1Environmental Biogeochemistry Lab, Department of Geology, University of Vermont, Burlington, VT, United States
- 2US Geological Survey, Montpelier, VT, United States
Over the past two decades, headwater streams of the northern hemisphere have shown increased amounts of dissolved organic carbon (DOC), coinciding with decreased acid deposition. The exact nature of the mechanistic link between precipitation composition and stream water DOC is still widely debated in the literature. We hypothesize that soil aggregates are the main source of stream water DOC and that DOC release is greater in organic rich, riparian soils vs. hillslope soils. To test these hypotheses, we collected soils from two main landscape positions (hillslope and riparian zones) from the acid-impacted Sleepers River Research Watershed in northeastern Vermont. We performed aqueous soil extracts with solutions of different ionic strength (IS) and composition to simulate changes in soil solution. We monitored dynamic changes in soil particle size, aggregate architecture and composition, leachate DOC concentrations, dissolved organic matter (DOM) characteristics by fluorescence spectroscopy and trends in bioavailability. In low IS solutions, extractable DOC concentrations were significantly higher, particle size (by laser diffraction) was significantly smaller and organic material was separated from mineral particles in scanning electron microscope observations. Furthermore, higher DOC concentrations were found in Na+ compared to Ca2+ solutions of the same IS. These effects are attributed to aggregate dispersion due to expanding diffuse double layers in decreased IS solutions and to decreased bridging by divalent cations. Landscape position impacted quality but not quantity of released DOC. Overall, these results indicate that soil aggregates might be one important link between Critical Zone inputs (i.e., precipitation) and exports in streams.
Introduction
Over the last few decades increased levels of dissolved organic carbon (DOC) have been observed in forested streams across the northern hemisphere (Monteith et al., 2007; Porcal et al., 2009) and several processes have been proposed to explain observed patterns. For example, some studies indicate that increases in DOC are consistent with a climate change driver including changing temperature or hydroclimatic conditions (Freeman et al., 2001; Worrall and Burt, 2007; Eimers et al., 2008; Lepistö et al., 2008). Other suggested drivers include changes in nitrogen deposition (Stuart, 2005) or land management practices (Yallop and Clutterbuck, 2009). Lastly, recovery from acidification is put forth as a general driver for observed changes in stream water DOC (Evans and Monteith, 2001; De Wit et al., 2007; Monteith et al., 2007; Hruška et al., 2009; Kang et al., 2018). The latter is consistent with the observation of a significant reduction in acid anion concentrations (i.e., sulfate) in many catchments that show increases in DOC (Monteith et al., 2007). It is also in agreement with the observations of DOC increases with decrease in ionic strength (IS, Hruška et al., 2009). However, only a few studies have focused on the precise mechanisms of DOC release (Monteith et al., 2007; Haaland et al., 2010), making it difficult to investigate the link between Critical Zone input (i.e., precipitation) and stream water export.
Streams integrate complex and coupled hydrological and biogeochemical processes at hillslopes, riparian areas, in the hyporheic zone, and the stream itself (Lohse et al., 2009). In forested catchments, stream DOC is mostly allochthonous (produced elsewhere) and sourced from organic-rich soils of hillslopes and riparian areas (Boyer et al., 1997; Aitkenhead-Peterson et al., 2003; McDowell et al., 2006) where carbon (C) is typically associated with organo-mineral aggregates (Kaiser and Guggenberger, 2000; Six et al., 2000; Lehmann et al., 2007). These aggregates protect C from microbial attack often by physically shielding it with soil minerals including clays (Mikutta et al., 2006; Angst et al., 2017).
DOC can be stabilized on mineral surfaces via electrostatic interactions but may desorb if solution chemistry changes. For example, the change in type of solute species and concentration in soil solution can cause competition for sorption sites leading to the release or adsorption of certain aggregate constituents (Sokolova and Alekseeva, 2008). Changes in IS and pH fundamentally impact colloidal interactions and aggregation: increased IS such as during acidification, leads to the compression of the charged layer around an ion (i.e., diffuse double layer) so that attractive forces overcome repulsive forces (Derjaguin and Landau, 1941; Verwey, 1947). The higher charge density therefore leads to coagulation and the stabilization of larger colloidal associations and aggregates that can retain organic material (Lagaly, 2006; Monteith et al., 2007; Haaland et al., 2010). Furthermore, increased proton concentration and the presence of divalent cations supply positive charges that can bridge between negatively charged constituents (i.e., clays and organic matter), equally aiding aggregation. The increased anion exchange capacity (due to increased amounts of protons) can furthermore retain negatively charged organic molecules. In acid impacted soils, alteration of soil solution chemistry during recovery (a reduction in IS and an increase of pH) could therefore lead to the dispersion of such colloidal associations and aggregates, desorb organic materials and result in a release of associated DOC.
Many of the catchments showing these increases in stream water DOC amounts are upland headwater catchments with steep topography and variations in soil characteristics along the catena (Wiekenkamp et al., 2016). Typically the accumulation of organic matter and debris is greatest in near stream riparian soils (Holleran et al., 2015; Lybrand and Rasmussen, 2015), likely due to the lateral transfer of materials through the flushing of surface soils (Bourgault et al., 2017; Perdrial et al., 2018). However, when hillslopes are more geomorphically stable they tend to have higher soil organic carbon than the valleys (Johnson et al., 2011), therefore it is necessary to investigate both riparian hotspots as well as hillslope soils.
The objective of this study was to systematically test how changes in IS and composition of soil solution (monovalent vs. divalent cations) impact soil aggregates and DOC release in a combined lab and field study. We hypothesized that, as IS and the concentration of divalent cations decreases (simulating recovery from acid deposition), soil aggregate size is reduced as a result of aggregate breakup, and concentration of DOC in soil solution increases. We further hypothesized that organic-rich soils from riparian toe slope zones release larger amounts of DOC (per mass unit soil) than soils from other hillslope areas. Finally, we hypothesize that DOC released from aggregates is mostly terrestrial (not microbial) and bioavailable because aggregate DOC was shielded from microbial processing.
To test these hypotheses, we collected soils from two main landscape positions (hillslope and riparian zones) from the acid-impacted Sleepers River Research Watershed (SRRW) in northeastern Vermont. Sleepers River is unique from most other watersheds that have been studied in the context of acidification as the bedrock and glacial till contain carbonate minerals that buffer the pH and allow for the study of IS effects. We performed aqueous soil extracts with solutions of different IS and composition to simulate changes in soil solution chemistry. We also monitored dynamic changes in soil particle size, aggregate architecture and composition, leachate DOC concentrations, dissolved organic matter (DOM) characteristics using fluorescence spectroscopy, and bioavailability.
Materials and Methods
Field Site
SRRW is a USGS site in northeastern Vermont (Figure 1A). This site has over 25 years of data on stream water composition and has shown increased DOC stream water effluxes similar to the general trend in many northern hemisphere catchments (e.g., Monteith et al., 2007; Clark et al., 2010; Supplementary Figure 1). The headwater catchment W-9 is the focus of this study and covers an area of 40.5 ha with elevation ranging from 524 to 672 m (Figure 1B, Shanley et al., 2004). One notable difference between SRRW and other studied northern hemisphere catchments is the bedrock, which contains calcareous granulite and is covered with a layer of calcareous glacial till of varying thickness (1–4 m) (Shanley et al., 2004). Weathering of the glacial till and bedrock results in calcium-bicarbonate water with a well-buffered pH. Groundwater in equilibrium with these carbonates discharges in near stream areas and exhibits high pH and calcium content.
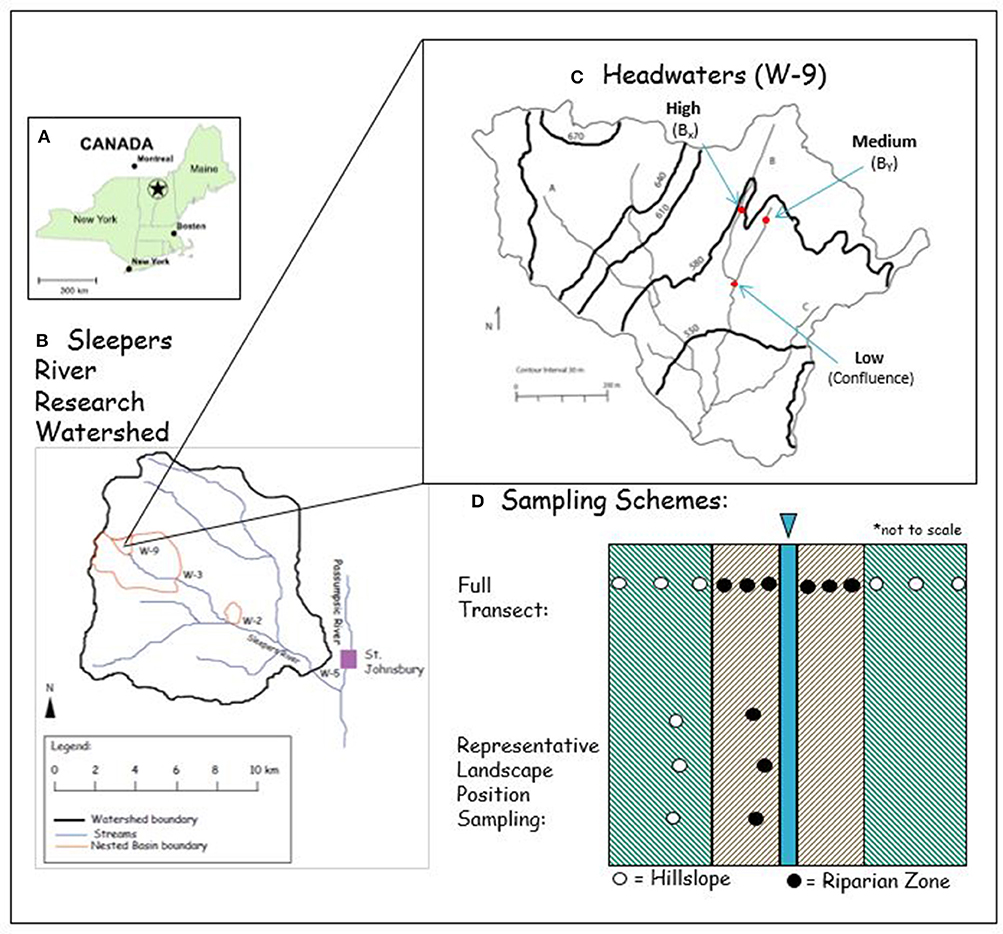
Figure 1. (A) The location of the study site in the NE US. (B) The Sleepers River Research Watershed is located west of St. Johnsbury, VT (modified after Shanley et al., 2015 with permission from John Wiley and Sons). (C) The headwaters (W−9) with stream B is the focus of this study (modified after Kendall et al., 1999 with permission from Elsevier). (D) Schematic representation of the sampling design in map view (not to scale) that included samples from full transects from HSs (green shaded area) and RZs (brown shaded areas) to the stream (blue). Representative zone samples included replicated samples for each landscape position (each dot represents 3 samples).
All soils were sampled in the W-9 forest along stream B, a 12.9-ha tributary that has been most intensively studied (Figure 1C). Hillslope soils (Inceptisols and Spodosols) were sampled every 2 m along each of three transects established perpendicular to the channel, spanning from summit, shoulder, backslope and footslope catena positions (hereafter collectively referred to as hillslope = HS soils). Soils from associated toeslope positions (Histosols) in close proximity to the stream were sampled every meter (hereafter referred to as riparian zone = RZ soils), yielding in total ~10 samples per transect. We chose the 3 transects to include varying degrees of slope gradients including 16% (high), 5% (medium), and 3% (low) (Miller and Schaetzl, 2015; Wysocki and Schoeneberger, 2017). To increase the statistical power of HS and RZ samples, we additionally sampled 3 toeslope (i.e., RZ) and 3 backslope (representing HS) samples of each of the 3 slope gradients for further analysis (n = 18).
Soil and aggregate samples were collected from the top 15 cm with a pre-cleaned bucket auger (15 cm in length, 10 cm diameter) after the leaf litter was removed. From a subset of these samples we additionally prepared composite samples for analyses where replication was time- and cost-prohibitive (e.g., Scanning Electron Microscopy (SEM), composite n = 6). For composites, we gently combined subsets of each individual, field-moist sample. This type of sampling with bucket-type augers and the preparation of composite samples has been successfully used in previous aggregate studies (Rawlins et al., 2013; Li et al., 2016). Aggregates are defined as clusters containing mineral particles (e.g., clay minerals and oxides) and organic matter (OM) in various stages of decay, as well as living organisms (Frey, 2005) that cohere more to each other than to their surrounding particles (Nimmo and Perkins, 2002). We therefore do not define aggregates based on size, however, size is an inherent limitation on the methods used. For example, laser diffraction was effectively limited to ca. < 200 μm particles and SEM by the field of view for meaningful analysis (ca. 1,000 μm). We acknowledge that our sampling and processing techniques potentially destroyed macroaggregates, therefore our investigation considered microaggregates (<250 μm) that “survived” field sampling and were relatively stable.
Elemental Analysis
For elemental analyses, soil samples were air-dried, sieved through a 2-mm mesh, and homogenized using a ball mill. Duplicates of each sample were analyzed for C content using a combustion-based elemental analyzer (CE Instruments NC 2500, Lancashire, UK) in the Geology Stable Isotope Lab at the University of Vermont. Resulting percent C values were compared to standards (B2150 for high organic content sediment standard and B2152 for low organic content soil standard) provided by Elemental Microanalysis Limited.
Scanning Electron Microscopy
To visualize aggregate architecture and determine aggregate composition, we used a TESCAN VEGA3 Scanning Electron Microscope (SEM) and Oxford Instruments AZtec Elemental Mapping software in the Geology Department at Middlebury College in Middlebury, VT. Air-dried samples that were first sieved through a 2-mm mesh to exclude larger particles (i.e., roots and small gravel) were sieved a second time through 250-μm mesh to isolate the aggregate fraction. Replicates of each composite sample were mounted using double-sided C tape on separate metal stubs and sputter-coated with C before analysis. To investigate the effect of simulated soil solution on aggregate size, shape, and composition solution, we added several drops of high IS solution [calcium chloride (CaCl2)] and low IS [Nanopure water (NW)], to one replicate from both locations (HS and RZ) and compared to untreated aggregates. Using a micro-pipette, solutions were carefully dropped directly onto the aggregates and carefully mixed around the aggregates. The solutions were allowed to dry in place to avoid removal of the aggregates, a process completed within 90 min. Because backscattered electron (BSE) SEM mode captures differences in electron density, we used this mode to visualize high electron density mineral grains vs. low electron density organic material. BSE was acquired at 5 keV acceleration voltage and energy-dispersive spectroscopy (EDS) maps were acquired for 5 min with a probe resolution of 15 mm.
Aqueous Soil Extractions and Analyses
To simulate the higher IS of soil solution during ecosystem acidification and to test the effect of monovalent vs. divalent solutions, we used aqueous soil extracts (ASE) as an analog for soil solution. The high IS solutions consisted of salt solutions (0.005M NaCl and 0.005M CaCl2). To simulate the more dilute solution of recovery, we used NW. We also tested pH effects but, presumably because SRRW is well buffered, we saw no effects (Supplementary Figure 2). All ASE were prepared from field moist soils (existing water content was accounted for, Supplementary Materials, section 2) by mixing soil and aqueous solutions at a 1:5 ratio to simulate concentrated soil solutions. In accordance with a previous study we limited the shaking time on a reciprocal shaker (Eberbach Corporation, Ann Arbor, MI, USA) to 1 h to reduce microbial processing (Perdrial et al., 2012).
To monitor the effect of solution IS and composition on the size of particles and colloids in soil solution (from 0.4 μm to an effective 200 μm), aliquots of ASE were analyzed immediately after shaking or re-suspension (and prior to filtration) using the Micro Volume Module on a Beckman Coulter LS230 Laser Particle Analyzer. Although the particle size analyzer is designed to measure particles up to 2000 μm, it was effectively not the case in our measurement as the Micro Volume Module does not allow for good dispersion of heavier particles. Hence, the particle size of an estimated diameter > 200 μm were not properly reflected in our analysis. The amount and type of the DOC in solution was determined after the solids were separated from the colloidal and dissolved matter by centrifugation (30 min, 3000 rpm) and filtration using combusted 0.7 μm glass fiber filters (Whatman Grade GF/F, Buckinghamshire, UK). Filtrates were transferred into combusted amber glass bottles for immediate analyses of C fluorescence characteristics and quantity. We analyzed all ASE samples in duplicate for concentrations of DOC and total dissolved nitrogen (TDN) via combustion using a Total Organic Carbon Analyzer (Shimadzu, Columbia, MD, USA). Results are reported normalized to the exact amount of solution and soil used for each extract (mg/kg) to allow for comparison among samples.
Spectral characteristics of DOM were determined using the Aqualog® Fluorescence and Absorbance Spectrometer (HORIBA, Irvine, CA, USA). The excitation (Ex) wavelength range spanned from 250 to 600 nm and emission (Em) ranged from 212 to 599 nm. All excitation emission matrices (EEMs) were blank-subtracted (NW), corrected for inner filter effects, and Raman normalized. From these data, we computed the following indices: the Fluorescence Index (FI) is calculated as the intensity at Em 470 nm divided by the intensity at Em 520 nm for Ex at 370 nm and can be used to indicate DOM provenance (i.e., terrestrial vs. microbial) and aromaticity (Cory and McKnight, 2005; Wymore et al., 2015). The Humification Index (HIX) is calculated as a ratio of the area under Em 435–480 nm divided by the quantity of the areas under both Em 300–345 nm and Em 435–480 nm, at an Ex of 254 nm and indicated degrees of humification (Zsolnay et al., 1999; Débora et al., 2002).
We performed a Parallel Factor Analysis (PARAFAC) using Matlab R2017b and the drEEM_4_0_(Ext.) toolbox (Murphy et al., 2013) to validate a 3-component PARAFAC model (Figure 2). Our three components are in agreement with components found in most studies (Ishii and Boyer, 2012) and include terrestrial fulvic-like (C-1), terrestrial humic-like (C-2), and microbial protein-like fluorescence (C-3, Table 1).
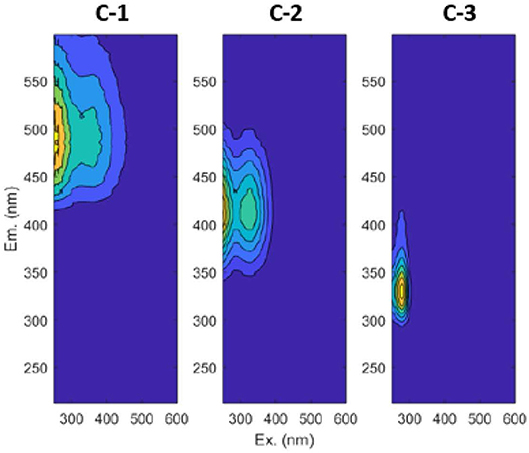
Figure 2. Contour plots for the three components validated by PARAFAC. C-1 is terrestrial fulvic-like, C-2 is terrestrial humic-like, and C-3 is microbial protein-like.
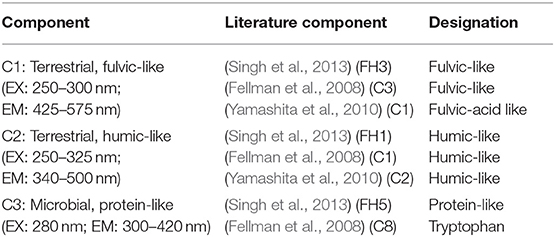
Table 1. Comparison of our validated PARAFAC components with published models.
Bioavailability of Carbon
The bioavailability of dissolved organic C in ASE was assessed using incubation experiments, which measure the decrease in organic C within or the increase in CO2 evaded from a sample over time (McDowell et al., 2006). The results are expressed as % of respired C and give a reliable estimate of how readily C is transformed. An aliquot of each filtered ASE was inoculated using a pipette with 1μL of an unfiltered slurry that contained O-horizon microbes from all 18 soils. This slurry was formed using the unfiltered remnants from each ASE sample and was homogenized prior to the inoculations. The filtered ASE samples as well as laboratory blanks were incubated by shaking for 14 days in the dark in the Environmental Biogeochemistry Laboratory at the University of Vermont. The samples were covered individually with Parafilm (5 holes poked in the cover) and were all tented in foil. Samples were re-analyzed for DOC to determine the fraction of C loss through respiration (evaporation losses were accounted for by tracking sample mass and adding lost solution).
Statistical Analyses
We used JMP Pro 13.0.0 software by SAS for statistical analyses. An Analysis of Variance (ANOVA) and the Tukey's Paired Test were performed to determine significance of variations in DOC amount and DOM composition of ASE by extraction solution composition. The average DOC amounts for each of the representative landscape positions (RZ and HS) were compared using a T-test to determine if the means were significantly different. SEM analyses were not used for statistical assessment but provided visualizations of typical aggregates.
Results
Effect of Landscape Position on Soil Carbon
The highest C contents were found in the RZ samples of both the transect samples (ranging from 850 to 3,500 mg/kg in RZ and 490–570 mg/kg for HS, Supplementary Figure 3) and representative soil samples (Figure 3). The RZ adjacent to HS with high slope gradient had the greatest amount of soil C with more than 3,340 mg/kg. The least amount of C was found in HS with low slope gradient (380 mg/kg).
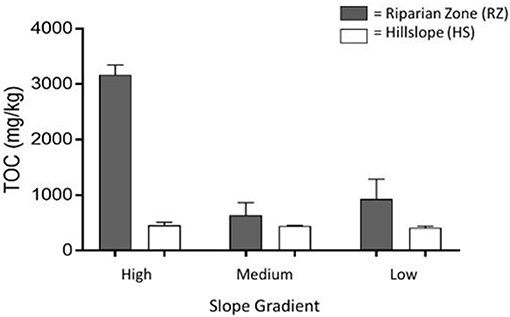
Figure 3. Average total organic carbon (TOC) content of composite soils from high, medium, and low hillslopes (HS) as well as riparian zones (RZ) at the base of each slope. The whiskers represent the error between the sample replicates used in this analysis. Samples were collected along stream B in the headwaters (W-9) of Sleepers River Research Watershed.
Particle Size Analysis
Particle size distribution of the soil and extracting solution mixtures prior to filtration varied as a function of position (HS vs. RZ) and solution chemistry (Figure 4). Particle size in RZ extracts had a slightly greater range (up to 80 μm, Figure 4A), while HS soil extract particle size did not exceed 60 μm (Figure 4B). When extracted with higher IS solution, particle size distribution in extracts of soils from both landscape positions shifted toward larger sizes. In contrast, the low IS extracts showed a larger proportion of smaller particles and a smaller proportion of larger particles. Results of typical samples from the RZ and the HS illustrate the distinct change in particle size for each solution (Supplementary Figure 8).
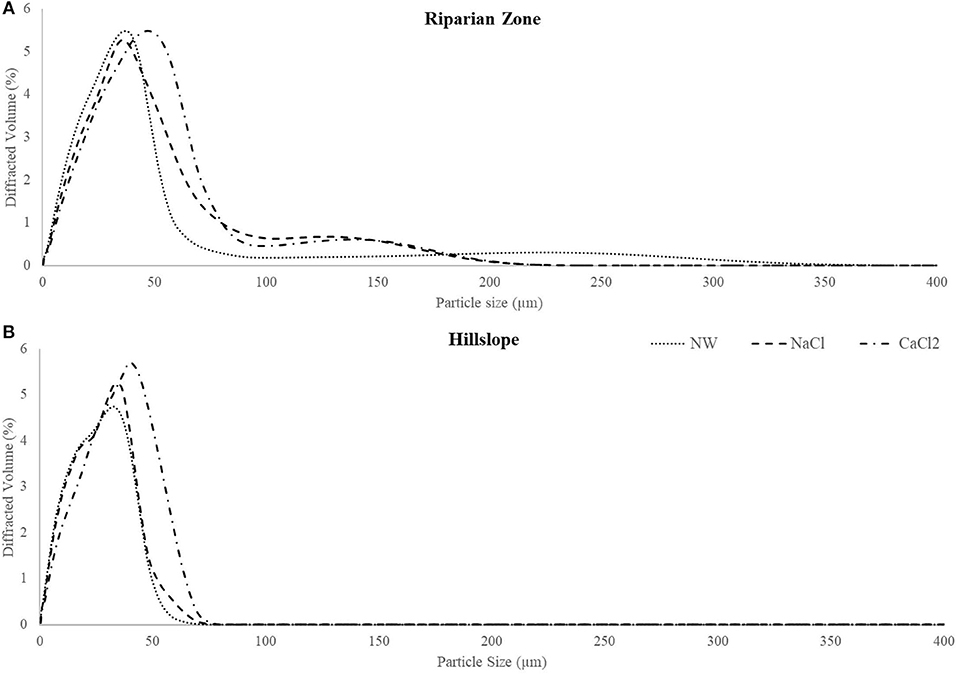
Figure 4. Distribution of average particle size by treatment for landscape positions, RZ (A) and the HS (B). There is a shift to the left in peaks from higher ionic strength to lower ionic strength solution. NW, Nanopure Water; NaCl, sodium chloride; CaCl2, calcium chloride.
Visualization of Aggregates
SEM analyses of soil aggregates showed that aggregate morphology and size differed with dominant landscape position (RZ vs. HS, typical aggregates are exemplified in Figures 5, 6). Typical RZ aggregates were rounded and contained large amounts of low electron density, organic-rich materials with only small amounts of angular mineral fragments (Figure 5, top panel). The HS aggregates contained a larger proportion of mineral fragments (visible as high electron density materials) and relatively less organic-rich materials compared to the RZ aggregates (Figure 6, top panel). Elemental distribution maps confirmed these mineral fragments to be aluminosilicates and the EDS spectra suggest the presence of chlorite, amphibole, and quartz for RZ minerals (Figure 7) and biotite, amphibole, and quartz (Figure 8) for HS minerals. In contrast, the organic-rich matrix was devoid of Al and Si but enriched in Ca, specifically for RZ aggregates.
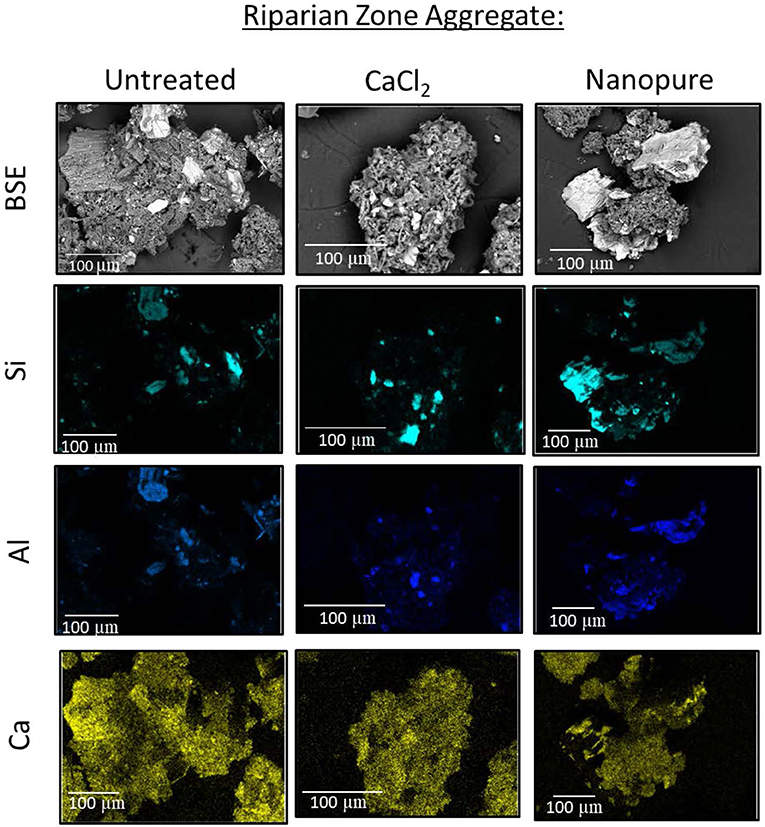
Figure 5. Representative riparian zone (RZ) aggregate as a backscatter electron (BSE) image. Maps show the distribution of specific elements in untreated air-dried samples (left), treated with high ionic strength CaCl2 solution (center), and low ionic strength Nanopure water (right).
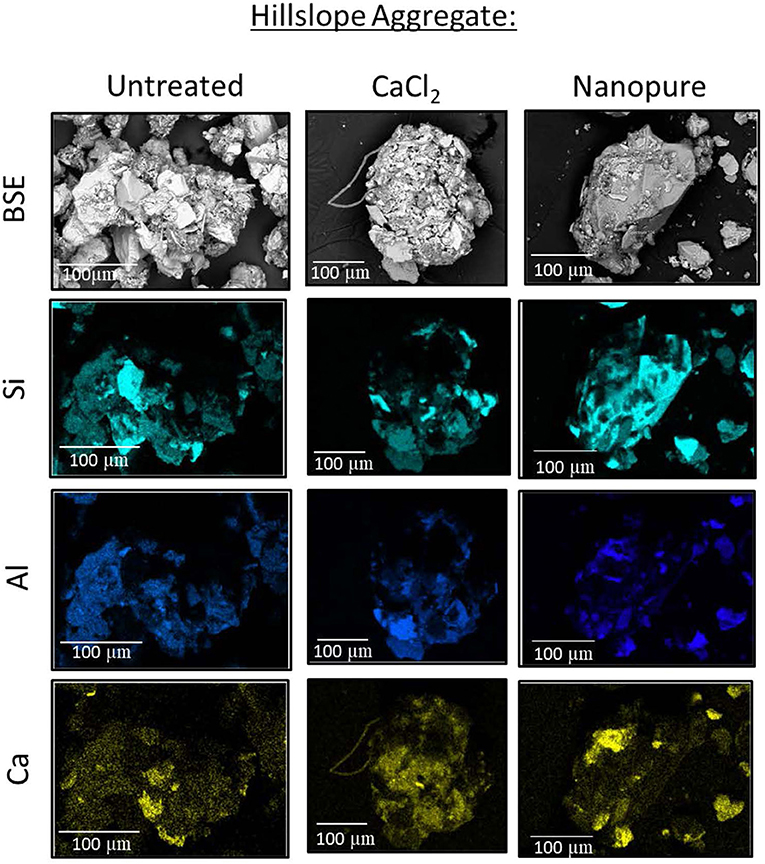
Figure 6. Representative hillslope (HS) aggregate as a backscatter electron (BSE) image. Maps show the distribution of specific elements in untreated air-dried samples (left), treated with high ionic strength CaCl2 solution (center), and low ionic strength Nanopure water (right).
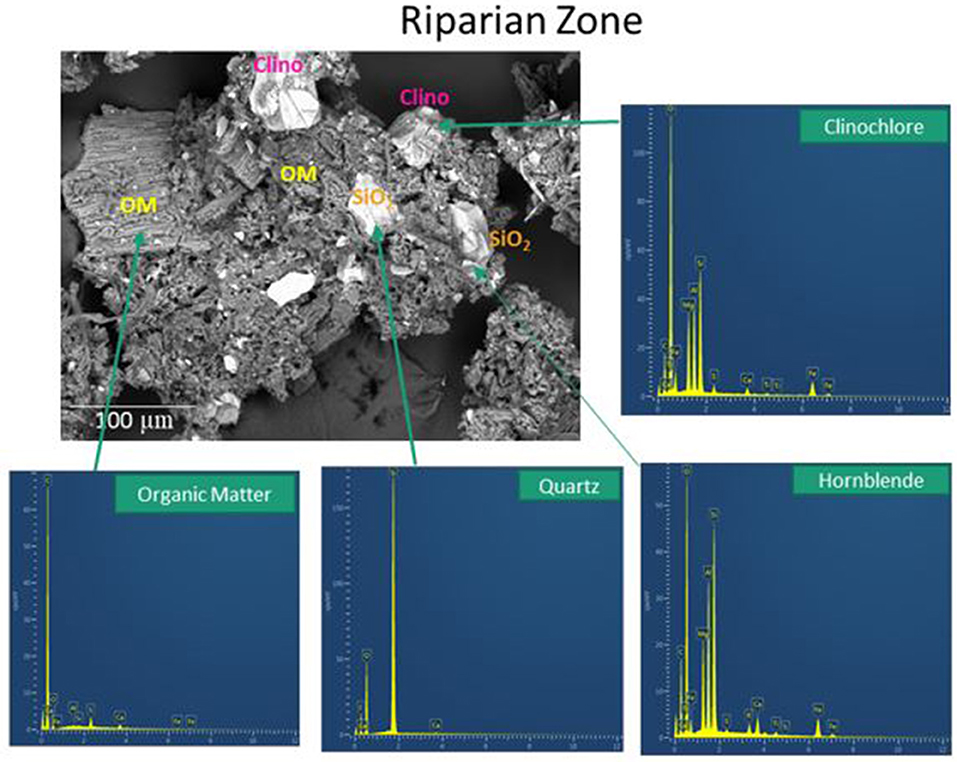
Figure 7. Secondary electron scanning electron microscopy (SE SEM) image of soil aggregates present in composite soils from the riparian zone (RZ) of the high transect. OM, organic matter; clino, clinochlore.
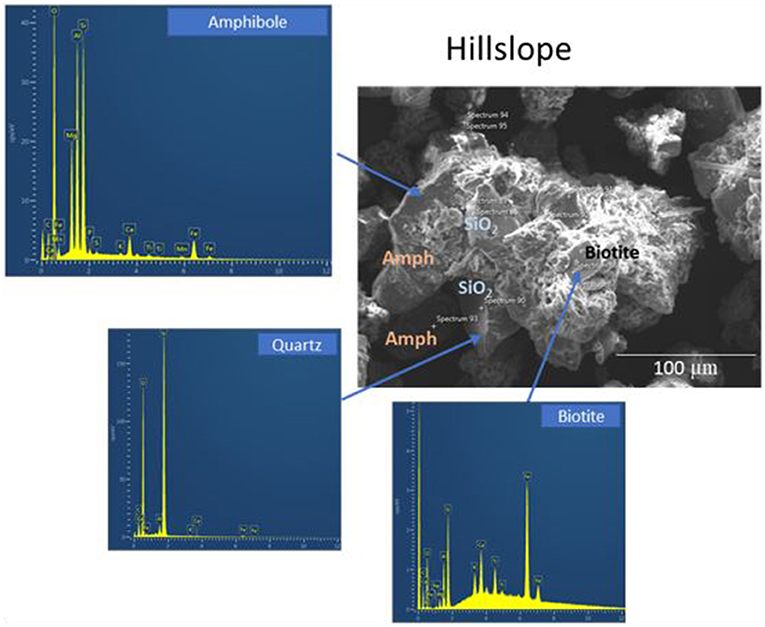
Figure 8. Secondary electron scanning microscopy (SE SEM) image of soil aggregates present in composite soils from the hillslope (HS) of the high transect. Amph, Amphibole.
Aggregates from both RZ and HS treated with CaCl2 solution (simulating the high IS of acidic precipitation) showed no change in overall morphology. The main difference was the removal of scattered fragments besides aggregates (Figures 5, 6, center panels). In contrast, when aggregates were treated with NW (simulating the low IS solution during recovery), organic-rich materials were separated from the mineral fragments (Figures 5, 6, right panels). Because the solution was dried in place, however, the organic material was not removed.
Effect of Extraction Solution on Soils From Different Landscape Positions
DOC content in aqueous soil extracts was strongly impacted by the composition of the extraction solution but did not vary by position (HS vs. RZ, Figure 9). Extractions with NW showed the highest DOC (over 55 mg/kg) but also the largest variation (SD = 12.2 mg/kg). The high IS solutions extracted significantly lower DOC concentrations and showed lower variability (averaging 17.7 ± 7.18 mg/kg and 11.6 ± 3.02 mg/kg for NaCl and CaCl2, respectively). The total dissolved nitrogen content leached into the various extraction solutions followed the same pattern as DOC and was not affected by landscape position (Supplementary Figure 9).
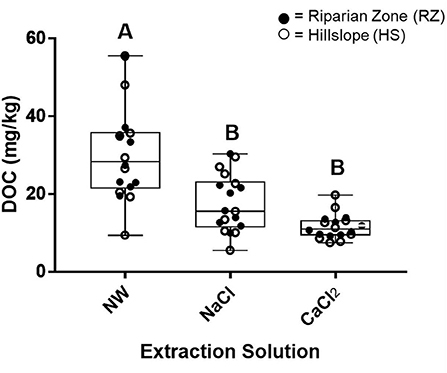
Figure 9. Boxplots showing the mean and range of DOC concentrations (mg/kg) determined by treatment with three aqueous soil extraction solutions (NW, Nanopure Water; sodium chloride (NaCl), and calcium chloride (CaCl2). Treatments (n = 18) with different letters indicate pairs of means that are significantly different (p < 0.05).
The value of fluorescence-derived indices (FI and HIX) varied with extraction solution and landscape position, suggesting differences in both precursor material and soil decomposition (Figure 10). Highest (most microbial) FI values were observed for CaCl2 extracts (ranging from 1.50 up to 2.04, Figure 10A). FI values for NW and NaCl extracts varied but were generally lower (ranging from 1.24 to 1.77 for NW and 1.30 to 1.57 for NaCl; Figure 10A). HS soils had higher FI values than RZ soils in all extraction solutions (Figure 10B). HIX values varied greatly in all extraction solutions but were highest in NW (up to 6.49) while CaCl2 extracts had lowest values (as low as 1.84, Figure 10C). Differences in HIX values by extraction solution or landscape position were not significant (p > 0.05).
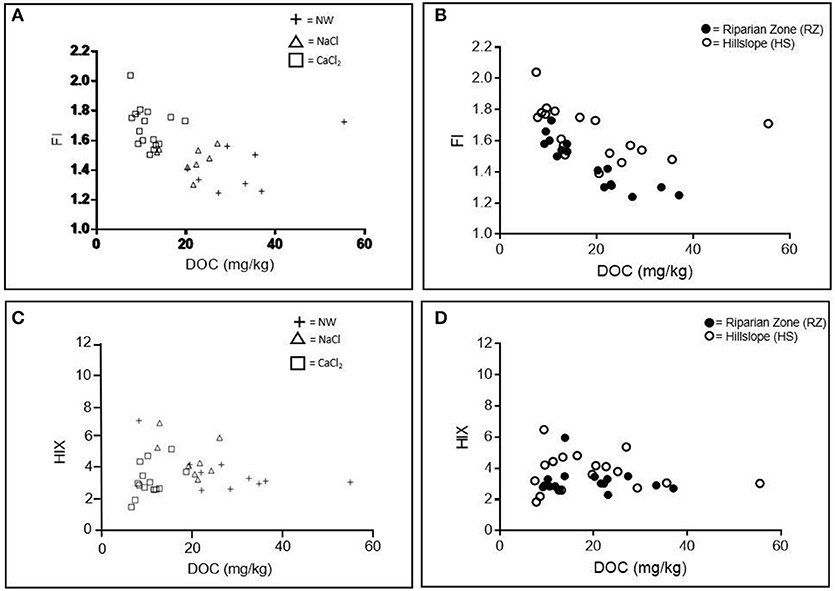
Figure 10. Spectral Indices: Fluorescence Index (FI) (A,B) and Humification Index (HIX) (C,D) by extraction solution (NW, Nanopure water; NaCl, sodium chloride; CaCl2, calcium chloride) and landscape position.
PARAFAC results indicate that the abundance of both the terrestrial, humic-like (C-2) and microbial, protein-like (C-3) components were similar in all three extraction solutions. However, the abundance of the terrestrial, fulvic-like C-1 in the CaCl2 extracted DOM was significantly lower than in other solutions in both landscape positions (p < 0.05, Figure 11). HS soil extracts generally showed a greater variability in PARAFAC component abundance than RZ extracts. HS soils show a significantly higher abundance of the humic-like C-2 and lower abundance of the protein-like C-3 (both p < 0.005 at alpha = 0.05, Figure 11).
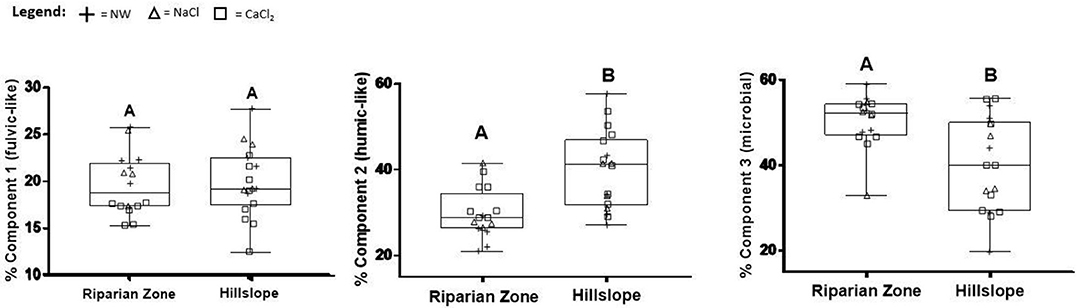
Figure 11. The relative abundance of each PARAFAC component by extraction solution (NW, Nanopure water; NaCl, sodium chloride; and CaCl2, calcium chloride) and landscape position. Letters above the boxplots indicate significant differences according to the Tukey Multiple Comparison test at p < 0.05.
Bioavailability of Extracted Carbon
The bioavailability of the extracted organic C in the ASE ranged from minimal to large losses (<1 to almost 60%, Figure 12). Generally, extracted DOC in the NaCl treatment decreased very little over the 2-week incubation while decreases in both the CaCl2 and the NW treatments were more pronounced, but differences were not significant (p > 0.05).
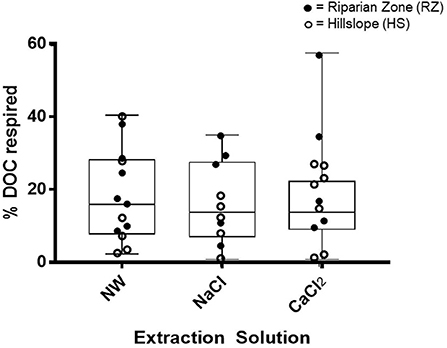
Figure 12. The distribution for the bioavailability of carbon by extraction solution (NW, Nanopure Water; NaCl, sodium chloride; and CaCl2, calcium chloride) and representative landscape position reported as % DOC respired (loss). None of the treatments or representative landscape positions were significantly different.
Discussion
Aggregate Dispersion: A Mechanistic Link Between Changes in Solution Composition and DOC Increases?
DOC solubility and mobility is strongly impacted by solution composition, especially by pH, IS, and the presence of polyvalent cations. At the molecular scale, an increase in pH can lead to the deprotonation of functional groups (exemplified by the carboxyl group in Figure 13A) and DOC solubility increases as a result. The formation and shape of colloidal associations (Figure 13B) and the stability of aggregates (Figure 13C) is also highly controlled by solution chemistry. Colloidal associations, including organic material, deflocculate in low charge density environments (i.e., low IS and high pH, Figure 13B) (Stumm and Morgan, 1996; Buffle et al., 1998) contributing to DOC. Aggregate stability decreases in such environments due to expanding of diffuse double layers (again a decreased tendency of flocculation) and a shift from divalent to monovalent cations reduces the propensity for cation bridging (Tisdall and Oades, 1982; Six et al., 2004).
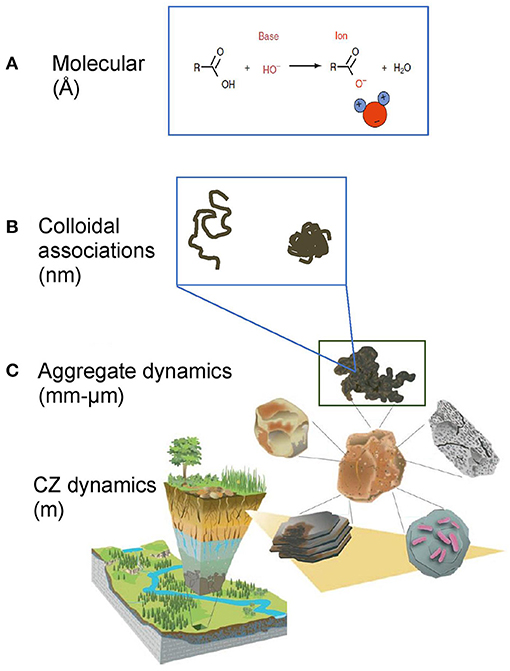
Figure 13. Conceptualization of DOC release at varying scales and mechanisms. (A) Solution chemistry can change DOM solubility (Å-scale) and (B) DOM conformation (nm scale, figure modified after Chorover et al., 2007 with permission from the Mineralogical Society of America and Kleber and Johnson, 2010 with permission from Elsevier). These smaller scale processes would not lead to significant changes in aggregate size. (C) Solution composition could lead to aggregate dispersion and release of dissolved organic matter (DOM, mm-μm scale).
Because surface water DOC is largely sourced from organic soils (Yallop and Clutterbuck, 2009) and because soil C is typically stabilized in aggregates (Six et al., 2000) we hypothesized that particularly the breakup of soil aggregates plays an important role in increasing DOC during recovery from acidification. Based on this hypothesis, we expected to see the highest amounts of DOC (per kg soil) released into low IS solution (NW), followed by NaCl solution and finally the lowest DOC amounts in CaCl2 solution. Indeed, the highest amounts of DOC were leached into NW and significantly lower amounts were released into the high IS solutions (NaCl and CaCl2, Figure 9). This change in DOC amount was accompanied by a systematic shift in particle size distribution where decrease in IS led to losses in the particle size range of 40–100 μm and gains in the smaller size range below 30 μm (Figure 4). This could either suggest large aggregates break up to produce smaller aggregates (similar to Figure 13C) and/or aggregates of all sizes lose volume by, for example, desorbing colloidal material (e.g., Figure 13B).
While the SEM analysis was not performed on a statistically significant number of aggregates, the examples shown here are representative of the general trend we observed, which showed treatment with NW led to a separation of organic materials from larger silicate grains (Figures 5, 6), creating smaller aggregates. We did not remove the treatment solution to limit disturbance of the aggregates, therefore the organic materials were still present as smaller aggregates and it is difficult to tell how much of this organic material dispersed and coagulated again during the drying process. However, it is likely that some of the organics would have passed a 0.7 μm filter (i.e., increasing DOC concentrations in the solution). In contrast, aggregates treated with higher IS CaCl2 solution did not show the separation into organics vs. mineral fragments. These qualitative results support the DOC results that suggest that indeed aggregate dispersion might be more pronounced in low IS solution and could explain the higher amounts of DOC released in these cases.
These results are in agreement with results from a field study of the Pluhuv Bor catchment in the Czech Republic (Hruška et al., 2009) where the concentration of both stream water and soil-water DOC showed large increases between WY1994 and 2007. Of the assessed water quality parameters (pH and IS) under different flow conditions, changes in stream DOC concentration were inversely correlated to changes in IS (Hruška et al., 2009). This pattern was attributed to recovery from acidification but the underlying mechanism was not addressed. However, a study by Haaland et al. (2010) on lakes in Norway suggests decreased ionic strength and the ensuing increased surface charge of organic material could lead to electrostatic repulsion, deflocculation and therefore increased amounts of DOC in surface waters.
Another recent study on water-extractable DOC showed a positive correlation between concentration of monovalent cations in the extraction solution and DOC (Xie et al., 2017). The specific mechanism producing this correlation was not identified; however these results do not necessarily contradict our hypotheses of aggregate dispersion as DOC generator. Soil composition, including mineralogy, strongly affects aggregate composition and as a result, the main mechanism stabilizing aggregates differs; for example, in soils rich in metal oxides such as Oxisols (typical soils for the region of the Xie et al., 2017 study), pH might have a larger effect on aggregate stability than IS.
Because divalent cations are more effective in bridging negative charges (Mikutta et al., 2007; Rowley et al., 2018), potentially promoting aggregation and DOC sequestration, we had also expected lower DOC release for CaCl2 vs. NaCl solutions of the same IS. Particle size analysis showed aggregate size was generally larger in CaCl2 vs. NaCl solution, suggesting that cation bridging might play a role in preserving aggregates. DOC release into CaCl2 was indeed lower than into NaCl solution, but the effect was not significant (Figure 9). However, the trend is in agreement with results from Kerr and Eimers (2012), who conducted a combined laboratory and field study on the effect of monovalent vs. divalent cations on DOC release into soil water. The authors found that DOC release was driven by declines in one or more divalent cation species (not so much by an overall change in IS). The authors explained their results by reduced DOC sorption at low Ca2+ concentrations which is most likely the result of cation bridging (Kerr and Eimers, 2012).
Despite the trend of aggregate size reduction with decreasing IS (modulated by the presence of mono vs. divalent cations) our observations show that these aggregates are remarkably stable. For example, the experimental treatment involved 1 h of vigorous shaking with the different extraction solutions, and yet, mean particle size decreased only by 13 to 17% (Supplementary Table 1). These results indicate DOC release via this mechanism is likely gradual and limited by overall aggregate stability.
Landscape Position Modulated the Response to Solution Chemistry
We had hypothesized that soils from low-lying landscape positions contain higher total C than those from the HS locations and therefore would release more DOC. Our results confirm that TOC is consistently higher in RZ soils (Figure 3) and SEM analyses show a larger proportion of organic matrix vs. inorganic mineral fragments than HS soil aggregates (Figures 4, 5), which would suggest a greater potential for DOC release. However, RZ soil extracts did not contain significantly higher amounts of DOC or TN (Figure 9, Supplementary Figure 9), which is remarkable, given that certain locations in the RZ had up to 6 times higher TOC content compared to the HS locations (Figure 3). One explanation for the relatively small releases of DOC could be the generally larger aggregate size in riparian soils (Figures 4, 6) resulting in smaller surface areas. This difference in surface area could be significant for DOC desorbing from aggregate surfaces instead of from complete aggregate break up (Figure 13A). Another important factor is that RZs at our sites naturally contain large amounts of Ca2+ from upwelling ground water (Shanley et al., 2004; Armfield et al., 2019), which could further help to stabilize RZ aggregates through increased sorption capacity or cation bridging (Figure 5).
Landscape position strongly impacted fluorescent DOM characteristics. For example, extracts from RZ soils consistently had lower values for FI and the humic-like PARAFAC component C-2, while the protein-like PARAFAC component C-3 was significantly more abundant compared to HS extracts (Figures 10B,D, 11). These results paint a complex picture of the molecular make-up of DOM extracted from RZ soils and likely reflect a mixture of fresh and terrestrial organic matter such as roots and decomposing leaf litter (indicated by low FI) as well as abundant microbial DOM fueled by a wet and nutrient-rich environment (indicated by microbial C-3). In contrast, HS extracts generally had higher values for HIX and the humic –like C-2 (Figures 10B,D) and lower values for the microbial C-3, suggesting the presence of typical humified soil DOM with less microbial alteration. However, despite these differences in DOM quality, bioavailability was not significantly different between the different landscape positions (Figure 12).
We had also hypothesized that DOC released from aggregates would be mostly terrestrial and bioavailable because it would have been shielded from microbial processing. NW extracts (presumably containing more DOC from aggregates than the other extracts) indeed had the lowest values for FI and the lowest humic-like PARAFAC component C-2 (Figure 10). These results are in agreement with the findings of Angst et al. (2017) that most C released into solution was plant-derived (terrestrial). However, our study also showed that DOC in most extracts was only moderately bioavailable and that differences between extraction solutions were not significant (Figure 12).
In summary, our experimental results show that changes in solution chemistry, specifically decreases in IS, lead to increased water extractable organic carbon from soils. The breakup of aggregates and colloidal associations due to reduced cation bridging and diffuse double layer effects likely play an important role, and could contribute to recovery induced DOC release to streams if aggregate stability is sensitive to changes in IS.
Such recovery-induced increases in soil and stream DOC have important implications on DOC dynamics and water quality at the watershed-scale. For example, aggregate breakup could release other constituents such as nutrients and metals possibly impacting ecosystem productivity and contaminant movement. However, because aggregate breakup is governed by equilibrium dynamics, aggregate DOC will only be released until a new equilibrium is established (i.e., many decades after recovery begins). In contrast, if watershed DOC release is governed by ongoing drivers with only little potential for recovery (i.e., such as climate and land use change), DOC increase will continue to impact our surface waters for an undetermined amount of time (Freeman et al., 2001; Worrall and Burt, 2007; Eimers et al., 2008; Lepistö et al., 2008; Yallop and Clutterbuck, 2009).
Data Availability Statement
The stream water dataset analyzed for DOC trends can be found here: doi: 10.5066/P9380HQG and doi: 10.5066/P929KMVK.
Author Contributions
MC was responsible for sample collection, preparation, analyses, production of all figures and tables, as well as primary authorship. JP as MS thesis advisor aided in interpretation, authorship, field work, lab work, lab training, and allowed lab use. AS assisted with field work, lab work, and aided in interpretations. AL, ML-G, and TA assisted with field sampling and lab work. NP contributed through interpretations, authorship, and lab training. JA assisted with field sampling, lab work, and interpretations through research published in this issue. JS introduced authors to watershed, aided in interpretations, and provided pre-research consulting.
Funding
This research was supported by the National Science Foundation, grant no. EAR-1724171, the College of Arts and Sciences at the University of Vermont and by the Vermont Space Grant Consortium/NASA EPSCoR Graduate Student Fellowship award.
Conflict of Interest
The authors declare that the research was conducted in the absence of any commercial or financial relationships that could be construed as a potential conflict of interest.
Acknowledgments
The authors would like to thank Andrea Lini and Gaby Mora-Klepeis in the Department of Geology at the University of Vermont for their help and support. We also thank our colleagues at Middlebury College: Dave West for allowing the use of the SEM and Jody Smith for her time and assistance with using the SEM and its software. USGS participation was supported by the Land Change Science Program. Any use of trade, firm, or product names is for descriptive purposes only and does not imply endorsement by the US Government.
Supplementary Material
The Supplementary Material for this article can be found online at: https://www.frontiersin.org/articles/10.3389/fenvs.2019.00172/full#supplementary-material
References
Aitkenhead-Peterson, J. A., McDowell, W. H., Neff, J. C., Stuart, E. G. F., and Robert, L. S. (2003). “Sources, production, and regulation of allochthonous dissolved organic matter inputs to surface waters,” in Aquatic Ecosystems, eds S. E. G. Findlay and R. L. Sinsabaugh (Burlington, NJ: Academic Press), 25–70. doi: 10.1016/B978-012256371-3/50003-2
Angst, G., Mueller, K. E., Kögel-Knabner, I., Freeman, K. H., and Mueller, C. W. (2017). Aggregation controls the stability of lignin and lipids in clay-sized particulate and mineral associated organic matter. Biogeochemistry 132, 307–324. doi: 10.1007/s10533-017-0304-2
Armfield, J. R., Perdrial, J. N., Gagnon, A., Ehrenkranz, J., Perdrial, N., Cincotta, M., et al. (2019). Does stream water composition at sleepers river in vermont reflect dynamic changes in soils during recovery from acidification? Front. Earth Sci. 6:246. doi: 10.3389/feart.2018.00246
Bourgault, R. R., Ross, D. S., Bailey, S. W., Bullen, T. D., McGuire, K. J., and Gannon, J. P. (2017). Redistribution of soil metals and organic carbon via lateral flowpaths at the catchment scale in a glaciated upland setting. Geoderma 307, 238–252. doi: 10.1016/j.geoderma.2017.05.039
Boyer, E. W., Hornberger, G. M., Bencala, K. E., and McKnight, D. M. (1997). Response characteristics of DOC flushing in an alpine catchment. Hydrol. Process. 11, 1635–1647. doi: 10.1002/(SICI)1099-1085(19971015)11:12<1635::AID-HYP494>3.0.CO;2-H
Buffle, J., Wilkinson, K. J., Stoll, S., Filella, M., and Zhang, J. (1998). A generalized description of aquatic colloidal interactions: the three-colloidal component approach. Environ. Sci. Technol. 32, 2887–2899. doi: 10.1021/es980217h
Chorover, J., Kretzschmar, R., Garcia-Pichel, F., and Sparks, D. L. (2007). Soil biogeochemical processes within the Critical Zone. Elements 3, 321–326. doi: 10.2113/gselements.3.5.321
Clark, J. M., Bottrell, S. H., Evans, C. D., Monteith, D. T., Bartlett, R., Rose, R., et al. (2010). The importance of the relationship between scale and process in understanding long-term DOC dynamics. Sci. Total. Environ. 408, 2768–2775. doi: 10.1016/j.scitotenv.2010.02.046
Cory, R. M., and McKnight, D. M. (2005). Fluorescence spectroscopy reveals ubiquitous presence of oxidized and reduced quinones in dissolved organic matter. Environ. Sci. Technol. 39, 8142–8149. doi: 10.1021/es0506962
De Wit, H. A., Mulder, J., Hindar, A., and Hole, L. (2007). Long-term increase in dissolved organic carbon in streamwaters in norway is response to reduced acid deposition. Environ. Sci. Technol. 41, 7706–7713. doi: 10.1021/es070557f
Débora, M. B. P. M., Ladislau, M. N., Cimélio, B., João, M., and Vanderlei, S. B. (2002). Humification degree of soil humic acids determined by fluorescence spectroscopy. Soil Sci. 167, 739–739. doi: 10.1097/00010694-200211000-00004
Derjaguin, B., and Landau, L. (1941). Theory of the stability of strongly charged lyophobic sols and of the adhesion of strongly charged particles in solutions of electrolytes. Acta Physicochim. URSS 14, 633–662.
Eimers, M. C., Watmough, S. A., Buttle, J. M., and Dillon, P. J. (2008). Examination of the potential relationship between droughts, sulphate and dissolved organic carbon at a wetland-draining stream. Glob. Chang. Biol. 14, 938–948. doi: 10.1111/j.1365-2486.2007.01530.x
Evans, C. D., and Monteith, D. T. (2001). Chemical trends at lakes and streams in the UK acid waters monitoring network, 1988-2000: evidence for recent recovery at a national scale. Hydrol. Earth Syst. Sci. 5, 351–366. doi: 10.5194/hess-5-351-2001
Fellman, J. B., D'Amore, D. V., Hood, E., and Boone, R. D. (2008). Fluorescence characteristics and biodegradability of dissolved organic matter in forest and wetland soils from coastal temperate watersheds in southeast Alaska. Biogeochemistry 88, 169–184. doi: 10.1007/s10533-008-9203-x
Freeman, C., Evans, C. D., Monteith, D. T., Reynolds, B., and Fenner, N. (2001). Export of organic carbon from peat soils. Nature 412, 785–785. doi: 10.1038/35090628
Haaland, S., Hongve, D., Laudon, H., Riise, G., and Vogt, R. D. (2010). Quantifying the drivers of the increasing colored organic matter in boreal surface waters. Environ. Sci. Technol. 44, 2975–2980. doi: 10.1021/es903179j
Holleran, M., Levi, M., and Rasmussen, C. (2015). Quantifying soil and critical zone variability in a forested catchment through digital soil mapping. Soil 1, 47–64. doi: 10.5194/soil-1-47-2015
Hruška, J., Krám, P., McDowell, W. H., and Oulehle, F. (2009). Increased dissolved organic carbon (DOC) in central European streams is driven by reductions in ionic strength rather than climate change or decreasing acidity. Environ. Sci. Technol. 43, 4320–4326. doi: 10.1021/es803645w
Ishii, S. K. L., and Boyer, T. H. (2012). Behavior of reoccurring PARAFAC components in fluorescent dissolved organic matter in natural and engineered systems: a critical review. Environ. Sci. Technol. 46, 2006–2017. doi: 10.1021/es2043504
Johnson, K. D., Scatena, F. N., and Silver, W. L. (2011). Atypical soil carbon distribution across a tropical steepland forest catena. Catena 87, 391–397. doi: 10.1016/j.catena.2011.07.008
Kaiser, K., and Guggenberger, G. (2000). The role of DOM sorption to mineral surfaces in the preservation of organic matter in soils. Org. Geochem. 31, 711–725. doi: 10.1016/S0146-6380(00)00046-2
Kang, H., Kwon, M. J., Kim, S., Lee, S., Jones, T. G., Johncock, A. C., et al. (2018). Biologically driven DOC release from peatlands during recovery from acidification. Nat. Commun. 9:3807. doi: 10.1038/s41467-018-06259-1
Kendall, K. A., Shanley, J. B., and McDonnell, J. J. (1999). A hydrometric and geochemical approach to test the transmissivity feedback hypothesis during snowmelt. J. Hydrol. 219, 188–205. doi: 10.1016/S0022-1694(99)00059-1
Kerr, J. G., and Eimers, M. C. (2012). Decreasing soil water Ca2+ reduces DOC adsorption in mineral soils: implications for long-term DOC trends in an upland forested catchment in southern Ontario, Canada. Sci. Total. Environ. 427–428, 298–307. doi: 10.1016/j.scitotenv.2012.04.016
Kleber, M., and Johnson, M. G. (2010). “Chapter 3 - Advances in understanding the molecular structure of soil organic matter: implications for interactions in the environment,” in Advances in Agronomy, ed L. S. Donald (Academic Press), 77–142.
Lagaly, G. (2006). “Colloid clay science,” in Developments in Clay Sciences, eds F. Bergaya, B. K. G. Teng, and G. Lagaly (Kiel: Elsevier), 141–245. doi: 10.1016/S1572-4352(05)01005-6
Lehmann, J., Kinyangi, J., and Solomon, D. (2007). Organic matter stabilization in soil microaggregates: implications from spatial heterogeneity of organic carbon contents and carbon forms. Biogeochemistry 85, 45–57. doi: 10.1007/s10533-007-9105-3
Lepistö, A., Kortelainen, P., and Mattsson, T. (2008). Increased organic C and N leaching in a northern boreal river basin in Finland. Glob. Biogeochem. Cycles 22, 1–10. doi: 10.1029/2007GB003175
Li, L., Vogel, J., He, Z., Zou, X., Ruan, H., Huang, W., et al. (2016). Association of soil aggregation with the distribution and quality of organic carbon in soil along an elevation gradient on Wuyi Mountain in China. PLoS ONE 11:e0150898. doi: 10.1371/journal.pone.0150898
Lohse, K., Brooks, P. D., McIntosh, J., Meixner, T., and Huxman, T. E. (2009). Interactions between biogeochemistry and hydrologic systems. Annu. Rev. Environ. Resour. 34, 65–96. doi: 10.1146/annurev.environ.33.031207.111141
Lybrand, R. A., and Rasmussen, C. (2015). Quantifying climate and landscape position controls on soil development in semiarid ecosystems. Soil Sci. Soc. Am. J. 79, 104–116. doi: 10.2136/sssaj2014.06.0242
McDowell, W. H., Zsolnay, A., Aitkenhead-Peterson, J. A., Gregorich, E. G., Jones, D. L., Jödemann, D., et al. (2006). A comparison of methods to determine the biodegradable dissolved organic carbon from different terrestrial sources. Soil Biol. Biochem. 38, 1933–1942. doi: 10.1016/j.soilbio.2005.12.018
Mikutta, R., Kleber, M., Torn, M. S., and Jahn, R. (2006). Stabilization of soil organic matter: association with minerals or chemical recalcitrance? Biogeochemistry 77, 25–56. doi: 10.1007/s10533-005-0712-6
Mikutta, R., Mikutta, C., Kalbitz, K., Scheel, T., Kaiser, K., and Jahn, R. (2007). Biodegradation of forest floor organic matter bound to minerals via different binding mechanisms. Geochim. Cosmochim. Acta 71, 2569–2590. doi: 10.1016/j.gca.2007.03.002
Miller, B. A., and Schaetzl, R. J. (2015). Digital classification of hillslope position. Soil Sci. Soc. Am. J. 79, 132–145. doi: 10.2136/sssaj2014.07.0287
Monteith, D. T., Stoddard, J. L., Evans, C. D., de Wit, H. A., Forsius, M., Hogasen, T., et al. (2007). Dissolved organic carbon trends resulting from changes in atmospheric deposition chemistry. Nature 450, 537–540. doi: 10.1038/nature06316
Murphy, K. R., Stedmon, C. A., Graeber, D., and Bro, R. (2013). Fluorescence spectroscopy and multi-way techniques. PARAFAC. Anal. Methods 5, 6557–6566. doi: 10.1039/c3ay41160e
Nimmo, J. R., and Perkins, K. S. (2002).“Aggregate stability and size distribution,” in Methods of Soil Analysis, eds J. H. Dane, and G. C. Topp (Madison, WI: Soil Science Society of America, 317–328.
Perdrial, J., Brooks, P. D., Swetnam, T., Lohse, K. A., Rasmussen, C., Litvak, M., et al. (2018). A net ecosystem carbon budget for snow dominated forested headwater catchments: linking water and carbon fluxes to critical zone carbon storage. Biogeochemistry 138, 225–243. doi: 10.1007/s10533-018-0440-3
Perdrial, J. N., Perdrial, N., Harpold, A., Gao, X., LaSharr, K. M., and Chorover, J. (2012). Impacts of sampling dissolved organic matter with passive capillary wicks versus aqueous soil extraction. Soil Sci. Soc. Am. J. 76, 2019–2030. doi: 10.2136/sssaj2012.0061
Porcal, P., Koprivnjak, J. F., Molot, L. A., and Dillon, P. J. (2009). Humic substances-part 7: the biogeochemistry of dissolved organic carbon and its interactions with climate change. Environ. Sci. Pollut. Res. Int. 16, 714–726. doi: 10.1007/s11356-009-0176-7
Rawlins, B. G., Wragg, J., and Lark, R. M. (2013). Application of a novel method for soil aggregate stability measurement by laser granulometry with sonication. Eur. J. Soil Sci. 64, 92–103. doi: 10.1111/ejss.12017
Rowley, M. C., Grand, S., and Verrecchia, É. P. (2018). Calcium-mediated stabilisation of soil organic carbon. Biogeochemistry 137, 27–49. doi: 10.1007/s10533-017-0410-1
Shanley, J. B., Kram, P., Hruska, J., and Bullen, T. D. (2004). A biogeochemical comparison of two well-buffered catchments with contrasting histories of acid deposition. Water Air Soil Pollut. 4, 325–342. doi: 10.1023/B:WAFO.0000028363.48348.a4
Shanley, J. B., Sebestyen, S. D., McDonnell, J. J., McGlynn, B. L., and Dunne, T. (2015). Water's Way at Sleepers River watershed - revisiting flow generation in a post-glacial landscape, Vermont USA. Hydrol. Proc. 29, 3447–3459. doi: 10.1002/hyp.10377
Singh, S., Inamdar, S., and Scott, D. (2013). Comparison of two PARAFAC models of dissolved organic matter fluorescence for a mid-atlantic forested watershed in the USA. J. Ecosyst. 2013, 1–16. doi: 10.1155/2013/532424
Six, J., Bossuyt, H., Degryze, S., and Denef, K. (2004). A history of research on the link between (micro)aggregates, soil biota, and soil organic matter dynamics. Soil Tillage Res. 79, 7–31. doi: 10.1016/j.still.2004.03.008
Six, J., Elliott, E. T., and Paustian, K. (2000). Soil macroaggregate turnover and microaggregate formation: a mechanism for C sequestration under no-tillage agriculture. Soil Biol. Biochem. 32, 2099–2103. doi: 10.1016/S0038-0717(00)00179-6
Sokolova, T. A., and Alekseeva, S. A. (2008). Adsorption of sulfate ions by soils (a review). Eur. Soil Sci. 41, 140–148. doi: 10.1134/S106422930802004X
Stuart, E. G. F. (2005). Increased carbon transport in the hudson river: unexpected consequence of nitrogen deposition? Front. Ecol. Environ. 3, 133–137. doi: 10.1890/1540-9295(2005)003[0133:ICTITH]2.0.CO
Tisdall, J., and Oades, M. (1982). Organic matter and water-stable aggregates in soils. J. Soil Sci. 33, 141–163. doi: 10.1111/j.1365-2389.1982.tb01755.x
Verwey, E. J. W. (1947). Theory of the stability of lyophobic colloids. J. Phys. Colloid Chem. 51, 631–636. doi: 10.1021/j150453a001
Wiekenkamp, I., Huisman, J. A., Bogena, H. R., Lin, H. S., and Vereecken, H. (2016). Spatial and temporal occurrence of preferential flow in a forested headwater catchment. J. Hydrol. 534, 139–149. doi: 10.1016/j.jhydrol.2015.12.050
Worrall, F., and Burt, T. P. (2007). Trends in DOC concentration in Great Britain. J. Hydrol. 346, 81–92. doi: 10.1016/j.jhydrol.2007.08.021
Wymore, A. S., Compson, Z. G., McDowell, W. H., Potter, J. D., Hungate, B. A., Whitham, T. G., et al. (2015). Leaf-litter leachate is distinct in optical properties and bioavailability to stream heterotrophs. Freshw. Sci. 34, 857–866. doi: 10.1086/682000
Wysocki, D. A., and Schoeneberger, P. J. (2017). “Soils in geomorphic research,” in International Encyclopedia of Geography: People, the Earth, Environment and Technology, eds D. Richardson, N. Castree, M. F. Goodchild, A. Kobayashi, W. Liu, and R. A. Marston (Hoboken, NJ: John Wiley & Sons, Ltd.), 1–19. doi: 10.1002/9781118786352.wbieg1008
Xie, W., Zhang, S., Ruan, L., Yang, M., Shi, W., Zhang, H., et al. (2017). Evaluating soil dissolved organic matter extraction using three-dimensional excitation emission matrix fluorescence spectroscopy. Pedosphere. 27, 968–973. doi: 10.1016/S1002-0160(17)60466-1
Yallop, A. R., and Clutterbuck, B. (2009). Land management as a factor controlling dissolved organic carbon release from upland peat soils 1: spatial variation in DOC productivity. Sci. Total Environ. 407, 3803–3813. doi: 10.1016/j.scitotenv.2009.03.012
Yamashita, Y., Maie, N., Briceño, H., and Jaffé, R. (2010). Optical characterization of dissolved organic matter in tropical rivers of the Guayana Shield, Venezuela. J. Geophys. Res. 115, 1–15. doi: 10.1029/2009JG000987
Keywords: soil aggregates, dissolved organic carbon, Sleepers River, ionic strength, fluorescence spectroscopy
Citation: Cincotta MM, Perdrial JN, Shavitz A, Libenson A, Landsman-Gerjoi M, Perdrial N, Armfield J, Adler T and Shanley JB (2019) Soil Aggregates as a Source of Dissolved Organic Carbon to Streams: An Experimental Study on the Effect of Solution Chemistry on Water Extractable Carbon. Front. Environ. Sci. 7:172. doi: 10.3389/fenvs.2019.00172
Received: 25 July 2018; Accepted: 14 October 2019;
Published: 07 November 2019.
Edited by:
Jiang Helong, Nanjing Institute of Geography and Limnology (CAS), ChinaReviewed by:
Morgan Reed Raven, University of California, Santa Barbara, United StatesYihua Cai, Xiamen University, China
Copyright © 2019 Cincotta, Perdrial, Shavitz, Libenson, Landsman-Gerjoi, Perdrial, Armfield, Adler and Shanley. This is an open-access article distributed under the terms of the Creative Commons Attribution License (CC BY). The use, distribution or reproduction in other forums is permitted, provided the original author(s) and the copyright owner(s) are credited and that the original publication in this journal is cited, in accordance with accepted academic practice. No use, distribution or reproduction is permitted which does not comply with these terms.
*Correspondence: Julia N. Perdrial, SnVsaWEuUGVyZHJpYWxAdXZtLmVkdQ==