 Jessica Turner
 Ankur R. Desai
 Jonathan Thom3
 Kimberly P. Wickland
 Brent Olson
- 1Nelson Institute for Environmental Studies, University of Wisconsin-Madison, Madison, WI, United States
- 2Department of Atmospheric and Oceanic Sciences, University of Wisconsin-Madison, Madison, WI, United States
- 3Space Science and Engineering Center, University of Wisconsin-Madison, Madison, WI, United States
- 4United States Geological Survey, Water Mission Area, Boulder, CO, United States
- 5United States Geological Survey, Upper Midwest Water Science Center, Rhinelander, WI, United States
Wetlands and their ability to mitigate climate change motivates restorative and protective action; however, scientific understanding of land-atmosphere interactions is restricted by our limited continuous observations of gaseous fluxes. Many wetlands are small in spatial scale and embedded in forested landscapes. Yet, little is known about how the relative sheltering of forests affects net carbon (C) and energy balance. Here, we analyze coterminous USGS and Ameriflux eddy covariance flux tower observations over 3 years in two shrub fens in Northern Wisconsin, one more sheltered (US-ALQ) than the other (US-Los). Unsurprisingly, the open site showed higher overall wind speeds. This should have implications for atmospheric fluxes in wetlands as wind-forced processes are essential in promoting gas exchange over water. While both sites had similar half-hourly net ecosystem exchange of CO2 (NEE) during daytime, there were significant differences in nighttime NEE, as well as in net radiation partitioning in early spring and late summer. Sensible heat (H) fluxes were smaller at the sheltered fen except for the months of July–September. In contrast, latent heat (LE) fluxes were higher in every month except July. Additionally, sheltered fen ecosystem respiration had a weaker linear correlation with air temperature (R: 0.08 vs. 0.57 for the open fen). Our work suggests that canopy sheltering does not cause significant differences in half-hourly NEE during the day, but rather the largest differences such as lower CO2 emissions occur at nighttime due to higher variance at very low wind speeds. Sheltering also influenced direction of air flow, mean wind speeds in day vs. night, energy balance, and sensible and latent heat fluxes. We discuss implications of these findings for wetland restoration.
Key Points
- Because wetlands are often small and embedded in forested landscapes, wind sheltering may influence land-atmosphere fluxes uniquely in wetlands.
- Eddy covariance estimates show similarities in half-hourly NEE from 7:30 am to 4:30 pm between sites, but higher NEE at an open fen (US-Los) than sheltered fen (US-ALQ) at night.
- Lower sensible heat (H) and higher latent heat (LE) during most of the growing season suggests sheltered fens offer more surface cooling than open fens.
Introduction
Wetland comparison studies often seek to understand gaseous fluxes according to wetland classification type, i.e., marsh, forested wetland, shrub etc. (Bernal and Mitsch, 2012; Turetsky et al., 2014; Coffer and Hestir, 2019). Others aim to resolve errors in upscaling due to heterogeneous land cover (Desai et al., 2007; Xiao et al., 2011; Aurela et al., 2015). Studies that focus solely on the effects of sheltering of wetlands through forests are limited. Yet, sheltering is important in many wetlands which are small in size and surrounded by forest.
Co-located flux towers in a sheltered and open fen with overlapping observations would allow us to test the role that sheltering has on carbon (C) uptake and energy balance as indicated by Bowen ratio [sensible heat flux (H)/latent heat flux (LE)]. Two eddy covariance flux tower sites, Lost Creek (US-Los) and Allequash Creek (US-ALQ), are used here to yield comparisons of gas exchange over wetlands in Northern Wisconsin and provide an opportunity for a more in-depth look than laboratory studies or large-scale syntheses.
One laboratory-based study on gas exchange in marshes with emergent vegetation concluded that thermal convection is a more important driver than wind for CO2 (carbon dioxide) exchange over surface water (Poindexter and Variano, 2013). Although gas transfer velocities in the model wetland did not depend on in-canopy wind speed, gas transfer velocities were positively correlated with wind speed and were greater than gas velocities predicted by thermal convection alone when mean in-canopy wind speed surpassed field-observed values (4.1 ms−1 mean wind speed above canopy, with in-canopy gusts up to 1.7 ms−1). Another study on wind sheltering of a lake by a tree canopy or bluff found that the inhibition of shear stress as a result of sheltering could be measured at a distance of 50 times the canopy height downwind from the canopy (Markfort et al., 2010). Results were the same for both wind tunnel and field experiments. Downstream wind velocity profiles took longer to recover from the sheltering effect of the canopy and were affected by the shape of canopy elements and canopy porosity.
Shade provided by canopies has been shown to alter the energy balance. In a 2009 study on agroforesty in coffee plantations, plants with no shade experienced higher temperatures and less relative humidity than plants at sites with low, medium or high shade (Lin, 2010). Average yearly potential transpiration for plants at a low shade site was also significantly higher than for those at medium and high shade sites. Plants at the low shade site lost significantly more water than those at the medium and high shade sites due to plant evaporative demand and soil evaporative demand rates. Plant transpiration demand had a close relationship with seasonality and shade, and further varied with changes in microclimate. Following these outcomes, lower LE would be expected at the open fen as a consequence of less shade.
Wetlands emit small amounts of C in winter, but accumulate C in the summer months as a result of vascular plant activity and the gradual accumulation of peat created by submerged and anaerobic water conditions. Previous wetland studies have synthesized global flux data to quantify wetland carbon accumulation (Gorham, 1991; Bridgham et al., 2006) and have outlined CO2 flux responses to water table level and air temperature (Sulman et al., 2010; Pugh et al., 2017). Since high winds promote evaporation from surface water and can decrease humidity, one might expect differences in energy balance between sheltered and open fens.
Comparative studies of LE and daily total evapotranspiration (ET) in wetlands tend to attribute differences between open and closed canopy sites to vegetation type and growth phase of dominant vegetation (Brown et al., 2010) as well as incoming solar radiation and albedo (Lafleur and Rouse, 1988), but also surface wetness or soil moisture (Lafleur, 1990b). The study by Lafleur (1990b) suggested that the impact of canopy sheltering is not fully offset by transpiration from aquatic vegetation, resulting in lower ET at shaded sites compared to sites with open water. On the contrary, a study by Drexler et al. (2004) determined that transpiration contribution from plants can exceed evaporation over an open water surface in wetlands in some cases. Evidently, literature does not show a consensus regarding whether evaporation or transpiration is more influential. Results are site-specific (Mohamed et al., 2012).
Regardless of whether transpiration or evaporation contributes more, LE dominates surface heat balance in wetlands, leading to a Bowen ratio less than one. Dense vegetation, large leaf surface area, high soil moisture, and surface roughness are also conducive to high LE. However, there are other factors that influence transpiration including canopy size, plant species, climate, measurement method, and plant density (Crundwell, 1986).
A number of environmental factors not previously mentioned that have been shown to control net ecosystem exchange (NEE) of CO2 in various types of ecosystems include substrate quality, light quality, and incoming solar radiation (Rg). Low water table level and stream flow can also alter emissions in fens (Chimner and Cooper, 2003; Drewer et al., 2010; Sonnentag et al., 2010). For example, vascular plants can emit more CO2 when water levels are low but can also have specific water levels where CO2 uptake is optimized. Streams will alter eddy covariance estimates of NEE by discharging CO2 that would have otherwise been sequestered in peat (Billett et al., 2010; D'Acunha et al., 2019). In this study, we considered how nighttime air temperature influences NEE at each site. Site-specific responses of CO2 uptake to air temperature have clear implications in a changing climate.
Here, we compared wind variability, CO2 flux, Bowen ratio, and nighttime NEE-air temperature sensitivities of two co-located eddy covariance flux towers to understand how sheltering might alter the energy balance and carbon cycling of wetlands. We then test the hypothesis that increased surface roughness from nearby trees leads to lower wind speeds in sheltered wetlands. Lower wind speeds would then promote weaker net CO2 uptake and ET at sheltered wetlands. Shading should further contribute to lower ET and CO2 flux at sheltered sites. Despite differences in sheltering, ecosystem properties such as air temperature sensitivity of NEE should be similar.
Through our analyses, we attempt to answer the following questions:
(1) What is the role of landscape sheltering on wetland ecosystem characteristics and energy balance?
(2) What is the effect of sheltering on channelized flow, mean wind speeds (day vs. night), mean latent heat flux, and daily CO2 cycle?
(3) What do the wetland-atmosphere interactions observed in this study imply for wetland restoration and climate adaptation?
Methods
Site Descriptions
The most common wetlands in Wisconsin are freshwater marshes, sedge meadows, aquatic beds, forested, and scrub/shrub wetlands (Wisconsin Department of Natural Resources., 2017b). Categorization of wetland type is according to soil type, vegetation, and degree of saturation. The two wetlands referred to in this study are mosaics of sedge meadow, forested, and scrub/shrub wetland. They are located ~29 km apart.
To assess the amount of open area at each wetland, we measured the area of conjoined pieces of land that were not visibly forested and did not contain dense shrub vegetation within a specific radius. Aerial imagery was taken by United States Department of Agriculture Farm Service Agency and accessed via Google Earth Pro (Google earth V 7.3.2.5776, 2016a,b). The radius was equal to 100 times the tower height, representing a maximum likely flux footprint or influence area for each site (Schmid, 2002). Small, isolated patches of open land were not included in the calculation. At the sheltered fen, open area was located along the stream (Figure 1A). At the open fen, open area followed the stream and extended outwards (Figure 1B). We also considered land cover classifications within the radius. Land cover classifications that accounted for less than one percent of the area within the circle were not included in the pie charts (Figure 2). Soil at both sites was categorized as wet palustrine soil unless otherwise stated. Specific land cover classifications were determined using the Wisconsin Wetland Inventory maps in the Surface Water Data Viewer web mapping application (Wisconsin Department of Natural Resources., 2017a). Wisconsin DNR completed the statewide map in 1984. The classification system is explained in the Wisconsin Wetland Inventory Classification Guide (Wisconsin Department of Natural Resources., 1992).
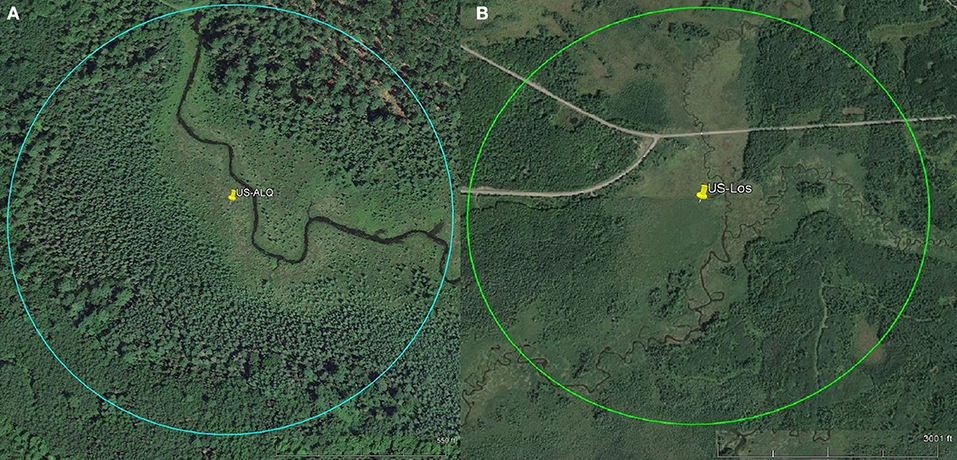
Figure 1. Pins represent tower location. Scales for each site are located at the bottom right of each aerial photo. Circles indicate flux footprints. (A) Aerial imagery of sheltered fen US-ALQ (Google earth V 7.3.2.5776, 2016a). Radius: 238 m. (B) Aerial imagery of open fen US-Los (Google earth V 7.3.2.5776, 2016b). Radius: 1,033 m.
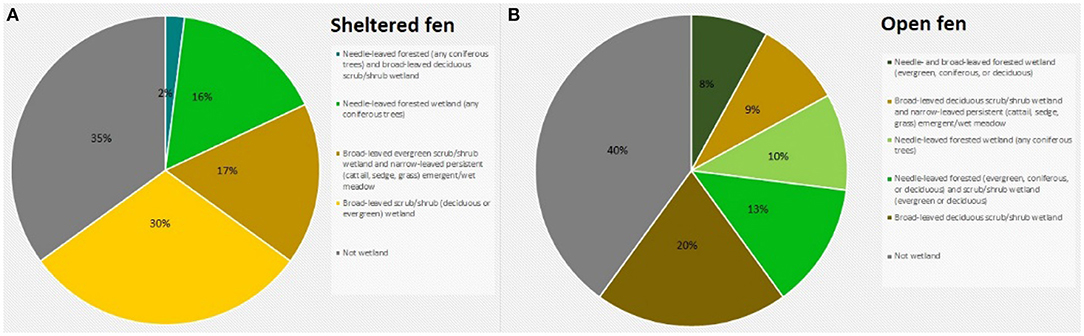
Figure 2. (A) Land cover classification at the sheltered fen (US-ALQ). (B) Land cover classification at the open fen (US-Los). Blue, needle-leaved forested (any coniferous trees) and broad-leaved deciduous scrub/shrub wetland; bright green, needle-leaved forested wetland (any coniferous trees); light brown, broad-leaved evergreen scrub/shrub wetland and narrow-leaved persistent (cattail, sedge, grass) emergent/wet meadow; yellow, broad-leaved scrub/shrub (deciduous or evergreen) wetland; gray, not wetland; dark green, needle- and broad-leaved forested wetland (evergreen, coniferous, or deciduous), light green, needle-leaved forested wetland (and coniferous trees); dark brown, broad-leaved deciduous scrub/shrub wetland.
A detailed description of the sheltered fen (US-ALQ) can be found in Anderson and Lowry (2007). The 32 ha fen is situated in Trout Lake Basin in northern WI (46.030759, −89.606730). It is part of the National Science Foundation's North Temperate Lakes Long-Term Ecological Research (NTL-LTER) as well as the US Geological Survey's Water, Energy and Biogeochemical Budgets Program (WEBB) Trout Lake site. The soil comprises outwash sand and gravel atop crystalline bedrock. Due to the glacial outwash, the soil is highly conductive and promotes groundwater discharge to the nearby creek. A headwater stream, Allequash Creek, flows from the southeast to the northwest through the fen. The eddy covariance flux tower is located along the stream which is surrounded by tree stands to the northeast and southwest that create a “valley” and cause channelized flow in the direction of the stream (Figure 1A).
The valley of the sheltered fen is ~140 m wide adjacent to the tower. Land cover in the valley is classified as a mix of broad-leaved evergreen scrub/shrub wetland and narrow-leaved persistent (cattail, grass, or sedge) emergent/wet meadow (Figure 2A). The mix of sedge and shrubs lining Allequash Creek comprises ~17% of the area under consideration at this site. The rest of the sheltered fen is comprised of broad-leaved scrub/shrub wetland (30%) and coniferous forested wetland (16%). Land cover not classified as wetland appears to be forested with some shrubs at the outskirts of the study region. Approximately 29% of the study area is open.
A detailed description of the more open-in-scale fen (US-Los) can be found in Sulman et al. (2009) and Pugh et al. (2017). The tower is positioned adjacent to Lost Creek in North Central Wisconsin, USA (46.082777, −89.978611). As stated in Sulman et al., this wetland is representative of many minerotrophic wetlands in the Great Lakes region because of its long and narrow shape and proximity to a stream or river (2009). Long, narrow wetlands such as these have higher ET than more dispersed wetlands as a product of ventilation though a small, isolated plant canopy (Drexler et al., 2004).
Vegetation cover at the open fen is predominantly classified as broad-leaved deciduous scrub/shrub wetland (20%), with 15% located in a floodplain complex and the rest in wet palustrine soil (Figure 2B). The open fen also consists of dispersed portions of needle-leaved forested wetland (10%) among fragments of broad-leaved deciduous scrub/shrub wetland and narrow-leaved persistent (cattail, sedge, or grass) emergent/wet meadow (9%). Approximately 45% of the study area is completely open (Figure 1B).
Flux Instrumentation
Instrumentation at the sheltered fen included a sonic anemometer (Campbell Scientific, Inc., Logan, UT, CSAT-3), open path infrared gas analyser (LiCor, Inc., Lincoln, NE, LI-7500A), and air temperature and humidity measurements (Campbell Scientific, Inc., Logan, UT, Vaisala HMP45C platinum-resistance thermometer). Solar radiation (Rg) was not measured at this location during the time of study. Rg was replaced with data from the open fen. Air temperature and vapor pressure deficit (VPD) were gap-filled with data from the open fen. The tripod eddy covariance tower at the sheltered fen is ~2.4 m tall.
Instrumentation at the open fen included a sonic anemometer (Campbell Scientific, Inc., Logan, UT, CSAT-3), open path infrared gas analyser (LiCor, Inc., Lincoln, NE, LI-7500A), temperature/relative humidity sensor (Campbell Scientific, Inc., Logan, UT, CS215), radiation sensor (Kipp & Zonen North America, Sterling, USA, Kipp-Zonen CNR4), and quantum sensor which measures photon flux (LiCor, Inc., Lincoln, NE, LI-190). The tripod eddy covariance tower at the open fen is ~10 m tall. Both towers collected data at a frequency of 10 Hz, which was then averaged every half hour after processing.
Quality Control
The datasets analyzed in this study both begin on April 11th, 2015 and end on April 25th, 2017.
Eddy covariance flux data for the sheltered fen were calculated using EddyPro software (Olson, 2018). Eddypro calculates quality flags for sensible and latent heat, momentum, and gas fluxes using the steady state test and the developed turbulent conditions test (Foken and Wichura, 1996; Foken et al., 2004; Göckede et al., 2008). For more information on the specific tests, see cited literature.
Outliers were removed after processing with EddyPro. NEE outliers were values over 20 or under −50 μmol m−2 s−1. Outliers of LE were values >600 or < -100 W m−2. Outliers of H were values >600 or < -300 W m−2. Low-quality NEE, LE, and H data (quality control flag = 2) were also removed.
Missing and screened flux data from both sites were gap-filled using the Marginal Distribution Sampling technique, which was selected as the standard method of FluxNet. Marginal Distribution Sampling involves estimating missing flux values using a moving look-up table, based on Rg, Tair or Tsoil, VPD, and NEE from surrounding days. More information on the specific technique is outlined in Reichstein et al. (2005) and Wutzler et al. (2018). U-star filtering and daytime-based flux partitioning (Lasslop et al., 2010) was performed on REddyProc using the moving point test and continuous seasoning from December of the previous year to January and February.
Only considering the data that we used during the study, the sheltered fen (US-ALQ) originally had 50.52% missing NEE (44.75% of daytime, 58.19% of nighttime). After gap-filling, this number was reduced to 24.79% (23.16% of daytime, 26.96% of nighttime). The amount of data that was gap-filled totalled 25.72%.
Half-hourly flux data for the open fen were downloaded from Ameriflux (Desai, 2017). The open fen (US-Los) originally had 33.41% missing NEE (25.29% of daytime, 44.38% of nighttime). After gap-filling, this number was reduced to 0% for both daytime and nighttime. The amount of gap-filled data at the open fen was 33.41%.
All statistical analysis was performed using growing season data from both sites because it had the most reliable, continuous flux data. “Growing season” in this study refers to a rough estimate of carbon uptake period, from April 1st to October 31st. This estimate is similar to carbon uptake periods used in other C flux studies in North America (Frank and Dugas, 2001; Raczka et al., 2013). NEE calculations were also performed for spring, summer, and fall. Spring was defined as April 1st to June 15th. Summer was June 16th to August 31st. Fall was September 1st to October 31st. The year with the least amount of missing data during both day and nighttime for the sheltered fen was 2016. As a result, data from 2016 were selected for full-year comparisons.
Analysis
Eddy covariance half-hourly turbulent flux measurements are temporally auto-correlated, have a double-exponential error distribution, and heteroskedastic error (Richardson et al., 2006). However, averaged NEE over the daily scale, or analysis of large sample sizes tends to converge to Gaussian behavior. While methods exist to account for these factors, including degree of freedom reduction and uncertainty propagation (Desai, 2014), our approach here was a first-cut test of difference.
A Q10 function for NEE-air temperature sensitivity was calculated using nighttime NEE and air temperature when air temperature was above zero. Q10 was calculated using the formula:
The parameters T2 and R2 represent mean air temperature and mean half-hourly NEE at each site, respectively. Incorporating the means of air temperature and half-hourly NEE into the equation helped to eliminate bias from large fluctuations in NEE. The difference of T2 and T1 was plotted vs. ratio of R2 to R1, and Q10 was estimated to be the y-value at (T2-T1) = 10, or 10° above the mean air temperature at each site. Pearson correlation coefficients were also calculated between the data displayed on the x and y axes in order to estimate the strength of the linear relationship between nighttime NEE and air temperature. A second-order polynomial was fit to the Q10 function of each fen. The polynomial was then back-solved for y at x = 10.
Variance analysis and significance testing was performed to understand temporal similarities in NEE between sites. This was done using Morlet wavelet coherence of half-hourly NEE from each site and a histogram of daily mean NEE from each site. Morlet wavelet coherence was calculated using half-hourly NEE values when wind speeds at each site were within ± 0.2 m s−1 of each other. Wind speeds not within this range were removed along with corresponding NEE values and were replaced with a random scalar drawn from the standard normal distribution.
Standard error of the mean was calculated for half-hourly NEE averaged over the entire growing season for each site (Figure 8) and for monthly average daytime Bowen ratios (Table 3). Standard error of the mean was calculated using standard deviation (σ) and number of data points (n). The formula is shown below:
Two-sample t-testing was used to determine significant differences between sites regarding daily average Bowen ratios and half-hourly NEE. Testing performed on Bowen ratios compared daily average Bowen ratios for each month separately. Half-hourly NEE values were also compared separately by splitting data according to time of day and calculating the results of 48 different t-tests, one for each half-hour. All t-testing was performed at the 99% confidence level. The null hypothesis was that data in each set came from normally distributed, independent random samples with equal means and equal but unknown variances. Although Bowen ratios did not meet the initial assumption that data is normally distributed, a cumulative distribution function showed that the data were very close to standard normal distribution, but slightly skewed to the right because growing season Bowen ratios tend to be positive. We believe the results of these tests are accurate based on the Central Limit Theorem, which states that as sample size grows toward infinity the distribution of sample means approaches normal. Bowen ratios >10 or < -10, and nighttime values, were not included in statistical tests of the Bowen ratio.
Pearson correlation coefficients (R) and correlation significance were calculated in order to understand the strength of the linear relationship of NEE between sites, as well as the relationship between nighttime NEE and air temperature at each site. Pearson correlation was estimated for daily mean NEE during the entire growing season, and for spring, summer, and fall individually. Correlation significance was determined using the Pearson correlation coefficient (R) and number of samples (n). The null hypothesis of the correlation significance test was that the true correlation of X and Y is zero. The p-value was calculated from the t-value, whose equation is shown below:
Results
Wind Speeds and Variability
Dominant flow at the sheltered fen was northwest and southeast following the stream (Figure 3A). Mean wind speed at the sheltered fen was 1.09 ms−1 ± 0.66 and 0.56 ms−1 ± 0.62 for day and nighttime, respectively, from 2015 to 2017. In contrast, the open fen did not display a dominant wind direction (Figure 3B). Mean wind speed at the open fen was 2.90 ms−1 ± 1.50 and 2.07 ms−1 ± 1.37 for day and nighttime, respectively, from 2015 to 2017.
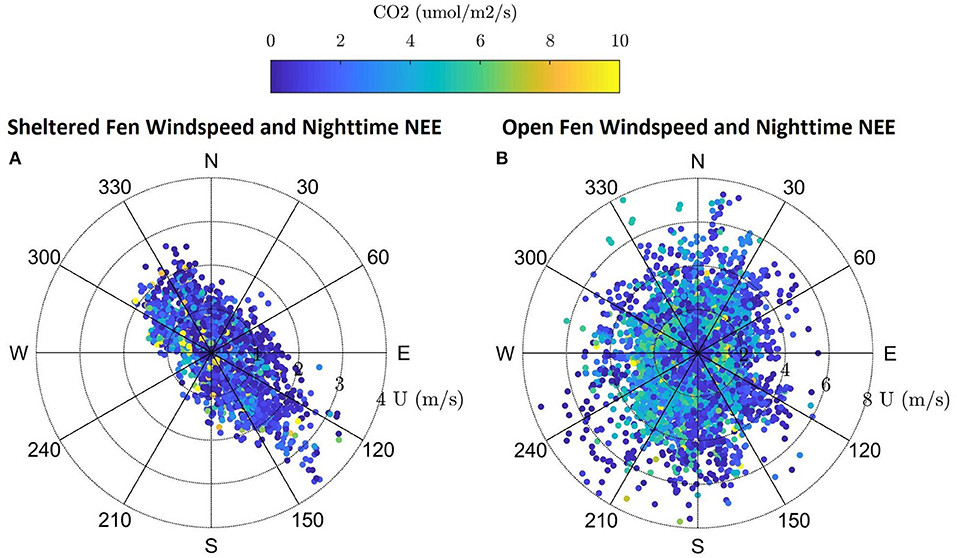
Figure 3. (A,B) Windrose for the sheltered fen US-ALQ with nighttime NEE, wind speed and direction during growing season 2015–2017. Windrose for the open fen US-Los with nighttime NEE, wind speed and direction during growing season 2015–2017.
Directional flow at the sheltered fen was likely due to dense (at least 300 m thick) tree formations located just 95 m to the northeast and 42 m to the southwest of the eddy covariance tower. Although the valley consists of low-lying sedge and provides an open area for high wind flow to develop, it is not wide enough for the wind to overcome the sheltering effect.
Vegetation also appears to follow the path of the stream in the eastern portion of the open fen. However, the “valley” created by vegetation surrounding the stream at the open fen is much wider than the valley at the sheltered fen (330 m as compared to 140 m). Land cover at the open fen also contains many random patches of trees in scrub/shrub wetland or emergent/wet meadow (Figure 1B). The nearest patch of trees more than 150 m thick is 230 m to the northeast of the tower at the open fen. Open space dominates to the north and southwest of the open fen.
Nighttime wind speeds at each site were lower than overall mean wind speed (36% lower for sheltered, 19% for open). However, mean nighttime wind speed at the open fen was more than three times the mean nighttime wind speed at the sheltered fen (Figures 4B, 5B). Daytime wind speed at the open fen was also higher (1.81 ms−1 more than the sheltered fen) (Figures 4A, 5A).
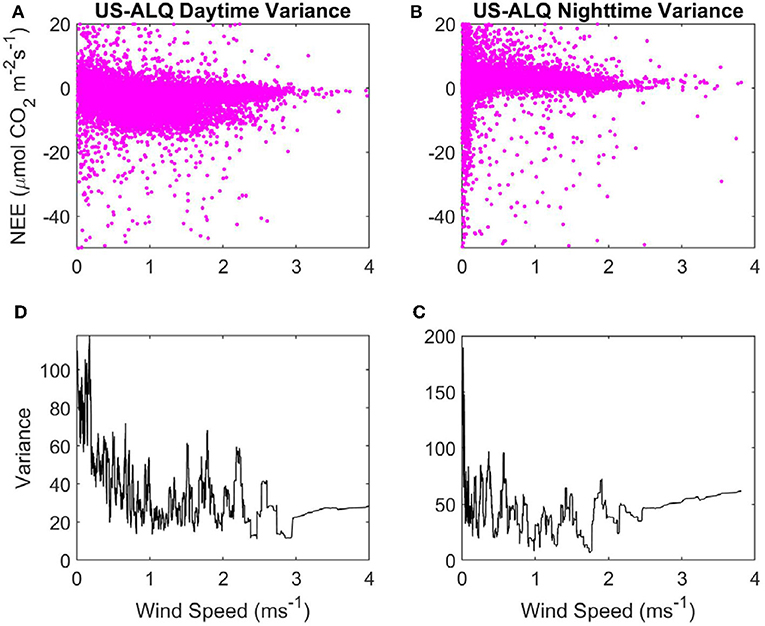
Figure 4. Variance of NEE with WS at the sheltered fen US-ALQ: (A) Daytime NEE vs. WS. (B) Nighttime NEE vs. WS. (C) Variance of nighttime NEE vs. WS. (D) Variance of daytime NEE vs. WS. Pink, half-hourly NEE; black, variance of NEE.
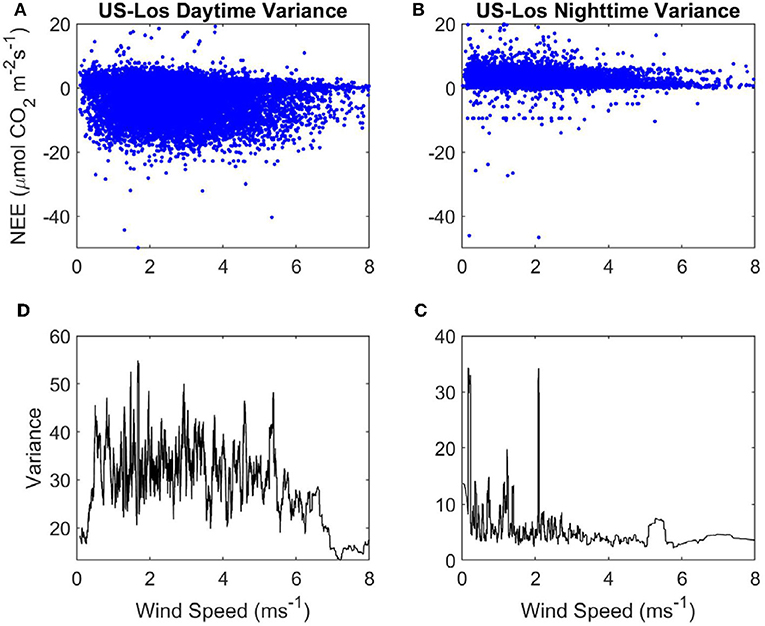
Figure 5. Variance of NEE with WS at the open fen US-Los: (A) Daytime NEE vs. WS. (B) Nighttime NEE vs. WS. (C) Variance of nighttime NEE vs . WS. (D) Variance of daytime NEE vs. WS. Blue, half-hourly NEE; black, variance of NEE.
Variance in nighttime NEE spikes up to ~180 when WS is < ~0.1 ms−1, but there does not appear to be a strong linear relationship with variance of NEE as WS increases at nighttime either (Figure 4C). Mean variance of NEE at nighttime (45.71) is higher than at daytime. Variance of daytime NEE has an initially high peak but declines strongly as WS increases from 0 to 1 ms−1 at the sheltered fen (Figure 4D). This peak in variance at very low WS causes the mean variance of daytime NEE (35.81) to be higher overall, despite low variances from 1 to 4 ms−1. There does not appear to be any relationship between WS and variance of NEE at daytime for WS over 1 ms−1.
There are some spikes in variance of nighttime NEE between 0 and 2.2 ms−1 at the open fen, but there is not a clear linear relationship between WS and variance of nighttime NEE (Figure 5C). Mean variance of daytime NEE is similar to the open fen (32.73, compared to 35.81), but mean variance of nighttime NEE is much lower than the open fen (6.35, compared to 45.71). Variance of daytime NEE increases from 0 to 1 ms−1 at the open fen (Figure 5D). Variance does not appear to be influenced by WS until ~5 ms−1, when variance of daytime NEE decreases with increasing WS.
Evapotranspiration
Monthly average Bowen ratio at the start of the 2016 growing season was 0.95 at the sheltered fen (Table 1). Bowen ratios then began to decrease as latent heat fluxes dominated net radiation partitioning due to ET from new vegetation. The lowest Bowen ratio of 0.21 was reached in July. Monthly average Bowen ratio maintained a low value during August and September. The Bowen ratio then increased to 0.73 in October.

Table 1. Energy balance at the sheltered fen.
Unlike the sheltered fen where latent heat flux dominated in early spring, sensible heat dominated at the open fen at the beginning of the 2016 growing season with a monthly average Bowen ratio of 1.55. Bowen ratios then decreased going into summer (Table 2). The lowest Bowen ratio occurred in July, and values stayed low until October. The open fen had noticeably higher H in April and May compared to the sheltered fen, but noticeably lower H in August. Additionally, mean monthly LE was markedly lower at the open fen during every month of the growing season except July and September, when the difference in LE was within 4 Wm−2.

Table 2. Energy balance at the open fen.
Peak Bowen ratios co-occurred with peak incoming solar radiation at both sites (Figures 6A,D). This indicates a strong daily cycle during the entire growing season at both sites. When considering the entire dataset, daily average Bowen ratios had significant differences in mean in April, May, and August (p < 0.01) but no difference in other months. Monthly average Bowen ratio was higher at the open fen in April and May, but lower in August.
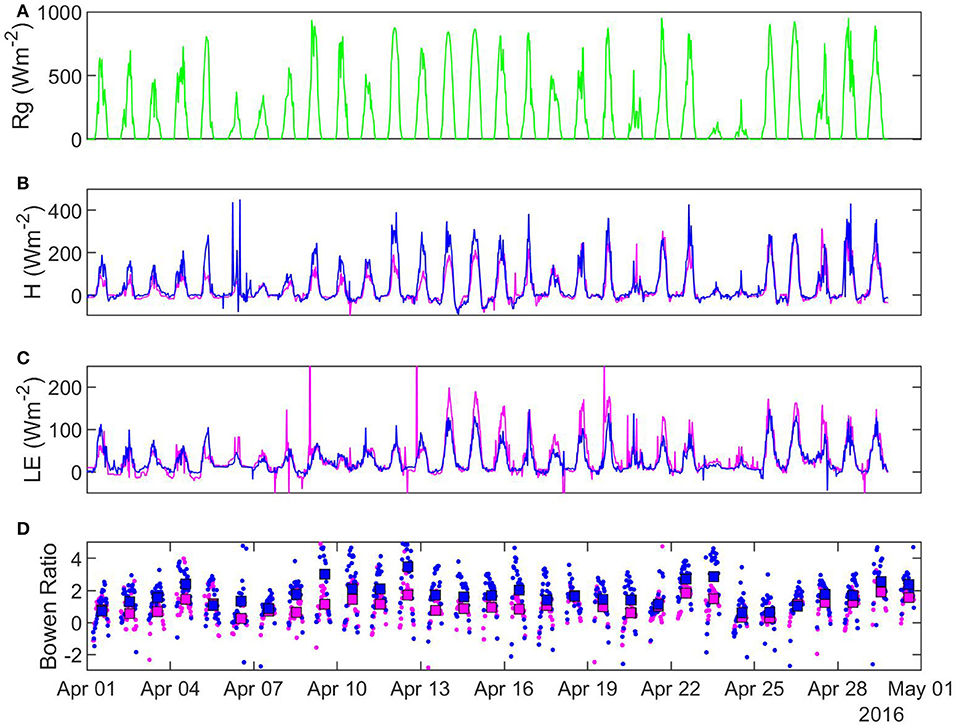
Figure 6. Half-hourly characteristics of selected fluxes in April 2016: (A) solar radiation (B) sensible heat (C) latent heat (D) Bowen ratio. Pink, sheltered fen (US-ALQ); blue, open fen (US-Los); green, Rg for both sites.
In 25 out of 28 recorded days in April 2016, daily average Bowen ratio was higher at the sheltered fen than the open fen (Figure 6D). The pattern occurred due to higher H (Figure 6B) and lower LE (Figure 6C) at the sheltered fen, and continued into May. Starting in June, daily average Bowen ratios became more variable and one site was not consistently higher than the other. Monthly average Bowen ratios for both sites were lowest in July and stayed low until October. This pattern indicates a prominent seasonal trend in net radiation partitioning (Tables 1, 2). Bowen ratio appears to be influenced by vegetation growth and senescence in the spring and fall, but microclimate likely became a determining factor during growing season, causing variability on a daily scale between the two sites.
Monthly average air temperatures were lower at the sheltered fen (US-ALQ) than the open fen (US-Los), with the strongest differences occurring in the first half of the growing season (Table 3). Higher VPD at the open fen during most of the growing season also indicates drier conditions in the air.
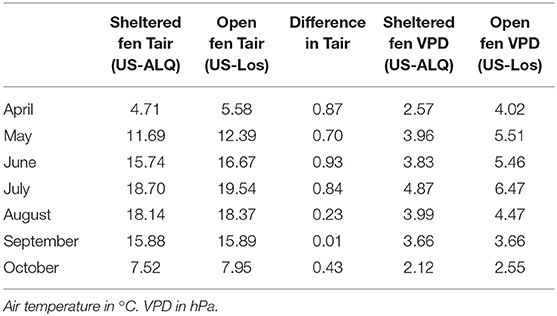
Table 3. Average monthly air temperature and VPD at both sites.
Carbon Dioxide Fluxes
Average daily NEE during spring at the sheltered fen was −1.91 μmol m−2 s−1 ± 1.88 (standard deviation). The CO2 sink grew going into the summer season with an average daily NEE of −3.05 μmol m−2 s−1 ± 2.01. The site became a weak CO2 sink in fall with an average daily NEE of −0.27 μmol m−2 s−1 ± 1.53.
Average daily NEE during spring at the open fen was less than half that of the sheltered fen, at −0.88 μmol m−2 s−1 ± 1.88. The CO2 sink was largest in summer when average daily NEE became −2.09 μmol m−2 s−1 ± 1.63, but remained smaller than the sheltered fen. The open fen then became a C source in the fall with a daily average NEE of 0.45 ± 1.03 μmol m−2 s−1.
The daily CO2 cycle displays half-hourly NEE averaged over the entire growing season, at each half-hour of the day (Figure 7). A significant difference (p < 0.01) of the means and variances of half-hourly NEE between the two fens can be seen at the start and end of the daily cycle, which represents differences that occur at nighttime (Figure 7). Fluxes of CO2 at the sheltered fen are lower than fluxes at the sheltered fen in the early morning and afternoon, but there is no significant difference in half-hourly NEE from 7:30 a.m. to 4:30 p.m. It is interesting to note that both sites achieve the same uptake of NEE (~6 μmolm−2s−1) around 1 pm on average throughout the growing season.
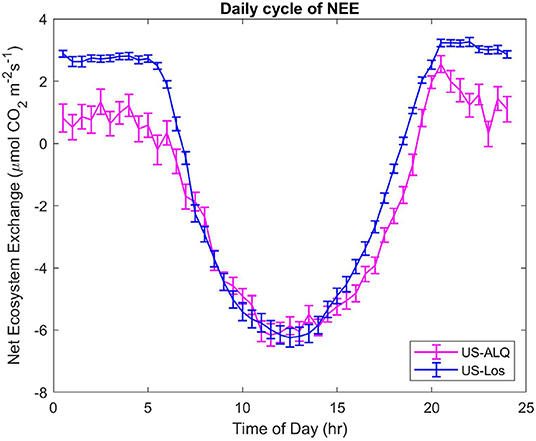
Figure 7. Daily cycles of NEE for both sites. Half-hourly fluxes were averaged over the entire growing season. Error bars represent standard error of the mean. Pink, sheltered fen (US-ALQ); blue, open fen (US-Los).
The wavelet coherence displays intermittent high coherence of NEE between sites on daily, weekly, and monthly scales throughout the 2016 growing season (Figure 8). There was some correlation on timescales under a day in the middle of the growing season, but little to no correlation between 16 and 30 days. However, there did appear to be a correlation on the scale of the summer overall or at a period of ~70–128 days.
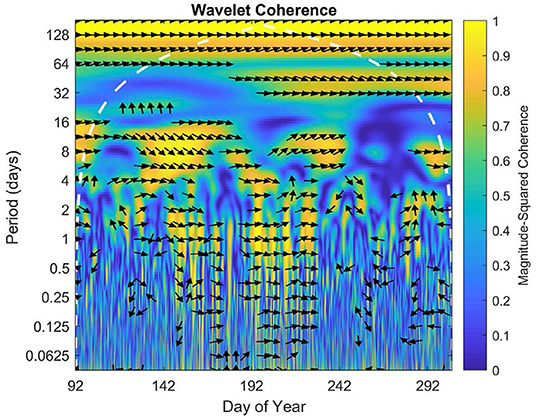
Figure 8. Wavelet coherence for growing season 2016. The x axis represents time, while y axis represents frequency. The direction of each arrow represents phase lag of half-hourly NEE of the open fen with respect to the sheltered fen on a unit circle. Phase arrows pointing right mean data is in-phase. Left is anti-phase. Down means the open fen leads by 90°. Up means the sheltered fen leads by 90°. The white dashed line is the cone of influence, which eliminates data potentially impacted by edge-effect artifacts. Yellow indicates high coherence of data, while blue indicates low coherence.
Daily mean NEE at the sheltered fen during the year of 2016 has a mean of −1.81 μmol m−2 s−1 and standard deviation of 2.2 (Figure 9). Daily mean NEE at the open fen peaks around 0.5 and −2.5 μmol m−2 s−1, and an average of −0.92 μmol m−2 s−1 with a standard deviation of 1.94. The distribution of daily mean NEE at the open fen indicates a confounding or external factor impacting the dataset. There was significant (p < 0.001) linear correlation of daily mean NEE between the two fens in 2016 (R = 0.72). Spring NEE showed almost the same linear correlation between the two sites (p < 0.001, R = 0.71) as summer (p < 0.001, R = 0.69). There was also significant correlation of daily mean NEE between sites during fall, but the correlation coefficient showed a less linear relationship than the other seasons (p < 0.001, R = 0.44).
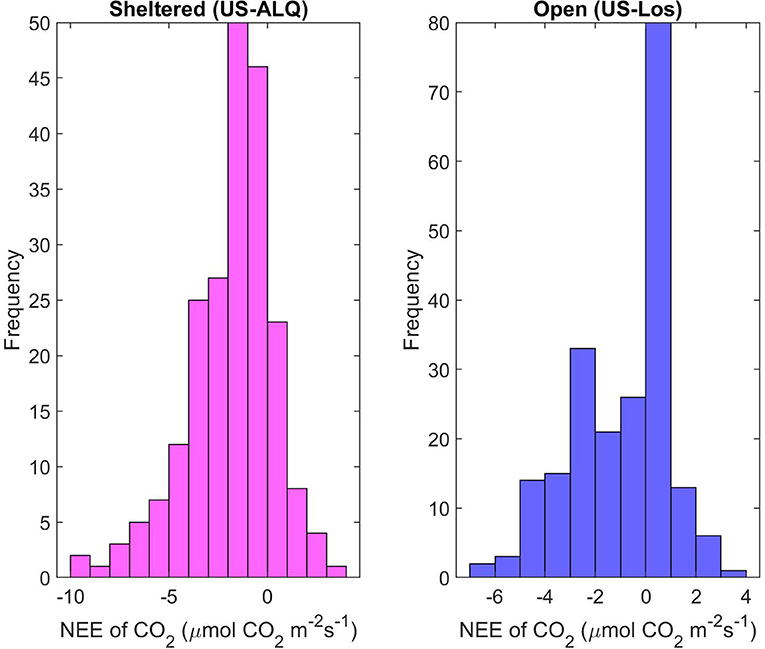
Figure 9. Histograms of daily mean NEE for each site for growing season 2016. Pink, sheltered fen (US-ALQ); blue, open fen (US-Los).
Environmental Controls of Carbon Dioxide Flux
The sheltered fen (US-ALQ) had a Q10 of 1.98 (Figure 10A). The open fen (US-Los) had a similar Q10 of 2.04 (Figure 10B). Despite similarities in Q10 between sites, air temperature had a stronger linear correlation with nighttime NEE at the open fen (R = 0.57) than the sheltered fen (R = 0.08). Quantum yield of GPP was also higher at the open fen, by ~4 μmolm−2s−1.
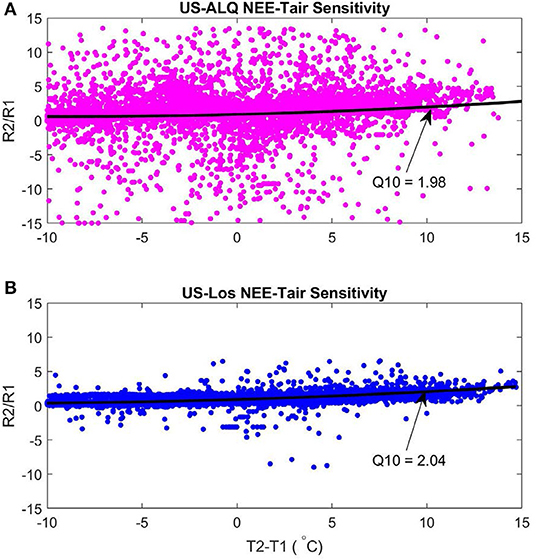
Figure 10. Q10 functions of nighttime NEE-air temperature sensitivity 2015–2017. Black line is the second-degree polynomial fit line. (A) Sheltered fen Q10. Root Mean Square Error: 5.17. (B) Open fen Q10. Root Mean Square Error: 5.13. Pink, sheltered fen (US-ALQ); blue, open fen (US-Los); black, second-degree polynomial.
Although Q10 is essentially the same at both sites, higher variance of NEE during nighttime at the sheltered fen results in a much less linear relationship with air temperature. In other words, the result of increasing nighttime air temperature at the sheltered fen is less predictable than at the open fen.
Risk of Analysis Biases
Location of the tower at Allequash Creek (US-ALQ) within a clearing of trees brings into question whether the tower measurements reflect large eddies that would have otherwise been broken up by trees and other surface heterogeneities, given that there is some directional flow of CO2 (Figures 3A,B). Because we did not see any “hot spots” of high fluxes of CO2 in the wind roses, we continued our analysis on the assumption that the valley did not skew flux data at the sheltered fen.
A further cause for concern was outdated land cover classifications. Wisconsin Wetland Inventory maps used to determine vegetation cover were completed in 1984 (Figures 2A,B). Comparisons of land cover were based on the assumption that ecological succession was negligible from 1984 to 2017. This is an appropriate assumption for most wetlands, which do not undergo traditional succession because of flooded conditions (Wilcox, 2004 and Kratz et al., 1998). Additionally, aerial imagery from Google Earth from 2015 and 2016 over the flux tower locations appeared to match classifications in the Surface Water Data Viewer (Figures 1A,B).
Discussion
Effect of Sheltering on Energy Balance and NEE
In this study, we sought to find out the role of landscape sheltering on wetland ecosystem characteristics and energy balance. We also aimed to understand how sheltering might impact other micrometeorological conditions such as channelized flow, mean wind speeds, and daily CO2 cycle. These questions were answered by comparing the daily CO2 cycle, daily mean Bowen ratios for each month of the growing season, variances of NEE on varying time scales, and coherence of NEE from two fens. Results showed that landscape sheltering can cause channelized flow and lower mean wind speeds during both day and nighttime (Figures 3A,B, 4A,B). Sheltering can also alter the energy balance in spring by lowering H and raising LE, and in late summer by partitioning more net radiation into H relative to LE compared to an open fen (Figure 6, Tables 1, 2). Daily NEE also has a weaker linear correlation between sheltered and open fens in the fall. However, sheltering does not appear to impact other factors; these include energy balance during early summer and fall, half-hourly NEE during the daytime (Figure 7), and Q10 respiration function although the linear correlation of nighttime NEE and air temperature is weaker (Figures 10A,B). Wavelet coherence of NEE between sites acted as a way to confirm earlier results (Figure 8).
One study that also examined wetland ET found seasonal variation was predominantly controlled by net radiation and air temperature (Zhou and Zhou, 2009). Another study, which used data from 2001-2007 at the open fen, positively linked ET and water table level (Sulman et al., 2009). Water table level was not included in the analysis because it was not recorded at the sheltered fen (US-ALQ).
A comparative analysis of CO2 exchange across northern peatland and tundra sites determined a significant relationship between NEE and leaf area index, and pH on an annual scale (Lund et al., 2010). Our results agree that net radiation has an impact on energy balance (Figure 6), and there is a clear seasonal trend of Bowen ratio at both sites (Tables 1, 2). However, there were significant differences in Bowen ratio that could not be explained solely by climate. More extensive information on vegetation types at each fen could allow for analysis of differences due to leaf area index. Leaf area index was not calculated in this study.
Growing season Bowen ratios calculated in this study had similarities to wetland values calculated in the central US, Poland, and Canada (Lafleur et al., 1997; Lenters et al., 2011; Siedlecki et al., 2016). Bowen ratios at the sheltered and open fen were similar to those listed in Siedlecki et al. (2016) and Lafleur et al. (1997) except for in July, when the monthly average Bowen ratio at the open fen dropped as low as 0.09 ± 0.03. However, the low Bowen ratio at the open fen in July was consistent with the monthly average Bowen ratio for July from Lenters et al. (2011), which represented a wetland in Nebraska dominated by common reed.
Differences in Vegetation Type
Differences in vegetation type between the sheltered and open fen should be considered for their impact on energy balance. Ratio of transpiring to non-transpiring vegetation, and surface litter are some factors that influence ET rate (Drexler et al., 2004). Evidently, vegetation can have an impact on wetland characteristics and micrometeorology.
Stomatal conductance—the rate of CO2 or water vapor entering or exiting a leaf—of wetland vegetation is another potential source of dissimilarity when performing flux comparisons. It has been noted as a control over wetland ET particularly in vascular plants (Lafleur, 1990a; Drexler et al., 2004). In wetland tundra, stomatal resistance in sedges was the cause of higher ET during hot, dry weather as opposed to cool, wet conditions which one might expect to have been more favorable (Rouse et al., 1992).
Although we focused on growing season data in this study, the insulation capability of dry lichen hummocks in winter should be considered (Drexler et al., 2004). Insulation is important because colder soils will produce smaller CO2 emissions after thawing, which could potentially be attributed to CO2 build up and release from the ground, or intensified microbial activity due to freeze-thaw dynamics. Although one would expect similar snow fall at both sites in winter, a higher presence of sedge hummocks at one site compared to the other may lead to differences in H in the early spring and late fall. This insulating factor could provide an explanation for lower H at the sheltered fen throughout most of the growing season.
The hypothesis presented in this study is complicated by the presence of sedge vs. shrub. Shrubs have a high fraction of leaf to vascular tissue area, minimal vertical shading, and high adaptability. Studies have shown shrubs will extend roots to maintain transpiration rates in the case of lowering water table level (Reynolds et al., 1999). According to a study on deciduous shrubs and Artemisia subshrubs, shrubs can handle a wider range of moisture stress in soil and air than other plants (Gao et al., 2013) including grass (Kemp et al., 1997; Reynolds et al., 2006). Stomatal conductance of shrubs from a global model had a maximum of 0.83 mol H2O m−2 s−1 when soil water potential was set to field capacity (ψ = −0.033 MPa). Only when soil moisture is abundant do grasses have higher stomatal conductance than shrubs. One type of wetland sedge, Carex paleacea, has a small stomatal conductance compared to other wetland species and is lowest during high evaporative demand (Lafleur, 1990b).
Higher LE at the sheltered fen during most of the growing season does not support the idea that sedges in the valley had lower stomatal conductance than shrubs at the open fen. Yet, the prominence of shrubs at the open fen suits the higher evaporative demand at that location. Average growing season VPD was higher at the open fen (4.54) than the sheltered fen (3.20), meaning that there was less humidity in the air and more evaporative demand on vegetation.
Sources of Uncertainty
Some environmental effects make it difficult to attribute notable differences in fluxes to specific conditions at the sheltered fen vs. open fen. Non-normal distribution of daily mean NEE at the open fen implies there is a confounding or external factor influencing fluxes (Figure 9). Stream flow and water table level are two such conditions. Recent studies have analyzed how net ecosystem C balance of wetlands may change due to lateral export via streams or open water (D'Acunha et al., 2019). During growing season, dissolved organic C flux represented 5% of the eddy covariance-based estimate of C uptake (4.6 ± 1.5 g C m−2 per season) at Burns bog in Canada. Dissolved organic C flux was more important in November and March as a result of lower rainfall and higher ET. The amount of C leaving the sheltered vs. open fen may change according to stream flow rates and percent open water, impacted by the water table level, throughout the year. Stream CO2 concentration was not recorded at either location during the time of study and thus was not included in the analysis.
Differences in NEE between sites bring about the question of differing water table levels. Water table level measurements exist for the open fen (US-Los) but not for the sheltered fen (US-ALQ). A previous study at the open fen proved that higher water table level caused lower ecosystem respiration and lower GPP, resulting in no net changes in NEE. Thus, NEE was not governed by water table level (Sulman et al., 2009). A more recent study at the open fen supported the hypothesis that mean summer net ecosystem production was not correlated with discharge, but ecosystem respiration and gross primary production were significantly correlated with annual maximum monthly-average discharge (Pugh et al., 2017). Given that the largest difference in variance of half-hourly NEE between sites occurred at nighttime (6.35 at open fen, compared to 45.71 at sheltered), the discrepancy was more likely a result of very low WS (Figures 5C,D) rather than fluctuations in water table level.
One study that took place in boreal peatlands found that natural open mires had more consistent summertime Bowen ratios than tree-covered and agricultural peatlands (Alekseychik et al., 2018). The results of our study did not display this trend, as variance of daily average Bowen ratio from June to August was actually larger at the open fen (0.10) than the sheltered fen (0.03). Additionally, Bowen ratio at one of the tree-covered peatlands in Alekseychik et al. (2018) appeared to have a stronger correlation with precipitation pattern than with water table. As mentioned previously, water table level was not recorded at both fens and so was not included in data analysis.
A short-term study on evaporation from sedge-dominated wetland surfaces in Canada looked at one fen on a dry, low ridge with ample soil moisture and another in a depression where soil was covered with standing water. Dead vegetation covered the surface of the dry site and hindered evaporation prior to leaf-out in June (Lafleur, 1990b). LE was only dominant shortly after rain events, after which dead vegetation would dry out and LE and H would equilibrate again. Differences in ET rates between the two sites became less evident after vegetation was established. The results of our study were comparable to these, as daily average Bowen ratios showed no significant differences between sites starting in June, with an exception in August.
Another source of uncertainty was the use of open fen Rg to gap-fill sheltered fen fluxes. While it is likely a good assumption most of the day, differences due to sheltering may magnify at sunrise and sunset due to direct beam Rg in proportion to diffuse Rg. Radiation regimes may also vary internally within sites due to canopy height and resulting albedo, and potentially longwave radiation balance (Goodin et al., 1996).
Implications for Wetland Restoration
Wetland restoration has been suggested as an ecosystem management tool to enhance the terrestrial C sink for climate change mitigation (Bridgham et al., 2006). Not only do vascular plants assimilate CO2 via photosynthesis, but also they help sequester C in wetland peat. Our work shows forested wetlands have stronger C sinks throughout the entire growing season due to lower nighttime NEE. Forested wetlands also produce lower H and higher LE that would make them ideal for lowering surface temperatures and promoting ET. Monthly average air temperatures were also lower at the sheltered fen (Table 3).
One implication of similar daytime half-hourly NEE between fens is that while areally-averaged C uptake rates in shrub wetlands in our study region can primarily be predicted by vegetation type and age, wind-sheltering driven changes in energy balance may influence the over-all water balance depending on controls on local water table. Depending on restoration goals, this effect may also need to be considered for C and water management.
Removal of natural vegetation can cause large reductions in evaporative source for surrounding areas. This was the case in a study that modeled the effects of land cover change in the world's productive agricultural regions (Bagley et al., 2012). Terrestrial evaporation from land cover to the south of growing regions in the Midwestern US was found to provide moisture for maize. Other studies had similar findings contributing moisture in the US to the Great Plains low-level jet (Schuber and Helfand, 1999). Altering land surface cover in the southern US would prevent surface absorption and re-transpiration of moisture transported by fast-moving winds. Especially during dry years, there is an increased reliance on regional moisture sources for precipitation as opposed to other sources such as onshore moisture flow from the ocean (Bagley et al., 2014). These studies show that ecosystem services offered by wetlands such as ET, lower surface temperatures, and moisture can be transferred throughout a region by fast-moving winds and are not strictly limited to nearby areas.
Several studies have been motivated by the issue of upscaling of land cover with high heterogeneity (Desai et al., 2007; Xiao et al., 2011; Aurela et al., 2015). Despite variations in land cover classification, there were similarities in half-hourly NEE during daytime between fens (Figure 7) as well as some coherence on the weekly scale and the summer overall (Figure 8). Thus, our study supports that upscaling NEE in order to understand fluxes from wetlands can involve simpler calculations that may not require detailed information about wetland vegetation specific species type.
A recent study on net radiation partitioning in wetlands revealed that wetlands with tall, emergent canopy structures had values of canopy aerodynamic conductance to heat exchange that were nearly twice that of a drained peatland used for growing alfalfa, all located in the Sacramento-San Joaquin Delta of California (Hemes et al., 2018). The short, smooth canopy of alfafa caused lower canopy aerodynamic conductance to heat exchange and consequently, a lower amount of turbulent fluxes that would otherwise transfer LE and H into the atmosphere. Water availability was also listed as an important factor in the relative partitioning of heat. Wetlands with open water and rough surfaces store more energy in the daytime, experience lower H during the day and more LE at night because of stronger aerodynamic and surface conductance. Younger wetlands are also able to store much more excess radiation during the daytime than older wetlands or agricultural plots inside their water column. Regardless of wetland age, all wetlands in the study cooled the surface more than the plot of alfalfa during peak growing season.
Bulk surface resistance is a composite variable that represents leaf water potential, temperature, VPD, and solar irradiance that can also impact net radiation partitioning. Wetlands can be prevented from reaching the potential rate of ET when increased atmospheric demand (VPD) favors net radiation partitioning into LE in the presence of increased bulk surface resistance (Liljedahl et al., 2011). The differences in net radiation partitioning were likely due to lower aerodynamic conductance for heat transfer and canopy boundary layer conductance for CO2 transfer at the sheltered fen (0.024 and 0.038 ms−1, vs. 0.028 and 0.052 for open fen).
One might expect that H was lower at the sheltered fen (US-ALQ) as a result of lower momentum transport. Although there was lower momentum transport at the sheltered fen, noticeably lower air temperatures throughout most of the growing season indicated that a lack of higher wind speeds was not the only cause of low H (Table 3). The sheltered fen also showed lower VPD during the growing season, except for in August when VPD was the same at both sites. This information lends to the idea that the presence of trees impacts wetland atmospheric fluxes in more than one way.
Conclusion
Comparing eddy covariance flux tower data from two co-located fens in northern WI revealed that landscape sheltering can impact mean wind speed, wind direction, energy balance, and nighttime NEE, but does not significantly affect daytime NEE. A sheltered fen had lower H in spring and late fall (Tables 1, 2), as well as higher LE in every month of the growing season except July compared to an open fen located only 29 km away. There were significant differences in net radiation partitioning between sites in April, May, and August according to daily average Bowen ratio. Mean nighttime wind speed was also three times less than that of the open fen (0.56 vs. 2.07 ms−1). There were clear differences in wind direction due to the canopy at the sheltered fen (Figure 3A), but no significant difference in half-hourly NEE during daytime or Q10 air temperature sensitivity of NEE (Figures 7, 10). However, the sheltered fen showed a much weaker linear correlation between nighttime NEE and air temperature than the open fen (R: 0.08 vs. 0.57), due to higher variance of nighttime NEE.
Consistent, high quality flux measurements from the sheltered fen during the non-growing season and less gaps in growing season data would allow a comparison of yearly C accumulation between the two sites. Stream CO2 data, knowledge about the aquatic chemistry of Allequash Creek and Lost Creek, and a record of percent open water at each site throughout the year could contribute to an analysis of lateral fluxes out of the fens. Stomatal conductance measurements could also determine vegetation responses to landscape sheltering. High precision measurements of water table level and precipitation could also build a more complete picture of factors that impact energy balance.
The results of this study, in combination with prior studies on the cooling effect of vegetation (Armson et al., 2012; Hemes et al., 2018), imply that sheltered fens are of high importance for protection and restoration due to their ecosystem services of lower CO2 source at nighttime and in the fall, stronger growing season CO2 sink, and higher surface cooling. Shorter spring and fall seasons may also lead to higher H and LE during growing season as the effects of sheltering during spring and late summer disappear. We recognize that some similarities, such as coherence on the scale of summer overall (Figure 8), are undoubtedly caused by the proximity of the fens in our study, and the general nature of fens compared to other wetland types. There is a need for further research on wetland canopy sheltering in other regions before these results can be interpreted more broadly.
Data Availability Statement
The datasets analyzed for this study can be found on the Ameriflux website. Data for US-ALQ here: [http://dx.doi.org/10.17190/AMF/1480323]. Data for US-Los here: [http://dx.doi.org/10.17190/AMF/1246071].
Disclosure
Any use of trade, firm, or product names is for descriptive purposes only and does not imply endorsement by the U.S. Government.
Author Contributions
JTu (lead author) performed data analysis and quality control and wrote the manuscript draft. JTh (co-author) and BO aided in data collection and analysis. KW and AD provided review, editing, and final approving on the manuscript.
Funding
Funding for instrumentation at US-ALQ was supplied by United States Geological Survey Water, Energy, and Biogeochemical Budgets Program. Funding for instrumentation at US-Los was sponsored by the U.S. Department of Energy Office of Biological and Environmental Research through National Institute for Climatic Change Research, Midwestern Region Subagreement 050516Z19.
Conflict of Interest
The authors declare that the research was conducted in the absence of any commercial or financial relationships that could be construed as a potential conflict of interest.
Acknowledgments
We acknowledge support from the NSF North Temperate Lakes LTER program (NSF DEB-1440297, NTL LTER), United States Geological Survey (Water, Energy, and Biogeochemical Budgets Program; LandCarbon Program; Water Mission Area), and the Department of Energy Ameriflux Network Management Program. We would also like to thank our reviewers for their valuable feedback on our study.
References
Alekseychik, P., Mammarella, I., Lindroth, A., Lohila, A., Aurela, M., Laurila, T., et al. (2018). Surface energy exchange in pristine and managed boreal peatlands. Mires Peat 21, 1–26. doi: 10.19189/MaP.2018.OMB.333
Anderson, M., and Lowry, C. (2007). Transient Functioning of a Groundwater Wetland Complex, Allequash Basin, Wisconsin. Available online at: www.wri.wisc.edu/wp-content/uploads/FinalWR05R007.pdf
Armson, D., Stringer, P., and Ennos, A. R. (2012). The effect of tree shade and grass on surface and globe temperatures in an urban area. Urban Forest. Urban Green. 11, 245–255. doi: 10.1016/j.ufug.2012.05.002
Aurela, M., Lohila, A., Tuovinen, J.-P., Hatakka, J., Penttilä, T., and Laurila, T. (2015). Carbon dioxide and energy flux measurements in four northern-boreal ecosystems at Pallas. Boreal Environ. Res. 20, 455–473. Available online at: http://www.borenv.net/
Bagley, J. E., Desai, A. R., Dirmeyer, P. A., and Foley, J. A. (2012). Effects of land cover change on moisture availability and potential crop yield in the world's breadbaskets. Environ. Res. Lett. 7:014009. doi: 10.1088/1748-9326/7/1/014009
Bagley, J. E., Desai, A. R., Harding, K. J., Snyder, P. K., and Foley, J. A. (2014). Drought and deforestation: has land cover change influenced recent precipitation extremes in the Amazon? J. Climate 27, 345–361. doi: 10.1175/JCLI-D-12-00369.1
Bernal, B., and Mitsch, W. J. (2012). Comparing carbon sequestration in temperate freshwater wetland communities. Glob Change Biol. 18, 1636–1647. doi: 10.1111/j.1365-2486.2011.02619.x
Billett, M. F., Charman, D. J., Clark, J. M., Evans, C. D., Evans, M. G., John Ostle, N., et al. (2010). Carbon balance of UK peatlands: current state of knowledge and future research challenges. Clim. Res. 45:13–29. doi: 10.3354/cr00903
Bridgham, S. D., Megonigal, J. P., Keller, J. K., Bliss, N. B., and Trettin, C. (2006). The carbon balance of North American wetlands. Wetlands 26, 889–916. doi: 10.1672/0277-5212(2006)26[889:TCBONA]2.0.CO;2
Brown, S. M., Petrone, R. M., Mendoza, C., and Devito, K. J. (2010). Surface vegetation controls on evapotranspiration from a sub-humid Western Boreal Plain wetland. Hydrol. Process. 24, 1072–1085. doi: 10.1002/hyp.7569
Chimner, R. A., and Cooper, D. J. (2003). Influence of water table levels on CO2 emissions in a Colorado subalpine fen: an in situ microcosm study. Soil Biol. Biochem. 35, 345–351. doi: 10.1016/S0038-0717(02)00284-5
Coffer, M. M., and Hestir, E. L. (2019). Variability in trends and indicators of CO2 exchange across arctic wetlands. J. Geophys. Res. Biogeosci. 124, 1248–1264. doi: 10.1029/2018JG004775
Crundwell, M. E. (1986). A review of hydrophyte evapotranspiration. Rev. Hydrobiol. Trop. 19, 215–232.
D'Acunha, B., Morillas, L., Black, A. T., Christen, A., and Johnson, M. S. (2019). Net ecosystem carbon balance of a peat bog undergoing restoration: integrating CO2 and CH4 fluxes from eddy covariance and aquatic evasion with DOC drainage fluxes. J. Geophys. Res. Biogeosci. 124, 884–901. doi: 10.1029/2019JG005123
Desai, A. R. (2014). Influence and predictive capacity of climate anomalies on daily to decadal extremes in canopy photosynthesis. Photosynth. Res. 119, 31–47. doi: 10.1007/s11120-013-9925-z
Desai, A. R., Moorcroft, P. R., Bolstad, P. V., and Davis, K. J. (2007). Regional carbon fluxes from an observationally constrained dynamic ecosystem model: impacts of disturbance, CO2 fertilization, and heterogeneous land cover. J. Geophys. Res. 112:G01017. doi: 10.1029/2006JG000264
Drewer, J., Lohila, A., Aurela, M., Laurila, T., Minkkinen, K., Penttilä, T., et al. (2010). Comparison of greenhouse gas fluxes and nitrogen budgets from an ombotrophic bog in Scotland and a minerotrophic sedge fen in Finland. Eur. J. Soil Sci. 61:640–650. doi: 10.1111/j.1365-2389.2010.01267.x
Drexler, J. Z., Snyder, R. L., Spano, D., and Paw U, K. T. (2004). A review of models and micrometeorological methods used to estimate wetland evapotranspiration. Hydrol. Process. 18, 2071–2101. doi: 10.1002/hyp.1462
Foken, T., Gockede, M., Mauder, M., Mahrt, L., Amiro, B. D., and Munger, J. W. (2004). “Post-field quality control,” in Handbook of Micrometeorology: A Guide for Surface Flux Measurements, eds X. Lee, W. Massman, and B. Law (Dordrecht: Kluwer Academic, 81–108.
Foken, T., and Wichura, B. (1996). Tools for quality assessment of surface-based flux measurements. Agric. Forest Meteorol. 78, 83–105. doi: 10.1016/0168-1923(95)02248-1
Frank, A. B., and Dugas, W. A. (2001). Carbon dioxide fluxes over a northern, semiarid, mixed-grass prairie. Agric. Forest Meteorol. 108, 317–326. doi: 10.1016/S0168-1923(01)00238-6
Gao, Q., Yu, M., and Zhou, C. (2013). Detecting the differences in responses of stomatal conductance to moisture stresses between deciduous shrubs and artemisia subshrubs. PLoS ONE 8:e84200. doi: 10.1371/journal.pone.0084200
Göckede, M., Foken, T., Aubinet, M., Aurela, M., Banza, J., Bernhofer, C., et al. (2008). Quality control of CarboEurope flux data - part 1: coupling footprint analyses with flux data quality assessment to evaluate sites in forest ecosystems. Biogeosciences 5, 433–450. doi: 10.5194/bg-5-433-2008
Goodin, D. G., Peake, J. S., and Barmann, J. A. (1996). Analysis and modeling of the radiation budget and net radiation of a Sandhills wetland. Wetlands 16, 66–74. doi: 10.1007/BF03160646
Google earth V 7.3.2.5776 (2016a). US-ALQ, Wisconsin. 46° 1′50.73″N, 89°36′24.23″W, Eye alt 3000 Feet. Maxar Technologies, USDA Farm Service Agency 2019. Available online at: https://www.google.com/earth/ (accessed August 18, 2019).
Google earth V 7.3.2.5776 (2016b). US-Los, Wisconsin. 46° 4′57.85″N, 89°58′42.83″W, Eye alt 14000 Feet. Maxar Technologies, USDA Farm Service Agency 2019. Available online at: https://www.google.com/earth/ (accessed August 18, 2019).
Gorham, E. (1991). Northern Peatlands: role in the carbon cycle and probable responses to climatic warming. Ecol. Appl. 1, 182–195. doi: 10.2307/1941811
Hemes, K. S., Eichelmann, E., Chamberlain, S. D., Knox, S. H., Oikawa, P. Y., Sturtevant, C. S., et al. (2018). A unique combination of aerodynamic and surface properties contribute to surface cooling in restored wetlands of the Sacramento-San Joaquin Delta, California. J. Geophys. Res. Biogeosci. 123, 2072–2090. doi: 10.1029/2018JG004494
Kemp, P. R., Reynolds, J. F., Pachepsky, Y., and Chen, J-L. (1997). A comparative modelling study of soil water dynamics in a desert ecosystem. Water Resour. Res. 33, 73–90. doi: 10.1029/96WR03015
Kratz, T. K., Soranno, P. A., Baines, S. B., Benson, B. J., Magnuson, J. J., et al. (1998). Interannual synchronous dynamics in north temperate lakes in Wisconsin, USA. Manage. Lakes Reserv. During Glob. Clim. Change 42, 273–287. doi: 10.1007/978-94-011-4966-2_19
Lafleur, P. (1990a). Evaporation from wetlands. Can. Geographer Géographe Can. 3, 79–82. doi: 10.1111/j.1541-0064.1990.tb01072.x
Lafleur, P. M. (1990b). Evapotranspiration from sedge-dominated wetland surfaces. Aquatic Bot. 27, 341–353. doi: 10.1016/0304-3770(90)90020-L
Lafleur, P. M., McCaughey, J. H., Joiner, D. W., Bartlett, P. A., and Jelinski, D. E. (1997). Seasonal trends in energy, water, and carbon dioxide fluxes at a northern boreal wetland. J. Geophys. Res. 102, 29009–29020. doi: 10.1029/96JD03326
Lafleur, P. M., and Rouse, W. R. (1988). The influence of surface cover and climate on energy partitioning and evaporation in a subarctic wetland. Bound. Layer Meteorol. 44, 327–347. doi: 10.1007/BF00123020
Lasslop, G., Reichstein, M., Papale, D., Richardson, A., Arneth, A., Barr, A., et al. (2010). Separation of net ecosystem exchange into assimilation and respiration using a light response curve approach: critical issues and global evaluation. Glob. Change Biol. 16, 187–208. doi: 10.1111/j.1365-2486.2009.02041.x
Lenters, J. D., Cutrell, G. J., Irmak, A., Eisenhauer, D. E., Instanbulluoglu, E., Scott, D., et al. (2011). Seasonal energy and water balance of a Phragmites australis-dominated wetland in the Republican River basin of south-central Nebraska. J. Hydrol. 408, 19–43. doi: 10.1016/j.jhydrol.2011.07.010
Liljedahl, A. K., Hinzman, L. D., Harazono, Y., Zona, D., Tweedie, C. E., Hollister, R., et al. (2011). Nonlinear controls on evapotranspiration in arctic coastal wetlands. Biogeosciences 8, 3375–3389. doi: 10.5194/bg-8-3375-2011
Lin, B. B. (2010). The role of agroforestry in reducing water loss through soil evaporation and crop transpiration in coffee agroecosystems. Agric. Forest Meteorol. 150, 510–518. doi: 10.1016/j.agrformet.2009.11.010
Lund, M., Lafleur, P. M., Roulet, N., Lindroth, A., Christensen, T. R., Aurela, M., et al. (2010). Variability in exchange of CO2 across 12 northern peatland and tundra sites. Glob. Change Biol. 16, 2436–2448. doi: 10.1111/j.1365-2486.2009.02104.x
Markfort, C. D., Perez, A. L. S., Thill, J. W., Jaster, D. A., Porté-Agel, F., and Stefan, H. G. (2010). Wind sheltering of a lake by a tree canopy or bluff topography. Water Resour. Res. 46:W03530. doi: 10.1029/2009WR007759
Mohamed, Y. A., Bastiaanssen, W. G. M., Savenije, H. H. G, Van den Hurk, B. J. J. M, and Finlayson, C. M. (2012). Wetland versus open water evaporation: an analysis and literature review. Phys. Chem. Earth 47–48, 144–121. doi: 10.1016/j.pce.2011.08.005
Poindexter, C. M., and Variano, E. A. (2013). Gas exchange in wetlands with emergent vegetation: The effects of wind and thermal convection at the air-water interface. J. Geophys. Res. Biogeosci. 118, 1297–1306. doi: 10.1002/jgrg.20099
Pugh, C. A., Reed, D. E., Desai, A. R., and Sulman, B. N. (2017). Wetland flux controls: how does interacting water table levels and temperature influence carbon dioxide and methane fluxes in northern Wisconsin? Biogeochemistry 137, 15–25. doi: 10.1007/s10533-017-0414-x
Raczka, B. M., Davis, K. J., Huntzinger, D., Neilson, R. P., Poulter, B., Richardson, A. D., et al. (2013). Evaluation of continental carbon cycle simulations with North American flux tower observations. Ecol. Monogr. 83, 531–556. doi: 10.1890/12-0893.1
Reichstein, M., Falge, E., Baldocchi, D., Papale, D., Aubinet, M., Berbigier, P., et al. (2005). On the separation of net ecosystem exchange into assimilation and ecosystem respiration: review and improved algorithm. Glob. Change Biol. 11, 1424–1439. doi: 10.1111/j.1365-2486.2005.001002.x
Reynolds, J. F., Kemp, P. R., Ogle, K., Fernandez, R. J., Gao, O., and Wu, J. (2006). “Modeling the unique attributes of arid ecosystems: Potentials and limitations based on lessons from the Jornada Basin,” in Structure and Function of Chihuahuan Desert Ecosystem, The Jornada Basin Long-Term Ecological Research Site, eds K. Havstad, L. F. Huenneke, and W. H. Schlesinger (New York, NY: Oxford University Press, 321–353.
Reynolds, J. F., Virginia, R. A., Kemp, P. R., de Soyza, A. G., and Tremmel, D. C. (1999). Impact of drought on desert shrubs: effects of seasonality and degree of resource island development. Ecol. Monogr. 69, 69–106. doi: 10.1890/0012-9615(1999)069[0069:IODODS]2.0.CO;2
Richardson, A. D., Hollinger, D. Y., Burba, G. G., Davis, K. J., Flanagan, L. B., Katul, G. G., et al. (2006). A multi-site analysis of random error in tower-based measurements of carbon and energy fluxes. Agric. Forest Meteorol. 136, 1–18. doi: 10.1016/j.agrformet.2006.01.007
Rouse, W. R., Carlson, D. W., and Weick, E. J. (1992). Impacts of summer warming on the energy and water balance of wetland tundra. Clim. Change 22, 305–326. doi: 10.1007/BF00142431
Schmid, H. P. (2002). Footprint modeling for vegetation atmosphere exchange studies: a review and perspective. Agric. Forest Meteorol. 113, 159–183. doi: 10.1016/S0168-1923(02)00107-7
Schuber, M., and Helfand, S. (1999). Climatology of the simulated great plains low-level jet and its contribution to the continental moisture budget of the United States. J. Clim. 8:784. doi: 10.1175/1520-0442(1995)008<0784:COTSGP>2.0.CO;2
Siedlecki, M., Pawlak, W., Fortuniak, K., and Zielinski, M. (2016). Wetland evapotranspiration: Eddy covariance measurement in the Biebrza Valley, Poland. Wetlands 36, 1055–1067. doi: 10.1007/s13157-016-0821-0
Sonnentag, O., Van Der Kamp, G., Barr, A. G., and Chen, J. M. (2010). On the relationship between water table depth and water vapor and carbon dioxide fluxes in a minerotrophic fen. Glob. Change Biol. 16, 1762–1776. doi: 10.1111/j.1365-2486.2009.02032.x
Sulman, B. N., Desai, A., Cook, B. D., Saliendra, N. Z., and Mackay, D. S. (2009). Contrasting carbon dioxide fluxes between a drying shrub wetland in northern Wisconsin, USA, and nearby forests. Biogeosciences 6, 1115–1126. doi: 10.5194/bg-6-1115-2009
Sulman, B. N., Desai, A. R., Saliendra, N. Z., Lafleur, P. M., Flanagan, L. B., Sonnentag, O., et al. (2010). CO2 fluxes at northern fens and bogs have opposite responses to inter-annual fluctuations in water table. Geophys. Res. Lett. 37:L19702. doi: 10.1029/2010GL044018
Turetsky, M. R., Kotowska, A., Bubier, J., Dise, N. B., Crill, P., Hornibrook, E., et al. (2014). A synthesis of methane emissions from 71 northern, temperate, and subtropical wetlands. Glob. Change Biol. 20, 2183–2197. doi: 10.1111/gcb.12580
Wilcox, D. A. (2004). Implications of hydrologic variability on the succession of plants in Great Lakes wetlands. Aquatic Ecosyst. Health Manage. 7, 223–231. doi: 10.1080/14634980490461579
Wisconsin Department of Natural Resources. (1992). Wisconsin Wetland Inventory Classification Guide. Retrieved from https://dnr.wi.gov/topic/wetlands/documents/WWI_Classification.pdf
Wisconsin Department of Natural Resources. (2017a). Surface Water Data Viewer. Available online at: https://dnr.wi.gov/topic/surfacewater/swdv/ (accessed June 7, 2019).
Wisconsin Department of Natural Resources. (2017b). Wetland Types. Available online at: https://dnr.wi.gov/topic/wetlands/types.html (accessed June 7, 2019).
Wutzler, T., Lucas-Moffat, A., Migliavacca, M., Knauer, J., Sickel, K., Šigut, L., et al. (2018). Basic and extensible post-processing of eddy covariance flux data with REddyProc. Biogeosciences 15, 5015–5030. doi: 10.5194/bg-15-5015-2018
Xiao, J., Davis, K. J., Urban, N. M., Keller, K., and Saliendra, N. Z. (2011). Upscaling carbon fluxes from towers to the regional scale: Influence of parameter variability and land cover representation on regional flux estimates. J. Geophys. Res. 116:G00J06. doi: 10.1029/2010JG001568
Keywords: fens, fluxes, carbon, wind, wetlands
Citation: Turner J, Desai AR, Thom J, Wickland KP and Olson B (2019) Wind Sheltering Impacts on Land-Atmosphere Fluxes Over Fens. Front. Environ. Sci. 7:179. doi: 10.3389/fenvs.2019.00179
Received: 20 June 2019; Accepted: 25 October 2019;
Published: 13 November 2019.
Edited by:
Bernd Lennartz, University of Rostock, GermanyReviewed by:
James McLaughin, Ontario Ministry of Natural Resources, CanadaBaoli Wang, Tianjin University, China
Copyright © 2019 Turner, Desai, Thom, Wickland and Olson. This is an open-access article distributed under the terms of the Creative Commons Attribution License (CC BY). The use, distribution or reproduction in other forums is permitted, provided the original author(s) and the copyright owner(s) are credited and that the original publication in this journal is cited, in accordance with accepted academic practice. No use, distribution or reproduction is permitted which does not comply with these terms.
*Correspondence: Jessica Turner, amx0dXJuZXI0QHdpc2MuZWR1