 Lindsey McEwen
 Kimberly Bryan1
 Muhammad Afzal
- 1Centre for Water, Communities and Resilience, University of the West of England, Bristol, United Kingdom
- 2Geography and Environmental Science, University of Dundee, Dundee, United Kingdom
- 3UK Centre for Ecology & Hydrology, Wallingford, United Kingdom
Drought in the United Kingdom is a “hidden” pervasive risk, defined and perceived in different ways by diverse stakeholders and sectors. Scientists and water managers distinguish meteorological, agricultural, hydrological, and socio-economic drought. Historically triggers in drought risk management have been demarcated solely in specialist hydrological science terms using indices and critical thresholds. This paper explores “drought thresholds” as a bridging concept for interdisciplinary science-narrative enquiry. The Eden catchment, Scotland acts as an exemplar, in a maritime country perceived as wet. The research forms part of creative experimentation in science-narrative methods played out in seven United Kingdom case-study catchments on hydro-meteorological gradients in the Drought Risk and You (DRY) project, with the agricultural Eden the most northerly. DRY explored how science and stories might be brought together to support better decision-making in United Kingdom drought risk management. This involved comparing specialist catchment-scale modelling of drought risk with evidence gathered from local narratives of drought perceptions/experiences. We develop the concept of thresholds to include perceptual triggers of drought awareness and impact within and between various sectors in the catchment (agriculture, business, health and wellbeing, public/communities, and natural and built environments). This process involved developing a framework for science-narrative drought “threshold thinking” that utilizes consideration of severity and scale, spatial and temporal aspects, framing in terms of enhancing or reducing factors internal and external to the catchment and new graphical methods. The paper discusses how this extended sense of thresholds might contribute to research and practice, involving different ways of linking drought severity and perception. This has potential to improve assessment of sectoral vulnerabilities, development of adaptive strategies of different stakeholders, and more tailored drought communication and messaging. Our findings indicate that drought risk presents many complexities within the catchment, given its cross-sectoral nature, rich sources of available water, variable prior drought experience among stakeholders, and different quantitative and perceptual impact thresholds across and within sectors. Fuzziness in identification of drought thresholds was multi-faceted for varied reasons. Results suggest that a management paradigm that integrates both traditional and non-traditional “fuzzy” threshold concepts across sectors should be integrated into current and future policy frameworks for drought risk management.
Introduction
Drought is a pervasive, diffuse, slow onset and hidden risk in the Anthropocene (Van Loon, 2016), presenting specific management challenges in different national contexts. In contrast, water scarcity – or lack of fresh water resources to meet standard or required water demand – can occur due to physical (drought), institutional and/or infrastructural reasons. Drought and water scarcity have distinct connotations, however, political concerns can also determine whether “drought” or “water scarcity” is used in the language of some statutory bodies. For example, the Water Resources (Scotland) Act (2013) makes no mention of drought but instead sets out arrangements for water shortage orders.
Traditional Western evidence bases, drawn on to support environmental and hydro-meteorological decision-making for climate resilience, have tended to prioritize specialist science (Mazzocchi, 2006; Nakashima, 2016). This applies in the evidence used in statutory drought risk management with its focus on the science and statistics of rainfall, soil moisture, river flows, groundwater levels and water supply systems. There is an accompanying drive both to monitor current conditions and prepare for future scenarios through drought risk modeling (e.g., in the United Kingdom—Scottish Environment Protection Agency (hereafter SEPA), 2015; Environment Agency, 2017). Specialist academic science prioritizes research into the relative merits of various drought indices (e.g., Standardized Precipitation Index (SPI); Reconnaissance Drought Index (RDI); see, for example, Zargar et al., 2011 for a review). Its focus is on the identification of index-based drought severity thresholds as trigger points for operational needs at a particular point or spatial scale. However, academic and operational methods of threshold characterization can differ. Water supply companies use threshold values in operationally-focused variables such as “supply days” in reservoir stocks while environmental regulators, concerned with maintaining river flows, use thresholds in deviations from the norm in 30, 90 and 180 days rainfall and river flow data (Scottish Environmental Protection Agency, 2020).
In establishing such thresholds, a nexus of different uncertainties exists, including length and quality of data-series (Link et al., 2020), and threshold selection relative to local impacts (e.g., critical precipitation levels for tree die-off, Clifford et al., 2013; oxygen depletion in rivers and the risk of fish-kill, Scottish Environmental Protection Agency, 2020). Alongside this, drought itself is a nebulous concept with its emergent impacts, developing over space and time, defined in different ways within a hydrological process cascade. For example, the Nebraska Drought Center’s typology (Wilhite and Glantz, 1985) differentiates meteorological drought (rainfall deficit); agricultural drought (soil moisture drought), hydrological drought (rivers and water bodies), and socio-economic (water supply and use) drought (see definitions in Table 1). Scale is important; drought can be regional and in extreme cases, national and transnational. This contrasts with a frequently more spatially limited local or regional hazard such as floods, which are visible and bounded, for example, by a river floodplain or a zone within a pluvial flood event. Drought, as it plays out, is complex and hidden, with varying duration, intensity and spatial extent. For example, drought during a very hot dry summer contrasts with several years of below-average winter rainfall, with complex relationships, feedback loops and trade-offs.
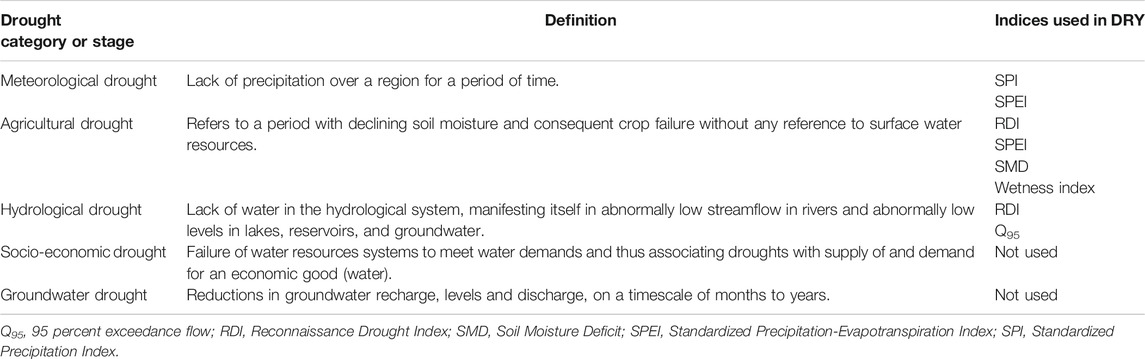
TABLE 1. Drought definitions and indices adopted for science-narrative engagement work in DRY (adapted from Mishra and Singh, 2010).
Drought is also a social and cultural construct (Taylor et al., 2009). This makes drought risk management a challenging arena normally controlled by statutory agencies with limited concern for social interaction (Bryan et al., 2019). In the United Kingdom, recent droughts have not escalated to full socio-economic droughts, which means that only those publics whose activities are directly affected by prolonged dry periods have been aware of these different (early) drought stages (e.g., gardeners, farmers, anglers, recreational water users). For many people, “the hosepipe ban” [“Temporary Use Ban” (TUB) in current terminology; e.g., Gavin et al., 2014] is generally the most significant, formally declared, consequence of United Kingdom droughts (Bell, 2009), and is a key focus of the water saving measures listed as Appendix 2 to the Water Resources (Scotland) Act 2013.
The public’s role in determining water allocations is limited. Water resources interests are generally represented by water utilities, hydro operators and irrigators, as well as distilleries, quarry operators, and paper works. These practices are generally informed by quantitative characterization of water availability and demand, where the concept of thresholds is critical to the possible exercise of abstraction restrictions by a regulator. However, ensuring meaningful public participation in water resources planning is a growing concern in international research and practice, with all the challenges this brings including power and language issues (e.g., Cook et al., 2013). For example, public participation, as a contribution to River Basin Management Planning process, is required under Article 14 of the EU Water Framework Directive (2000/60/EC), applying to all European catchment areas. Researchers are already exploring issues and opportunities in how lay and specialist scientific knowledge come together in drought risk decision-making in specific national contexts (e.g., Dagel, 1997 with drought severity indices and perception in marginal settings). This includes, more recently, Solano-Hernandez et al. (2020) on convergence between satellite information and farmers’ drought perception in the Patagonian rangelands of Argentina; and Nguyen and Nguyen (2020), comparing potential biases in measured extreme weather data with those in self-reported weather shocks from rural households in Vietnam. This poses questions about how different publics and other stakeholders in the temperate maritime United Kingdom perceive more hidden drought and its different thresholds, with the implications for their action to increase resilience. This concern for identifying “thresholds,” as a bridging concept for interdisciplinary exploration within our research, provides valuable potential for science to learn from narrative approaches and meaning making (drawing on life experiences, oral histories, stories, diaries etc.), and for narrative to learn from science.
Aims
Using an interdisciplinary approach that involved co-working between natural and social sciences, and arts and humanities, this paper investigates interactions between different types of knowledge (specialist science; local knowledge) in determining meaningful drought indices and thresholds in a maritime country perceived as wet. It takes as its case-study the agricultural catchment of the River Eden in Fife, east-central Scotland, United Kingdom. The paper asks how looking at drought from both scientific and narrative perspectives adds to fuller and deeper understanding than could be achieved by either in isolation. It aims:
1. To explore the concept of “drought thresholds” from scientific and narrative perspectives and their comparison, in the context of spatial and temporal variations in drought in the catchment.
2. To evaluate the perceived thresholds for drought impacts by different stakeholders across sectors and their connection, and how this maps against scientific indices and thresholds.
3. To explore the potential for a framework for science-narrative drought “threshold thinking,” as a way of bridging different types of drought knowledge.
4. To reflect critically on how this focus on “threshold thinking” might inform the policy and practice of public/community involvement in local drought risk management, including communication and messaging about drought risk.
The Fife Eden catchment, Scotland was chosen as one of seven case-study catchments across different gradients (hydrological, socio-cultural) in the United Kingdom within the Drought Risk and You (Drought Risk and You; hereafter “DRY”) project1. This selection was because of its long hydrometric record and low rainfall in a United Kingdom context, providing contrast with other dry catchments in eastern England (Blake and Ragab, 2014) and in terms of governance. Governance of water resource planning for public water supply in Scotland is the statutory responsibility of a publicly owned utility, Scottish Water, unlike in England where water services are provided by privatized utility companies.
Background Contexts
Here we briefly appraise the theme of “thresholds” within the research literature from hydrological science and social science perspectives.
Drought Indices and Thresholds: Science Perspectives
Indices and thresholds are commonly used tools within the earth and environmental sciences (e.g., in hydrological, ecological and landscape change; e.g., Sivakumar, 2005; Kelly, 2015). Such indices attempt to quantify a particular system variable of interest, often over a specified time window, while thresholds are particular points or levels in system response, beyond which the system enters an alternative mode of response. If the change in system mode of response is irreversible, the threshold can be considered a “tipping point.” Many drought indices exist that could potentially be used to identify different kinds of drought severities that might affect different sectors and particular groups of stakeholders, and be compared with their drought perception. However, it is recommended that stakeholders consult more than one index in order to form a well-founded assessment of conditions, given varying responses of individual indices and varying data requirements that may be an issue in real-time assessments (Morid et al., 2006). Among the available indices are the Standardized Precipitation Index (SPI; Paulo and Pereira, 2006), the Normalized Precipitation Index (NPI), and the Normalized Flow Index (NFI) (Scottish Environmental Protection Agency, 2020) and Reconnaissance Drought Index (RDI) (Tsakiris et al., 2007). RDI, which is the ratio of precipitation to potential evapotranspiration over a certain period, has broad implications in terms of drought risk assessment as it provides a robust indicator for describing meteorological, agricultural, hydrological and socio-economic drought. RDI (annual and summer) is calculated using potential evapotranspiration and gross rainfall, as in Tsakiris et al. (2007). If the output (losses) exceed the input (normally over a period of months or years), drier conditions and eventually drought would occur. This drought index is considered as more robust than, for example, the SPI, which is solely based on precipitation. Therefore, the advantage of applying RDI is that the index is calculated using the rainfall relationship to the evapotranspiration, which is itself partly a function of temperature. This drought index has been used in several academic studies (Zarch et al., 2015). Comparisons in the literature tend to focus more on differences in index performance and suitability to geographic regions (e.g., Jain et al., 2015) rather than focusing on the needs of particular groups of users.
Gosling et al. (2012) validated robust indices and identified severity thresholds for appraising drought risk situations in Scotland by testing the efficacy of these indices using case studies from the Scottish drought catalog 1976, 1984, 2003 and 2010. This determined the most appropriate selected indices, index durations and severity thresholds to best capture past drought events to support decision-making (see also Zaidman et al., 2012). Hence NPI and NFI are used by Scottish Environmental Protection Agency (2020)2), to improve planning and response during “prolonged dry periods” (p18). Other indices routinely used to capture low river flows include Q95 (the river flow exceeded 95 percent of the time), “a significant low flow parameter particularly relevant in the assessment of river water quality consent conditions.”3
For major water users such as public water supply undertakings, responses are triggered by threshold crossings using a control curve (Thorne et al., 2003). For any particular supply system, threshold values of water storage are identified on a seasonal basis, and are used to trigger responses ranging from monitoring, through leakage management and use of additional supplies to demand management and applications to reduce environmental flows. Operation of different sources, as parts of a linked network, makes for greater operational flexibility and system resilience. Thresholds are also used by environmental regulators in the identification and management of low flows. SEPA uses a 6-class water scarcity scale for operational management, with responses ranging from increased monitoring and planning through to limiting abstraction rates, protecting key water supplies and the use of alternative water sources (Scottish Environmental Protection Agency, 2020).
Social Science Aspects of Drought as a System: Threshold Thinking
Here we briefly consider applications of the concept of thresholds in two inter-related areas: risk perception and hydro-social systems.
Thresholds (1): While systems parameters, quantified through indices and critical thresholds, might be more embedded in the physical sciences, the concept of thresholds, or “the level or point at which something starts to be experienced,” is well established in perceptual and behavioral sciences (Grothmann and Patt, 2005; Joseph et al., 2015). Such thresholds influence relationships between event memory, lay knowledge and resilience (McEwen et al., 2016) and guide peoples’ decision-making (e.g., risk perception or awareness, coping appraisal and action). Models of people’s perceptions linked to index thresholds are also increasing in popularity in environmental studies (of climate change, wildfires, flooding; e.g., Papagiannaki et al., 2019). These thresholds are typically based on “expectancy value” theories, which include frameworks that are used to explore relationships between people’s attitudes and their choice and adoption of environmental behaviors (Rogers, 1975). Generally, in these theories, a coping appraisal toward a specific environmental threat (e.g., flooding, drought, climate change etc.) only starts if a specific cognitive threshold of threat appraisal is exceeded (Schwarzer, 1992). Furthermore, the coping appraisal must also cross a certain threshold to influence protective decision-making (Maddux and Rogers, 1983; Bubeck et al., 2013). Ultimately, the decision to implement a coping measure in response to a threat or hazard, such as drought, is highly dependent on not only the perceived risk of the degree of negative consequences, but also the perceived efficacy of, and costs associated with, the measures in abating or reducing negative consequences. These studies are well established in flooding with application of various theories such as Protective Action Decision Model (PADM) (Lindell and Perry, 1993) and Protection Motivation Theory (PMT) (Grothmann and Reusswig, 2006; Zaalberg et al., 2009; Poussin et al., 2012; Bubeck et al., 2013).
Studies in drought management have also seen emergence of application of similar methods (e.g., Mankad et al., 2013; Gebrehiwot and Van der Veen, 2015; Bryan et al., 2019). Mankad et al.’s study (2013) of Queensland, Australia households found that thresholds in perceptions of threat and perceived effectiveness and costs of protective behaviors accounted for a significant proportion of explanatory power in participants’ intentions to engage in adaptive behavior toward water shortages. Both studies by Gebrehiwot and Van der Veen (2015; rural Ethiopian farmers) and Bryan et al. (2019; south west England households) found that there were different decision stages toward implementing drought coping actions based on a combination of thresholds in perceived vulnerability, severity of consequences, self-efficacy, and response efficacy. Perceptual thresholds and decision thresholds of drought may vary with a complexity of socio-cultural and economic factors, given variable vulnerabilities and impacts, with scale of analysis and sectoral focus potentially masking or highlighting impact. They can also vary with people’s memory and thresholds of awareness.
Thresholds (2): Interdisciplinary, systems thinking about drought impacts requires understanding of the interface between hydrological, social and technical systems, the physical and social thresholds, and integration of this knowledge. Swyngedouw (2009) “hydrosocial cycle” foregrounds the local circulation of water, knowledge, and power, deliberately focusing on water’s social and political nature (see Linton and Budds, 2014). Looking at this concept and the interactions between nested systems at varied spatio-temporal scales, through the lens of “thresholds,” we see this framing used in socio-hydrological modeling to support resilience (Fernald et al., 2015; Blair and Buytaert, 2016). For example, Fernald et al. (2015) co-worked with United States communities to translate the multidisciplinary dimensions of hydrological and social systems using causal loop diagrams. These in turn comprised an evidence base for system dynamics modeling turning narratives into future scenarios to help identify thresholds and tipping points for sustainable practices. Blair and Buytaert (2016, p452) argue that significant learning can occur from “the manner in which characteristics such as feedback loops, thresholds, time-lags, emergence and heterogeneity” are dealt with in socio-ecological studies, citing Liu et al. (2007).
These two approaches represent different ways of identifying indicators and thresholds in the social sciences. They have been applied in drought and water scarcity studies to explore threshold thinking in different ways than the technologically sophisticated analyses applied in hydrology. These challenges of definition highlight the need for interdisciplinary systems-based research framing around thresholds and feedback in drought risk management.
Research Setting
The Fife Eden, a 300 km2 rural catchment in east-central Scotland, has an average annual rainfall of 800 mm (Figure 1). The highest hills rise to 520 m above sea level and are used for sheep grazing and some forestry. Most of the 40 km length of the river flows through the flat Howe of Fife lowland, underlain by fluvio-glacial sands and gravels and supporting deep, fertile soils. The area was incrementally drained between the 17th and 19th centuries, including the drainage of a former lake, Rossie Loch. Agriculture in the Howe today is among the most productive in Scotland, supporting barley, oats, potatoes, vegetables and soft fruits.
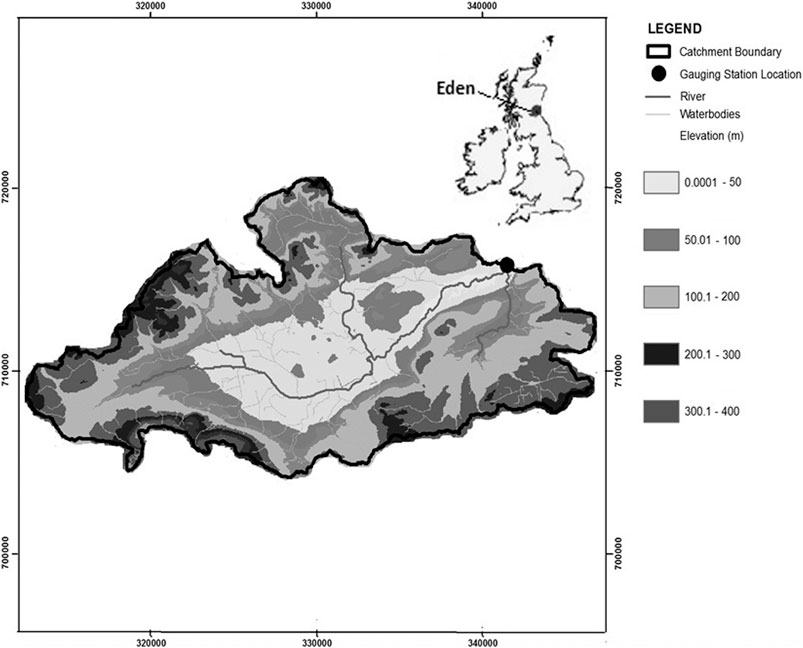
FIGURE 1. Catchment location, stream route, gauging station position, and elevation. Source: catchment boundaries (Morris et al., 1990; Morris and Flavin, 1994). Elevation data courtesy of Intermap Technologies Inc. (Nextmap 50 m Digital Terrain Model).
The Eden river flow has been measured continuously at Kemback, 2.5 km from the tidal limit, since 1967. It rises and falls more slowly than neighboring rivers, with 63% of annual flow being delayed flow (National River Flow Archive, 2020) thought to originate mostly in a sandstone aquifer and in the valley sediments (Ó Dochartaigh, 2004). This means the river maintains its flow in extended dry periods, and provides security of water supply to water users sited along its banks. The main town, Cupar, sits on the banks of the lower Eden, with a population of 8,506 (2011 census). 21.8% of the population are aged 65+ years, compared with a Scottish average of 19.1% (National Records of Scotland, 2020a). In Fife as a whole, the 65–74 age group is the fastest-growing, with 40.6% increase from 1998 to 2019 (National Records of Scotland, 2020b). A new strategic development of 1,400 homes is included in the local structure plan (Tayplan, undated). Public water supplies originate from surface reservoirs in the Lomond Hills within the catchment, and also 15 km to the west in the Glendevon regional water supply scheme.
Agriculture is the largest water abstraction beyond public supply. Potatoes and root vegetables, as drought sensitive crops (Obidiegwu et al., 2015), in particular need irrigation to provide the required quality for buyers, but these and vegetables and soft fruits all need irrigation for yield. Grass, used as a forage crop, is also occasionally irrigated on some farms. Grass growth can be severely restricted during long dry periods, making it difficult to maintain good grazing and also conserve silage and hay for the winter months. Water shortage can be an issue in the catchment, but very much depends on location within the area.
Water abstraction in Scotland is governed by the Water Environment and Water Services (Scotland) Act 2003 (as amended) and the Water Resources (Scotland) Act 2013, the latter introducing “water shortage orders” in place of the drought orders which continue to apply in England. Under the legislation, the Scottish Environment Protection Agency (SEPA) is empowered to restrict abstractions in times of water shortage, and implements a system of river basin management planning in compliance with the European Water Framework Directive. These powers were introduced to Scotland 40 years after the Water Resources Act became law for England and Wales in 1963, giving rise to the impression that the need for water management in Scotland was much less than in England.
Under the licensing regime following the 2003 Act [particularly the Water Environment (Controlled Activities) (Scotland) Regulations 2005, as amended], farmers working on high value land became incentivized to build water storage lagoons (off-line ponds)4 as a means of achieving security of supply and potentially large financial returns on investment, while avoiding abstraction controls in drought periods. These lagoons are subject to licensing under the same regulations to ensure best practice and protect the water environment.
The most serious water supply drought in the Eden catchment occurred in 1984 (Scottish Development Department, 1986). The section on Fife (4.6) mentions a hosepipe ban in August and a drought order for Glendevon. The report also refers to Clatto reservoir in the Eden catchment, with its outflow flowing eventually into the Ceres Burn, which joins the Eden near Kemback. However, Clatto Reservoir, and Cameron Reservoir (also referred to) are no longer operational sources (Bramwell, pers. comm.).
Research Design and Methodology
The four-year, interdisciplinary DRY (Drought Risk and You) project aimed to support improved the evidence-base to support better catchment-based drought risk decision-making in the United Kingdom. The team involved drought risk modellers, ecologists and agronomists working with specialists in narrative methods from the arts, humanities and social sciences. DRY’s research design was focused around a series of creative experiments that brought together science and narrative iteratively into the same frame (McEwen and Blake, 2020). DRY considered six sectors (business, agriculture, natural environment, built environment, health and wellbeing, public/community) across seven case-study river catchments, the most northerly being the Fife Eden, Scotland described here. The notion of a “catchment” was construed flexibly to embrace both hydrological flows but also people who move across the catchment boundary for work and leisure. The science involved an open reconstruction of the past drought series for the Eden at Kemback flow gauge, setting up and calibrating/validating a hydrological model of the catchment, using DiCaSM—a spatially distributed catchment system hydrology model (Afzal and Ragab, 2020). The model simulates the key components of the terrestrial hydrological cycle (rainfall, evapotranspiration, changes in soil moisture, groundwater and rivers flows) within a catchment using a 1 km regular grid and daily time-step. A detailed description of the drought risk modeling approach involving past reconstruction and future scenario-ing is provided in Afzal and Ragab (2020). This specialist scientific information, in the form of graphs, maps and catchment-scale animations of specific drought indices like SPI and RDI (Table 1), was iteratively explored with local stakeholders. This was carried out alongside sharing UKCP09 climate change projections (Murphy et al., 2009) for the 25 km grid square centered on the Eden catchment, providing potential future seasonal average precipitation and temperature data (Figure 2). DRY’s processes also involved co-developing drought climate and land use change scenarios with local and regional stakeholders (Liguori et al., 2021).
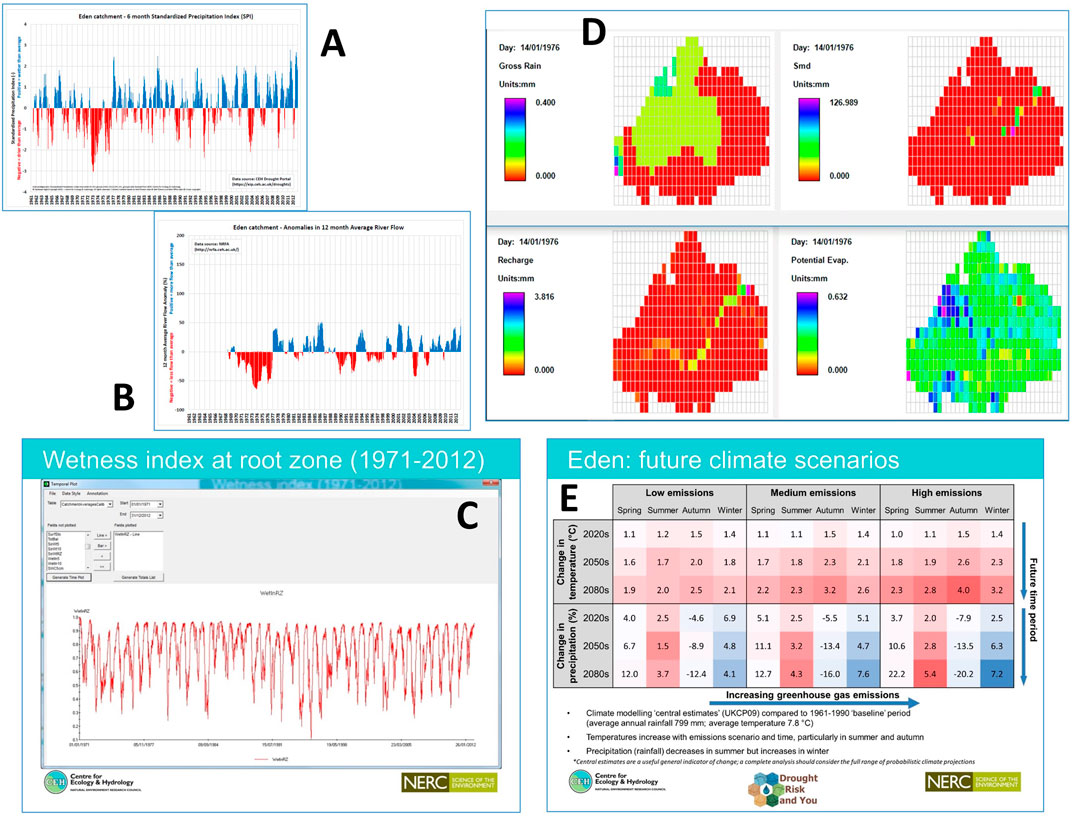
FIGURE 2. Indicative composite of the scientific graphs and figures used in the various stakeholder engagement activities within the Eden catchment (for other examples, see Afzal and Ragab, 2020). (A) Time-series rainfall anomaly plot (SPI; 6 months); (B) Time-series—average river flow anomaly plot (C) Wetness index times-series generated by DiCaSM (D) Animation of drought indices through 1976 as front end to DiCaSM; (E) Example distillation of bite-sized science – UKCP09 scenarios.
This scientific evidence was shared in diverse settings for narrative engagement, with the aim of gathering “science-stimulated narratives” across different stakeholders and sectors. The narrative approach used combined insights from different disciplinary ways of narrative working and storying practice (Lewis, 2011; Bourbonnais and Michaud, 2018; Liguori et al., 2021) and participatory methods (McEwen et al., 2016). This way of working recognized that within the United Kingdom, it was challenging to get local people to talk about local drought risk and experience, with the frequent need for researchers to go in more obliquely around wider water behaviors and environment (see Liguori et al., 2021). This issue was particularly acute in Scotland, a country perceived as wet. To meet this storying challenge, DRY developed an emergent suite of Adaptive Participatory Storytelling Approaches for storying work tailored to different settings. These accommodated, for example, different numbers of participants, lengths of engagement, depth of science shared during the research process, with self-selection of participants.
Within DRY’s work in the Eden catchment, settings and multi-methods for narrative data collection are captured in Figure 3. These involved: narrative interviews (11), a focus group with local government (1), a farmer-facing participatory workshop (1), themed public river walks (2), Local Catchment Advisory Group meetings (6) and “off-road” engagements with the public at the Fife Agricultural Show, a local community events (2), a participatory visit to DRY’s droughted grassland experiments and a walking interview by the River Eden. “Off road” engagements allowed the environment to act as an “interview-prop” to scaffold remembering in situ with better ease of recall of unique local knowledge (Slim et al., 2006). This prompted interviewees to talk in ways that might not occur in formal settings when trying to gain insights into a hidden risk like drought. These different approaches were used to collect and record narrative reflections, some of which were identified for production as “micronarratives” (MN; short audio reflections) and co-produced digital stories (DS; 2–3 min audio with images selected by the author (Meadows, 2003; Holmes and McEwen, 2020). These MN/DS are shared within the DRY Story Bank (https://dryutility.info/story-bank/).
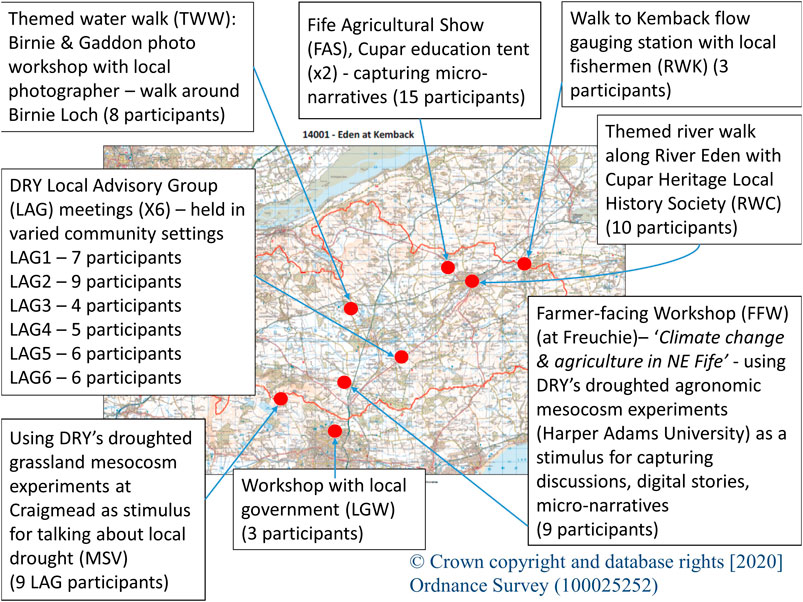
FIGURE 3. Map of the participatory science-narrative approaches and activities undertaken by DRY, and their location within the Eden catchment.
The research process underwent ethics approval for work with human participants at the lead research institution. All narrative types were recorded and transcribed for analysis. Analysis of the interviews, digital stories and micro-narratives involved thematic coding using QSR-Nvivo to conceptualize, classify, categorize, and identify emergent themes relating to the aims and scope of the paper. Further analysis included identifying sub-themes within themes to provide further in-depth understanding of the narratives and establish linkages with the aims. Additionally, thematic mapping was undertaken to highlight and triangulate these key themes and sub-themes within different sectors. This was followed by a mapping of the connections and trade-offs across sectors, and identification of thresholds, tipping points and trade-offs within past (and future) narratives.
Results
Past Drought and Drought Thresholds: What the Science Says
Changes in precipitation and potential evapotranspiration (which increase with increasing temperature, along with decreasing humidity, increasing wind speed, and increasing solar radiation) over time, control soil moisture conditions and hence groundwater recharge and streamflow in a catchment. As soil moisture decreases, the actual evaporation will fall below the potential rate. In this study, drought severity was analyzed using past and anticipated changes in precipitation and evaporation within the Eden catchment. Temporal changes in precipitation over the catchment, revealed a significant decrease (p < 0.05) in precipitation for the period 1961–1976, and a slight increase in precipitation overall for the 1961–2012 studied period. During the 1961–1976 period, a decrease in precipitation of over 16 mm/year was found, and after 1976 rainfall slightly increased by 2 mm/year which was statistically non-significant. During the 1961–1975 period, potential water losses due to the potential evaporation were significantly higher than the 1976–2012 period (Figure 4). The effect of precipitation decrease and increase in evaporation for the 1961–1975 period can be seen where the RDI, calculated using potential evapotranspiration, and gross rainfall, revealed two extreme drought events when RDI was below -2 in 1973 and 1976 (highlighted in red; Figure 5). Drier than average spells (RDI less than -1) were also observed in 1974, 1976, 1989, 1996, and 2003. It was also noticed that based on the RDI, the total percentage of the wet years equaled the total percentage of dry years, but extreme dry events occurred twice as often as extreme wet years (RDI >2 once in 1985, extreme wet year), RDI < -2 (twice, in red, extreme dry)) (see Azfal and Ragab, 2020). Table 2 shows a list of droughts (1961–2012) in the Eden catchment from scientific evidence, based on scales and indices (here annual and summer RDI). Different indices provide different pictures; the summer RDI index picks out the short-term 1984 drought, while annual RDI does not.
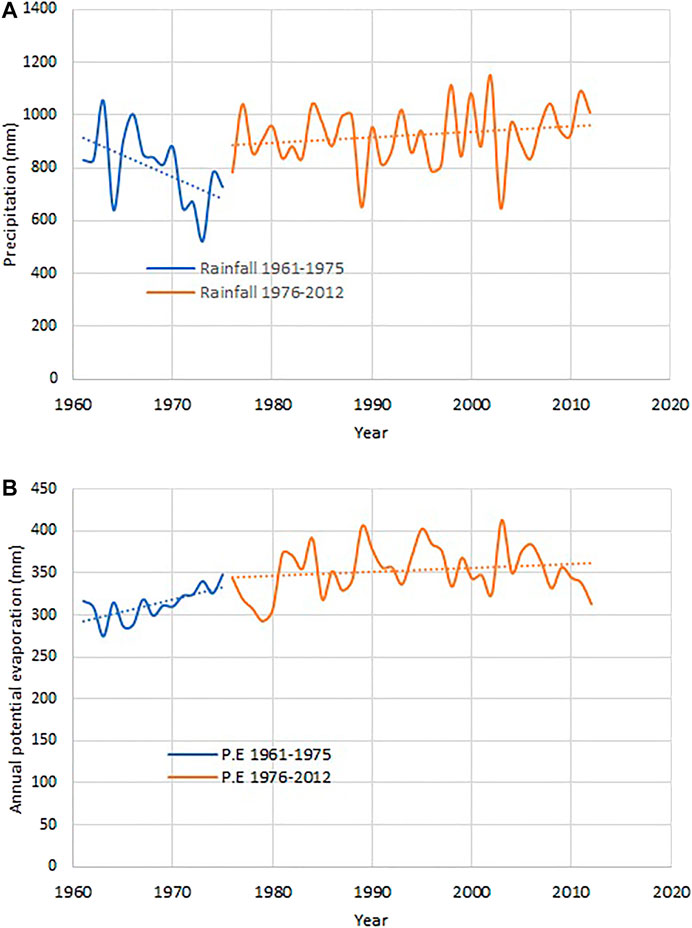
FIGURE 4. (A) Average annual precipitation; and (B) average daily potential evaporation over the Eden catchment for pre-1976 for the period (1961–1975), and post-1976 periods (1976–2012).
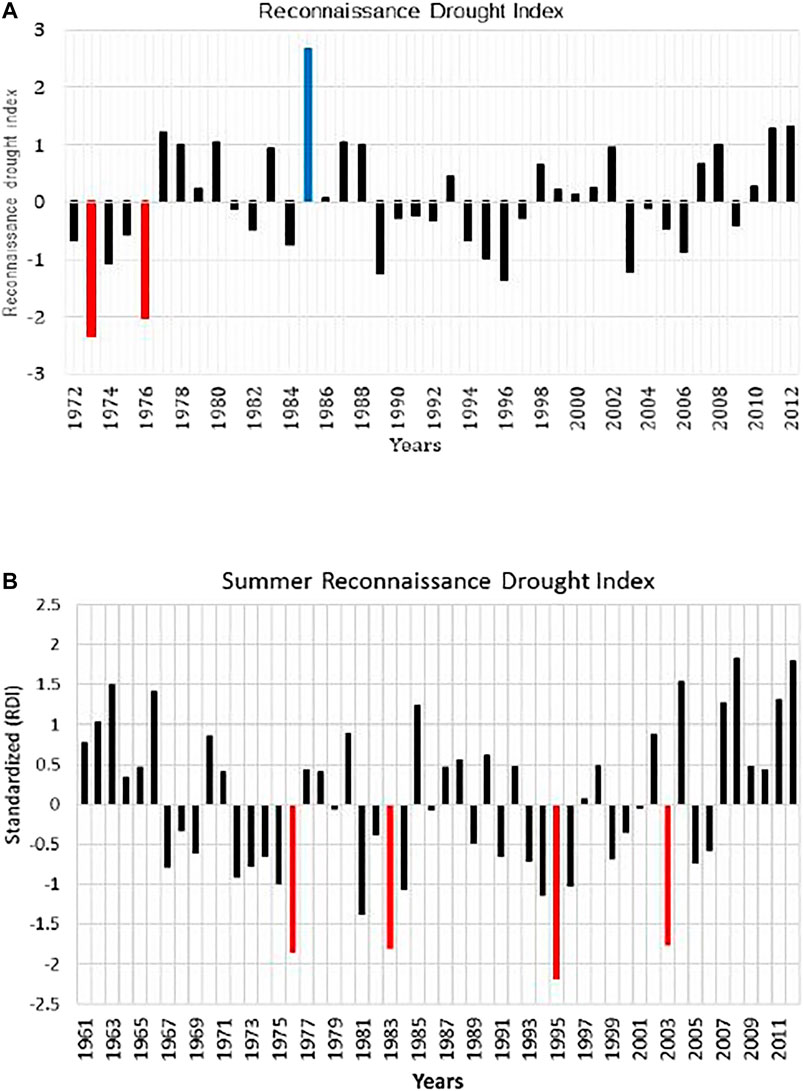
FIGURE 5. (A) Annual reconnaissance drought index calculated using the potential evapotranspiration with gross rainfall (RDI); (B) Summer reconnaissance drought index calculated using the potential evapotranspiration with gross rainfall (Summer RDI). For both plots, the blue/red bars represent extreme wet and extreme dry years.
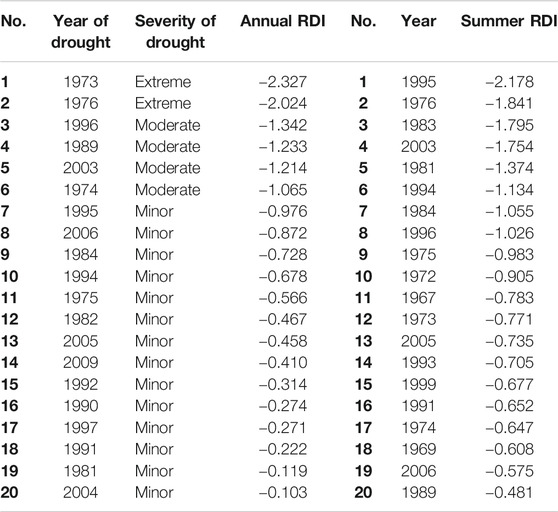
TABLE 2. Most notable droughts in the Eden catchment from 1961 to 2012, based on (A) annual RDI; (B) summer RDI.
Thresholds for Drought: What Local Stories say
Our story narratives across all the various engagement events/activities revealed that drought memories in the Eden catchment exhibit some measure of “fuzziness” over time, especially over decades (Figure 6). This fuzziness is often manifest in the precise time when events occurred, and less so where past impacts are concerned. Hence, we find that for high profile nationwide droughts like 1976, narratives often depicted similar impacts across DRY’s catchments, for example, potato farmers remember that potato yield and quality were significantly reduced locally and nationally. Interestingly, although several decades ago, the 1976 drought was the “event” where the largest number of people (11 who specifically mentioned 1976) across various narrative settings and sectors could remember a distinct year. This corresponds with both the SPI and RDI data. It is noteworthy, however, that over the baseline period, both indices showed the lowest value in 1973, but drought memories started to present in 1975 and 1976. This could be an indicator of the need for two or more successive dry winters to impact water supplies, or that the memories are collective due to the persistent national media influence of 1976. More recent dry periods, such as spring 2017 and summer 2018, were also discussed more and with less temporal fuzziness as these memories were more recent (Figures 6, 7).
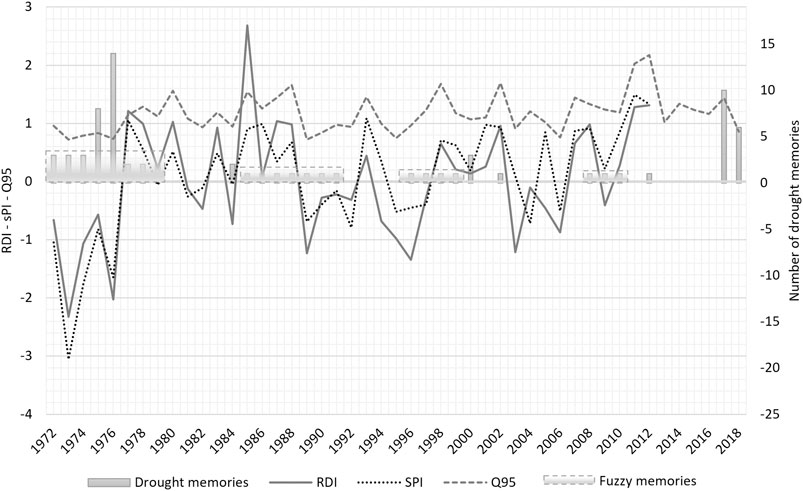
FIGURE 6. Drought memory timelines overlaid with RDI, SPI and Q95 data (1972–2012). Q95 data were available up to 2018.
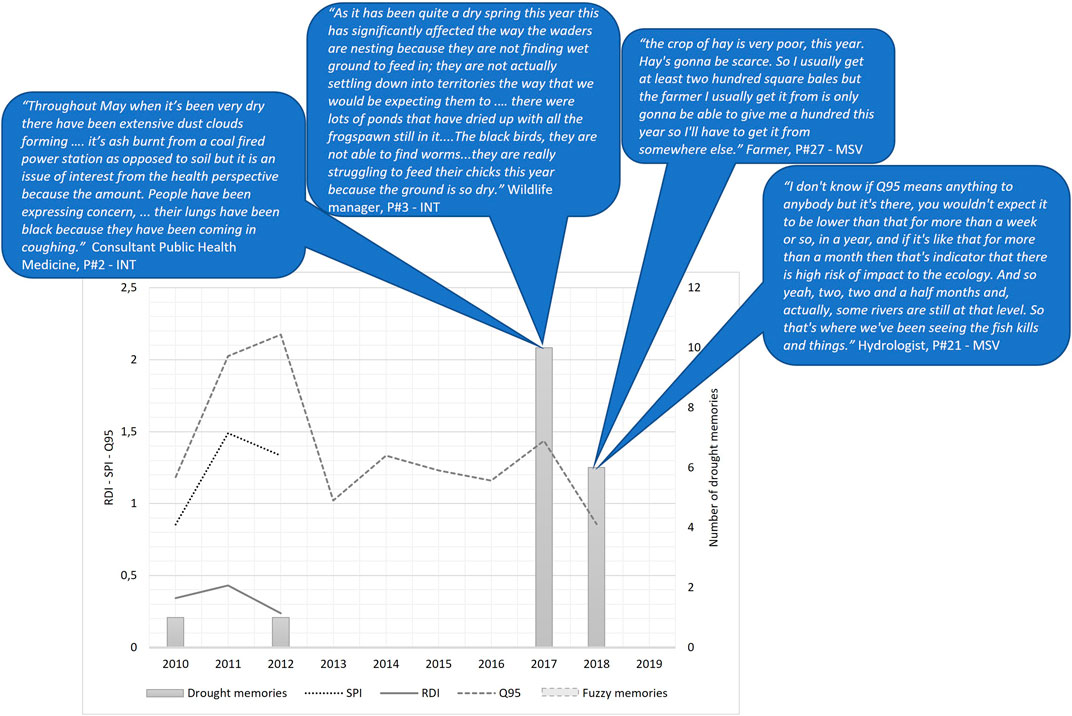
FIGURE 7. Drought memories overlaid with RDI, SPI and Q95 data for the decade 2010 to 2019. RDI and SPI data are only available to 2012. Q95 data are used here to provide an indicator of local river levels for comparison with narratives.
Local residents in the Eden catchment and wider Fife area had very varied views about what drought meant for them and their local area, and how some of the indicators in their own sector of interest are identified and quantified. Although there was a strong memory of the 1976 drought among older narrative participants in general and members of certain sectors (e.g., agriculture), drought was perceived as a rare and speculative hazard from a Scottish perspective, and was not necessarily on most publics’ radar throughout the various narrative settings. Drought was also frequently “othered”‐often seen as a problem for African countries, Australia, United States and even England. Some narratives also revealed that participants thought the catchment was getting wetter rather than drier and hence local flooding (rather than drought) was mentioned in various narrative settings. This belief of the catchment becoming wetter appears to correspond to the scientific findings above (though statistically non-significant).
When the idea of drought in Scotland was discussed as a local community issue, many participants tended in the rehearsal of memory to associate drought with warm, sunny weather illustrating their memories of summer droughts (see Participant #4 in Figure 8). Community members generally had nostalgic positive memories of the 1976 drought:
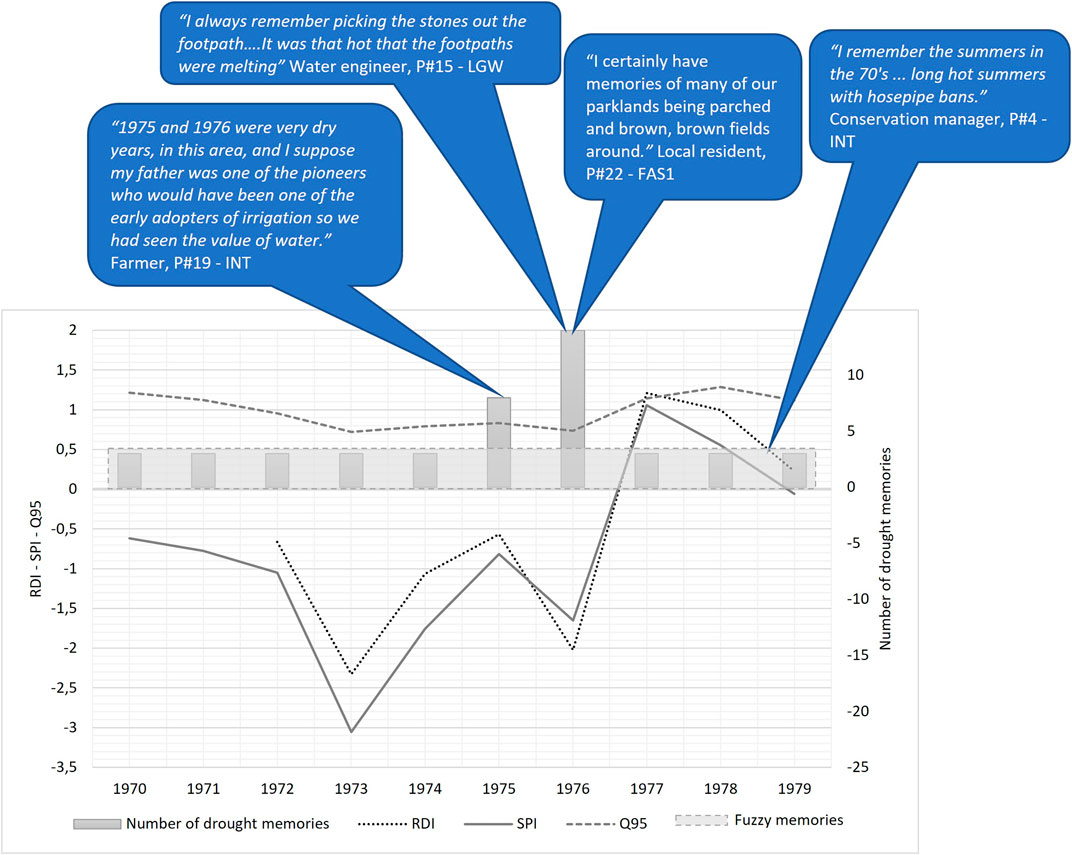
FIGURE 8. Drought memories overlaid on SPI, RDI and Q95 data for the decade 1970 to 1979.
“I grew up in the sixties, and in the seventies I remember dry wonderful warm summers, every day was a lovely hot day.” (Local resident, Participant #23 - FAS1).
Others recalled hosepipe bans (TUBs) (Figures 9, 10) and the environmental impacts of the drought, such as brown grass in areas usually known for their lush green scenes, low flowing rivers or burns and lochs, and lack of access to certain outdoor activities. Hence drought could be seen as a hindrance to regular or desired activities but not necessarily a major hazard from a Scottish point of view:
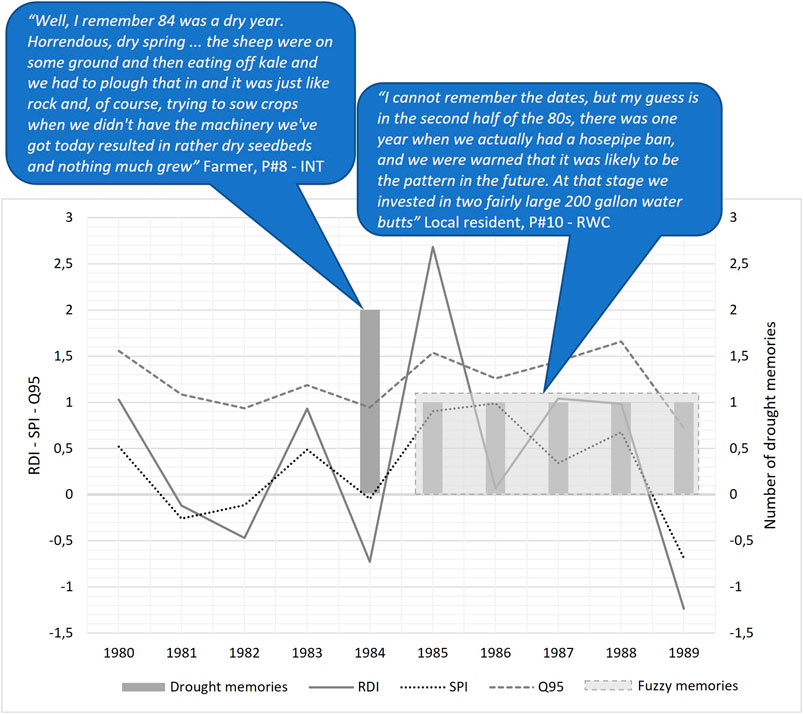
FIGURE 9. Drought memories overlaid on SPI, RDI and Q95 data for the decade 1980 to 1989.
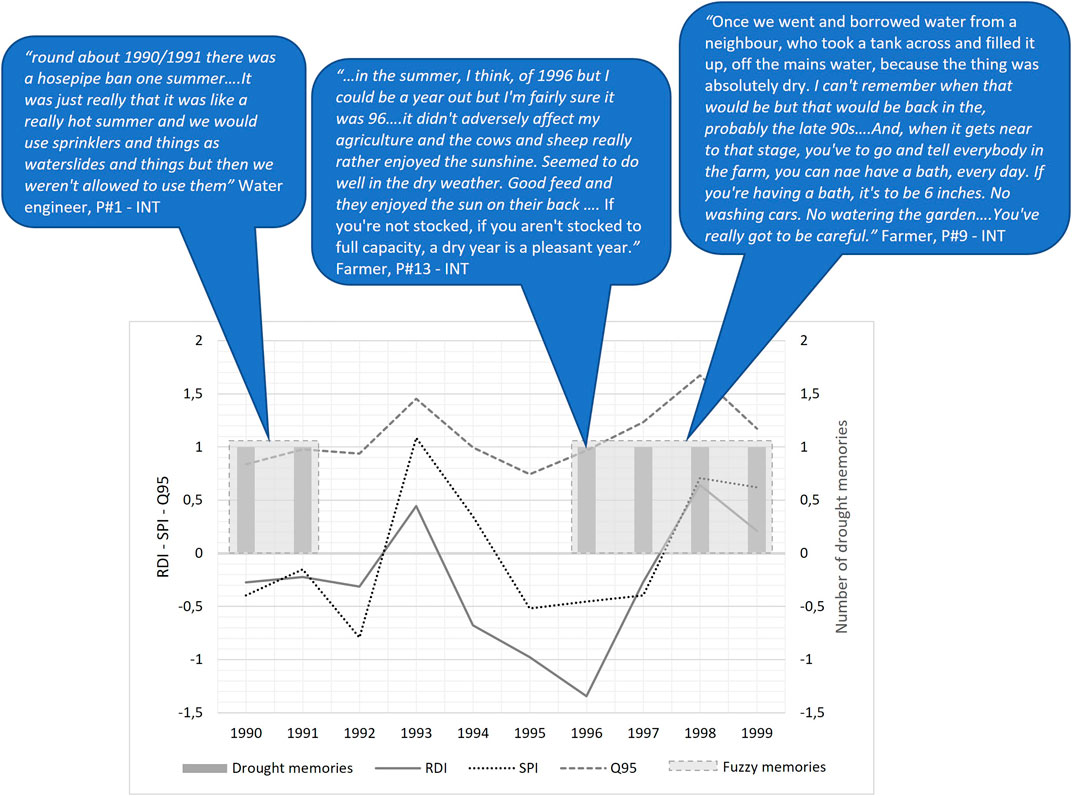
FIGURE 10. Drought memories overlaid on RDI, SPI and Q95 data for the decade 1990 to 1999.
“If you said there’s a drought, I would imagine Sudan, in Africa, or Ethiopia. That where crops are dying. Livestock’s dying. That’s what I imagine drought as. You know, life changing sort of. Not it’s a bit dusty when we’re lifting potatoes or the yields not as good as we had last year. That’s an inconvenience.” (Local farmer, Participant #14 - INT).
Nonetheless, some narratives did indicate that there is an awareness of drought and dry weather conditions within and around the catchment. Some revealed that perceptual drought thresholds often varied between sectors, and also appeared to depend on individual stakeholders and their local baseline conditions (e.g., specific soil type or location of their abstraction for irrigation along the main Eden) prior to a drought. Based on the narratives gathered, agricultural and environmental stakeholders appeared to illustrate the most noticeable thresholds from past droughts compared to business and community stakeholders, which implies that historically droughts in the Eden rarely prolong to the stage of socio-economic drought. Some west coast island communities on private water supply in Scotland are arguably more vulnerable, with records of distillery shut-downs in 2013 (see Historic Droughts Portal5). Additionally, there were often stories of conflicts across sectors in droughts which impact certain thresholds. In the subsections below, we will present some of the perceived thresholds of drought across sectors within the transitions between different drought stages.
Transition: Meteorological – Soil Moisture Drought
Several participants in different narrative settings (e.g., LAGs or interviews) indicated that the spring season can sometimes be accompanied by dry, windy conditions in the Eden catchment, where meteorological variables, such as precipitation and wind speeds, are below and above average respectively. When these conditions combine with spring tillage, soil moisture is reduced, thereby illustrating a type of meteorological-soil moisture drought, with systemic effects. With soil moisture loss and strong drying winds, sandy soils become easily vulnerable to erosion. Wind-blown dust then becomes a common issue in the catchment during these periods. We sometimes heard about this dry weather phenomena being referred to as “stoor” and “drouthy weather” in the local vernacular. These events were seen as particularly important for the catchment as farmlands were often exposed during spring due to tilling in preparation for summer crops. Participants #3 and #21 tell us more about this:
“I think what causes it is if you have dry-ish but windy conditions. It has to be quite windy and usually from the west, which is not uncommon round here. Usually around March time when the fields have been worked but the vegetation hasn’t really grown up yet so there is a lot of bare soil. Sometimes it can be triggered if they are doing something like running a tractor across to roll it, particularly rolling the ground before things are sown or just after. What that does is send up clouds of dust into the air that blow down the Howe of Fife over the village of Ladybank usually and sometimes getting toward Springfield and down that way. It can be really quite dense …. It has an impact on transport sometimes because I have seen roads blocked by dust that has blown into drifts across the road …. It impacts on people just living down there, I wouldn’t be very happy with dust blowing all the time.” (Conservation volunteer, Participant #3 - INT).
“At certain points in the year, there’s quite a light soil in the area, particularly in the area known as the Howe of Fife and it’s not unknown to have sandstorms, dust storms, because of the light soil being blown, in high winds, across the fields, into roads, sort of darkening the passage for drivers.” (Local resident, Participant #21 – FAS1).
This wind-blown dust phenomenon only impacts some farms and communities based on the soil type in a particular part of the catchment, with light sandy soils in the low-lying basin area of the Howe of Fife, known locally as “the Fife Dustbowl,” as mentioned by Participant #3. Here we see a threshold of likelihood of impact differing depending on location and baseline soil conditions, highlighting spatial differences in the drought resilience of soils. There are therefore differences in experience: for some people there is a source of nuisance (e.g., affecting the outdoor drying of laundry), a threat to driving safety, or a risk to health (for persons with a respiratory illness), while for others in a scientific or farming context, there is a threat to agricultural sustainability owing to soil loss. It would be difficult to identify these types of thresholds to impact with only the physical parameters used in SPI or RDI.
Another compelling story of seasonal wind-blown dust thresholds was shared in stories of spring 2017 that led to the “Fife ash clouds.” This involved blowing of coal fly-ash from an industrial property ca. 5 km from the Eden catchment – dust that was a major concern for local residents who feared resulting health effects (Figure 7). Again, the threshold of impact (to health in this case) may be reflected by prevailing baseline conditions, such as the levels of exposure to the dust clouds (linked to location and activities) or underlying health conditions of an individual, as we heard from Participant #2 below:
“The impacts are likely to be short term health impacts in terms of causing coughing or eyes watering …. but if you’ve got pre-existing illness it can make things worse in terms of provoking or worsening cardiovascular or respiratory illness.” (Health professional, Participant #2 - INT).
Although we did not have SPI and RDI data for the 2010s, this event did not correspond with a low Q95 value (<1) (Figure 7). This signals that the conditions were probably short term and possibly at the early stages of drought. The presence of wind-blown dust is therefore potentially one of the early indicators of drought onset in this catchment.
Transition: Agricultural and Hydrological Drought
The extreme drought in 1975/1976, and successive dry winters, impacted both agriculture and river/lake environments, not just in the Eden catchment but throughout the United Kingdom (Doornkamp et al., 1980), marking the transition between an agricultural and hydrological drought. This drought has been attributed to lack of replenishment of major water bodies following two or more successive dry winter seasons throughout the United Kingdom where reservoirs and aquifers would normally be replenished. In Scotland, and particularly the Eden catchment, even with the reduced rainfalls, rivers were still flowing, unlike in parts of England where rivers were dry. From Figure 8, we can see that participants recalled the drought occurring somewhere between 1975 and 1976, corresponding with a period of fluctuating low SPI, RDI (<-0.1) and Q95 values (<1). Other participants’ memory of the year of the drought is “fuzzy” and approximate (e.g., “sometime in the 1970s”).However, central to farmers’ memories was the drought’s impact on potato yield, quality and price, and its eventual influence on irrigation practices that now define root vegetable farming within the catchment.
The case of potato irrigation was a dominant theme encountered throughout the various narrative settings applied in this and other DRY catchments e.g., in the East and Southwest of England. Due to the low rainfalls experienced during this period, the potato harvest fell far below normal expectations. Only a few potato farmers in the Eden catchment were already using irrigation technologies before the 1976 drought and as a result, were able to produce potatoes at the appropriate standard and quantity in a period of high national demand and shortage. This provided them with great financial gains as the demand-supply balance shifted with the progressing drought. Therefore although rainfall was limited in the catchment, water was still flowing in rivers—beneficial for farmers with irrigation technology. Therefore, unlike farmers elsewhere, with little or no access to water, a few Eden catchment farmers with the appropriate technology were able to make use of the little water available in watercourses to increase productivity. This drought event acted as a tipping point for subsequent expansion in use of irrigation equipment in vegetable farming in the Eden catchment to improve both quality and yield. This situation also triggered a major national market change in potato farming. Although farmers like participant #8 (INT) expected a similar situation in a drought today, the financial thresholds met by farmers then, are not expected in today’s market as discussed by participant #19 below.
“Well I suppose … it’s kind of legendary now. Especially 1976. Potato prices were extremely high that year and it was basically because there was a shortage and there wasn’t that many people that had the capability to irrigate …. those who had potatoes made a lot of money, in 1976. And that was really because the country was shot. We probably haven’t seen anything like that, ever since, to such an extent. We’ve seen potato prices climb but, when you do the maths on it, you know, today, that price, and they were getting 300 pounds a tonne then, that price, today, would need to be about 1,200 pounds a tonne …. We’re nowhere near 1976.” (Farmer, participant #19 INT).
So a tipping point in the potato market was met; it is not expected that this threshold would be crossed again in current market conditions. However, stories continue on—when potatoes became more expensive after the 1976 drought, that there was a shift to cheaper “faddy foods” such as rice and pasta, with potatoes never returned to similar extent in the British diet.
Today, in the Eden catchment, potato crops are commonly irrigated, and irrigation is also widespread in the production of some vegetables and soft fruits (e.g., broccoli, strawberries). Participant #8 (INT) explains how this drought led to the shift in irrigation practices:
“Well 76 was, I remember …. irrigation was relatively new in Scotland, at that time and once you’ve had an experience where your yields have been dropped, you then tend to think how can I mitigate that and so irrigation equipment was right across Scotland .... So big, high demand on irrigators now …. it’s one of the biggest improvements, I think, in the potato growing, in Scotland, was that year, 76.” (Farmer, participant #8 - INT).
This drought hence led to a shift in market standards that now presents a farming environment requiring adequate water supplies to produce the “perfect” crop. The need to irrigate certain crops during specific seasons therefore can be seen as a major indicator of agricultural drought in the catchment, although the threshold for action can be difficult to determine as we see in the account from Participant #26 about the dry spring of 2017:
“We got the irrigator out. We got it all set up, in the dry spell, in the spring, and they tested it and that was it. We put a new pump into the bore hole, at vast expense, and then the rain came and that was it for the summer.” (Farmer, Participant#26 – INT)
Some farmers were already using science-based approaches in their decision-making, to determine whether and when irrigation should commence:
“I would think most people, nowadays, are scheduling their irrigation. Doing what I am. Monitor the rainfall. Monitor the evaporation and work out how much water they need to put on. You know, before you used to go, oh the potatoes are hooking now, they’re starting to form small tubers. We’ll give them an inch, just for good measure. Some people maybe still do that. I don’t know.” (Farmer, participant #14 - INT).
Nonetheless, while the approach toward deciding when to irrigate may be more systematic and strategic, farmers are not always guided by the measurements and analyses from instrumentation but rather on intuitive judgements, as we heard in some cases. This involved running the soil through their hands or kicking the soil (the “boot method”), and appraising the growth stage of the crop against seasonal expectations, in deciding whether or not they should add “a bit” of water (irrigate). One farmer told us that better soil management practices were needed to improve soil quality (e.g., increased organic matter, moisture holding capacity, etc.) in ways that would improve soil performance and thresholds for disruption both in floods and droughts. Another impediment to the use of these scientific indicators as a guide for irrigation is very much dependent on the farmer’s location and geology within the Eden catchment, as noted above. For example, farms that do not adjoin the river or are downstream several large farms are at a disadvantage in accessing irrigation.
“There’s still water going round there but, perhaps, if you count back the river, there’s been probably six or seven irrigation reels, pulling out water, before it gets to us and we’re probably the last one, before it joins the Eden. So it’s come close. Not very often.” (Farmer, Participant #19 - INT)
Another interesting perceptual drought threshold articulated by farming participants, related to farming under dry versus wet conditions. Some farmers growing arable crops much preferred dry (winter) conditions as they were “able to work the land” much better than during wet, muddy winter periods which was much more challenging and sometimes more destructive. So for arable farming, when growing three different crops during summer 2018, “drought is good” (participant #8 INT). However, this narrative is specifically around short-term summer drought rather than deficits that extend over more than a few months. Figure 9 highlights Participant #8’s commentary on flooded versus droughted farms, based on his experience with flooding in 1985. This theme seemed to resonate particularly within the Eden catchment as opposed to other DRY catchments in England and Wales. With limited experience of drying rivers and reduced access to irrigation water even during a drought, some farmers could afford to be more optimistic toward drought unlike those in say the South East of England where abstraction may well be restricted during drought.
Livestock farmers had similar differential experiences with drought in the catchment. They generally agreed that animals thrive in dry weather as they are less susceptible to diseases, e.g., diseases of the feet and liver which are common in wet weather. The story of Participant #13 in Figure 10 is a good example in illustrating how dry weather is mainly perceived as beneficial to livestock farming. However, further on in her story, this participant does highlight the issues with being overstocked during a drought, which is where the benefits become outweighed with limited food supply if the drought prolongs. This is also explained in the story by Participant #9:
“Well it could have a knock on effect on the amount of animals we could graze because, in a drier summer, they don’t produce as much grass. Even though they thrive well enough, you can sometimes find yourself. In the 90s, when there was a few dry summers, our farm looked like the Sahara Desert. It was just brown ... There was one year, we started feeding straw in August 'cause the grass had stopped growing. And, obviously, if it’s been a dry summer, you probably haven’t got the bulk of silage. You maybe got good quality but you don’t have the bulk.” (Mixed farmer, Participant #9 - MSV).
This very threshold was crossed in the catchment during the 2018 drought where there was a shortage of grass for hay and silage due to the low rainfall and dry weather experienced (Q95 < 1 – Figure 7).
“The crop of hay is very poor, this year. Hay’s gonna be scarce. So I usually get at least two hundred square bales but the farmer I usually get it from is only gonna be able to give me a hundred this year so I’ll have to get it from somewhere else …. the hay crop, for anyone using hay, is very poor this year.” (Estate manager, Participant #27 - MSV).
Some farmers, whose stories we garnered, had diversified (whisky distilling, farm shops, holiday accommodation) in ways that could influence their narratives of drought experience, thresholds of disruption and their personal and business resilience.
In terms of impact to the natural environment, narratives highlighted the strong interconnections among drought, nature, and human health and well-being. As discussed in Bryan et al. (2020), drought conditions can present opportunities for people to engage more with the natural environment through various land and water-based activities (e.g., field sports and sailing). These activities are often linked to positive health and well-being outcomes as seen below.
“Scottish Natural Heritage (SNH) …. is becoming increasingly interested in what Scottish government calls the “Preventative Spend Agenda,” so getting people out to appreciate the natural heritage so that their mental and physical health is improved and therefore costs the country less to treat them …. drought makes it easier to get people out and about in the outdoors and appreciate it before it frizzles up, because then you’ve not got the problems of mud and drainage issues ... So, when it’s dry, it’s actually a whole lot easier to get people to go out and appreciate the natural environment.” (Conservation manager, Participant #4 – LAG2).
However, there are also thresholds involved here; there comes a point when the benefits are outweighed by the costs of engaging in some of these activities during a serious drought, and particularly during summer drought when water shortage may combine with heatwaves. Hot, dry weather can lead to worsening of chronic health conditions and hence potential fatalities for some people (e.g., older people and children), thereby showcasing the dangers associated with drought and outdoor activities. They can also lead to environmental conditions that make it unsafe or impractical for recreational activities. These include low water levels, algal blooms, dried sports fields, increased fire risk to vegetation etc.:
“If the water gets too short then they can’t (water-ski). And, also, because if there’s more heat and less water, we get a lot of blue green algae blooms which, actually, prevents access to the water.” (Local government, Participant #16 - LGW).
“I guess we used to play football. I play a lot of golf. I guess the golf courses become hard and become when they get hard, they get harder to play …. Yeah it’s something that you never really notice that you know oh that could happen ok. …. Yeah so my recreational play would be actually quite impacted.” (Water engineer, Participant #1 - INT).
The impact of drought on the natural environment can also lead to direct and indirect effects on the mental health and well-being of humans as they watch the ecosystems, habitats and species they value and enjoy, deteriorate and struggle to survive. Although some participants believed that many more mobile species in the Eden catchment would be able to migrate under severe drought, we did hear of extreme examples of systemic species impacts. These included the deaths of a fragile local community of hedgehogs as feeding habits of certain predators like badgers changed due to dry weather conditions during the spring 2017.
“A badger had dug its way into my garden and killed all three hedgehogs. Then went into a friend’s garden and killed the hedgehogs there, leaving bloody badger footprints and blood all over the patio. Another friend found her hedgehog turned inside out, that had been eaten by a badger and everybody else has lost all their hedgehogs. We reckon that is because of the drought, badgers would normally be eating worms and they are trying desperately to feed young at this time of year. Although badgers are the only thing that can eat hedgehogs, they wouldn’t normally do it unless they were desperate. Our hedgehog population has gone back down to zero from what I can tell. There are wildlife effects to drought that I am very conscious of” (Conservation volunteer, Participant #3 - INT).
The narratives also revealed that some species of birds and frogs were not able to nest and feed during a drought as they normally do, which could ultimately impact their future population growth and possibly longer term diversity. These critical behavioral changes of certain key species could also serve as local indicators of this type of hydrological drought transition in the Eden.
The spawning of migratory fish such as the Atlantic salmon, or lack thereof, also seemed to be another indicator of hydrological drought conditions although this was quite complex as drought (low flows) is one of a combination of factors perceived to be contributing to this problem. Participant #17, a long-time angler in the catchment, explains further:
“I’ve fished the river Eden for nearly fifty years now and have watched it gradually decline from a very healthy river to one that doesn’t, is not able to support migratory fish, annually. Fish catches have dropped, dramatically, over the whole of Scotland. I know there are other reasons for it ... But, in recent years, particularly in dry weather, the fish have, instead of running up the river in June, July and August, have accumulated in the estuary, due to low water or water conditions or conditions which are not favourable for fish running ... Low water flows have to support higher volumes of effluent. The amount of water which has been drawn out of the river has got a serious effect on it. It affects the gravel beds that the fish spawn in because of the low flows no longer are able to scour the gravel and certain weeds, ranunculus weeds, are drying off which no longer give cover for juvenile fish, leading to higher predation. They will not run up the river in the summer months ... as a fisherman, it’s extremely worrying to see this happen” (Recreational fisherman, Participant #17 - RVK).
Here we see how he perceives that various land use activities interact with meteorological conditions to impact negatively on the spawning and migration of specific fish species in the Eden catchment. Interestingly, the anglers we talked with were not able to give precise figures of what “low water level” was critical, as the interaction of quantity and quality was perceived as more important. This seemed to be based on an intuitive judgment developed through interactions and experiences with the river over several decades. Anglers were concerned that intensive irrigation practices, impacting cumulatively downstream in the catchment, could exacerbate low water flows on the river during dry or drought periods, thereby impeding the conditions required for successful spawning. In addition to affecting spawning, visual evidence of fish kills was observed and recorded during the 2018 summer drought (Figure 7), and were said to correspond to extreme low flow levels (<1 Q95). Here the low flows were quantifiable through the Q95 index, alongside the intuitive judgment used above. This shows how narrative and science evidence could be combined to better understand the potential impacts in a given sector and guide decision-making in water resource management.
Water Supply Drought
While there is no record of any water supply failure in the Eden catchment within living memory, some narrative participants highlighted themes that were important from a water supply point of view. These included issues around abstraction, water quality and health, private water supplies and recreation. Although there was a general perception that Scotland was a wet country among members of the public, different thresholds of adaptation emerged within the narratives. These were usually shaped by one or a combination of past experiences of drought, and expert guidance that future climate change dictates a need for such behavioral change. For instance, we found people (incomers) with experiences of drought from elsewhere, e.g., from Southeast England, were importing water efficient practices in a catchment where the dominant narrative was that there were abundant water supplies. This was exemplified in the story of one former London resident, who shared how he built a passive house in the Eden catchment to conserve not only money and energy, but also water, based on his experiences of living with periods of water scarcity in England.
“Our house is close to ‘Passive’ house …. and water is one we want to minimalize …. Water meter was one part of it …. Toilet with dual flush and extra low, the bath we looked at we did a water saving bath …. A++ washing machine. We couldn’t have a tumble drier. It had to be a heat pump dryer. Taps were low consumption and I have also fitted them with one litre a minute restriction.” (Local resident, Participant #18 – FAS1).
However, this drive to implement water saving measures into the house was overshadowed by the challenge of installing a water meter in Scotland. Here, households are not required to install water meters, and as such it was a major difficulty for the householder to embark on this particular adaptation measure.
“Down south, water is in short supply there is hose pipe bans. So it made some sense to control it a little. In Scotland it doesn’t seem to be the same. They say oh it is part of your rates …. I can’t find out how to do it. I have called the water company and they say they will call me. I can’t find any info on what it costs. I just hit a blank wall.” (Local resident, participant #18).
Participant #10 complained about investing in a large water tank (see Figure 9) for gardening needs following a drought in the 1980s in response to expert guidance at the time that “it was likely to be the pattern in the future.” He considered that the investment was not warranted, as there had not been any major droughts since the 1980s event. These two examples illustrate how thresholds in adaptive behaviors can sometimes be challenged by various factors in the water sector, as well as the nature and uncertainty of future climate change. This also indicates a potential space for the combined use of scientific and narrative data in decision-making.
Discussion
Our research shows tensions and opportunities in the interplay between the scientific thresholds and perceptual thresholds within different catchment stakeholder groups, as evidenced through the narratives garnered. Here we return to our four aims.
Aim 1: To explore the concept of “drought thresholds” from scientific and narrative perspectives and their comparison, in context of spatial and temporal variations in drought in the catchment.
Hydrological modeling uses continuous variables such as precipitation, river flow and groundwater levels, against which thresholds can be defined for operational or analytical purposes. Some of these variables can be focused at a point, such as a rain gauge, borehole, flow gauge or abstraction point, while others may be focused on a whole catchment, best illustrated by catchment-averaged rainfall. Data source availability may define which focus is used. Even a catchment-averaged value may fail to capture the variability in conditions present within a catchment as a whole.
While the numbers in a hydrological report may be quite precise, the decision about whether to act, e.g., to issue a drought order/water shortage order, is ultimately a judgment to be exercised by statutory decision-makers. In Scotland, this responsibility rests with government Ministers, suitably informed by Scottish Water and SEPA. So actually, while some might expect that community perceptions and actions may be nuanced and subjective, experience across DRY generally indicates key decisions in the water industry may be too. Decisions to be made by Ministers could be seen to fit within the range of conditions during which there may be scope to regard the need for actions to lie within some range of hydrological uncertainty. In such uncertainty, Beven (2016) encourages hydrologists to communicate more explicitly and openly about it in their modeling, not least while communicating with decision-makers.
Perceptual thresholds for public/community awareness and action will vary subjectively depending on a variety of factors, including the nature and extent of people’s connections to signs of emerging drought, with the “most severe drought” determined by their activities and goals at the time of the event. Even within a sector, our Eden case-study indicates that drought experiences can be diverse. For example, farming activity in the Eden catchment is varied, with grain, vegetables, soft fruits (raspberries) and livestock all experiencing drought conditions in different ways, which mean that metrics used need intra-sector attuning.
Local geography and catchment hydrology also play a part in controlling drought risks. Variations in soil type cropped up as a local factor for some impacts, e.g., light sandy soils and increased vulnerability to the “stoor.” Farmers’ narratives related to potatoes, irrigation and location in the catchment – a lack of water in some lower tributaries due to upstream abstraction – suggests perhaps the need for spatially varying impact thresholds. The spatial and temporal aspects of drought experienced are linked to the impacts of base flow from the sandstone aquifer. Other thresholds emerge from the narrative data e.g., drought-induced potato shortage leading to demand/supply imbalance; the intersection of seasonal factors when dust blows off cultivated fields or when fire risk to vegetation occurs; when technology or experience indicates irrigation need for farmers and gardeners; and the thresholds determined externally by the water companies leading to hosepipe ban or potential water supply failure and stand pipes. It is not just spatial scale that is important. A need exists to better match the seasonal resolution of quantitative hydrological thresholds to particular local activities, resource needs, habitats and species lifecycles etc., e.g., the seasonal and catchment specific nature of salmon runs or seasonal variations in demand for irrigation water.
In the Eden catchment, drought conditions are not as frequent or as long as in the southern United Kingdom (e.g., in chalk catchments like the Berkshire Pang, another DRY case-study catchment). People may have variable and imprecize drought memories, particularly when impacts may be more muted and hidden in their experience and locale. People generally do not remember the date of a drought but they remember the event when they are personally (and emotionally) impacted. Memories that did exist varied significantly in their detail and temporal precision, given also variability in the formality of recording/archiving something that is “not there” (in diaries, photos etc.). Hence local memories may be in conflict. Mismatch also existed between what is displayed on scientists’ time-series graphs and what people actually remember which is not easily captured on a hydrological time series. These are the indicators that traditional scientific thresholds do not consider. In addition, in the Eden catchment, perceptual thresholds of particular stakeholders, e.g., the extent of “low water levels” that influence recreational fisheries, are not quite definable in narratives, again illustrating a sort of “fuzzy knowledge.”
Aim 2: To evaluate the perceived thresholds for drought impacts by different stakeholders across sectors and their connection, and how this maps against scientific indices and thresholds.
This poses questions as to how scientific definitions of thresholds can be more flexible to incorporate these types of local knowledges and their links to actions, so adding to research and practice on drought severity and drought perception. In the Eden catchment, such local knowledge included farmers’ detailed weather journals or diaries with records of rainfall, soil and crop conditions. Farming also provides a good example of perceptual thresholds influencing thresholds for action. Farmers have potential to access technical innovation with soil moisture monitoring devices but do not necessarily use them. Rather some use sensory judgements of thresholds—tactile and visual interpretations – and experience.
Another variable in unraveling the relationship between scientific and perceptual thresholds is the precise nature and severity of the drought actually experienced, given that all droughts are different. Here differences existed between memories, and associated lay knowledge, of short, sharp summer droughts (e.g., 1984) and long-term droughts that build up over several dry winters (e.g., 1973–1976 drought). In the latter, it is the later stages of the drought that are now remembered, linking beyond the local to extreme drought elsewhere in the United Kingdom. In addition, media coverage beyond the local may influence people’s perceptions and memories. In contrast, the science for the Eden (RDI data) shows lower rainfall for 1973 versus 1976 while people remember 1976 as being worse than 1973.
In the rural Eden catchment, the potential to link scientific and perceptual thresholds also varies in different aspects of the hydrological cycle. Here, the main impacts are those on agriculture, ecosystems and environment, and so the connection with some scientific drought indices is more direct than with others. For example, the simplest connection might be expected to be between thresholds for minimum river flows and perceptions of fish health. Even in this instance, the identification of quantitative thresholds, in terms of flow or depth, does not include important water quality issues. However, some impacts involve a much wider complex network of connections and threshold exceedance. For example, the seasonal dryness of “the stoor,” a complex socio-hydrological system exacerbated by ploughing and exposed soil, is further removed from “direct hydrology” so it becomes harder to pull out hydrological thresholds. Scaling also exists in the operation of thresholds for action (e.g., around supply and demand). For example, drought induced economic thresholds need to be crossed before certain market conditions apply – then farmers who have invested in resilience measures get to reap extraordinary returns while less well-capitalized farmers get less return. Local narratives tell us that the thresholds for the uptake of adaptive practices are not just triggered by drought. Other drivers and externalities exist including the threat of abstraction licences being limited or suspended.
Aim 3: To explore the potential for a framework for science-narrative drought “threshold thinking,” as a way of bridging different types of drought knowledge.
This poses questions about how scientific indices of drought severity and their thresholds can be more flexible to incorporate these types of local knowledges, and to help rethink communication strategies and decision-making in drought risk management that are better tailored to the local at a sub-catchment level. There is a need to develop meaningful drought thresholds that local people can relate to in comparison to apparently somewhat abstract thresholds for physical indices like SPI. This includes ensuring that the choice of drought indices used are best suited to the stakeholder’s activity and impacts, particularly seasonal aspects. It involves co-working longitudinally with stakeholders to identify thresholds of importance to their particular activities. This highlights the potential value of researching locally relevant, catchment-based drought impact indices (e.g., “potato drought,” “salmon drought,” “dairy drought”) within the Eden catchment. Perhaps potential exists to derive farming related drought impact thresholds from detailed farmers’ journals/diaries that could in turn be used to inform scientific thresholds. These different perspectives on thresholds also have particular value–in an emergent risk with impacts that become visible slowly. If we had the data on perceptual thresholds, we could produce a normal distribution curve of where thresholds should be and how this reflects levels of risk aversion. So there is a fuzziness in perceptual thresholds and thresholds of response, and a key question is how to recognize and communicate these uncertainties.
Thus, fuzziness around perceptual thresholds has several facets (including what is remembered, extent of archiving, nature and resilience of activity, emotional connection, physical location in catchment) while hydrological drought indices appear to be more precise. In considering possible frameworks for bringing science and narrative thresholds together, we share two graphical methods of combining scientific and drought thresholds as a basis for dialogue, engagement and to support decision-making, using the Eden catchment as a wider exemplar. The first is by mapping quantitative drought indices against narrative accounts. Such “drought memories” overlaid on the SPI, RDI and Q95 plots act as a way for identifying thresholds, although with acknowledged fuzziness. If we take science indices together with drought memories, we can identify more locally resonant drought impact thresholds (rather than just statistically based thresholds in terms of number of deviations from normal). From Figures 6–10, it appears that SPI or RDI values < −1.5 to −2.0 are associated with significant drought memories/impacts, while an SPI or RDI values in the range < −0.5 to −1.0 has less significant, but still noticeable impacts/memories. Recommending a range for the thresholds is an appropriate way of reflecting the fuzziness, rather than a single quantitative value threshold that is usually used in practice.
Our aspiration was then to create a table or graphic that showed thresholds and their systems connections/interrelations according to sector, season, severity and duration of deficit. In theory, this could be a good way of bringing together the various messages from this research, however, this was challenging in practice. Instead, we aspired to emphasize some of the greatest contrasts in perspectives and vulnerability. Extreme rainfall deficit could be a problem for gardeners while nearby the farmers who have benefit of the aquifer or (if wealthy) irrigation lagoons, or both, are not worried. Not all members of a single sector are situated in the same way – some farmers are vulnerable while others are not. We propose the idea of mapping local indicators to drought stage and/or physical indicator as a precursor to identifying thresholds and a first order systems synthesis (Figure 11 linked to Table 3) building up in scale and severity. Although presented for the Eden, we suggest this could be used more widely as a drought memory mapping methodology within a wider context of “science-stimulated narratives” and “creative participatory science” (Liguori et al., 2021). The drought stage/transition and the affected sectors are likely to be similar from place to place, but the local indicators will change, so this then becomes a tool for consolidating the various local memories/stories to particular local impact areas to make sure that thresholds developed reflect local interests. These could be integrated within locally-relevant themed drought impact indices as articulated above.
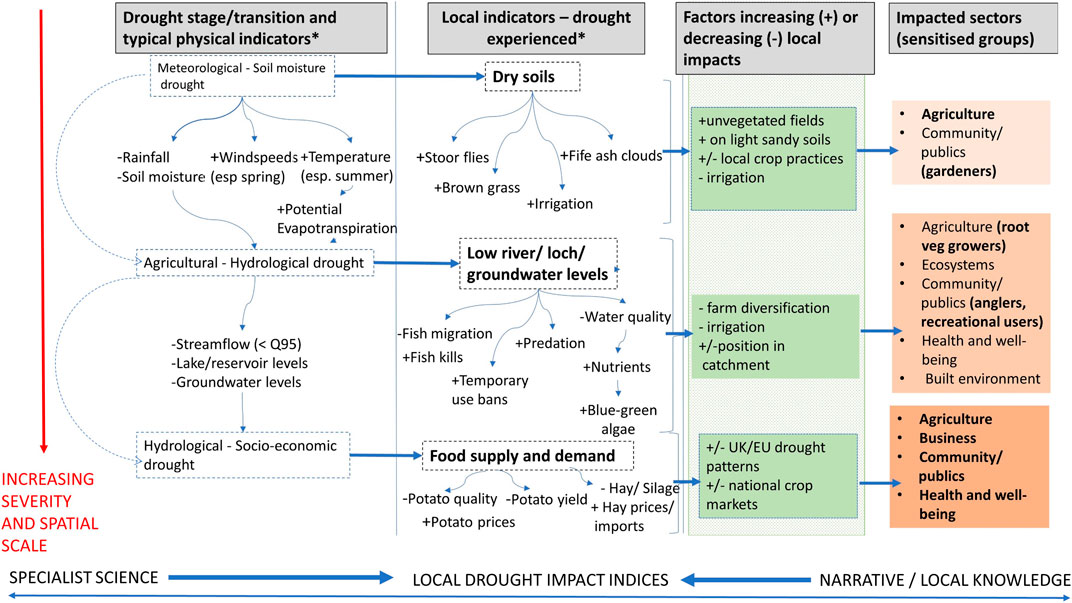
FIGURE 11. Development of a framework for science-narrative drought “threshold thinking.”
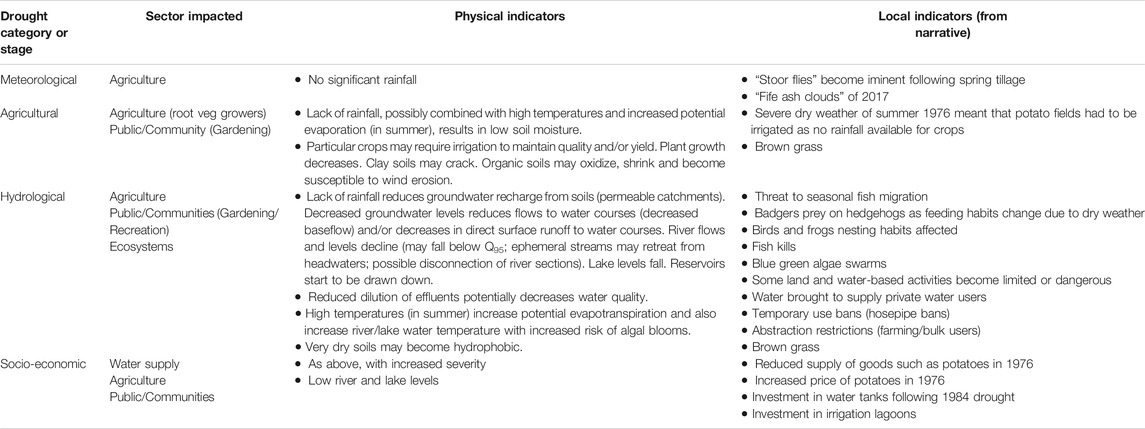
TABLE 3. Physical and local indicators of drought in the Fife Eden catchment.
Aim 4: To reflect critically on how this focus on “threshold thinking” might inform the policy and practice of public/community involvement in local drought risk management, including communication and messaging about drought risk.
Having explored the potential for a framework for science-narrative drought “threshold thinking,” some points become apparent. This approach relies on the scientist being prepared to accept the uncertainty associated with defining “fuzzy” impact threshold ranges based on narratives, which contain useful knowledge but are not defined using a traditional numerical framework based on simple threshold exceedances. However, there is a growing awareness of the implicit as well as explicit uncertainties in hydrological data and modeling (e.g., Beven, 2016), and in hydro-social systems (Westerberg et al., 2017), which has been slowly changing hydrological practice. Therefore inclusion of narrative knowledge in the selection of drought indices and threshold development should be encouraged as another facet of improving the exploration of uncertainty as a routine part of hydrological science. It also has implications for practice, in terms of scientists/regulators becoming more comfortable with uncertainty.
For example, it is interesting to compare the fuzzy local thresholds developed above with Scottish Environmental Protection Agency (2020) generic impact thresholds framed in terms of “water scarcity” (see Table 4) and based on NPI and NFI. Although these thresholds are not for exactly the same indices used in this study, the indices are broadly comparable. The fuzzy thresholds (“noticeable” memories/impacts at < −0.5 to −1.0 and “significant” at < −1.5 to −2.0) appear to map quite well with SEPA’s moderate to significant water scarcity. It is revealing that the fuzzy local thresholds imply that drought might only just be on the local radar in some sectors when a water scarcity alert is issued (0.5), and the early warning (0.25) might be being issued too soon or at least before any apparent impacts.
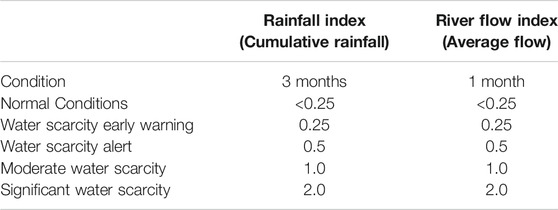
TABLE 4. Scottish Environmental Protection Agency’s Drought scarcity indices (source: Scottish Environmental Protection Agency 2020).
If the “local thresholds” methodology were applied to other catchments, it would be interesting to appraise any national/regional variations – which could reflect local drought resilience/local geography etc. – and hence the need to have local thresholds to ensure relevant drought risk messaging.
The concept of thresholds and the practice of “threshold thinking” provide a creative bridge between different types of knowledge. The policy and practice of public involvement in drought risk management might usefully involve unpicking of how scientific thresholds are perceived and lived locally. Such insights might usefully inform risk communication and messaging so potentially changing the messenger and the nature of the message (Weitkamp et al., 2020), tailoring it to catchment experience and knowledge. We argue that the framework proposed above has the potential to become a key communication tool for messaging with the wider public as it reflects local interests, rather than just the typical approach of “save water, we’re in a drought.”
Similarly local people have strong potential to be the “eyes on the ground” through emerging drought by contributing their geo-referenced, time tagged observations and photographs of impacts through crowdsourcing to build to catchment scale pictures (see #Mapmydrought6), working with statutory organisations as citizen observers. This would have the aspiration to make hidden drought more visible both in catchments but also in the public psyche.
Wider Contexts: Drought and Water Management Futures
There is important future context to our drought “threshold thinking” and need to bring together specialist and lay knowledges to support better local drought risk decision-making. Future climate change scenarios for the Eden catchment reveal more frequent “extreme drought events” (defined when RDI below -2) under high emission scenarios, as compared to the medium and low emission scenarios (see Afzal and Ragab, 2020). The “severe drought event” (defined as RDI between -1.5 and -1.99) was observed two times more often under medium emission scenarios, in comparison to under low and high emission scenarios. The occurrence of extreme drought events could significantly affect important sectors, such as agriculture where more irrigation would be required to irrigate crops during future dry seasons. Brown et al. (2012) already predict very significant increases in irrigation water demand in the Eden catchment. Even under medium emissions, drought will be a future challenge for the Eden catchment. This warrants new ways of understanding how drought unfolds in the catchment and emphasizes the need to identify and understand new types of indicators outside of the traditional hydrological ones.
Taking a step back, water resources have long been studied and managed through a systems approach, linking sources, storage, treatment and distribution infrastructure, and “consumers.” Goals in these systems are avoidance of supply failures, plus a balance of such statutory requirements and other priorities as deemed locally important, e.g., environmental protection, financial costs, fisheries interests, etc. Forecasting skill as a precursor to management interventions is often tackled as a numerical challenge, e.g., Madrigal et al. (2018). Hewett et al. (2020) argue that a holistic approach to catchments as systems is necessary for effective management, integrating spatial and temporal variability, and both quantity and quality dimensions in water resources management. However, system goals themselves also require periodic review and revision. McLoughlin et al. (2020) argue for reflexive learning in adaptive management of water resource systems, emphasizing challenges of decision-making in contexts of uncertainty and complexity, thereby promoting evolutions in thinking about actual goals and how they may be achieved. Similar thinking can be extended to the setting of thresholds used in local drought management, and construing that task in creative participatory ways. In Europe, introduction of the Water Framework Directive was partly inspired by the necessity for stakeholder engagement (beyond being “consumers”), and recognition of diverse and potentially incompatible needs. These may easily be under maximum strain during drought periods. Bringing together different types of evidence for better determining thresholds to support multi-stakeholder decision-making is arguably a critical part of this process.
Conclusion
There are major advantages of unpicking and interweaving disciplinary understandings of thresholds in developing increased understanding of what “drought is” in a given catchment, with multiple stakeholders. Using “thresholds” as a creative bridging concept in interdisciplinary science-narrative research can bring together how different physical types of drought can be perceived, experienced and remembered locally. This recognizes that local drought can be perceived in diverse ways, depending on prior stakeholder capital and socio-environmental connections. This influences the extent to which the hidden risk becomes cognitively revealed—how gradual or rapid, with what impacts on whom, and with what local thresholds of awareness and action. Our research demonstrates the need for different thinking about how drought is defined locally – in terms of less abrupt fuzzy thresholds, complex systems controlled by local and external factors, and as spatial and temporal in its physical and perceptual construction. This feeds into important research questions about how we can better define combinations of conditions leading to local threshold crossing.
We proffer our deliberations about the character of a framework for integrative science-narrative “threshold thinking,” critiquing its strengths and challenges. Such “threshold thinking” has important implications for research and practice: in developing new participatory ways of linking drought severity and perception, and in locally tailored drought risk communication to promote adaptation and transformation to future drought. This is particularly important in maritime catchments where public narratives of wetness dominate, with large variations in drought experience and diverse thresholds for impact within and across sectors.
Data Availability Statement
The datasets presented in this article are not readily available because some data are already in the public domain (dryutility.info); anonymised interviews will be lodged in the ESRC data portal after project completion (Dec 2020). Requests to access the datasets should be directed to ZHJ5QHV3ZS5hYy51aw==.
Ethics Statement
The studies involving human participants were reviewed and approved by the University of the West of England Ethics Committee. The patients/participants provided their written informed consent to participate in this study.
Author Contributions
LM, AB, and JB contributed to conception and design of the DRY study. KB organized the narrative database and performed the science-narrative graphical analysis with LM. MA performed the scientific modeling and visualization. LM, KB and AB wrote the first draft of the manuscript, with JB and MA writing sections. JB contributed to science-narrative thinking, with KB, LM and JB contributing to the “Framework.” All authors contributed to manuscript revision, read, and approved the submitted version.
Funding
The DRY (Drought Risk and You) project was funded through United Kingdom Natural Environmental Research Council Grant (Nos: NE/L01033X/1, NE/L010283/1, and NE/L010291/1) involving Natural Environmental Research Council (NERC), Arts and Humanities Research Council (AHRC); Biotechnology and Biological Sciences Research Council (BBSRC); Economic and Social Research Council (ESRC) and Engineering and Physical Sciences Research Council (EPSRC).
Conflict of Interest
The authors declare that the research was conducted in the absence of any commercial or financial relationships that could be construed as a potential conflict of interest.
Acknowledgments
The contributions of the wider DRY research consortium are acknowledged, as are those of participants in the Fife Eden catchment, DRY’s Eden Catchment Local Advisory Group, DRY’s Scottish Stakeholder Competency Group and Fife Agricultural Association.
Supplementary Material
The Supplementary Material for this article can be found online at: https://www.frontiersin.org/articles/10.3389/fenvs.2021.589980/full#supplementary-material.
Footnotes
1dryproject.co.uk.
2SPI and NPI are broadly similar, just using slightly different assumptions about rainfall distribution to express deviation from normal. An equivalent for NFI (Normalized Flow Index) would be SSI (Standardized Streamflow Index). RDI is more focused on soil moisture/agriculture as it looks at ratio of rainfall to PE. SPI is more well-known than SEPA’s NPI.
3https://nrfa.ceh.ac.uk/derived-flow-statistics
4https://www.ruralpayments.org/publicsite/futures/topics/all-schemes/agri-environment-climate-scheme/management-options-and-capital-items/water-use-efficiency---irrigation-lagoon/
5https://historicdroughts.ceh.ac.uk/content/drought-tools
6https://dryutility.info/mapmydrought
References
Afzal, M., and Ragab, R. (2020). Assessment of the potential impacts of climate change on the hydrology at catchment scale: modelling approach including prediction of future drought events using drought indices. Appl. Water Sci. 10, 215. doi:10.1007/s13201-020-01293-1
Bell, S. (2009). The driest continent and the greediest water company: newspaper reporting of drought in Sydney and London. Int. J. Environ. Stud. 66 (5), 581–589. doi:10.1080/00207230903239220
Beven, K. (2016). Facets of uncertainty: epistemic uncertainty, non-stationarity, likelihood, hypothesis testing, and communication. Hydrol. Sci. J. 61 (9), 1652–1665. doi:10.1080/02626667.2015.1031761
Blair, P., and Buytaert, W. (2016). Socio-hydrological modelling: a review asking "why, what and how?" Hydrol. Earth Syst. Sci. 20 (1), 443–478. doi:10.5194/hess-20-443-2016
Blake, J. R., and Ragab, R. (2014). Drought Risk and You (DRY): case study catchments - physical characteristics and functioning. Wallingford: NERC/Centre for Ecology and Hydrology, 70. Available at. http://nora.nerc.ac.uk/id/eprint/508990/. (Accessed June 01, 2020).
Bourbonnais, A., and Michaud, C. (2018). Once upon a time: Storytelling as a knowledge translation strategy for qualitative researchers. Nurs. Inq. 25 (4), e12249. doi:10.1111/nin.12249
Brown, I., Dunn, S., Matthews, K., Poggio, L., Sample, J., and Miller, D. (2012). Mapping of water supply-demand deficits with climate change in Scotland: land use implications. CREW report 2011/CRW006.
Bryan, K., Ward, S., Barr, S., and Butler, D. (2019). Coping with drought: perceptions, intentions and decision-stages of south west England households. Water Resour. Manage. 33 (3), 1185–1202. doi:10.1007/s11269-018-2175-2
Bryan, K., Ward, S., Robert, L., White, M., Landeg, O., Taylor, T., et al. (2020). The health and well-being effects of drought: assessing multi-stakeholder perspectives through narratives from the UK. Clim. ChangeRisk Anal. 163 (9), 2073–2095. doi:10.1007/s10584-020-02916-x
Bubeck, P., Botzen, W. J. W., Kreibich, H., and Aerts, J. C. J. H. (2013). Detailed insights into the influence of flood-coping appraisals on mitigation behaviour. Glob. Environ. Change 23 (5), 1327–1338. doi:10.1016/j.gloenvcha.2013.05.009
Clifford, M. J., Royer, P. D., Cobb, N. S., Breshears, D. D., and Ford, P. L. (2013). Precipitation thresholds and drought-induced tree die-off: insights from patterns of Pinus edulis mortality along an environmental stress gradient. New Phytol. 200, 413–421. doi:10.1111/nph.12362
Cook, B. R., Kesby, M., Fazey, I., and Spray, C. (2013). The persistence of 'normal' catchment management despite the participatory turn: exploring the power effects of competing frames of reference. Soc. Stud. Sci. 43, 754–779. doi:10.1177/0306312713478670
Dagel, K. C. (1997). Defining drought in marginal areas: the role of perception. Prof. Geographer 49 (2), 192–202. doi:10.1111/0033-0124.00069
Doornkamp, J. C., Gregory, K. J., and Burn, A. S. (Editors) (1980). Atlas of drought in britain 1975-76. London: Institute of British Geographers.
Environment Agency (2017). Drought response: our framework for England. Bristol, UK: Environment Agency, 32.
EU Water Framework Directive (2000/60/EC). The EU Water Framework Directive - integrated river basin management for Europe. Available at. https://ec.europa.eu/environment/water/water-framework/index_en.html (Accessed October 23, 2000).
Fernald, A., Guldan, S., Boykin, K., Cibils, A., Gonzales, M., Hurd, B., et al. (2015). Linked hydrologic and social systems that support resilience of traditional irrigation communities. Hydrol. Earth Syst. Sci. 19 (1), 293–307. doi:10.5194/hess-19-293-2015
Gavin, H., Hammond, C., and Piper, B. (2014). Managing through drought: code of practice and guidance for water companies on water use restrictions – 2013 [incorporating lessons from the 2011-12 drought], report No. 14/WR/33/6. London: UK Water Industry Research, 111.
Gebrehiwot, T., and Van Der Veen, A. (2015). Farmers prone to drought risk: why some farmers undertake farm-level risk-reduction measures while others not? Environ. Manage. 55 (3), 588–602. doi:10.1007/s00267-014-0415-7
Gosling, R. D., Zaidman, M., Wann, M., and Rodgers, P. J. (2012). “How low can you go? Using drought indices to protect environmental flows in Scottish rivers,” in BHS Eleventh National Symposium, Hydrology for a changing world, Dundee, 9‐11 July, Dundee, British Hydrological Society: Wallingford (ed. C Kirby).
Grothmann, T., and Patt, A. (2005). Adaptive capacity and human cognition: the process of individual adaptation to climate change. Glob. Environ. Change 15 (3), 199–213. doi:10.1016/j.gloenvcha.2005.01.002
Grothmann, T., and Reusswig, F. (2006). People at risk of flooding: why some residents take precautionary action while others do not. Nat. Hazards 38 (1-2), 101–120. doi:10.1007/s11069-005-8604-6
Hewett, C. J. M., Wilkinson, M. E., Jonczyk, J., and Quinn, P. F. (2020). Catchment systems engineering: an holistic approach to catchment management. WIREs Water 7, e1417. doi:10.1002/wat2.1417
Holmes, A., and McEwen, L. J. (2020). How to exchange stories of local flood resilience from flood rich areas to the flooded areas of the future. Environ. Commun. 14(5):597-613. doi:10.1080/17524032.2019.1697325
Jain, V. K., Pandey, R. P., Jain, M. K., and Byun, H.-R. (2015). Comparison of drought indices for appraisal of drought characteristics in the Ken River Basin. Weather Clim. Extremes 8, 1–11. doi:10.1016/j.wace.2015.05.002
Joseph, R., Proverbs, D., and Lamond, J. (2015). Homeowners' perceptions of property-level flood risk adaptation (PLFRA) measures: the case of the summer 2007 flood event in England. Int. J. Saf. Secur. Eng. 5 (3), 251–265. doi:10.2495/safe-v5-n3-251-265
Kelly, R. P., Erickson, A. L., Mease, L. A., Battista, W., Kittinger, J. N., and Fujita, R. (2015). Embracing thresholds for better environmental management. Phil. Trans. R. Soc. B 370 (1659), 20130276. doi:10.1098/rstb.2013.0276
Lewis, P. J. (2011). Storytelling as research/research as storytelling. Qual. Inq. 17 (6), 505–510. doi:10.1177/1077800411409883
Liguori, A., McEwen, L., Blake, J., and Wilson, M. (2021). Towards 'creative participatory science': exploring future scenarios through specialist drought science and community storytelling. Front. Environ. Sci. 8, 589856. doi:10.3389/fenvs.2020.589856
Lindell, M. K., and Perry, R. W. (1993). “Risk area residents' changing perceptions of volcano hazard at mt. st. Helens,” in Prediction and perception of natural hazards. Advances in natural and technological hazards research. Editors J. Nemec, J. M. Nigg, and F. Siccardi (Dordrecht: Springer), Vol. 2. doi:10.1007/978-94-015-8190-5_19
Link, R., Wild, T. B., Snyder, A. C., Hejazia, M. I., and Vernon, C. R. (2020). 100 years of data is not enough to establish reliable drought thresholds. J. Hydrol. 7, 100052. doi:10.1016/j.hydroa.2020.100052
Linton, J., and Budds, J. (2014). The hydrosocial cycle: defining and mobilizing a relational-dialectical approach to water. Geoforum 57, 170–180. doi:10.1016/j.geoforum.2013.10.008
Liu, J., Dietz, T., Carpenter, S. R., Alberti, M., Folke, C., Moran, E., et al. (2007). Complexity of coupled human and natural systems. Science 317, 1513–1516. doi:10.1126/science.1144004
Maddux, J. E., and Rogers, R. W. (1983). Protection motivation and self-efficacy: a revised theory of fear appeals and attitude change. J. Exp. Soc. Psychol. 19 (5), 469–479. doi:10.1016/0022-1031(83)90023-9
Madrigal, J., Solera, A., Suárez-Almiñana, S., Paredes-Arquiola, J., Andreu, J., and Sánchez-Quispe, S. T. (2018). Skill assessment of a seasonal forecast model to predict drought events for water resource systems. J. Hydrol. 564, 574–587. doi:10.1016/j.jhydrol.2018.07.046
Mankad, A., Greenhill, M., Tucker, D., and Tapsuwan, S. (2013). Motivational indicators of protective behaviour in response to urban water shortage threat. J. Hydrol. 491, 100–107. doi:10.1016/j.jhydrol.2013.04.002
Mazzocchi, F. (2006). Western science and traditional knowledge. Despite their variations, different forms of knowledge can learn from each other. EMBO Rep. 7, 463–466. doi:10.1038/sj.embor.7400693
McEwen, L., Garde-Hansen, J., Holmes, A., Jones, O., and Krause, F. (2016). Sustainable flood memories, lay knowledges and the development of community resilience to future flood risk. Trans. Inst. Br. Geogr. 42 (1), 14–28. doi:10.1111/tran.12149
McEwen, L. J., and Blake, J. (2020). Unnatural drought. Environmental Scientist. London. Available at: https://www.the-ies.org/environmental_scientist. (Accessed June 01, 2020).
McLoughlin, C. A., Thoms, M. C., and Parsons, M. (2020). Reflexive learning in adaptive management: a case study of environmental water management in the Murray Darling Basin, Australia. River Res. Applic 36 (4), 681–694. doi:10.1002/rra.3607
Meadows, D. (2003). Digital storytelling: research-based practice in new media. Vis. Commun. 2 (2), 189–193. doi:10.1177/1470357203002002004
Mishra, A. K., and Singh, V. P. (2010). A review of drought concepts. J. Hydrol. 391, 202–216. doi:10.1016/j.jhydrol.2010.07.012
Morid, S., Smakhtin, V., and Moghaddasi, M. (2006). Comparison of seven meteorological indices for drought monitoring in Iran. Int. J. Climatol. 26, 971–985. doi:10.1002/joc.1264
Morris, D. G., and Flavin, R. W. (1990). “A digital terrain model for hydrology,” in Proc. 4th International Symposium on Spatial Data Handling, Zurich, Columbus: International Geographical Union IGU, Commission on Geographic Information Systems, Department of Geography, The Ohio State University (ed. Kurt Brassel, H. Kishimoto). Jul 23-27. 1, 250–262.
Morris, D. G., and Flavin, R. W. (1994). Sub-set of UK 50 m by 50 m hydrological digital terrain model grids. Wallingford: NERC, Institute of Hydrology.
Murphy, J., Sexton, D., Jenkins, G., Booth, B., Brown, C., Clark, R., et al. (2009). UK climate projections science report: climate change projections. Exeter: Met Office Hadley Centre.
Nakashima, D. J. (2016). Local and indigenous knowledge at the science-policy interface. Paris: UNESCO.
National Records of Scotland (2020b). Fife Council Area Profile: Population estimates. Available at: https://www.nrscotland.gov.uk/files//statistics/council-area-data-sheets/fife-council-profile.html (Accessed July 29, 2020).
National Records of Scotland (2020a). Mid-2019 population estimates Scotland. Available at: https://www.nrscotland.gov.uk/statistics-and-data/statistics/statistics-by-theme/population/population-estimates/mid-year-population-estimates/mid-2019 (Accessed July 29, 2020).
National River Flow Archive (2020). 14001Eden at Kemback: Catchment info". Online resource at. Available at: https://nrfa.ceh.ac.uk/data/station/spatial/14001. (Accessed June 01, 2020).
Nguyen, G., and Nguyen, T. T. (2020). Exposure to weather shocks: a comparison between self-reported record and extreme weather data. Econ. Anal. Pol. 65, 117–138. doi:10.1016/j.eap.2019.11.009
Ó Dochartaigh, B. É. (2004). The physical properties of the upper devonian/lower carboniferous aquifer in Fife. British Geological Survey Internal Report IR/04/003. Available at: http://nora.nerc.ac.uk/id/eprint/12638/1/IR04003.pdf. (Accessed June 01, 2020).
Obidiegwu, J., Bryan, G., Jones, H., and Prashar, A. (2015). Coping with drought: stress and adaptive responses in potato and perspectives for improvement. Front. Plant Sci. 6, 542. doi:10.3389/fpls.2015.00542
Papagiannaki, K., Kotroni, V., Kotroni, V., Lagouvardos, K., and Papagiannakis, G. (2019). How awareness and confidence affect flood-risk precautionary behavior of Greek citizens: the role of perceptual and emotional mechanisms. Nat. Hazards Earth Syst. Sci. 19, 1329–1346. doi:10.5194/nhess-19-1329-2019
Paulo, A. A., and Pereira, L. S. (2006). Drought concepts and characterization. Water Int. 31 (1), 37–49. doi:10.1080/02508060608691913
Poussin, J. K., Bubeck, P., Aerts, J. C. J. H., and Ward, P. J. (2012). Potential of semi-structural and non-structural adaptation strategies to reduce future flood risk: case study for the Meuse. Nat. Hazards Earth Syst. Sci. 12 (11), 3455–3471. doi:10.5194/nhess-12-3455-2012
Rogers, R. W. (1975). A protection motivation theory of fear appeals and attitude Change1. J. Psychol. 91 (1), 93–114. doi:10.1080/00223980.1975.9915803
Schwarzer, R. (1992). “Self-efficacy in the adoption and maintenance of health behaviours: theoretical approaches and a new model,” in Self-efficacy: thought control of action. Editor R. Schwarzer (Washington, DC: Hemisphere).
Scottish Development Department (1986). The 1984 drought in Scotland: its effect on river systems and public water supplies. Civil Eng. Water Serv. Edinburgh.
Scottish Environment Protection Agency (2020). Scotland's national water scarcity plan. Stirling, Scotland, UK: Scottish Environment Protection AgencyAvailable at: https://www.sepa.org.uk/media/219302/scotlands-national-water-scarcity-plan.pdf. (Accessed May 14, 2020).
Sivakumar, B. (2005). Hydrologic modeling and forecasting: role of thresholds. Environ. Model. Softw. 20 (5), 515–519. doi:10.1016/j.envsoft.2004.08.006
Slim, H., Thompson, P., Bennett, O., and Cross, N. (2006). Ways of interviewing in perks, R and thomson, A the oral history reader. 2nd Edition. London: Routledge, 114–125.
Solano-Hernandez, A., Bruzzone, O., Groot, J., Laborda, L., Martínez, A., Tittonell, P., et al. (2020). Convergence between satellite information and farmers’ perception of drought in rangelands of North-West Patagonia, Argentina. Land Use Policy 97, 104726. doi:10.1016/j.landusepol.2020.104726
Swyngedouw, E. (2009). The political economy and political ecology of the hydro-social cycle. J. Contemp. Water Res. Educ. 142 (1), 56–60. doi:10.1111/j.1936-704x.2009.00054.x
Taylor, V., Chappells, H., Medd, W., and Trentmann, F. (2009). Drought is normal: the socio-technical evolution of drought and water demand in England and Wales, 1893-2006. J. Hist. Geogr. 35, 568–591. doi:10.1016/j.jhg.2008.09.004
Tayplan (undated). The strategic development planning authority for dundee, perth, angus and north Fife. Available at: https://www.tayplan-sdpa.gov.uk/development_area/356. (Accessed May 14, 2020).
Thorne, J. M., Savic, D. A., and Weston, A. (2003). Optimised conjunctive control rules for a system of water supply sources: roadford reservoir system (U.K.). Water Resour. Manage. 17, 183–196. doi:10.1023/a:1024157210054
Tsakiris, G., Pangalou, D., and Vangelis, H. (2007). Regional drought assessment based on the reconnaissance drought index (RDI). Water Resour. Manage. 21 (5), 821–833. doi:10.1007/s11269-006-9105-4
Van Loon, A. F., Gleeson, T., Clark, J., Van Dijk, A. I. J. M., Stahl, K., Hannaford, J., et al. (2016). Drought in the Anthropocene. Nat. Geosci 9, 89–91. doi:10.1038/ngeo2646
Water Resources (Scotland) Act (2013). Acts of the Scottish Parliament. Available at: https://www.legislation.gov.uk/asp/2013/5/2017-01-01. (Accessed May 14, 2020).
Weitkamp, E., McEwen, L. J., and Ramirez, P. (2020). Communicating the hidden: towards a framework for drought risk communication in maritime climates. Clim. Change 163, 831–850. doi:10.1007/s10584-020-02906-z
Westerberg, I. K., Di Baldassarre, G., Beven, K. J., Coxon, G., and Krueger, T. (2017). Perceptual models of uncertainty for socio-hydrological systems: a flood risk change example. Hydrol. Sci. J. 62 (11), 1705–1713. doi:10.1080/02626667.2017.1356926
Wilhite, D. A., and Glantz, M. H. (1985). Understanding: the drought phenomenon: the role of definitions. Water Int. 10 (3), 111–120. doi:10.1080/02508068508686328
Zaalberg, R., Midden, C., Meijnders, A., and McCalley, T. (2009). Prevention, adaptation, and threat denial: flooding experiences in The Netherlands. Risk Anal. 29 (12), 1759–1778. doi:10.1111/j.1539-6924.2009.01316.x
Zaidman, M. D., Anderton, A., Peacock, A., Kinnear, J., and Lamb, R. (2012). “Development of drought and low flow indices,” in Report prepared by JBA consulting for SEPA project EOSRAD57, March 2012.
Zarch, M. A. A., Sivakumar, B., and Sharma, A. (2015). Droughts in a warming climate: a global assessment of Standardized precipitation index (SPI) and Reconnaissance drought index (RDI). J. Hydrol. 526, 183–195. doi:10.1016/j.jhydrol.2014.09.071
Keywords: indices, drought, decision-making, narrative, thresholds, Scotland, knowledge, memories
Citation: McEwen L, Bryan K, Black A, Blake J and Afzal M (2021) Science-Narrative Explorations of “Drought Thresholds” in the Maritime Eden Catchment, Scotland: Implications for Local Drought Risk Management. Front. Environ. Sci. 9:589980. doi: 10.3389/fenvs.2021.589980
Received: 31 July 2020; Accepted: 08 February 2021;
Published: 14 April 2021.
Edited by:
Ian Holman, Cranfield University, United KingdomReviewed by:
Dolores Rey, Cranfield University, United KingdomSam Grainger, Maynooth University, Ireland
Copyright © 2021 McEwen, Bryan, Black, Blake and Afzal. This is an open-access article distributed under the terms of the Creative Commons Attribution License (CC BY). The use, distribution or reproduction in other forums is permitted, provided the original author(s) and the copyright owner(s) are credited and that the original publication in this journal is cited, in accordance with accepted academic practice. No use, distribution or reproduction is permitted which does not comply with these terms.
*Correspondence: Lindsey McEwen, TGluZHNleS5NY0V3ZW5AdXdlLmFjLnVr