 Fares M. Howari1
 Manish Sharma
 Yousef Nazzal
- 1College of Natural and Health Sciences, Zayed University, Abu Dhabi, United Arab Emirates
- 2UAE Space Agency, Abu Dhabi, United Arab Emirates
In the present research, we carried out detailed chronological and compositional analyses along with detailed spectral analysis of three unnamed craters on the surface of Mars. Knowledge on chronology/age analysis and compositional analysis of Mars’ surface is essential for future manned and unmanned missions. The study area is near the landing site of previous landed missions, which could be used for future landing. The area is interesting to be studied because of its high elevation in the northeastern side and low elevation in the southern side, consisting of three major geological boundaries, i.e., Hesperian, Noachian, and Amazonian, which are further subdivided into fourteen units. Chronological investigations were carried out using the active machine learning approach and Craterstats 2.0 software, which revealed the age plot of 3.09 ± 0.04 Ga for Amazonian, 3.63 ± 0.0 Ga for Hesperian, and 3.73 ± 0.0 Ga for Noachian geological units, stating that N(1) craters’ density corresponds to the early Amazonian, early Hesperian, and late Noachian/early Hesperian periods according to the established crater density boundaries, respectively. Compact Reconnaissance Imaging Spectrometer for Mars (CRISM)-derived browse products are used for the compositional study of the surface characteristics of Mars. A spectral investigation was performed on an unnamed crater belonging to the Amazonian period, which showed to be majorly composed of oxides as the primary mineral, indicating the spectra of hematite, boehmite, and akaganeite. A Hesperian unit-unnamed crater shows the signature of monohydrated sulfates, melilite, illite, and kaolinite minerals in the region. For the unnamed crater 3, which belongs to the Noachian period, it has diagnostic absorptions of clay minerals in their extracted spectra, indicating the sign of long-term water–rock interactions in the period. Derived chronology results and compositional studies of craters help in better understanding the geological formation units of Mars’ surface.
Introduction
Mars is smaller than Earth, although it has the same terrestrial land area. In its early history, Mars was characterized by high rates of fluvial and geological activity, which includes impact cratering, weathering, erosion, and valley formation (Carr and Head, 2010). Unlike Earth, Mars lacks conclusive evidence for plate tectonics and has been able to retain rocks on or near its modern surface from the first billion years of solar system history (Wray, 2019). Therefore, it is no surprise that Mars’ surface recorded a wide variety of physical and geochemical processes and environments. Over the last 15 years, there has been a considerable increase in orbital and in situ data on Mars, revealing detailed information to understand the current and past state of the surface and subsurface (Carr, 1996; Ehlmann et al., 2016). In situ exploration by the Mars Exploration Rovers (MER) and through high-resolution, orbital infrared spectroscopy revealed aqueous alteration of rocks on the Martian surface (Squyres et al., 2004a, b; Arvidson et al., 2006). Mars Reconnaissance Orbiter’s (MRO) Compact Reconnaissance Imaging Spectrometer for Mars (CRISM) (Murchie et al., 2007) shows chemical alteration minerals such as phyllosilicates, hydrous silicates, carbonates, hydrated sulfates, carbonates, perchlorates, iron (oxy-)hydroxides, anhydrous chlorides, and other less common compounds that impose significant limitations on localized geochemical conditions and help refine the planet’s geological evolution (Gendrin et al., 2005; Poulet et al., 2005; Bibring et al., 2006; Ehlmann et al., 2008a, b; Mustard J. et al., 2008; Osterloo et al., 2008; Murchie et al., 2009).
Mars’ long and complex geological history, especially the history of the presence of water, can be uncovered by the understanding of relative and absolute ages of the geological units which were formed or deposited during various geological processes that have been carried out throughout the history of the planet (National Research Council, 2003). This can be achieved by the wealth of data provided by the Viking orbiter and Mars Global Surveyor spacecraft, from which the types and abundances of Mars’ geological units can be surveyed and by deriving the ages of their relative stratigraphic unit. Various geological units of the planet are differentiated and characterized by their topographical, morphological, and spectral characteristics (Howari et al., 2020b). Observations depicted that its terrains are of different ages. Details of the time period by statistics on surface crater density establish a time framework to determine the age and time-ordering Mars history into Noachian (>3.71 Ga), Hesperian (3.71–3.37 Ga), and Amazonian (<3.37 Ga) periods (Hartmann and Neukum, 2001; Nimmo and Tanka, 2005). The oldest period is the Noachian period, named for the old rugged materials of Noachis Terra in the southern highlands. The Hesperian rocks are formed over Noachian units and are distinguished by the northern lowlands ridged plains materials. The Amazonian period is the latest which consists of the Amazonis Planitia plains and volcanic materials (National Research Council, 2003).
This article addresses the derived geological formation unit ages, using crater size frequency distribution (CSFD) technique, of approximately 9 million square km area of Mars covering Amazonian, Hesperian, and Noachian geological units. Three unnamed craters belonging to each of these major geological units had also been studied for detailed mineralogical and spectral analysis. The reason for covering the specific craters in these three geological units is because of the CRISM data availability.
This paper is arranged as follows. First, we detail the detail study area. Then, we present the data and methodology in Section “Data and Methodology.” Then, we present the geological units and geological structures acting in the study area. We discussed in detail the chronological age characterization using CSFD of the Amazonian, Hesperian, and Noachian geological units and compared the derived unit ages with the other existing model age. We also used a CRISM data-derived RGB color composite map and spectral investigation of three unnamed craters belonging to the Amazonian, Hesperian, and Noachian units. We end with a conclusion of study area chronological age analysis using crater size frequency distribution and compositional diversity of craters, which belong to major geological units on Mars’ surface.
Study Area
The present research topic is carried out to explore chronological and compositional studies on Mars. The chronological study was carried out at Latitude 0° North–45° North, Longitude 60° East–120° East, as shown in a globe view in Figures 1A,B at different scales. As can be seen in Figure 1A, the study area is near the MSL (Mars Science Laboratory) and Viking 2 landing site. The Viking 2 mission, which consisted of an orbiter and a lander, was part of the American Viking program to Mars (Moore et al., 1977; Howari et al., 2020a), whereas Mars Science Laboratory (MSL) was launched by NASA, a robotic space probe mission to Mars on November 26th, 2011, which successfully landed (4.5895°S–137.4417°E) in Gale Crater on August 6, 2012 (Vasavada et al., 2014). A compositional study is carried out in three unnamed craters belonging to the Hesperian, Amazonian, and Noachian geological units. Unnamed Crater 1 has a diameter of 8.1 km located at 88°5′29.81″E, 39°36′34.754″N, having an ejecta blanket of 5.8 km from the crater rim (Figure 1C); unnamed crater 2 has a total diameter of 5.2 km located at 118°9′19.104″E, 18°0′27.542″N) with 6.9 km of ejecta from the crater rim (Figure 1D); and unnamed crater 3 is located at 115°32′55.596″E, 32°55′236″N with 7.5 km of diameter (Figure 1E). Geologically, Unnamed Crater 1 crater belongs to the middle Amazonian lowland unit, whereas Unnamed Crater 2 belongs to the Late Hesperian transition unit and Unnamed Crater 3 belongs to the Late Noachian highland unit (Tanaka et al., 2014) as can be seen in the red polygon in Figures 1B, 3. We explored the topography of craters using Mars Orbiter Laser Altimeter (MOLA) data and found that Unnamed Crater 1 has an elevation difference of 400 m and slope values varying from 0 to 24.810 degrees, whereas unnamed crater 2 has a total 1-km elevation difference with slope values from 0 to 38.362 degrees and unnamed crater 3 has a total elevation difference of 950 m and slope angles varying from 0 to 27.485. The slope map of unnamed craters 1, 2, and 3 can be seen in Figure 2.
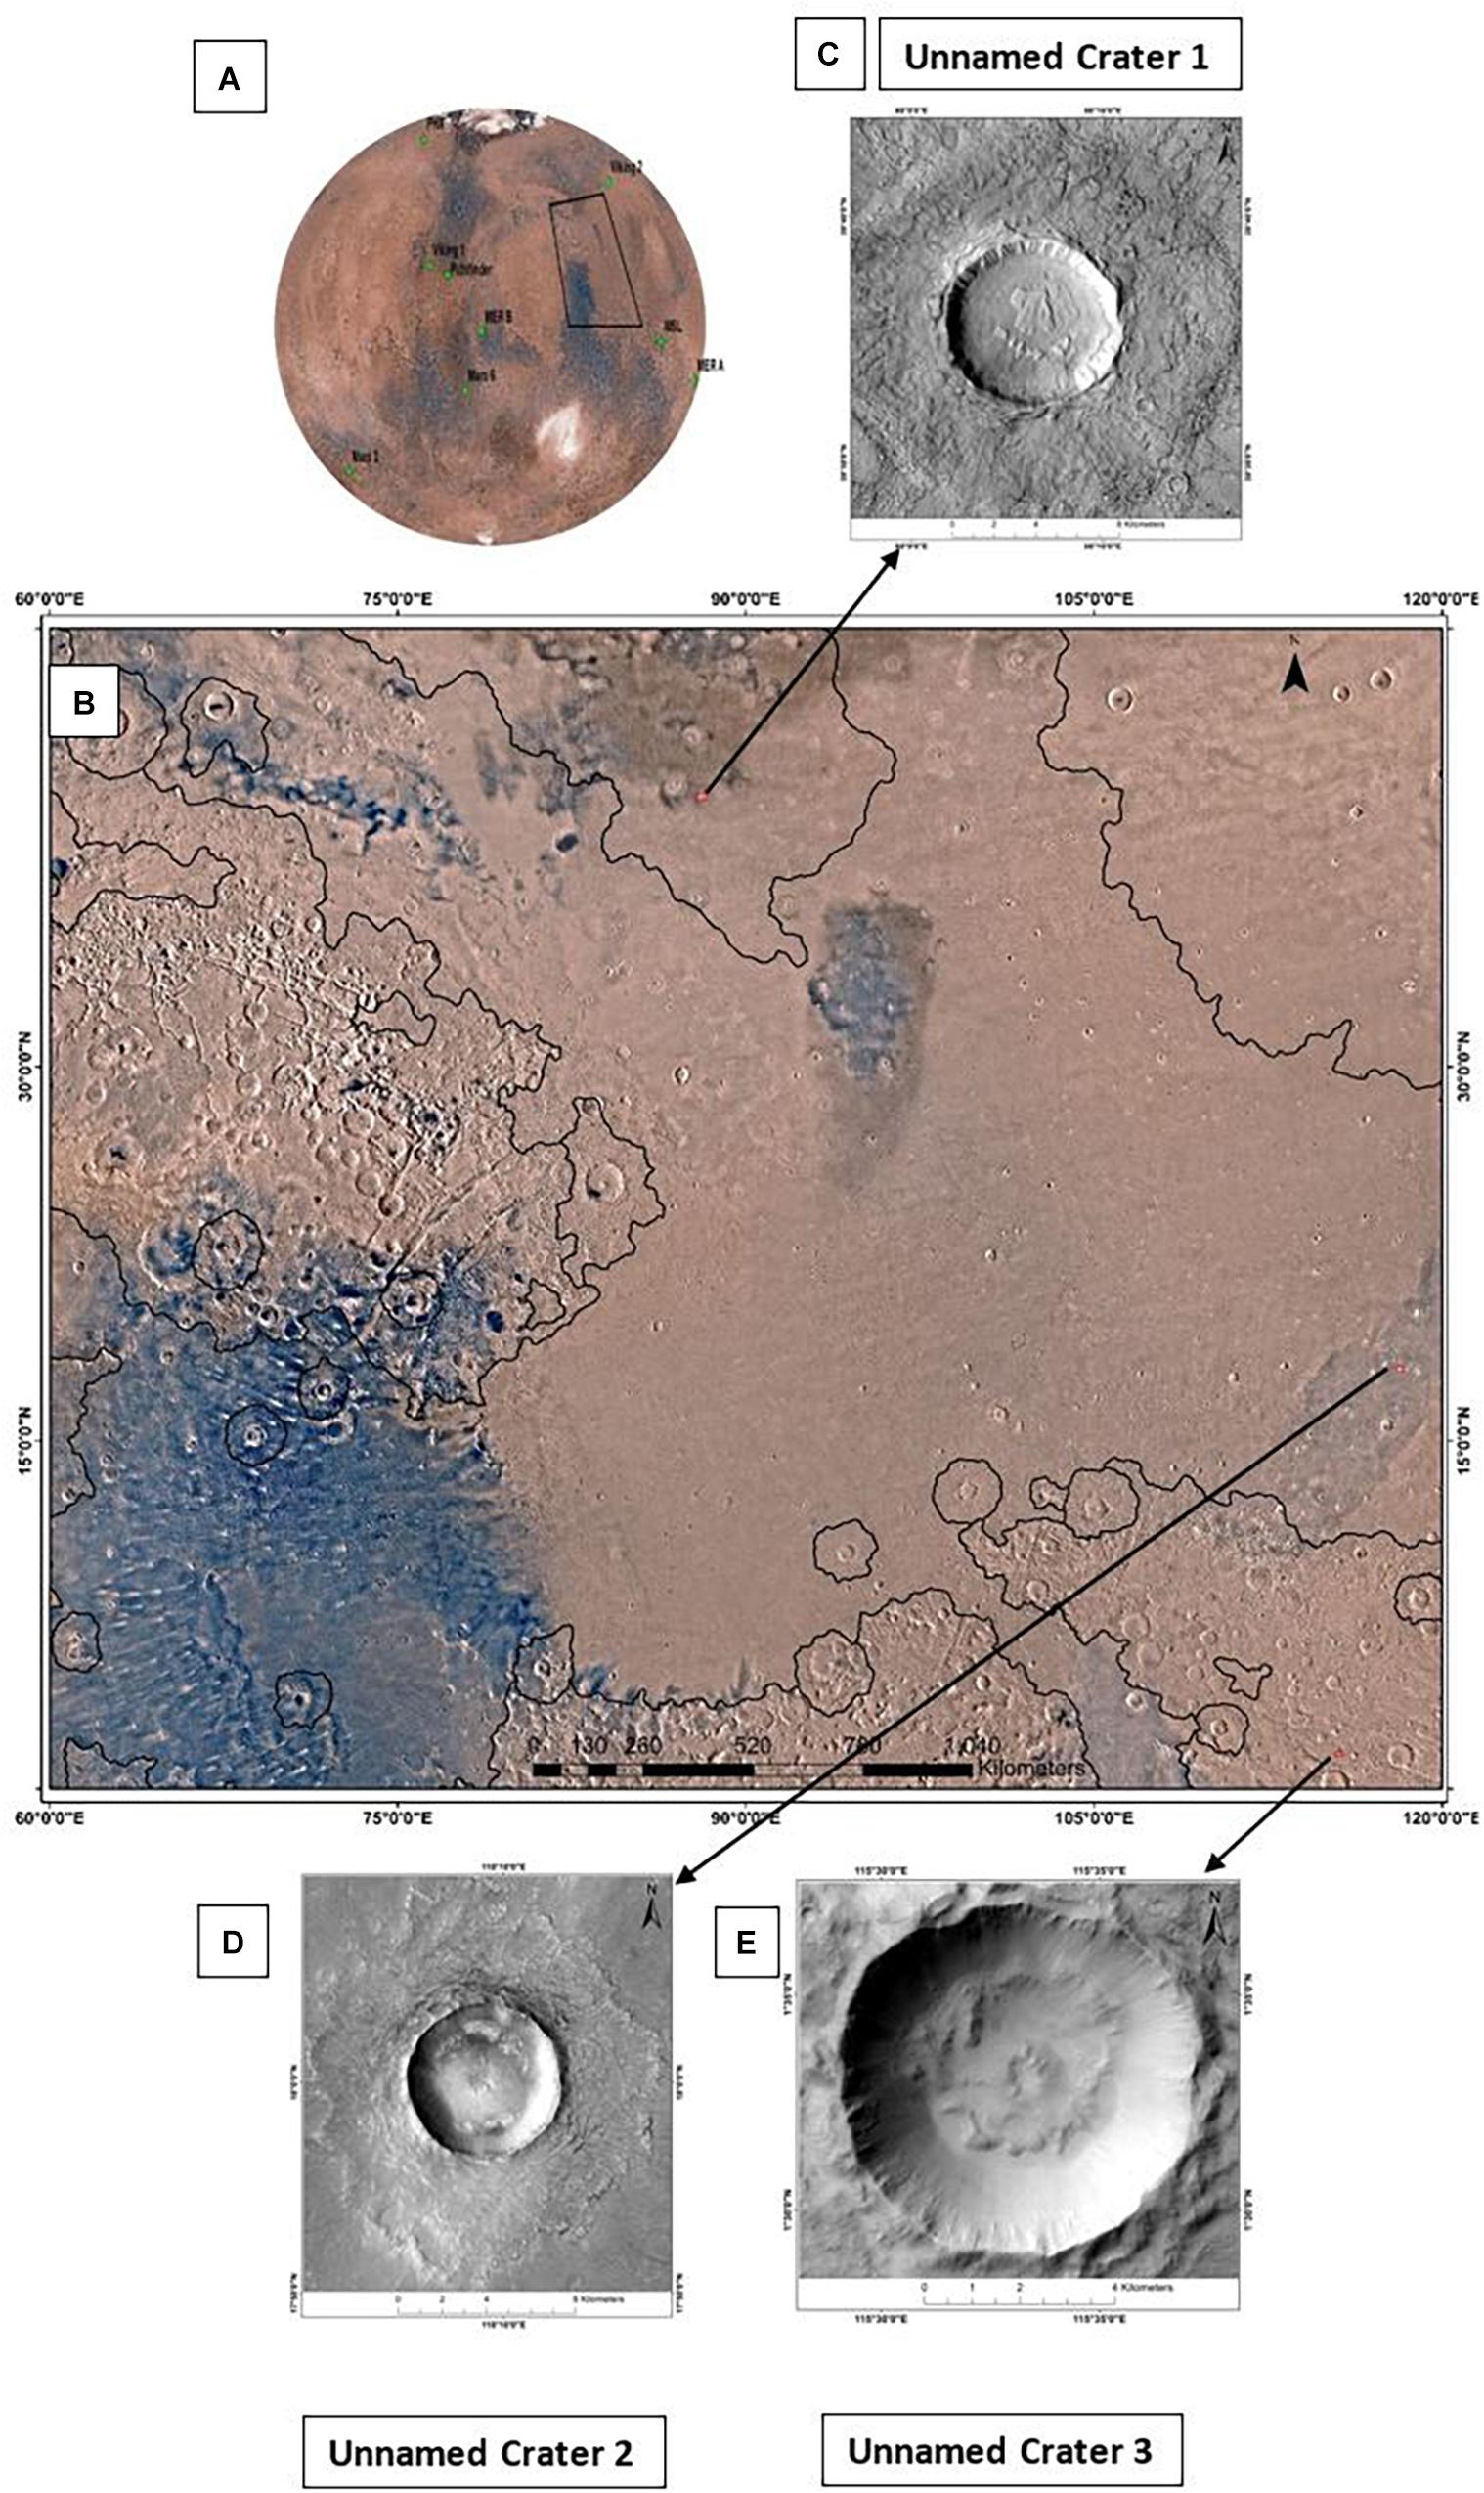
Figure 1. (A) The study area on Mars in a global view used for chronological study, where the black box indicates the targeted studied region. (B) An enlarged view of the region of study in Viking data image with a pixel size of 232 m/pixel. For a detailed mineralogical and spectral study, craters were chosen (C) from the middle Amazonian lowland unit, (D) from the late Hesperian transition unit, and (E) from the late Noachian highland unit.
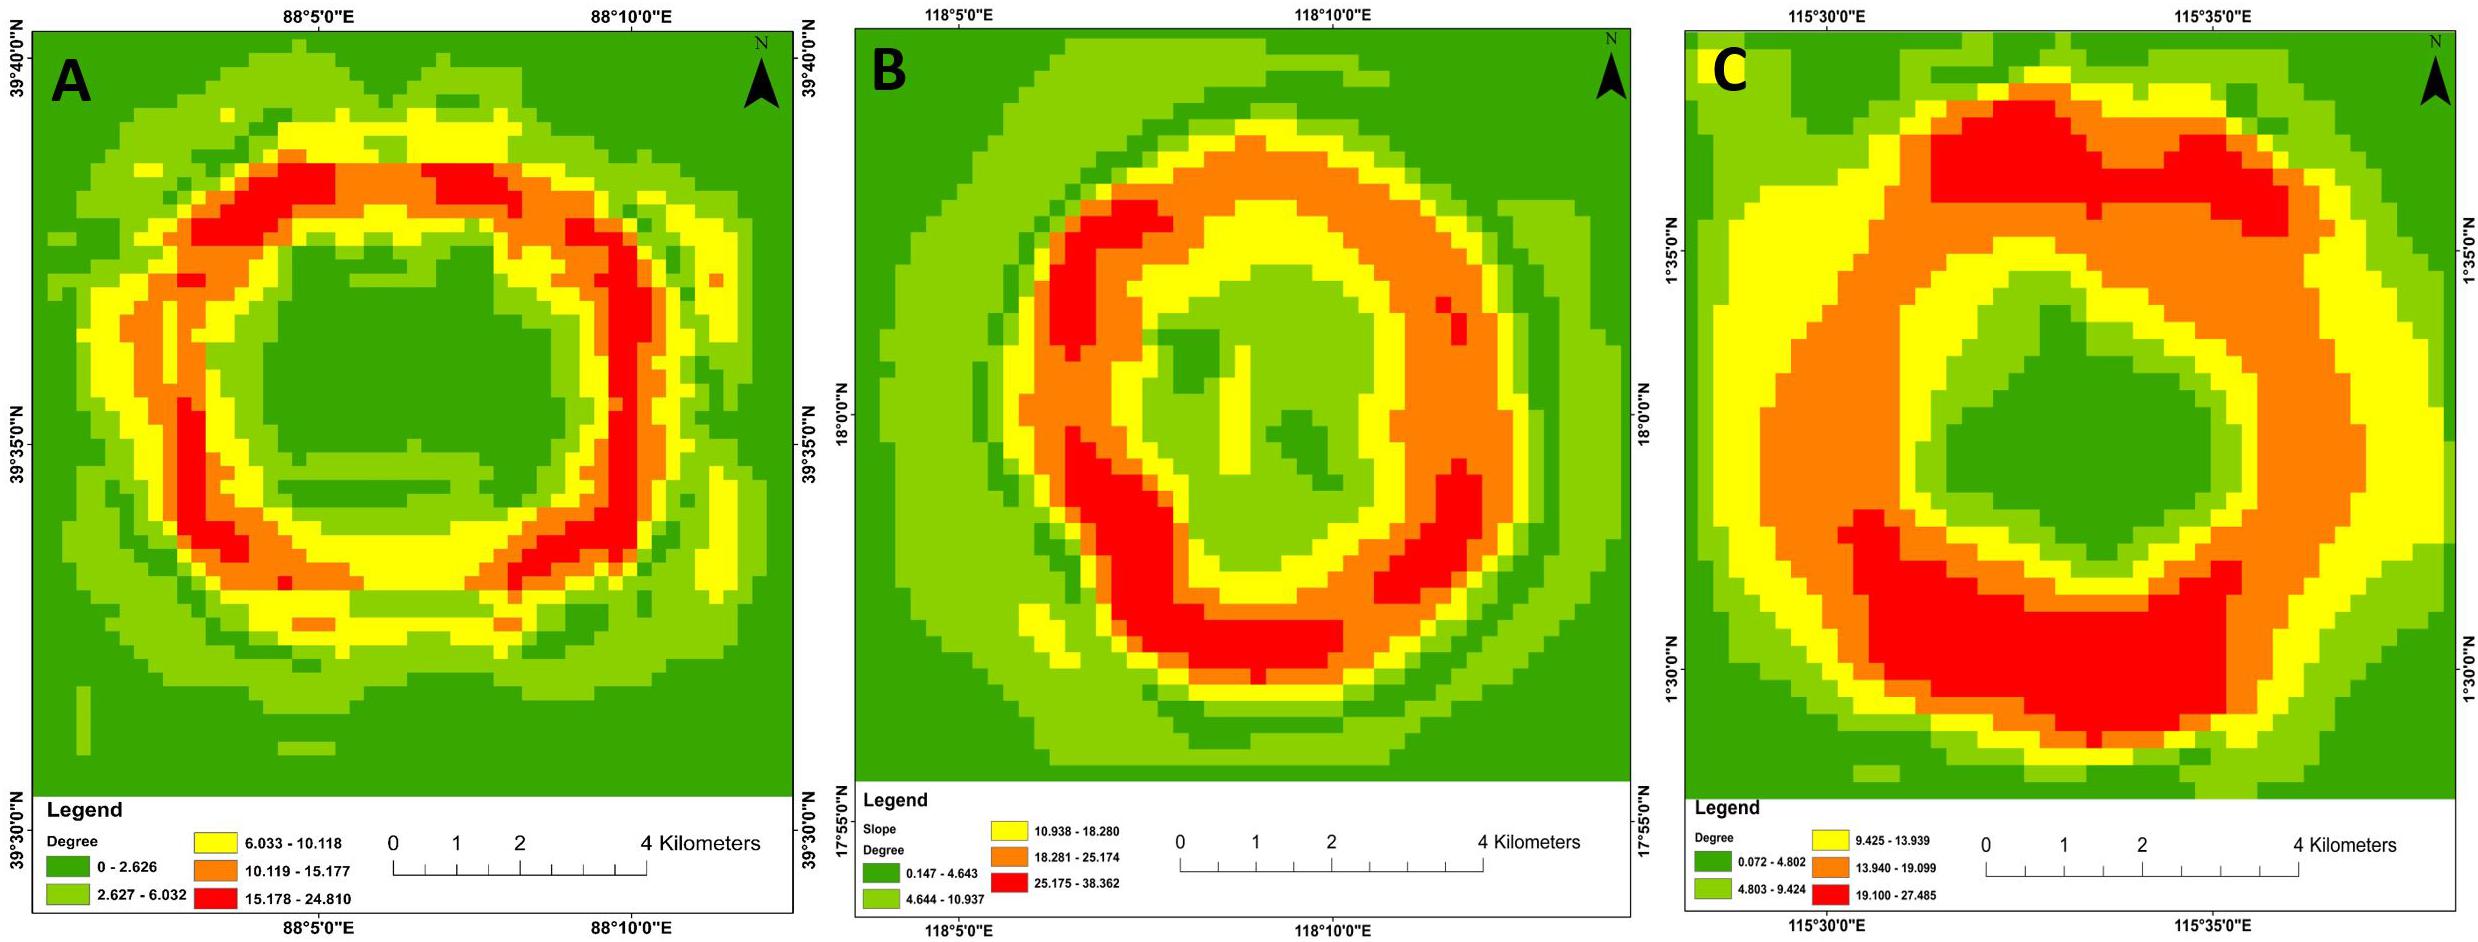
Figure 2. Slope map of (A) Amazonian unit unnamed crater 1, (B) Hesperian unit unnamed crater 2, and (C) Noachian unit unnamed crater 3.
Data and Methodology
In the present research, we utilized CRISM data, Context Camera (CTX), Viking 2 orbiter, and Mars Global surveyor (MGS) spacecraft’s Mars Orbiter Laser Altimeter (MOLA) for the mineralogical, topography, and age analysis of the study area. An active machine learning approach programmed by Wang and Wu (2019) is used for crater detection with greater automation and better performance. The program used the novel active machine learning approach, in which the planetary imagery (CTX and Viking 2 orbiter image) and MOLA DEM (Digital Elevation model) covering the region are used for collecting training samples with more automation and better performance. Crater-size frequency data were then verified using manual measurements within an integrated ArcGIS environment. For the chronological study, we used the crater size greater than 1.5 km. We removed secondary craters introduced in the analysis to get rid of the errors in the study. Craterstats 2.0 is used for chronological age analysis investigations using crater size-frequency distribution data. MOLA DEM is used for topographic analysis in the paper. Slope map and elevation data are acquired using DEM and ArcGIS Software. CTX has provided images that have been used to evaluate the site location carried for the spectral analysis. CTX acquires data at resolution of spatial scale of ∼5–6 m/pixel (Malin et al., 2007). The MRO’s CRISM has been gathering visible and shortwave infrared-reflectance profiles (0.4–3.9 μm) as far as 2006 (Murchie et al., 2007). Such electromagnetic information on materials has advanced our understanding about the surface of Mars, enabling to determine the identity and analysis of the geological process which have created iron- and manganese-rich facies, evaporites, and hydrated deposits of minerals (Ehlmann et al., 2008b; Mustard J. F. et al., 2008; Wray et al., 2011; Carter et al., 2013). The obtained data from CRISM enabled the identification of widespread, diverse mineralogy across the planet’s surface. CRISM investigates aqueous or hydrothermal activity and classify, identify, and analyze surface features’ composition, geology, and stratigraphy of indicative aquatic minerals. The RGB color composite of CRISM (also called as browse products) enables the rapid visual and qualitative multiparametric evaluation of the surface characteristics. FAL, FEM, MAF, HYD, CR2, CHL, and ICE browse products are used to study the RGB composite map composition in the unnamed craters. FAL is an improved infrared false color representation of the scene, whereas FEM is used for mapping the Fe minerals, particularly ferric and ferrous minerals. HYD shows information related to hydrated mineralogy, whereas CHL provides information on chloride deposits. MAF is derived to see the mafic mineralogy distribution in the scene, whereas CR2 browse products help to distinguish the carbonate minerals in the scene, and ICE browse products are mapped to see the information related to water or carbon dioxide frost or ice. The data used and the methodology flowchart are shown in Figure 3.
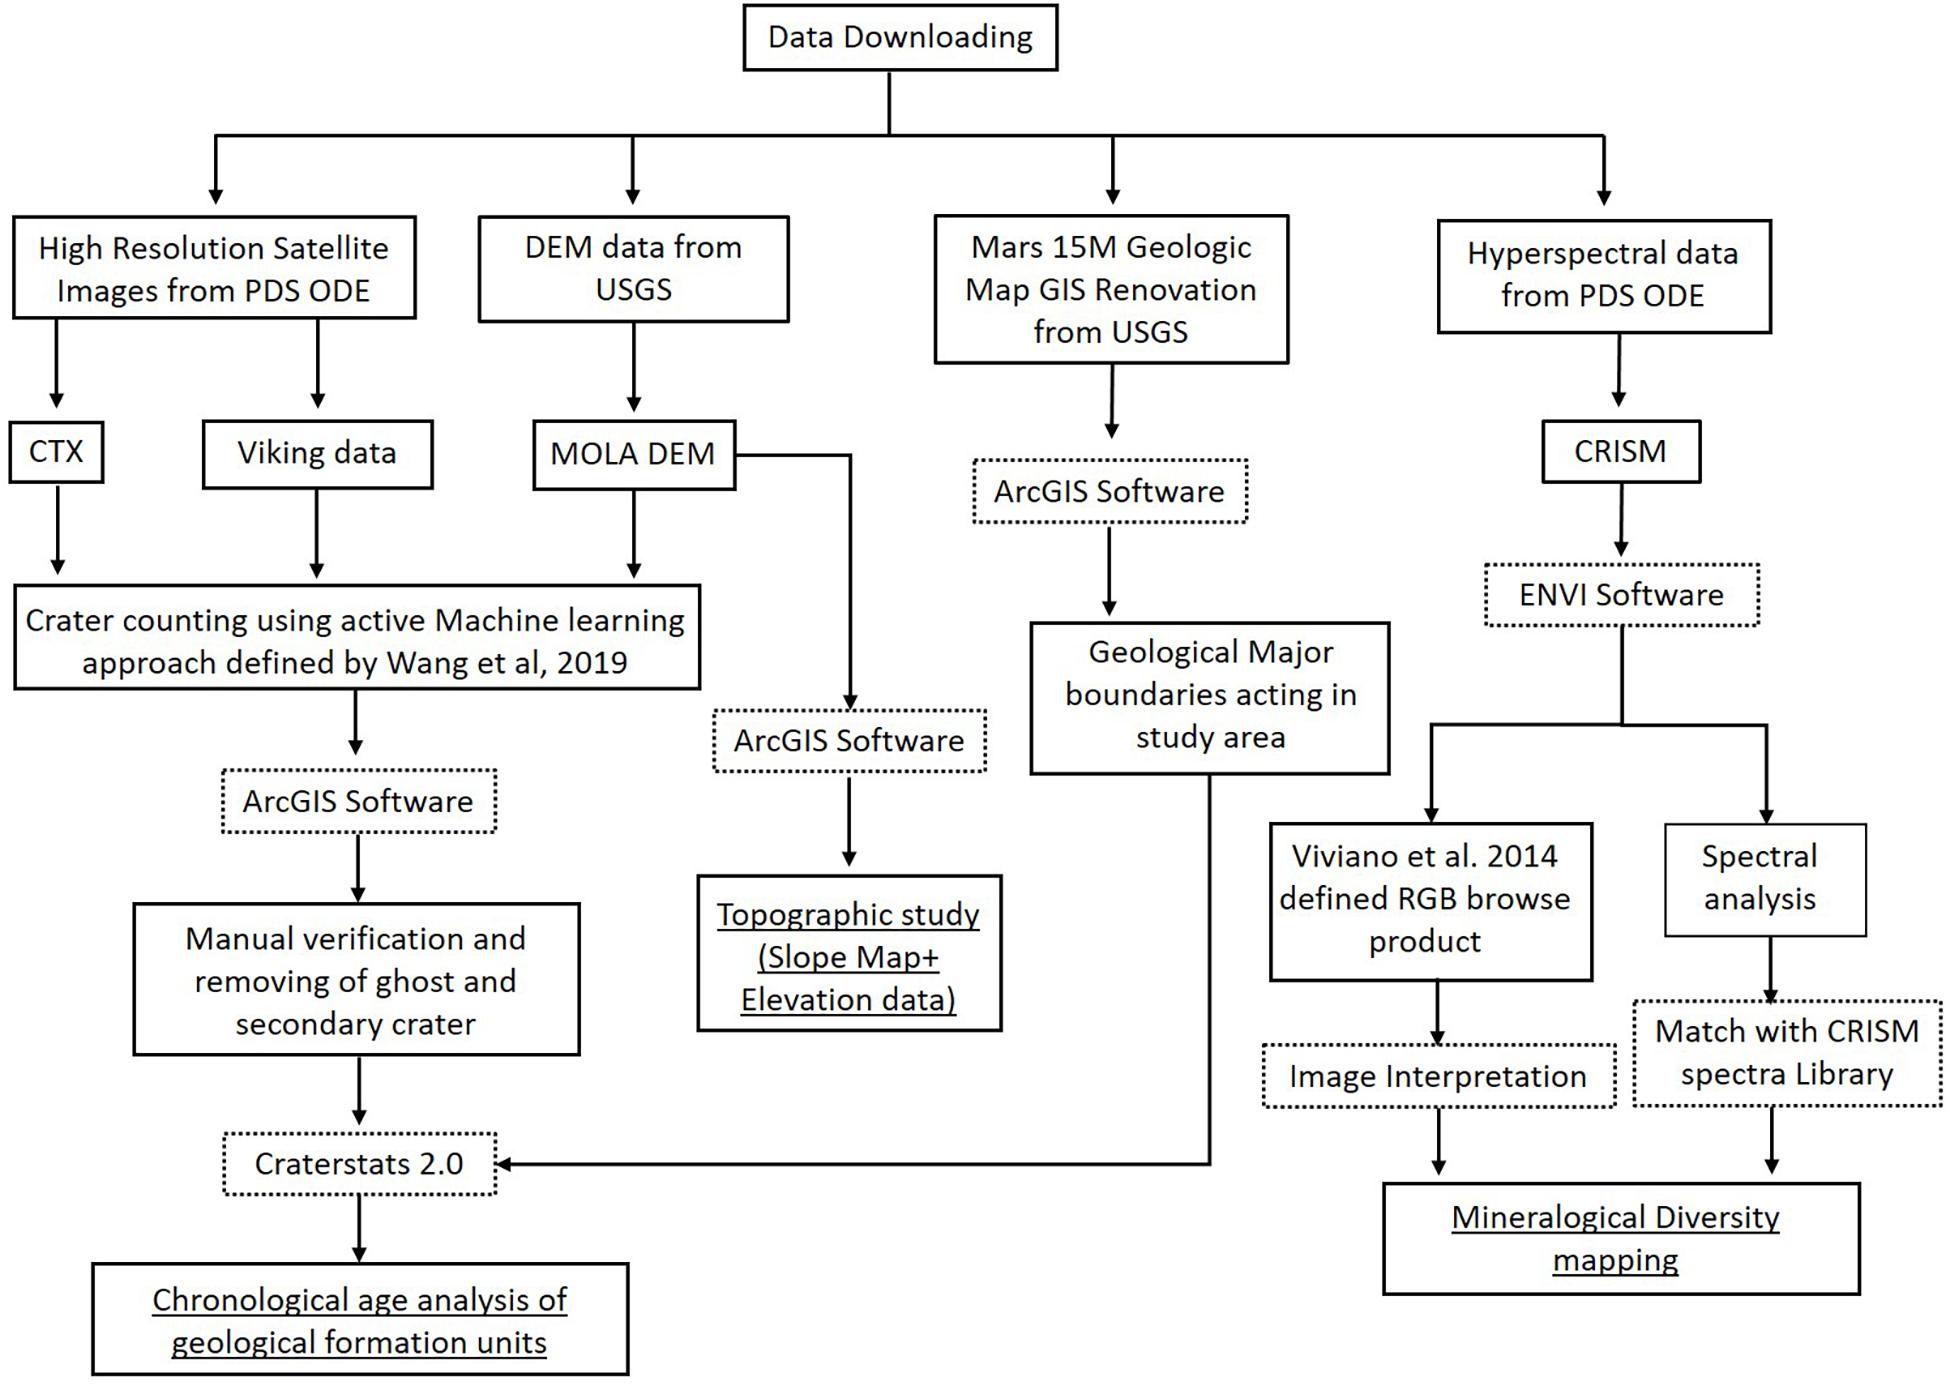
Figure 3. Flowchart of data and methodology used in the study.
Results and Discussion
Geology Map of the Study Area
Mars’ geological map, which records the geologic units and landforms distribution over time on the planet’s surface, is based on the unprecedented variety, quality, and quantity of remotely sensed data. These data have provided spectral, morphologic, thermophysical, topographic, radar sounding, and other observations for integration, analysis, and interpretation in support of geologic mapping (Tanaka et al., 2014). The geology of the study area is composed of three major geological units, i.e., Hesperian, Noachian, and Amazonian units, which have been further subdivided into fourteen geological units such as Ahi (Amazonian and Hesperian impact unit), AHv (Amazonian and Hesperian volcanic unit), Av (Amazonian volcanic unit), HNt (Hesperian and Noachian transition unit), eAb (Early Amazonian basin unit), eHt (Early Hesperian transition unit), eHv (Early Hesperian volcanic unit), eNh (Early Noachian highland unit), IHI (Late Hesperian lowland unit), IHt (Late Hesperian transition unit), INh (Late Noachian highland unit), mAI (Middle Amazonian low-land unit), MNh (Middle Noachian highland unit), and mNhm (Middle Noachian highland massif unit). Talking about geological structures in the study area, it has covered Caldera rim, Channel axis, Crater rim, Graben axis, Lobate flow, Pit crater chain, Ridge, Rille, Scarp, and Wrinkle ridge, in which the scarp and ridge originated from erosional processes, channel axis from fluvial processes, and crater rim from the impact. Wrinkle ridge, Graben axis, and pit crater chain originated from tectonic activity, whereas Lobate flow and Rille originated from volcanic activity. Major geological unit and geological structure mapping in the region is shown in Figure 4.
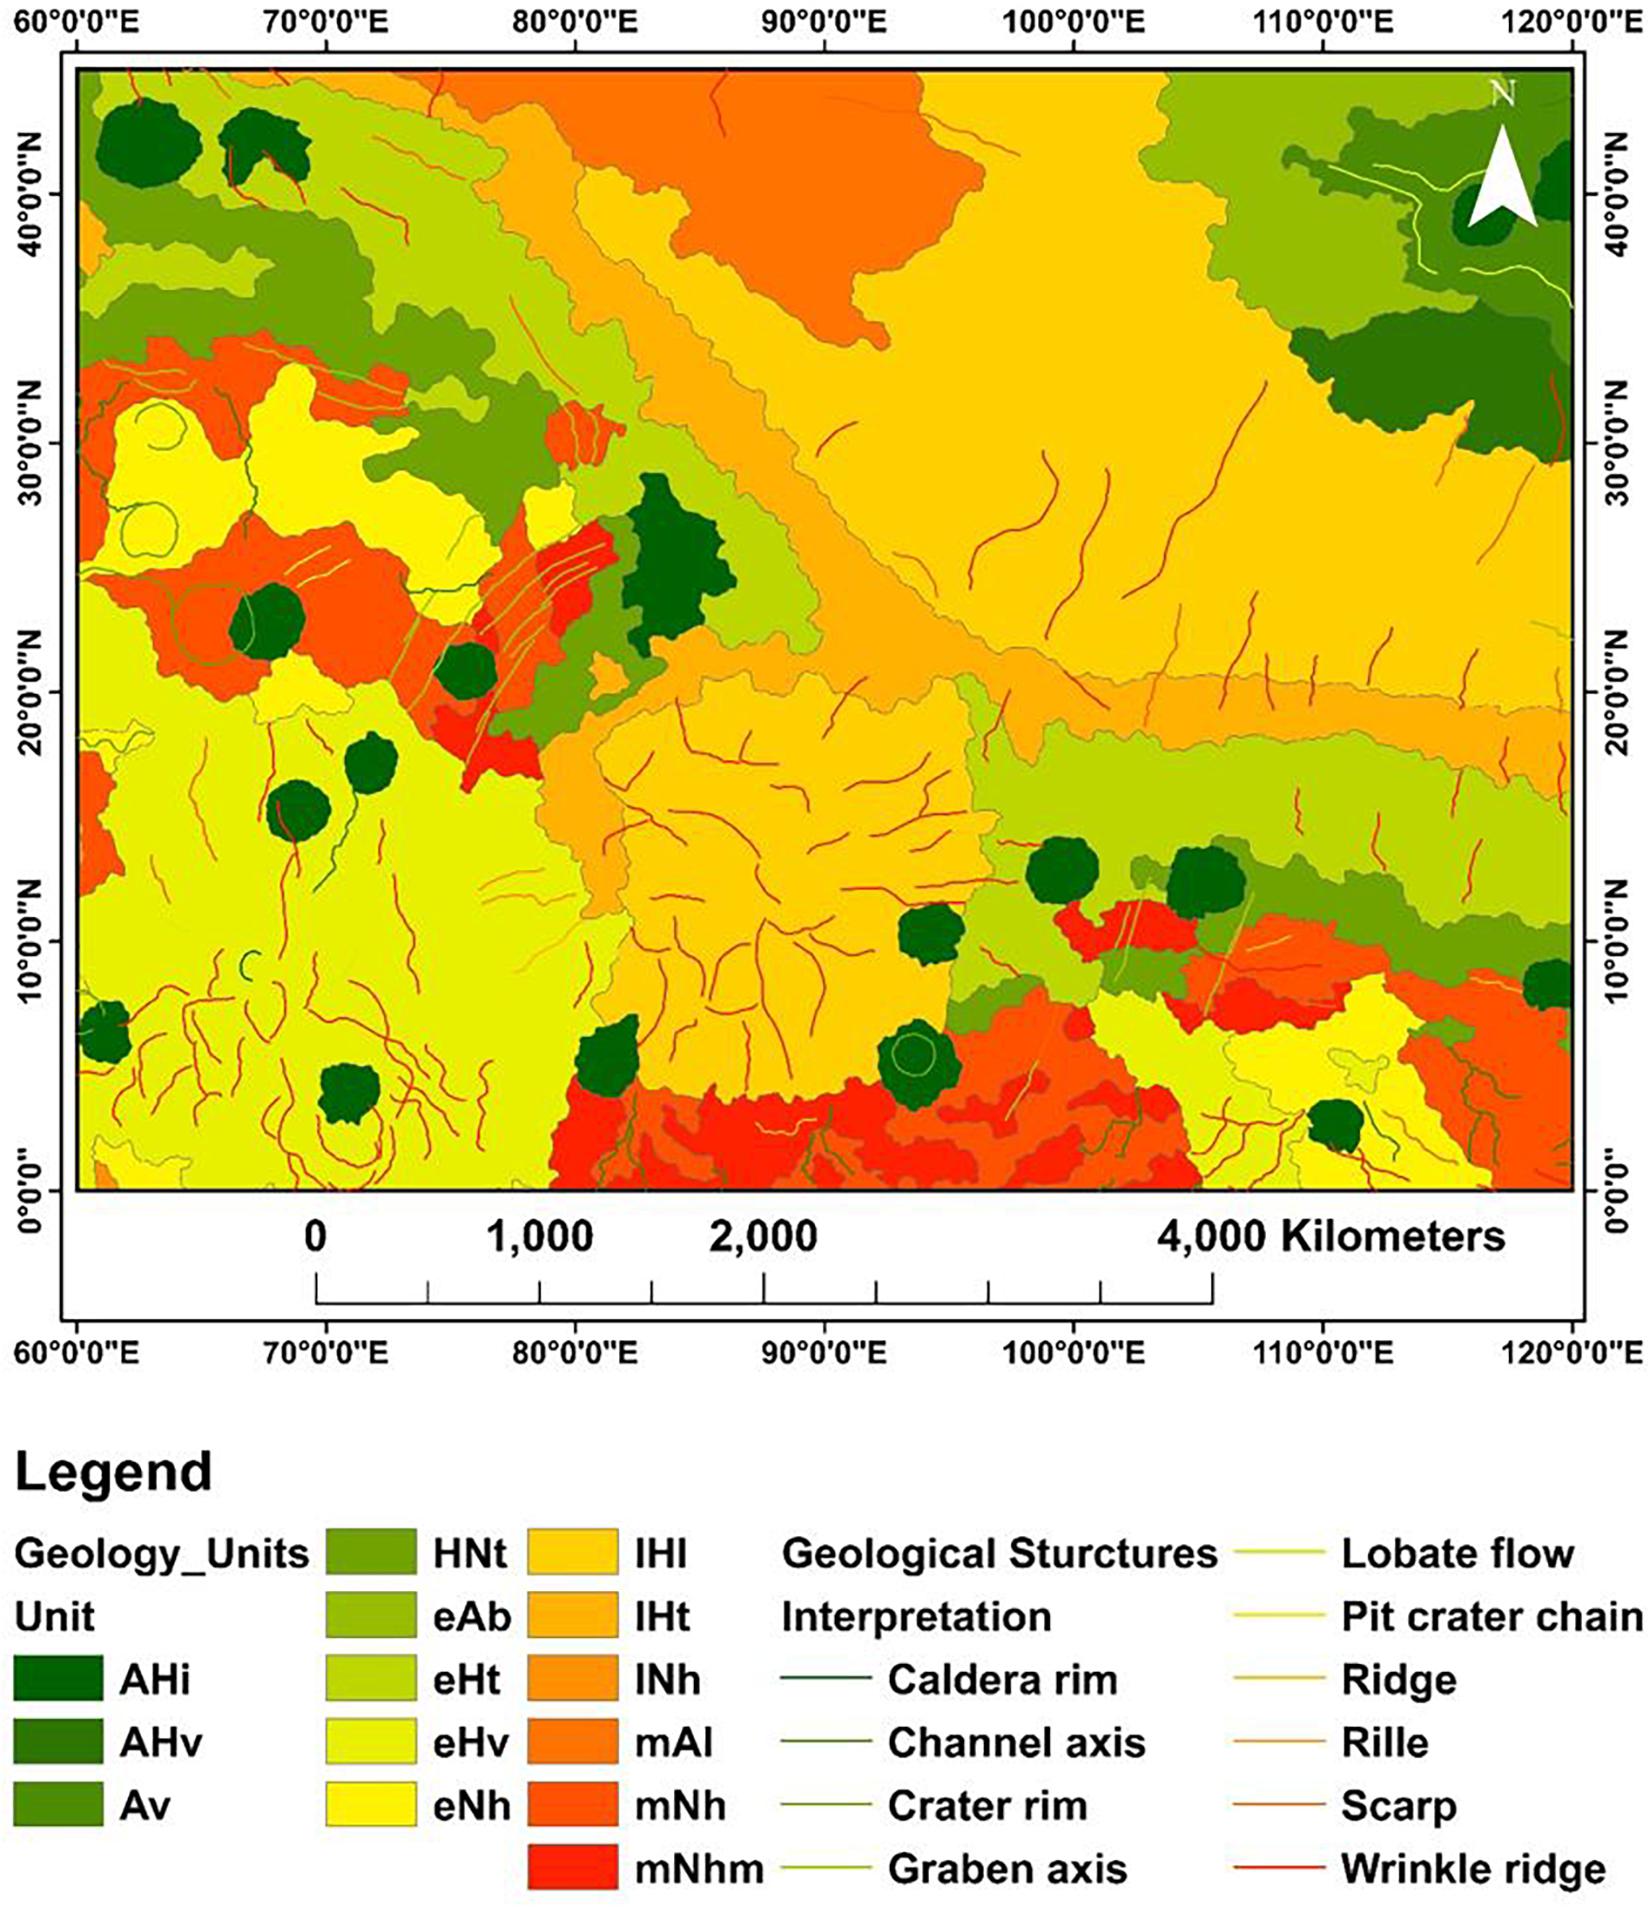
Figure 4. Detailed geological map of the study area, in which the geological units are subdivided in 14 geological units along with the major geological structures. A description of the geology units is mentioned in text.
The Hartmann and Neukum model (NM) predicts that the Amazonian period covers most of the history of Mars and begins at 2.9 Gyr and goes up to 3.31 Gyr ago (Hartmann and Neukum, 2001). Late-stage volcanism and eolian resurfacing formed the vast region of Mars and damaged older units (Tanaka et al., 1992). Anhydrous ferric oxides resulting from surface alteration has contributed to the distinctive red surface color in this unit (Bibring et al., 2006). The Hesperian period covers the Early and Late Hesperian periods, which extends from 3.71 Gyr to 3.37 Gyr ago, and is distinguished by the northeast material of Hesperia Planum ridged plains of the Hellas Planitia impact basin (Platz et al., 2015). In comparison with the Noachian period, the impact cratering rates were significantly lower in the Hesperian period, marking the end of the heavy bombardment phase (Grieve et al., 2014). Groundwater has vanished, and it has been assumed that much of the water is held under the surface as permafrost (Tanaka et al., 1992). The Hesperian is also distinguished by the high level of sulfate deposits (Bibring et al., 2006) mainly in the Valles Marineris region. The Noachian period is considered to be the oldest, heavily cratered unit in the highlands covering a time range from 3.71 Gyr to 3.97 Gyr older (Hartmann and Neukum, 2001). Recently, the Noachian period was described in terms of geochemical alteration by Bibring et al. (2006), indicating that the formation of clay minerals, i.e., phyllosilicates, peaked during the early and middle Noachian period. A detailed geological unit formation time scale showing the occurrence of geological events is shown in Figure 5.
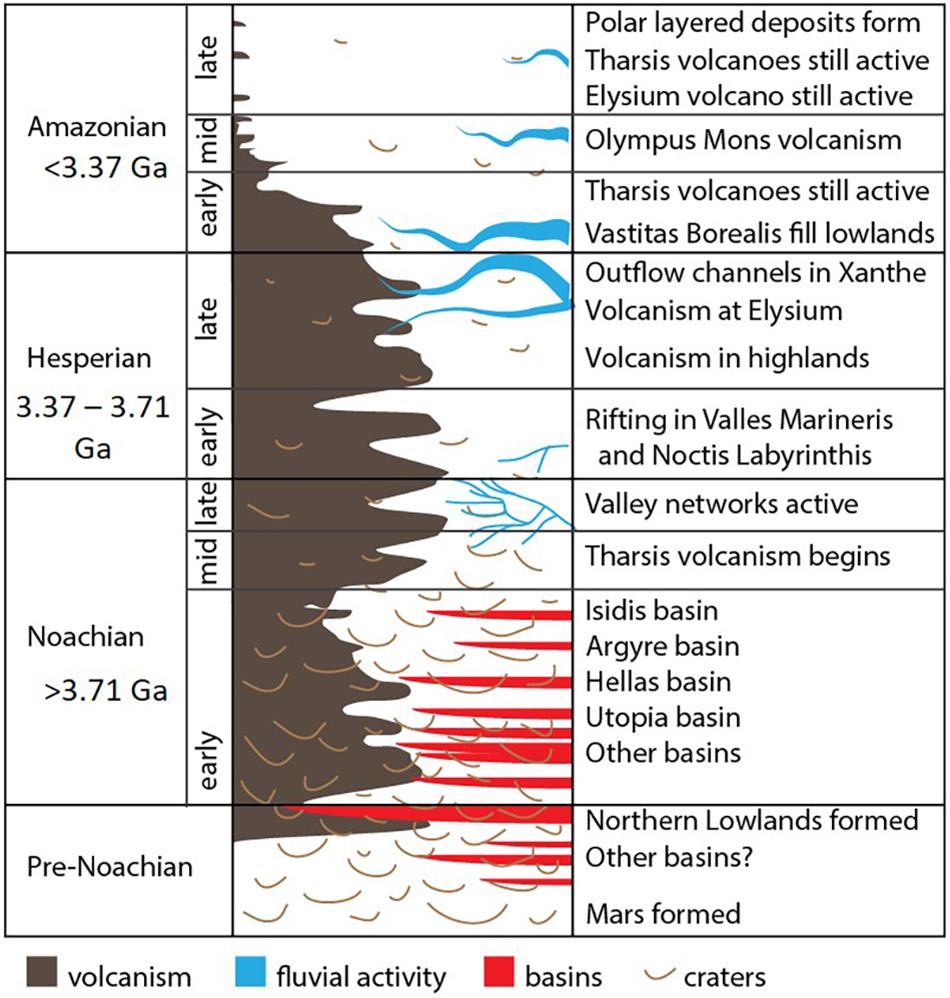
Figure 5. Mars’ detailed geologic time scale showing the occurrence of geological events (Werner and Tanaka, 2011; Michael, 2013; Lagain et al., 2021).
Chronological Study
The age analysis of any planetary body is based on geological mapping according to surface features, e.g., geological contacts, textures, morphologies, compositions, and the overlapping of the individual units according to fundamental principles of stratigraphy (Werner and Tanaka, 2011). Determining the age of a geological unit is crucial to understanding the geological history of planetary bodies and, more specifically, gives information on erosion rate measurements, meteorite ejection location, impact flux evolution, and loss of a magnetic field (Lagain et al., 2021). The planetary surface stratigraphy refers to the inventory of the units of the rock surface and the period at which they were emplaced. To calculate the absolute and relative model age of any planetary surface, crater counting is a well-known technique (e.g., Moon, Mars, Mercury, and others (Hartmann, 1966; Neukum et al., 1975; Neukum, 1983; Hiesinger et al., 2012; Michael, 2013). It can be achieved by calculation of the distribution in size and frequency of impact craters, which have accumulated over time in planet history, resulting in heavily cratered surfaces becoming older than less-cratered surface units (Michael, 2013). Thus, a geological unit tracks the age represented by the number of impact craters created during meteorite bombardment and the time a unit was exposed to the projectile impact flux (Neukum, 1983). On Mars, impact cratering and volcanism played a major role in forming the planet’s surface, and the morphologies that are seen today have been greatly affected by a number of fluvial, glacial, and eolian resurfacing processes (Hartmann and Neukum, 2001). The Martian geological times are divided in three major units as Noachian, the Hesperian, and the Amazonian being oldest to youngest, respectively (Tanaka, 1986; Tanaka et al., 1992). Reliable crater size depends on the effect of erosion/infilling of craters superposed to the dated surface. As larger craters are harder to obliterate, they are generally considered as more reliable to date the planetary surface. Thus, counting areas larger than ∼10,000 km2 are recommended to derive model ages of a surface experiencing a moderate erosion rate (Warner et al., 2015; Palucis et al., 2020). In the context of Mars’ availability of new high-resolution data, various chronology models were proposed and modified. Some of these efforts were recently combined to form the production function from Kneissl et al. (2011) and chronology function from Michael (2013).
To calculate the age of the study area, the active machine learning approach for crater detection is used. Crater counting analysis is performed by measuring the size frequency distribution of craters (Hartmann, 2005). We have performed this analysis on all impact craters >1.5 km (Figure 6), except secondary and ghost crater (Kneissl et al., 2011), and the crater size-frequency distribution was plotted with Craterstats 2.0 software using a cumulative plot and using the function chronology from Hartmann (2005) and (Michael, 2013). The plot showing the 3.09 ± 0.04 Ga for Amazonian, 3.63 ± 0.0 Ga for Hesperian, and 3.73 ± 0.0 Ga for Noachian unit can be seen in Figure 7 and Table 1. For the Amazonian unit, these ages are confirmed by a N(1) crater density of 2046 craters, which corresponds to the Early Amazonian period, whereas the N(1) crater density of 4354 craters corresponded to Early Hesperian in the Hesperian geologic unit and N(1) crater density of 2048 craters to the Late Noachian/Early Hesperian in the Noachian geologic unit according to the established crater density boundaries (Tanaka, 1986; Hartmann, 2005).
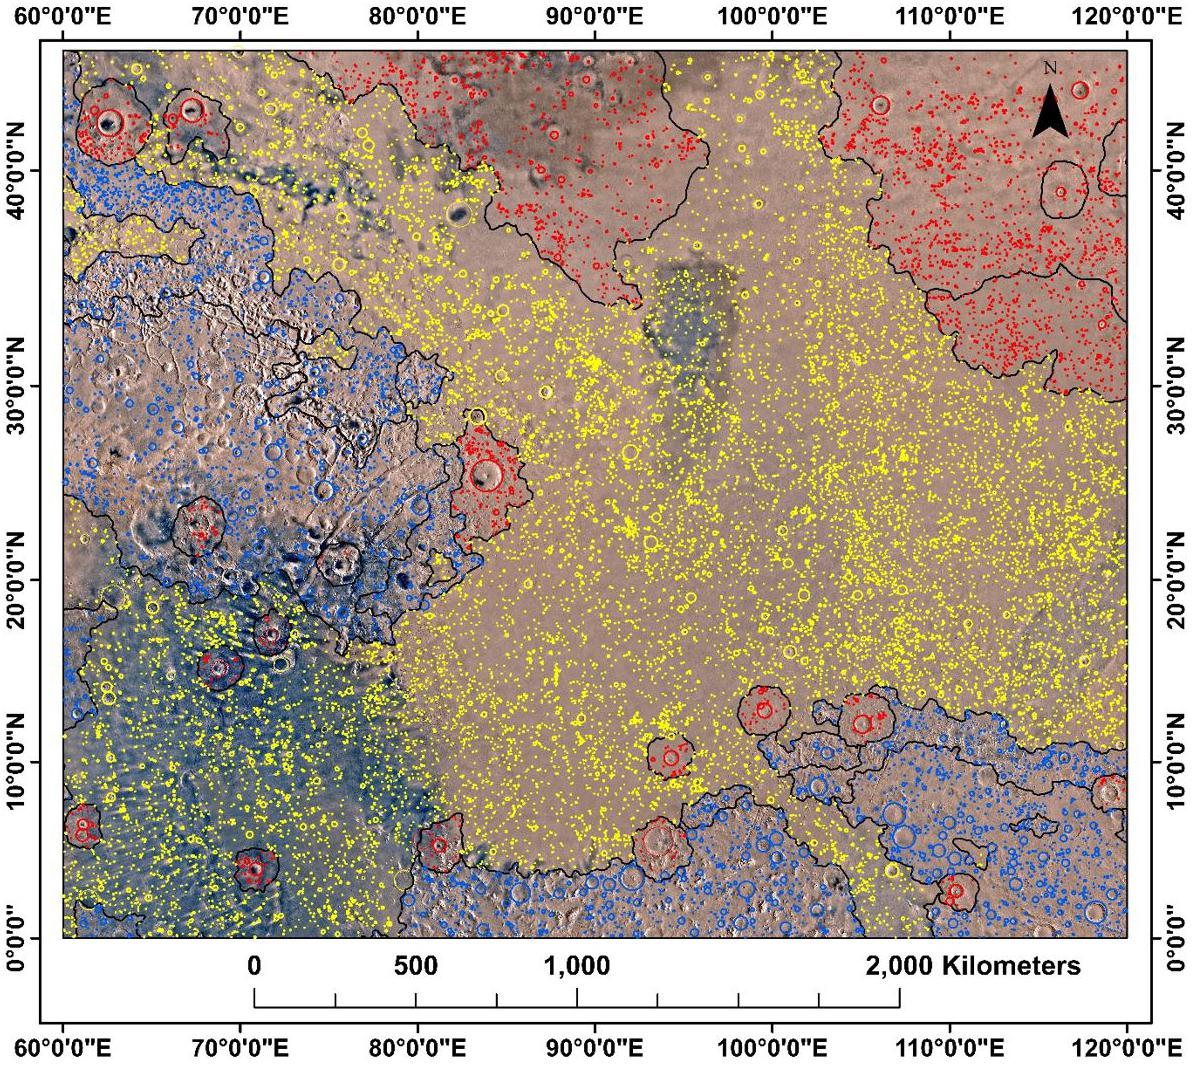
Figure 6. Crater density map (>1.5 km) of the study area showing the Amazonian, Hesperian, and Noachian units as red-, yellow-, and blue-colored craters, respectively.
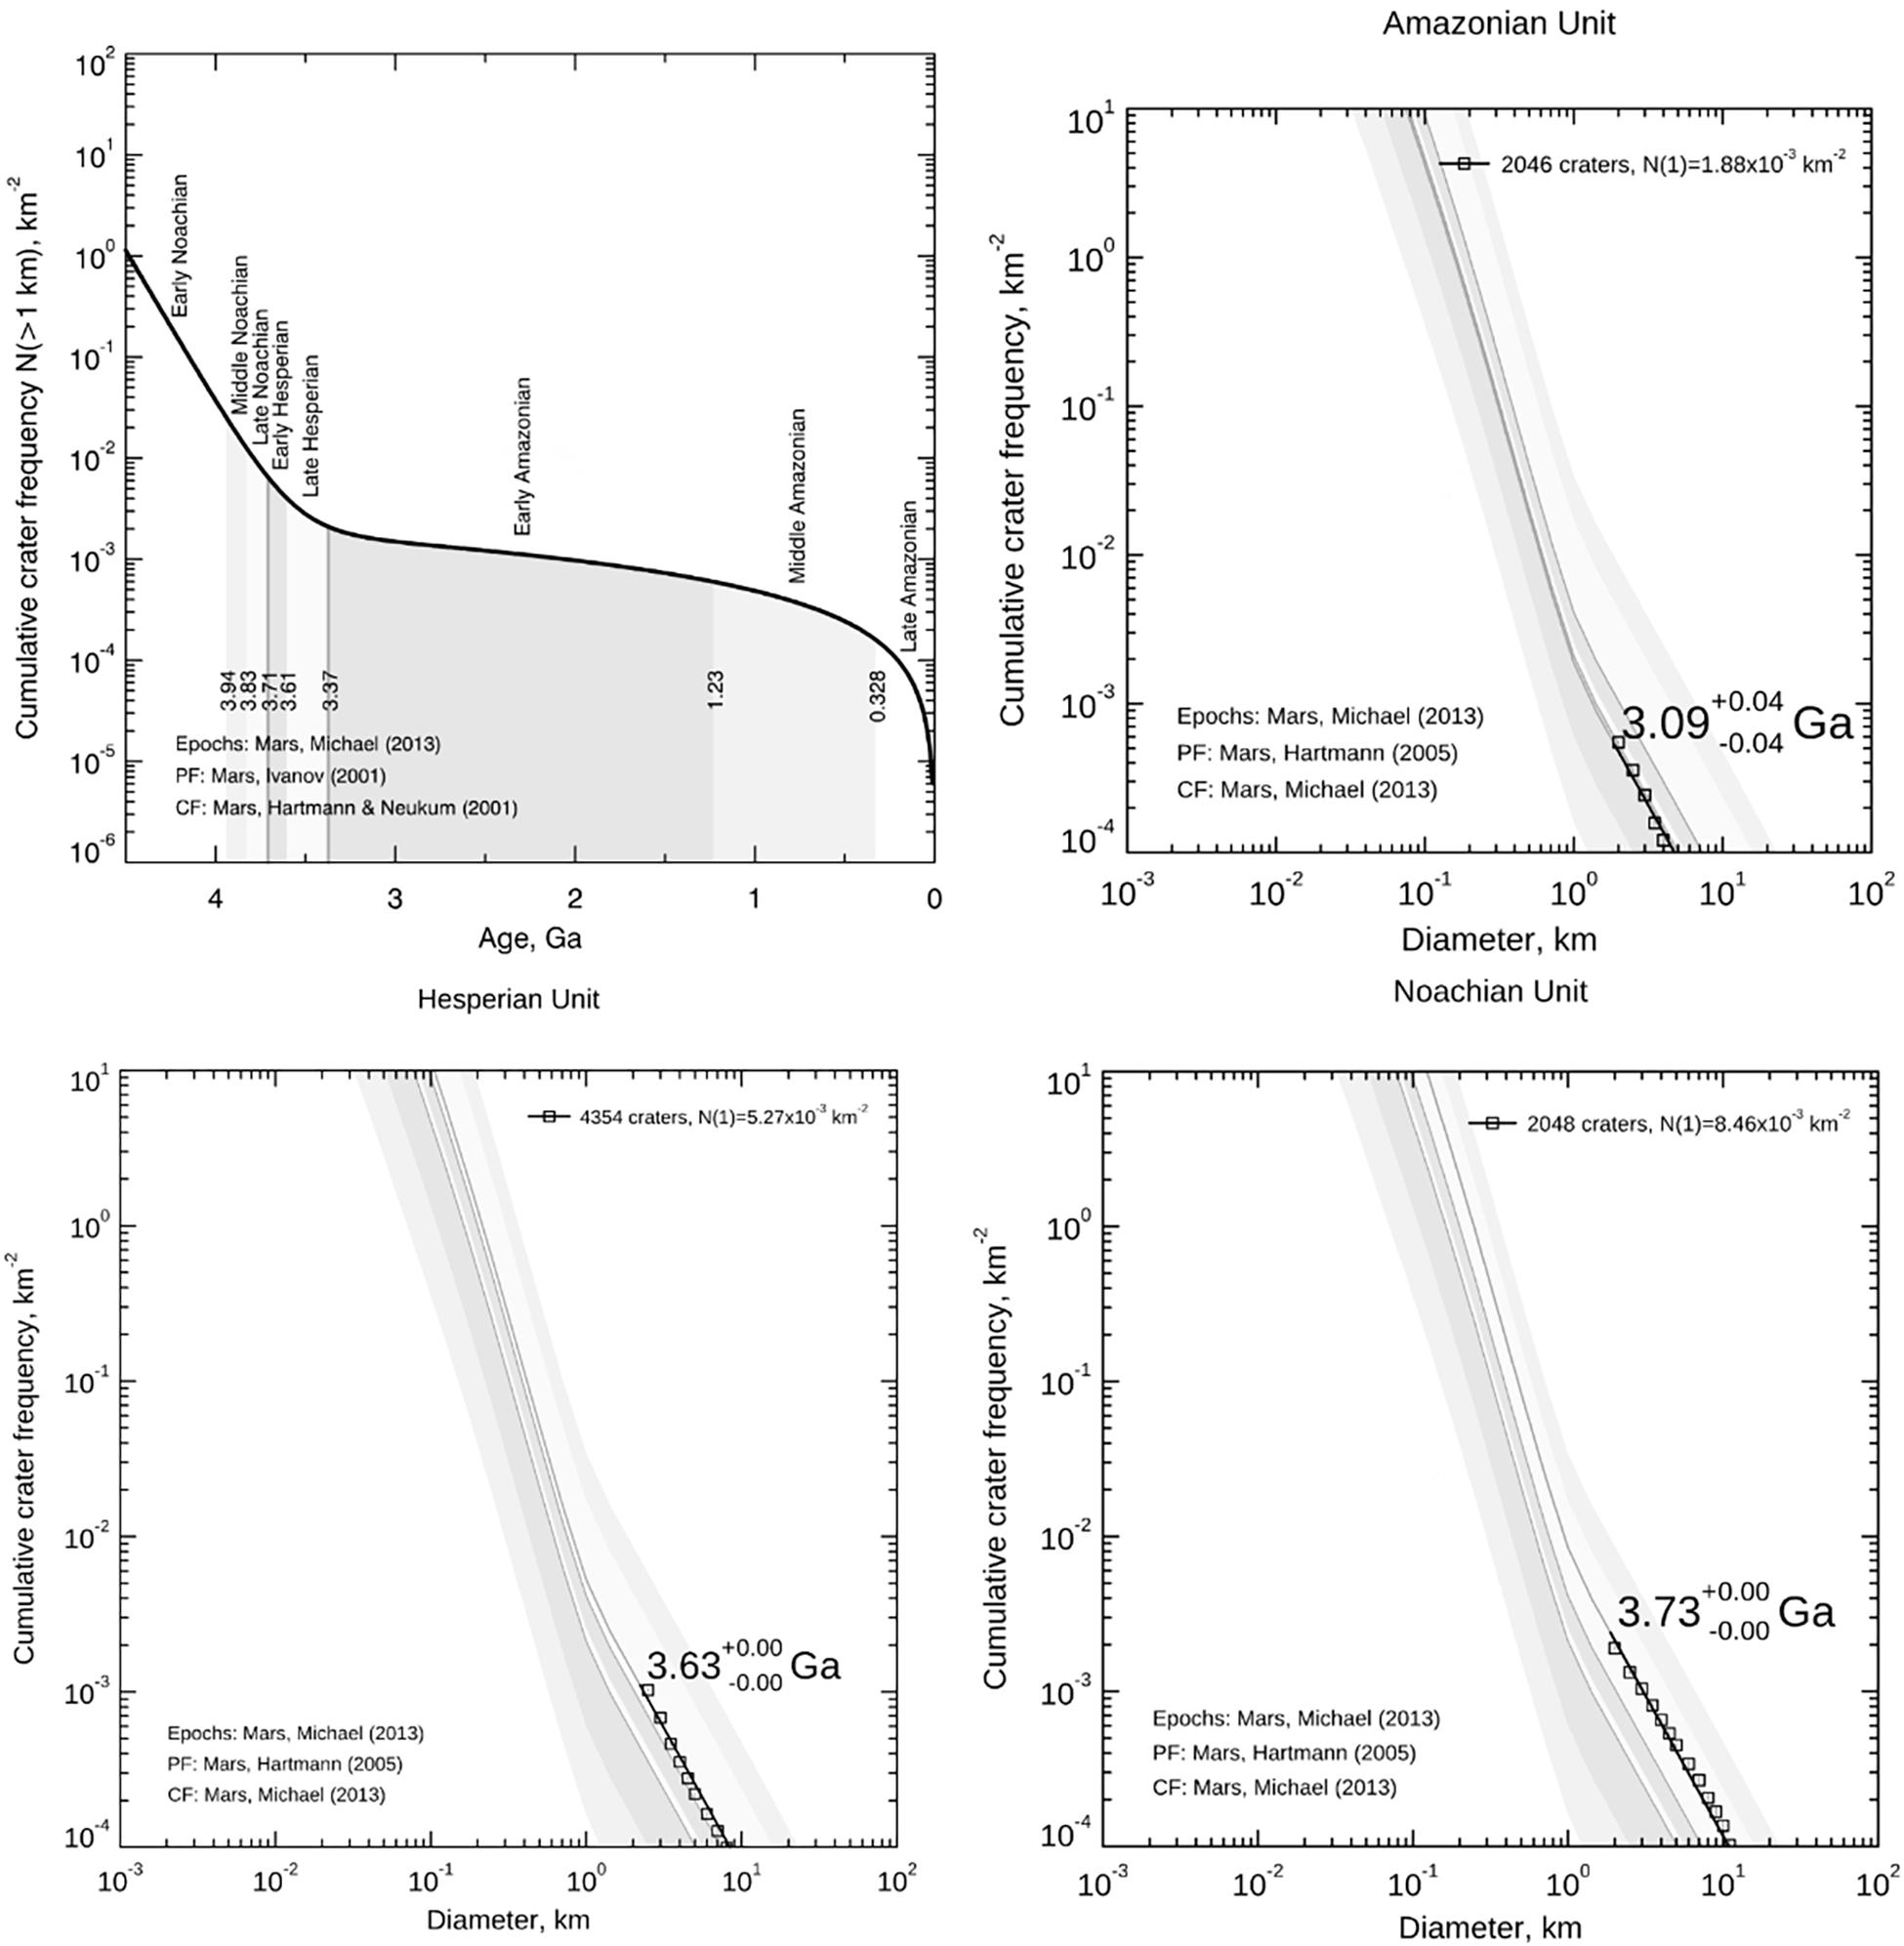
Figure 7. Chronology model of Mars, modified after (Hartmann and Neukum, 2001) with indicated Martian eras. The study area crater counting model ages of the Amazonian unit, Hesperian unit, and Noachian unit, respectively. The N(1) crater density of 2046 craters in the Amazonian unit corresponds to the early Amazonian period, whereas 4354 craters in the Hesperian unit correspond to early Hesperian and 2048 craters to the late Noachian/early Hesperian in the Noachian geologic unit according to the established crater density boundaries.

Table 1. The chronological derived age comparison of the Amazonian, Hesperian, and Noachian units with the (Michael, 2013) model ages.
Mineralogical Study
Space-based platforms providing hyperspectral imagery of Mars has turned our perception of it from a simple “red planet” into a diverse world with environments both new and ancient as diverse as those present on Earth. The history and composition of Mars have been well known over the last 15 years through orbital infrared spectroscopy and on-site exploration. This knowledge, on the other hand, is important in understanding the global environment and geological history of the planet. Information on pressure, temperatures, and chemistry from the past and potential condition for previous habitability has been well explained by the minerals and their occurrence (The National Academies Press, 2011). Mars’ surface has retained the evidence of early conditions where liquid water altered its basaltic crust (Des Marais, 2010). Its surface and near surface have transitioned over several periods, during which different kinds of minerals have been produced (Bibring et al., 2006; Ehlmann and Mustard, 2012; Gaillard et al., 2013). Milliken et al. (2008), Mustard J. F. et al. (2008), Poulet et al. (2008), Ehlmann et al. (2009), Murchie et al. (2009), and others reported hundreds of hydrous mineral exposures dispersed across the southern highlands and described several phases of new minerals and found specific relationships between the composition of the compound and its geomorphic context. Wet and potentially warm conditions have occurred in the early Noachian period, which show to contain clay minerals, especially Mg/Fe phyllosilicates and chlorite, suggesting early weathering conditions with liquid water (Bibring et al., 2006; Mustard J. et al., 2008; Ehlmann and Mustard, 2012; Gaillard et al., 2013). Major processes affecting composition on the surface of Mars is shown in Figure 8, along with the ages of large scale compositional unit On the contrary, acidic conditions with rich sulfur were common in the late Noachian and Hesperian, as the volcanic gas carbon/sulfur ratio was considerably lower as a result of a rising atmospheric pressure (Bibring et al., 2006; Gaillard et al., 2013). Fe/Mg clays have also been found in late Noachian–early Hesperian paleolakes, presumably as both detrital sediments and in situ diagenesis, in fans and deltas (e.g., Jezero, Eberswalde, and Holden craters) (Grant et al., 2008; Goudge et al., 2015). Although hydrated mineralogy is found to be widespread in the highlands in the Noachian or Hesperian region, there is very little detection in the smaller northern lowlands (Ehlmann et al., 2008b; Mustard J. F. et al., 2008; Carter et al., 2013). Talking about the Amazonian period, it was primarily oxidizing, dry, and dominating with nanophase iron oxides (Bibring et al., 2006). The CRISM instrument and high-resolution images have significantly sharpened our understanding of Mars’ mineral analysis in terms of composition, setting, and global spatial distribution. To study its mineralogical diversity in detail, three unnamed craters had been chosen each from the Amazonian, Hesperian, and Noachian geologic units according to the CRISM data coverage. To enable the rapid visual and qualitative multiparametric evaluation of the surface characteristics, an RGB color composite called browse products has been derived using CRISM data. The RGB band combination used to derive these browse products and formulation required is defined by Viviano-Beck et al. (2014) as follows.
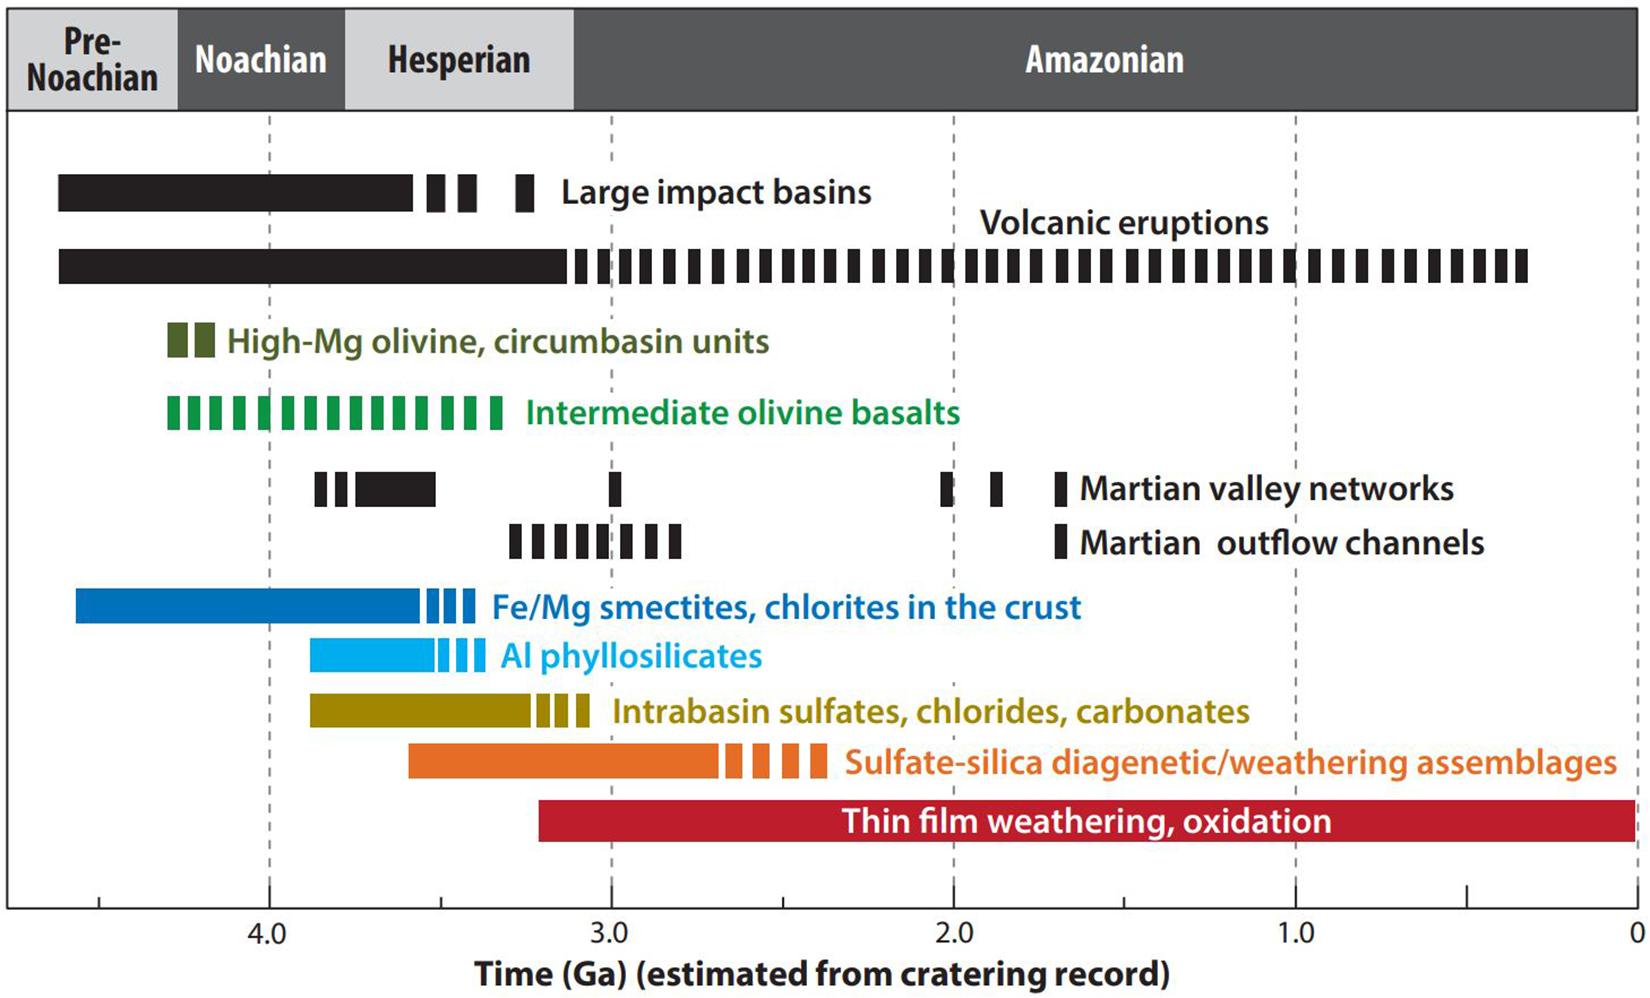
Figure 8. Timeline of the major processes affecting the mineralogic composition of Mars and the ages of large-scale compositional units (Kneissl et al., 2011).
RGB Band Combinations
1. FAL – (R = R2529; G = R1506; B = R1080).
2. FEM – (R = BD530_2; G = SH600_2; B = BDI1000VIS).
3. MAF – (R=OLINDEX3; G=LCPINDEX2; B = HCPINDEX2).
4. HYD – (R = SINDEX2; G = BD2100_2; B = BD1900_2).
5. ICE – (R = BD1900_2; G = BD1500_2; B = BD1435).
6. CR2 – (R=MIN2295_2480; G=MIN2345_2537; B = CINDEX).
5. CHL – (R = ISLOPE1; G = BD3000; B = IRR2).
NOTE: R*** indicated reflectance at particular wavelength W****(nm).
Formulations
1.
2.
3.
4.
5.
6.
7.
8.
9.
10.
Slope for RC#### anchored at R1750 and R1862.
Slope for RC#### anchored at R1560 and R2450.
Slope for RC#### anchored at R1690 and R2530.
In the aforementioned formulas, a and b are described by Clark and Roush (1984):
Where
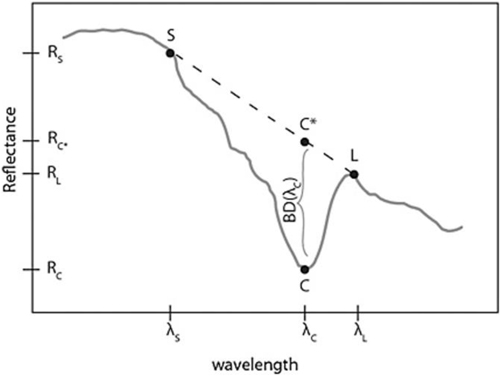
where λc is the reflectance at the center wavelength,λs is the reflectance value at shorter wavelength, andλL is the longer wavelength points along the continuum.
In Mars, missions were focused on the assessment and identification of habitability, as their crust tracks a long and diverse history for aqueous processes (Bibring et al., 2006; Ehlmann et al., 2008a; The National Academies Press, 2011; Beegle et al., 2015; Goesmann et al., 2017). Spectroscopy is a tool for gathering such information and has been used extensively in red planet missions. In this analysis, CRISM images have been obtained from the Planetary Data System (PDS) at the most recent calibration level (MTRDR—Mapped Targeted Reduced Data Record). A detailed spectral study and comparison to laboratory end members have been carried out to assess the spectra derived from the RGB composites. CRISM MTRDR images on the PDS were processed to remove atmospheric and instrumental effects (Seelos et al., 2016) but still require ratioing with spectrally neutral terrains to produce subtle spectral characteristics. One of the benefits of the MTRDR images is that most column-dependent (i.e., detector element) variability has been suppressed (Seelos et al., 2016). Thus, contrasting with a previous image of the TRR3 level (Murchie et al., 2009), the spectrally neutral terrain should not be within the same detector column and can be from anywhere in the image (Seelos et al., 2016) but should preferably be collected from a similar height to eliminate any residual atmospheric bands. After the preprocessing steps, the images’ spectral signatures are derived, which are useful for obtaining information on mineralogy. The continuum of spectra was then removed, in order to visualize and delimit the distribution of chosen minerals by using spectral features, specifically designed to detect the presence of noted minerals (i.e., summary browse products). The minerals in particular were well-known groups of mafic minerals (olivine and pyroxenes) as well as carbonates, hydrated silicates, and sulfates, with well-known spectral characteristics and forming part of the mineralogy of many rocks on earth. Spectra from unnamed crater 1 which belongs to the Amazonian period are shown in Figure 9 of the Hesperian period, unnamed crater 2 spectra are shown in Figure 10, and unnamed crater 3 spectra of the Noachian period are shown in Figure 11. To do a detailed spectral study and comparison to laboratory end members, reference spectra downloaded from CRISM spectral library are shown in Figure 12.
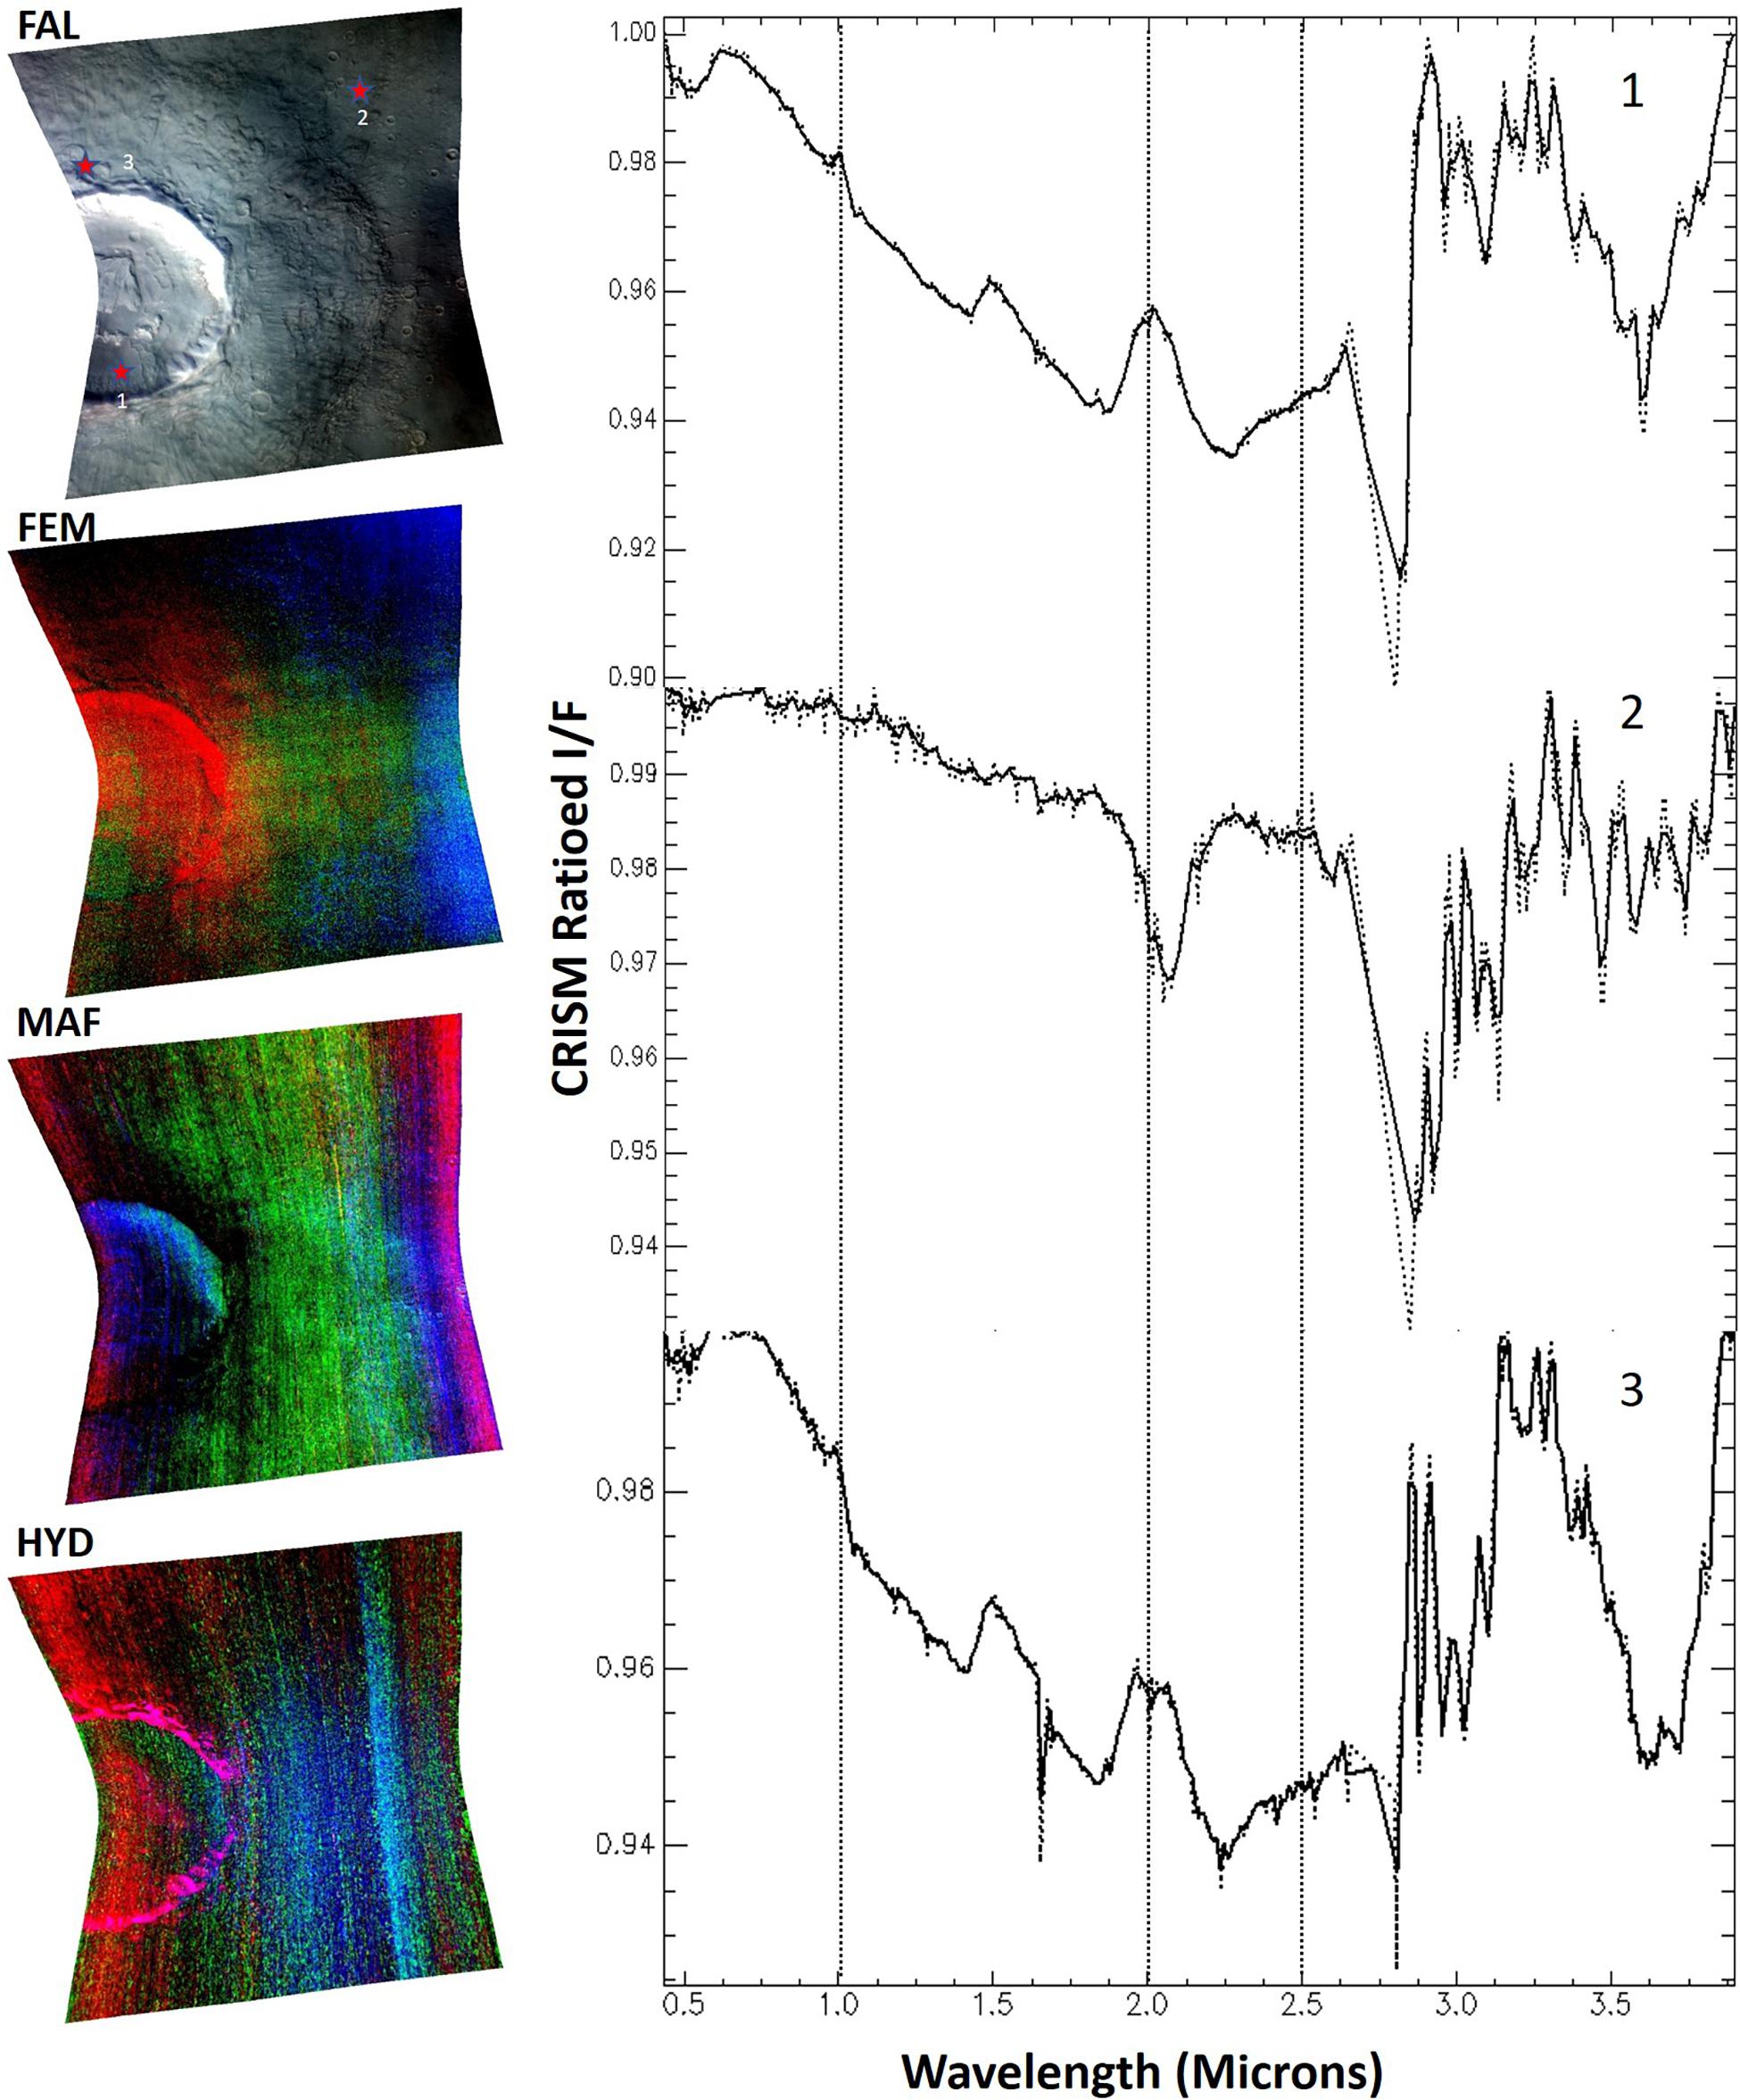
Figure 9. FAL, FEM, MAF, and HYD browse products derived from CRISM data to correlate the map to the surface feature and to assess information regarding ferric and ferrous minerals, primary mafic minerals, and aqueous bounded minerals, respectively. Sample locations are representatively marked in the FAL browse product along with the extracted spectra in Amazonian unit Unnamed crater 1.
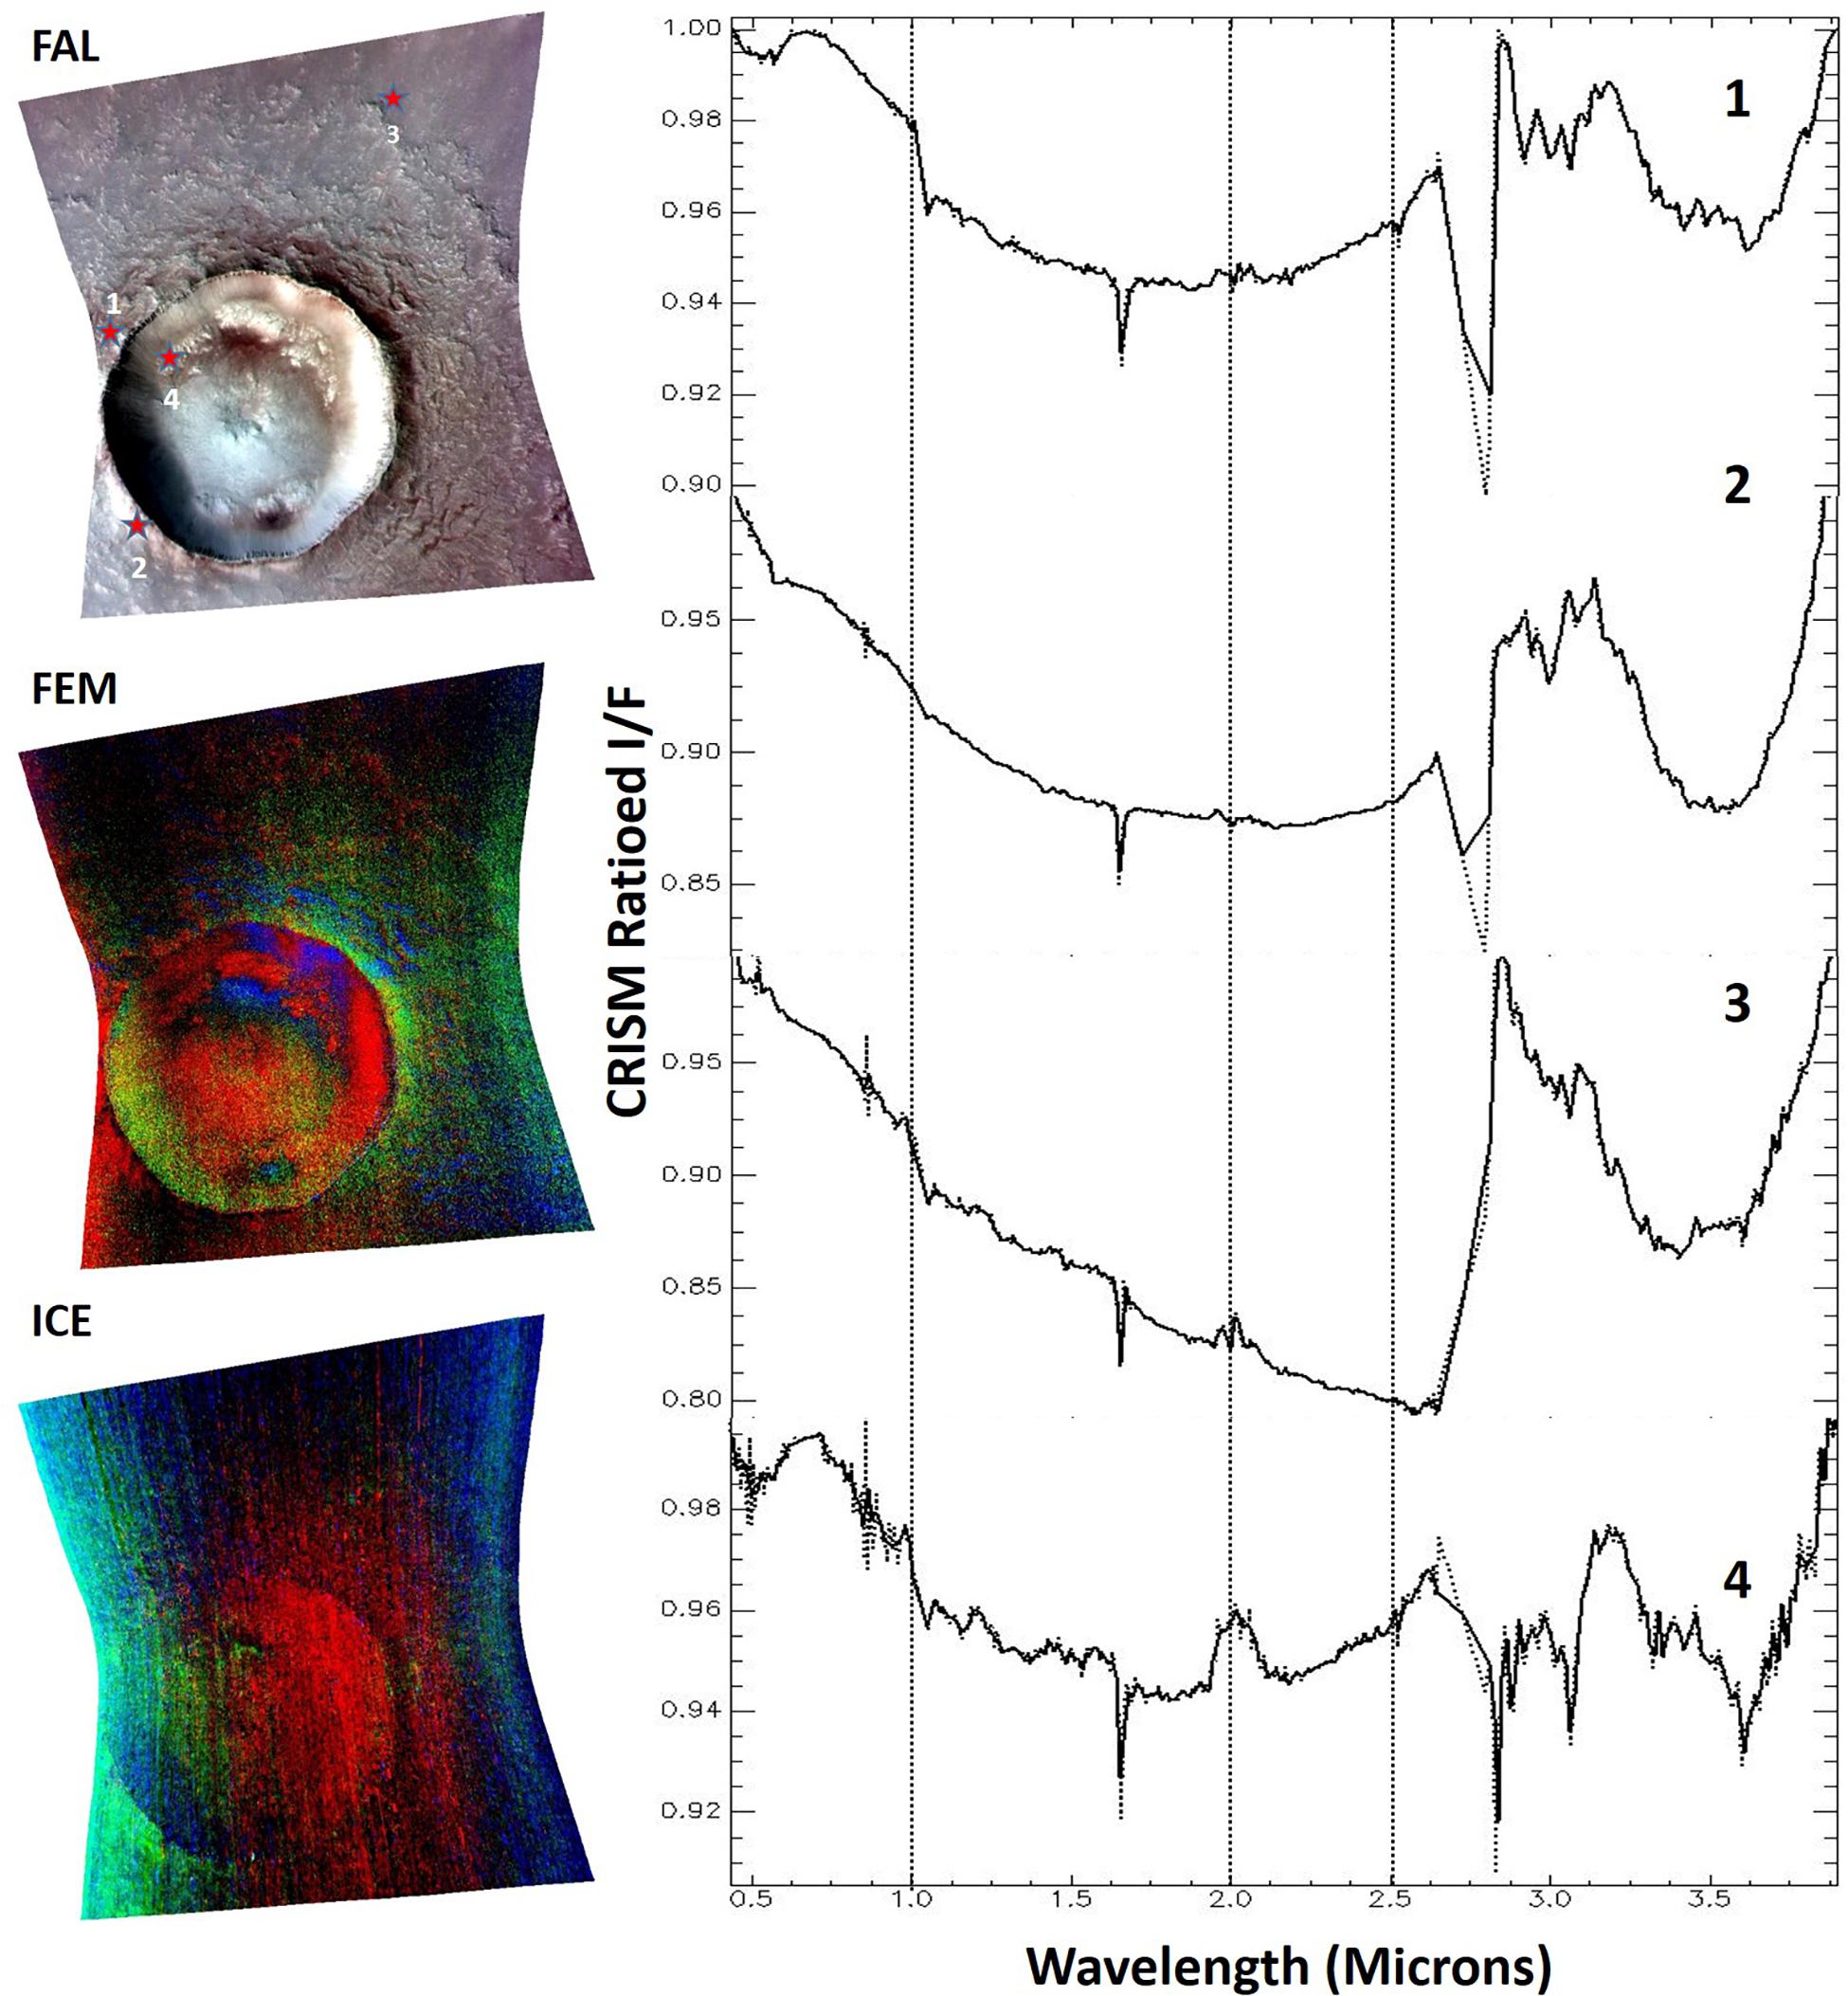
Figure 10. FAL, FEM, and ICE browse products derived from CRISM data to correlate the map to the surface feature and to assess information regarding ferric and ferrous minerals, water, or carbon dioxide frost or ice. Sample locations are representatively marked in the FAL browse product along with the extracted spectra in Hesperian unit Unnamed crater 2.
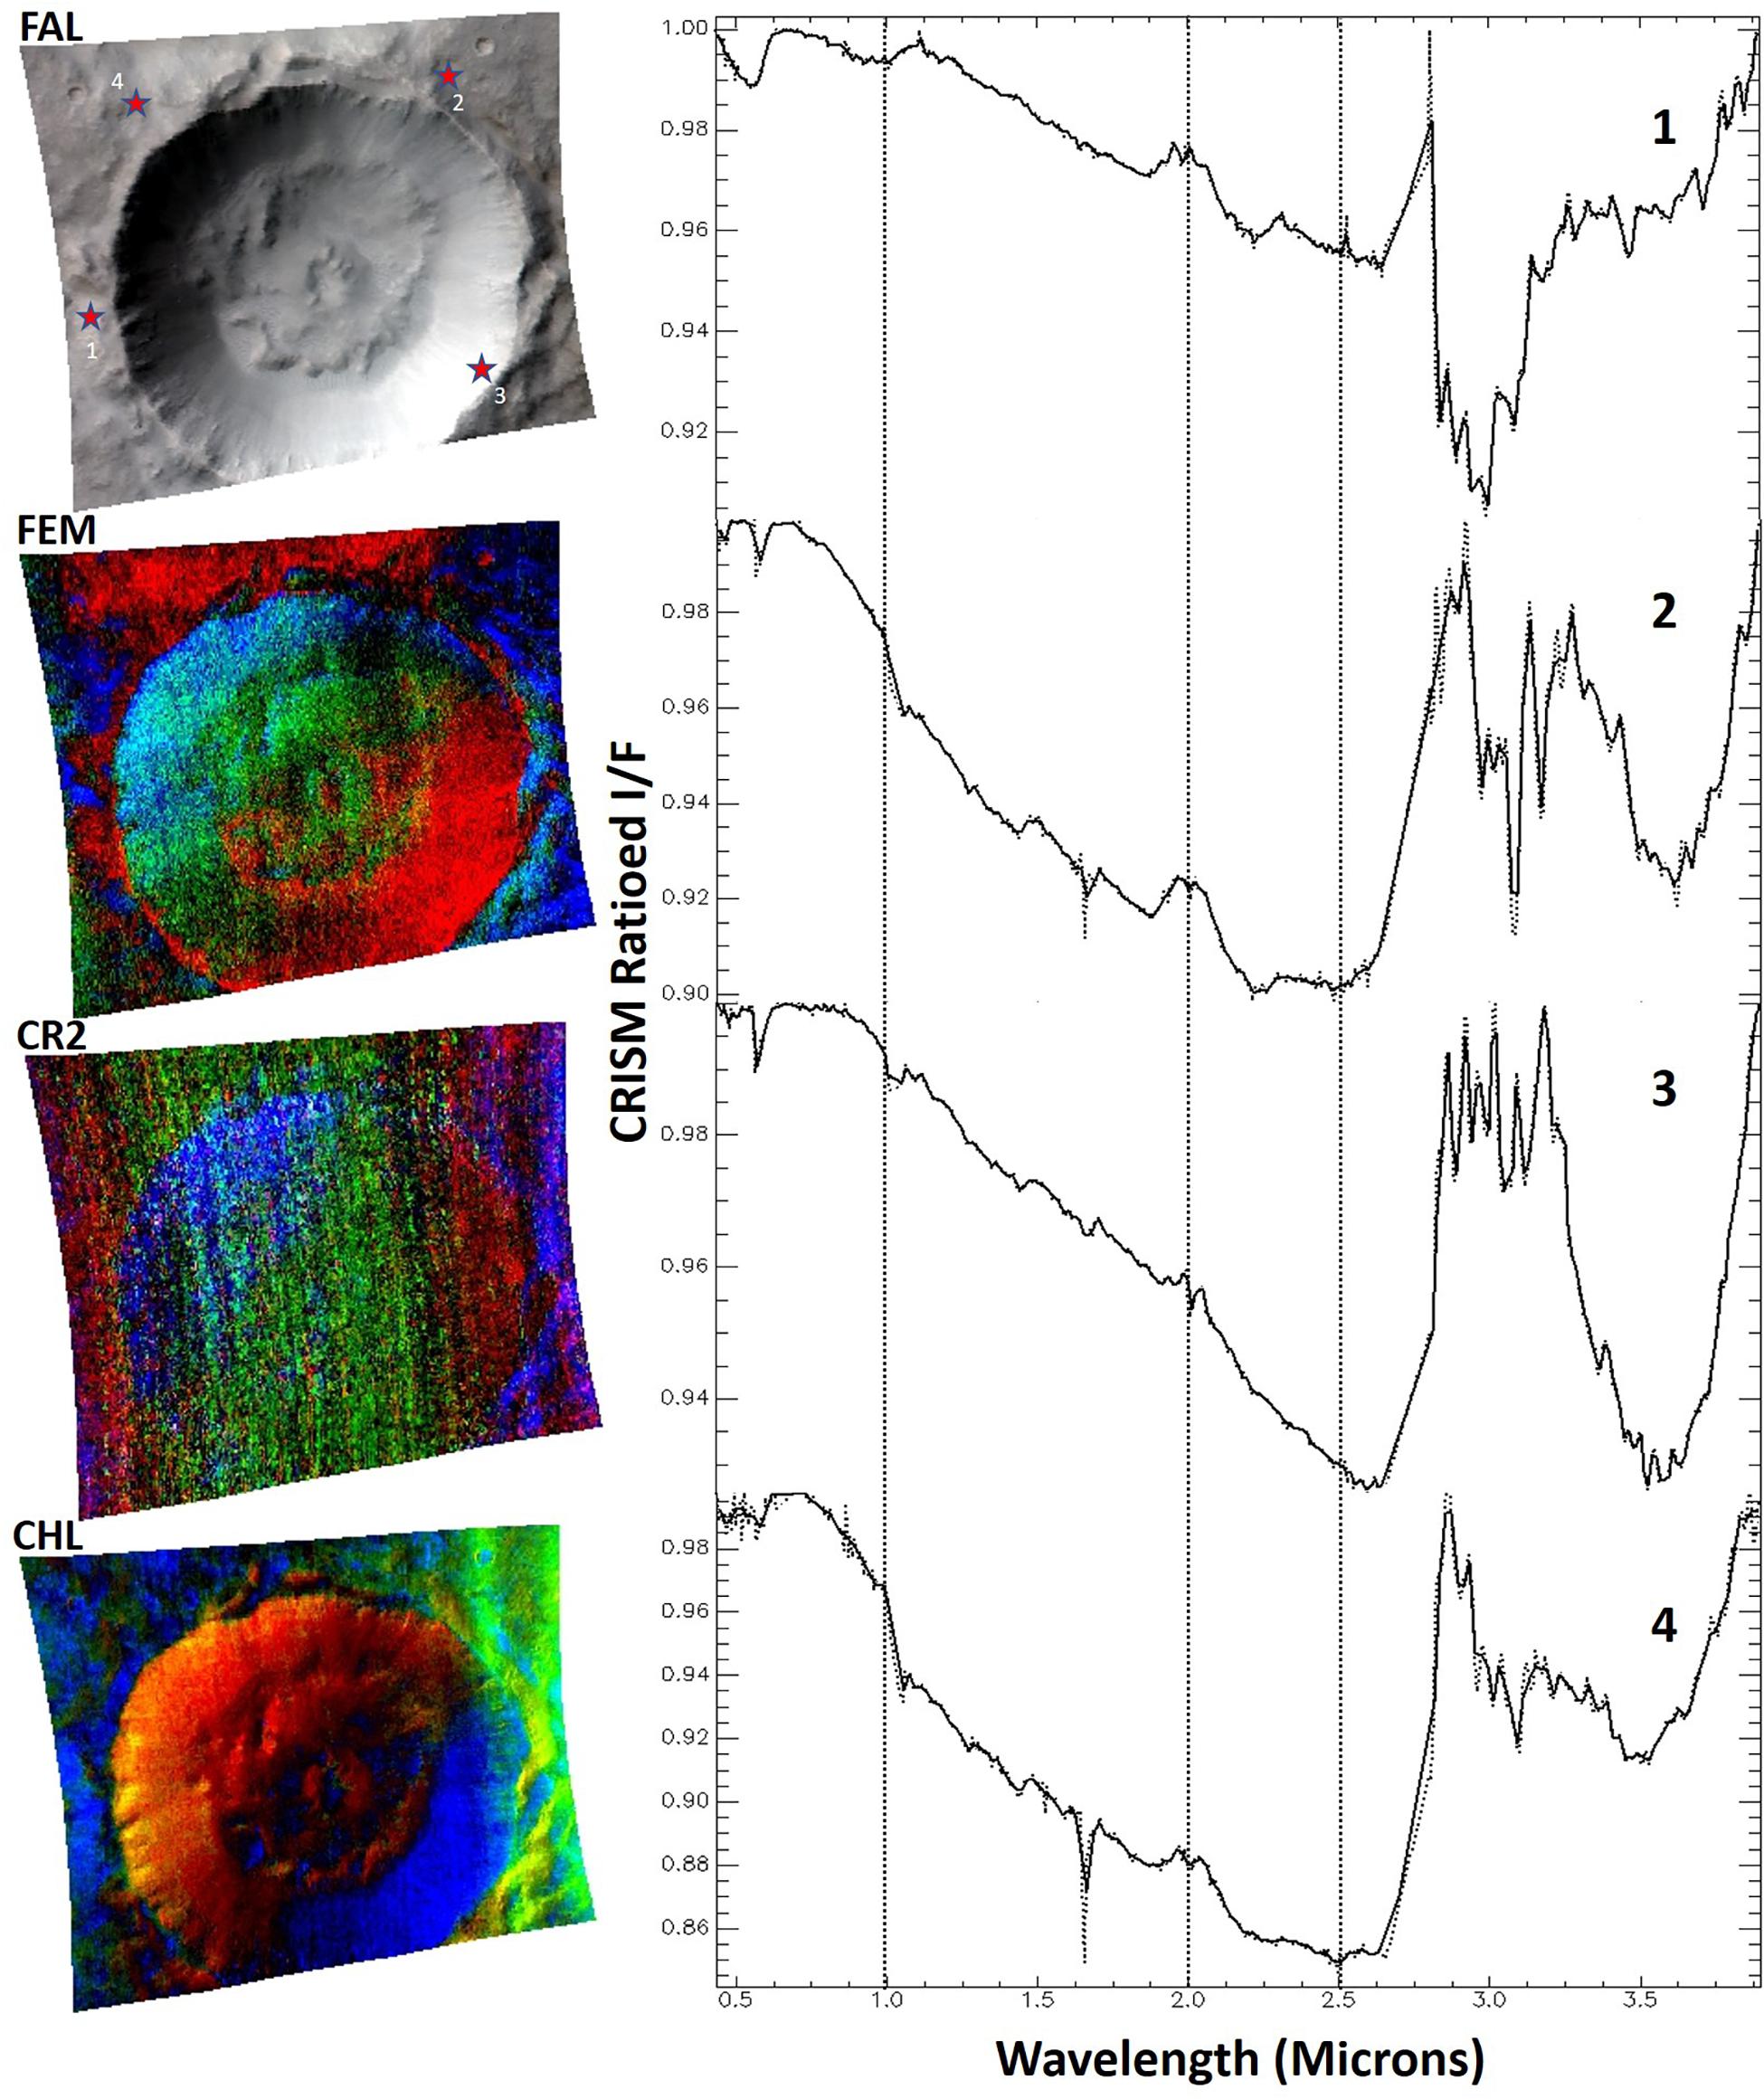
Figure 11. FAL, FEM, CR2, and CHL browse products derived from CRISM data to correlate the map to the surface feature and to assess information regarding ferric and ferrous minerals, carbonate minerals, and chloride deposits. Sample locations are representatively marked in the FAL browse product along with the extracted spectra in Noachian unit Unnamed crater 3.
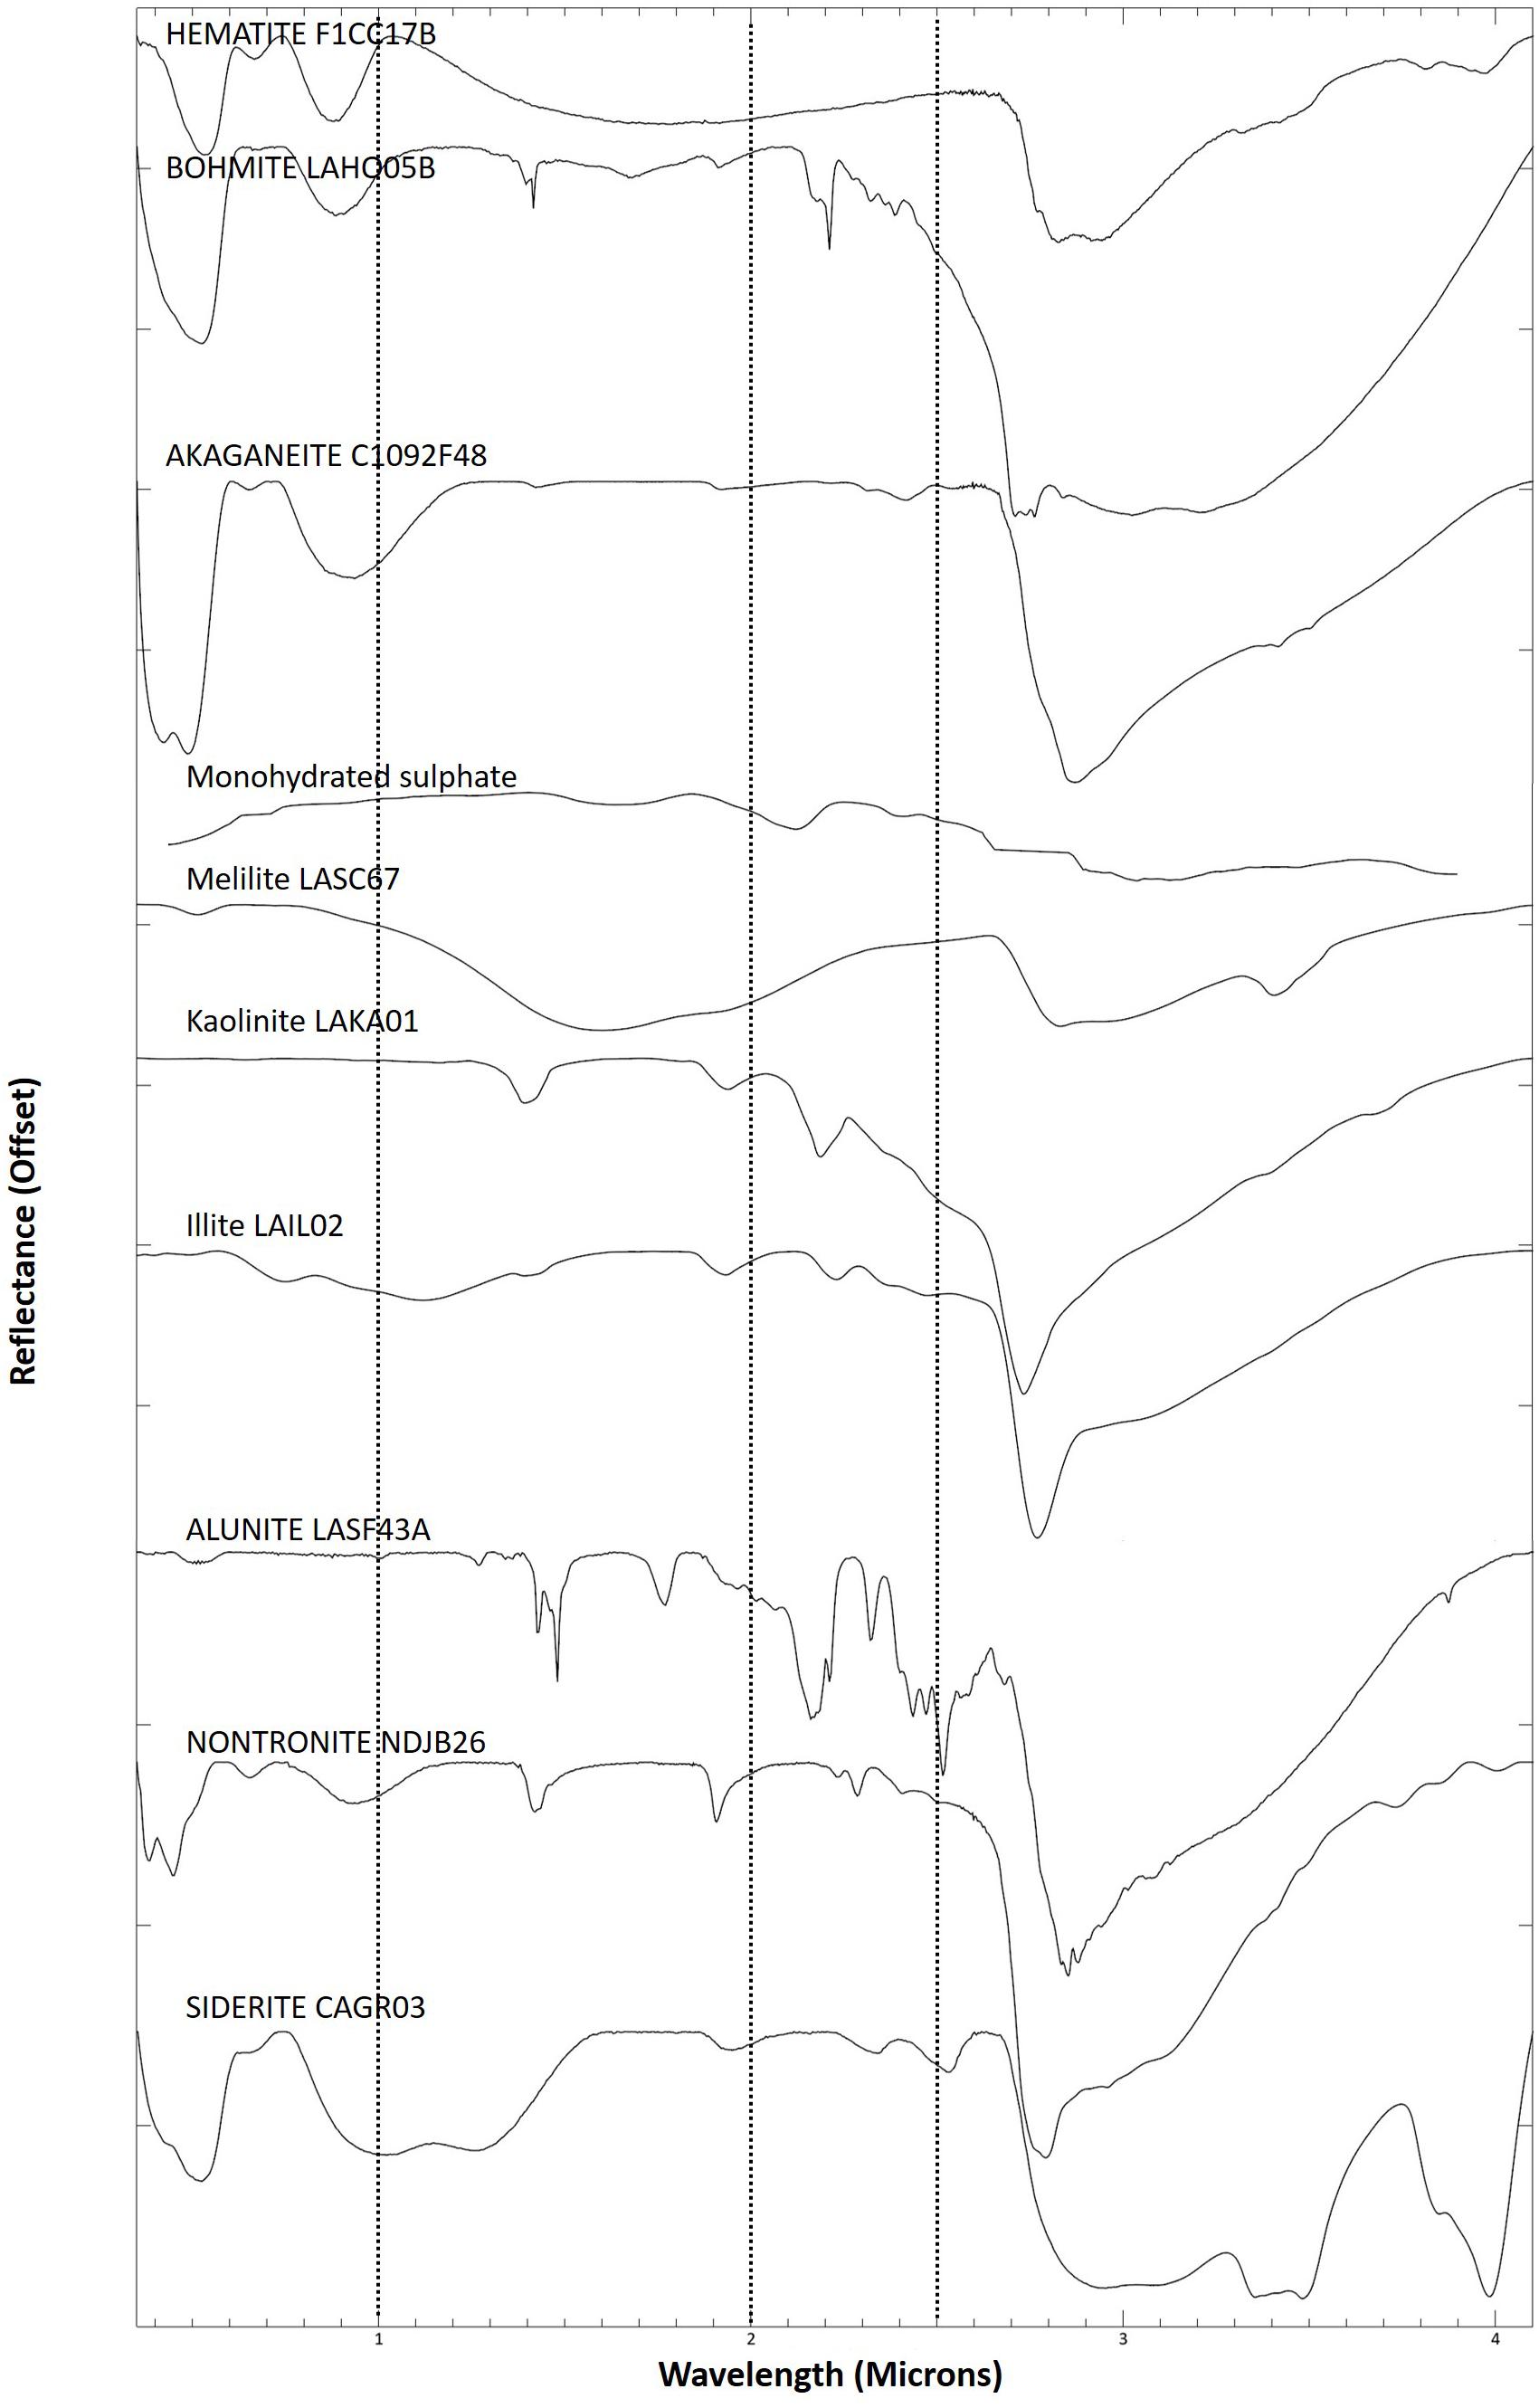
Figure 12. CRISM laboratory end members downloaded from Grant et al. (2008) to match with extracted CRISM-ratioed spectra.
Image Interpretation
RGB color composites called browse products and spectral analysis derived from CRISM data are used to evaluate mineralogical diversity in the unnamed craters within geological units (Table 2) (Viviano-Beck et al., 2014). The FEM browse product is more responsive to ferrous and ferric absorption, as well as slope that is negative and has compacted dust texture or dust coatings. To see the information related to primary mafic minerals like olivine, LCP, and HCP, the MAF browse product has been derived for the scene. The study also explored the ICE browse product, which shows the information related to water or carbon dioxide (CO2) frost or ice. CO2 frost or ice appears blue, displaying a sharp 1.435-μm absorption (Viviano-Beck et al., 2014), whereas water ice of frost appears green because of having a strong absorption at 1.5 μm (Beegle et al., 2015). The HYD browse product is derived to see the information related to minerals bounded with water. CHL browse products reveal that the information related chloride deposits revealed from Thermal Emission Imaging System (THEMIS) sensor and hydrated mineral deposits. In the scene, those surfaces have a relative positive near-infrared spectral profile and are comparatively dried up, used to represent the chlorides. To distinguish the carbonate minerals, the CR2 browse product is derived.
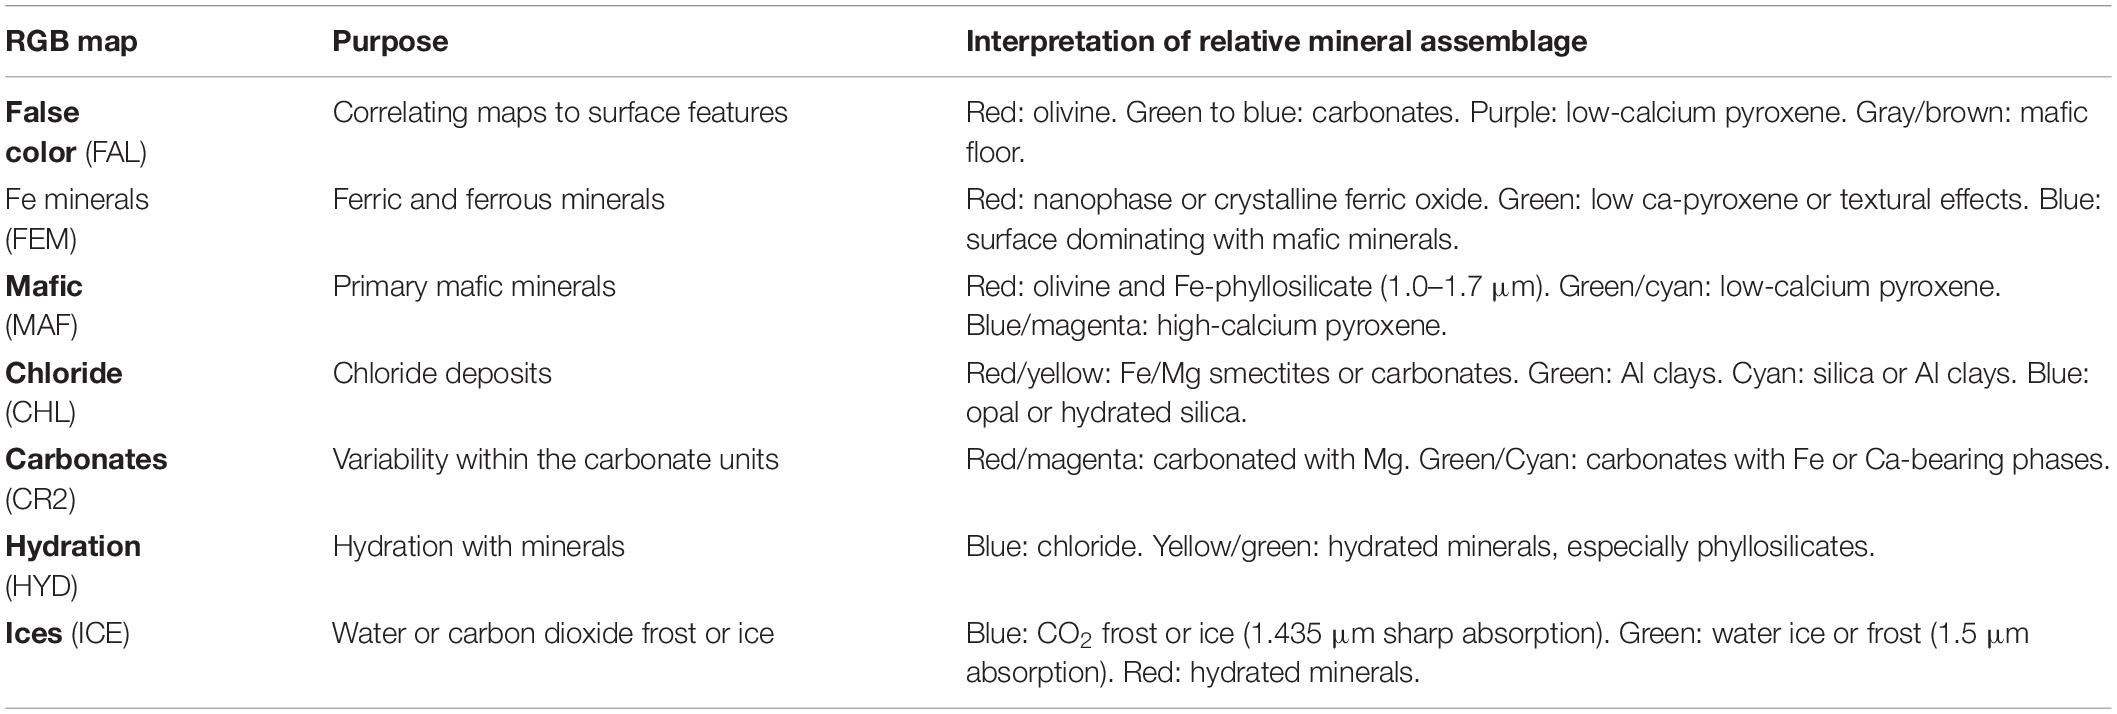
Table 2. Interpretation made on the basis of summary products derived using the CRISM data as RGB color composite/browse.
For the detailed spectral investigation, we compared CRISM ratio-derived spectra to the spectra from the CRISM library (Viviano-Beck et al., 2014). The library spectra are available at the spectral range of 0.35–4.1 μm. Figure 9 shows the spectra derived from unnamed crater 1 of the early Amazonian period, which is found to be majorly composed of oxides. Further details on the composition of the crater, which includes hematite, boehmite, and akaganeite, are shown. Hematite is an oxide of iron Fe2O3 chemical composition. The presence of hematite results in having plenty of basaltic rocks on Mars’ surface. Mars’ basaltic rocks contain iron within the rock composed mainly of feldspar and pyroxene minerals (Bost, 2012), whereas akaganeite has a complex mineral structure, unique to other oxides of iron but similar to the iron oxyhydroxysulfate schwertmannite. Chloride is an integral component of both akaganeite formation and structure (Carter et al., 2015). Matching the resulting spectra extracted from unnamed crater 2 of the Hesperian period with the CRISM spectral library, it seems to be primarily composed of monohydrated sulfates, melilite, illite, and kaolinite. CRISM data analysis in this crater indicates that the signature of carbonatites is associated with silicate alkali rocks that are typically nephelinitic or melilititic. In layered rocks and in combination with hydrated Fe–Mg silicates (clays family) and kaolinite-group minerals, Martian carbonates are often present at some places (Michalski and Niles, 2010). Spectra from the CRISM show diagnostic absorptions of alunite, non-tronite, and siderite in the unnamed crater 3 of the Noachian period. In some locations, diagnostic absorptions at 2.19 μm–2.21 μm, 2.26 μm–2.27 μm, and 2.48 μm–2.51 μm have been seen in addition to the 2.3-μm or 2.35-μm absorption of Fe/Mg-OH. The variation of the spectral characteristics can be caused by mixtures of different minerals and not associated with specific mineralogy. Clay minerals identified on Mars in the oldest (Noachian) terrain also suggest the presence of long-term water–rock interactions in the period.
Conclusion
In the present study, the Mars Reconnaissance orbiter’s CRISM, CTX, MOLA, and Viking 2 data of the Mars global surveyor spacecraft were used for the detailed mineralogical, topographical, and chronological study. The study area is found to be interesting to be studied because of its high elevation in the northeastern side and low elevation in the southern side, consisting of three major geological boundaries, i.e., Hesperian, Noachian, and Amazonian unit, which have been further subdivided into 14 geological units. To study the age of the major geological units, crater-size frequency data were derived using a novel active machine learning approach, in which the planetary imagery (CTX and Viking 2 image) and MOLA DEM are used for collecting training samples with more automation and better performance. The plot derived from Craterstats 2.0 software shows the age of 3.09 ± 0.04 Ga for Amazonian, 3.63 ± 0.0 Ga for Hesperian, and 3.73 ± 0.0 Ga for Noachian unit. For the Amazonian unit, these ages are confirmed by a N(1) crater density of 2046 craters, which corresponds to the early Amazonian period, whereas in the Hesperian unit, the age is confirmed by a N(1) crater density of 4354 craters corresponding to the early Hesperian period and crater density of 2048 craters in the Noachian geologic period corresponds to the late Noachian/early Hesperian according to the established crater density boundaries. The RGB color composite called browse products has been derived using CRISM data to enable a rapid visual and multiparametric evaluation of the surface characteristics. FEM, MAF, and CHL browse products are derived to assess information regarding ferric and ferrous minerals, primary mafic minerals, and chloride deposits, respectively, whereas to correlate the map to surface feature, the FAL browse product is derived. Other browse products such as CR2, HYD, and ICE have also been derived to know more about the variation in carbonate units, minerals bound with water, and information regarding water or carbon dioxide frost or ice, respectively. From our investigation of the mineralogical record on the unnamed craters belonging to the Hesperian, Noachian, and Amazonian units, we find a diverse mineralogy of sulfates, phyllosilicates, and oxides respectively. The Amazonian period, which is majorly composed of oxides as a primary mineral, shows the hematite, boehmite, and akaganeite in the extracted CRISM spectra of unnamed crater 1. CRISM data analysis in the Hesperian unit-unnamed crater shows the signature of carbonatites associated with silicate alkali rocks that are typically nephelinitic or melilititic and shows the monohydrated sulfates, melilite, illite, and kaolinite minerals in the region. For the unnamed crater 3 belonging to the Noachian period, extracted spectra show diagnostic absorptions of clay minerals, suggesting the presence of long-term water–rock interactions in the period. Future work-related present research should explore the difference in spectral signature between Earth and Mars, for which we are designing a space and environmental chamber (mars simulation chamber), which will help answer related questions. We plan to extract the mineral spectra from hyperspectral remote sensing images of Mars and verify them with library spectra produced in Mars’ simulation chamber and Earth minerals.
Data Availability Statement
The raw data supporting the conclusions of this article will be made available by the authors, without undue reservation.
Author Contributions
FH: supervision. FH and MS: writing—original draft preparation and conceptualization. MS: methodology, software, and investigation. MS and CX: formal analysis. FH, MS, and YN: validation. MS, CX, and YN: visualization. FA: funding acquisition. All authors contributed to the article and approved the submitted version.
Funding
We would like to extend our thanks and appreciation to UAE Space Agency for funding this research (Z01-2016-001).
Conflict of Interest
The authors declare that the research was conducted in the absence of any commercial or financial relationships that could be construed as a potential conflict of interest.
Acknowledgments
We would like to extend our thanks and appreciation to UAE Space Agency for funding this research (Z01-2016-001). We also would like to thank Zayed University, Abu Dhabi, for providing the facility to carry out the research.
References
Arvidson, R. E., Squyres, S. W., Anderson, R. C., Bell, J. F. III, Blaney, D., Brückner, J., et al. (2006). Overview of the spirit mars exploration rover mission to gusev crater: landing site to backstay rock in the columbia hills. J. Geophys. Res. 111:E02S01. doi: 10.1029/2005JE002499
Beegle, L., Bhartia, R., White, M., DeFlores, L., Abbey, W., Wu, Y. H., et al. (2015). “SHERLOC: scanning habitable environments with raman & luminescence for organics and chemicals,” in Proceedings of the 2015 IEEE Aerospace Conference, (Piscataway, NJ: IEEE), doi: 10.1109/AERO.2015.7119105
Bibring, J.-P., Langevin, Y., Mustard, J. F., Poulet, F., Arvidson, R., Gendrin, A., et al. (2006). Global mineralogical and aqueous mars history derived from OMEGA/Mars express data. Science 312, 400–404. doi: 10.1126/science.1122659
Bost, N. (2012). Geochemical and Mineralogical Analysis of Mars Analogue Materials and the Creation of the International Space Analogue Rock Store (ISAR), Autre. Français: Université d’Orléans.
Carr, M. H., and Head, J. W. (2010). Geologic history of Mars. Earth Planet. Sci. Lett. 294, 185–203.
Carter, J., Poulet, F., Bibring, J. P., Mangold, N., and Murchie, S. (2013). Hydrous minerals on Mars as seen by the CRISM and OMEGA imaging spectrometers: updated global view. J. Geophys. Res. 118, 831–858. doi: 10.1029/2012je004145
Carter, J., Viviano-Beck, C., Loizeau, D., Bishop, J., and Le Deit, L. (2015). Orbital detection and implications of akaganeite on Mars. Icarus 253, 296–310. doi: 10.1016/j.icarus.2015.01.020
Clark, R. N., and Roush, T. L. (1984). Reflectance spectroscopy: quantitative analysis techniques for remote sensing applications. J. Geophys. Res. 89:6329. doi: 10.1029/JB089iB07p06329
Des Marais, D. J. (2010). Exploring mars for evidence of habitable environments and life. Proc. Am. Philos. Soc. 154, 402–421.
Ehlmann, B. L., and Mustard, J. F. (2012). An in-situ record of major environmental transitions on early mars at northeast syrtis major. Geophys. Res. Lett. 39:L11202.
Ehlmann, B. L., Mustard, J. F., Fassett, C. I., Schon, S. C., Head, J. W. III, Des Marais, D. J., et al. (2008a). Clay-bearing minerals and organic preservation potential in sediments from a Martian delta environment, Jezero crater, Nili Fossae, Mars. Nat. Geosci. 1, 355–358. doi: 10.1038/ngeo207
Ehlmann, B. L., Mustard, J. F., Murchie, S. L., Poulet, F., Bishop, J. L., Brown, A. J., et al. (2008b). Orbital identification of carbonate-bearing rocks on Mars. Science 322, 1828–1832. doi: 10.1126/science.1164759
Ehlmann, B. L., Mustard, J. F., Swayze, G. A., Clark, R. N., Bishop, J. L., Poulet, F., et al. (2009). Identification of hydrated silicate minerals on Mars using MRO-CRISM: Geologic context near Nili Fossae and implications for aqueous alteration. J. Geophys. Res. 114:E00D08.
Ehlmann, B. L., Swayze, G. A., Milliken, R. E., Mustard, J. F., Clark, R. N., Murchie, S. L., et al. (2016). Discovery of alunite in cross crater, terra sirenum, mars: evidence for acidic, sulfurous waters. Am. Mineral. 101, 1527–1542. doi: 10.218/am-2016-5574
Gaillard, F., Michalski, J., Berger, G., McLennan, S. M., and Scaillet, B. (2013). Geochemical reservoirs and timing of sulfur cycling. Space Sci. Rev. 174, 251–300. doi: 10.1007/978-1-4614-7774-7_9
Gendrin, A., Mangold, N., Bibring, J. P., Langevin, Y., Gondet, B., Poulet, F., et al. (2005). Sulfates in Martian layered terrains: The OMEGA/Mars express view. Science 307, 1587–1591. doi: 10.1126/science.1109087
Goesmann, F., Brinckerhoff, W. B., Raulin, F., Goetz, W., Danell, R. M., Getty, S. A., et al. (2017). The Mars Organic Molecule Analyzer (MOMA) instrument: characterization of organic material in martian sediments. Astrobiology 17, 655–685. doi: 10.1089/ast.2016.1551
Goudge, T. A., Mustard, J. F., Head, J., Fassett, C. I., and Wiseman, S. M. (2015). Assessing the mineralogy of the watershed and fan deposits of the Jezero crater paleolake system. Mars. J. Geophys. Res. 120:4.
Grant, J. A., Irwin, R. P., Grotzinger, J. P., Milliken, R. E., Tornabene, L. L., McEwen, A. S., et al. (2008). HiRISE imaging of impact megabreccia and sub-meter aqueous strata in holden crater. Mars. Geol. 36, 195–198. doi: 10.1130/g24340a.1
Grieve, R. A. F., Osinski, G. R., and Tornabene, L. L. (2014). Chapter 21-planetary impacts. Encycl. Sol. Syst. II, 83–99. doi: 10.1016/B978-0-12-415845-0.00004-9
Hartmann, W. K. (2005). Martian cratering VIII: isochron refinement and the chronology of Mars. Icarus 174, 294–320. doi: 10.1016/j.icarus.2004.11.023
Hartmann, W. K., and Neukum, G. (2001). Cratering chronology and the evolution of Mars. Space Sci. Rev. 96, 165–194. doi: 10.1007/978-94-017-1035-0_6
Hiesinger, H., van der Bogert, C. H., Pasckert, J. H., Funcke, L., Giacomini, L., Ostrach, L. R., et al. (2012). How old are young lunar craters? J. Geophys. Res. Planet. 117:E00H10.
Howari, F. M., Sharma, M., Nazzal, Y., AlAydaroos, F., and Xavier, C. M. (2020a). “Atmospheric and topographic analysis of mars,” in Proceedings of the 51st Lunar and Planetary Science Conference, The Woodlands, Texas: LPI Contribution No. 2326.
Howari, F. M., Sharma, M., Nazzal, Y., AlAydaroos, F., and Xavier, C. M. (2020b). “Geological mapping and chronological based crater counting analysis (CSFD) of mars,” in Proceedings of the 51st Lunar and Planetary Science Conference, (The Woodlands, Texas: Texas. LPI Abstract No. 1265).
Kneissl, T., van Gasselt, S., and Neukum, G. (2011). Map-projection-independent crater size-frequency determination in GIS environments—new software tool for ArcGIS. Planet. Space Sci. 59, 1243–1254. doi: 10.1016/j.pss.2010.03.015
Lagain, A., Servis, K., Benedix, G. K., Norman, C., Anderson, S., and Bland, P. A. (2021). Model age derivation of large martian impact craters, using automatic crater counting methods. Earth Space Sci. 8:e2020EA001598. doi: 10.1029/2020EA001598
Malin, M. C., Bell, J. F., Calvin, W. M., Cantor, B. A., Clancy, R. T., Edgett, K. S., et al. (2007). “Initial observations by the MRO mars color imager and context camera,” in Proceedings of the Lunar Planet Science XXXVIII, (Denver, CO: Denver Museum of Nature & Science).
Michael, G. G. (2013). Planetary surface dating from crater size frequency distribution measurements-Multiple resurfacing episodes and differential isochron fitting: Icarus. 226, 885–890. doi: 10.1016/j.icarus.2013.07.004
Michalski, J., and Niles, P. (2010). Deep crustal carbonate rocks exposed by meteor impact on Mars. Nat. Geosci. 3, 751–755. doi: 10.1038/ngeo971
Milliken, R. E., Swayze, G. A., Arvidson, R. E., Bishop, J. L., Clark, R. N., Ehlmann, B. L., et al. (2008). Opaline silica in young deposits on Mars. Geology 36, 847–850. doi: 10.1130/g24967a.1
Moore, H. J., Hutton, R. E., Scott, R. F., Spitzer, C. R., and Shorthill, R. W. (1977). Surface materials of the Viking landing sites. J. Geophys. Res. 82, 4497–4523. doi: 10.1029/JS082i028p04497
Murchie, S., Arvidson, R., Bedini, P., Beisser, K., Bibring, J.-P., Bishop, J., et al. (2007). Compact reconnaissance imaging spectrometer for mars (CRISM) on mars reconnaissance orbiter (MRO). J. Geophys. Res. 112:E05S03. doi: 10.1029/2006JE002682
Murchie, S., Seelos, F. P., Hash, C. H., Humm, D. C., Malaret, E., McGovern, J. A., et al. (2009). CRISM investigation and data set from the Mars reconnaissance orbiter’s primary science phase. J. Geophys. Res. 114:E00D07. doi: 10.1029/2009JE003344
Mustard, J., Murchie, S. L., Pelkey, S. M., Ehlmann, B. L., Milliken, R. E., Grant, J. A., et al. (2008). Hydrated silicate minerals on Mars observed by the CRISM instrument on MRO. Nature 454, 305–309. doi: 10.1038/nature07097
Mustard, J. F., Murchie, S., Pelkey, S., Ehlmann, B., Milliken, R., Grant, J., et al. (2008). Hydrated silicate minerals on Mars observed by the Mars reconnaissance orbiter CRISM instrument. Nature 454, 305–309.
National Research Council (2003). Assessment of Mars Science and Mission Priorities. Washington, DC: The National Academies Press, doi: 10.17226/10715
Neukum, G. (1983). Meteorite Bombardment and Dating of Planetary Surfaces. Translation of: Meteorite Bombardment und Datierung Planetarer Oberfl€achen. Tenure Thesis. Munich: Ludwig-Maximilians University, 1–186.
Neukum, G., Konig, B., and Arkani-Hamed, J. (1975). A study of lunar impact crater size-distributions. Moon 12, 201–229. doi: 10.1007/bf00577878
Nimmo, F., and Tanka, K. (2005). Early crustal evolution of Mars. Annu. Rev. Earth Planet. Sci. 33, 133–161. doi: 10.1146/annurev.earth.33.092203.122637
Osterloo, M. M., Hamilton, V. E., Bandfield, J. L., Glotch, T. D., Baldridge, A. M., Christensen, P. R., et al. (2008). Chloride-bearing materials in the southern highlands of Mars. Science 319, 1651–1654. doi: 10.1126/science.1150690
Palucis, M. C., Jasper, J., Garczynski, B., and Dietrich, W. E. (2020). Quantitative assessment of uncertainties in modeled crater retention ages on Mars. Icarus 314:113623. doi: 10.1016/j.icarus.2020.113623
Platz, T., Massironi, M., Byrne, P. K., and Hiesinger, H. (eds) (2015). Volcanism and Tectonism Across the Inner Solar System. Geological Society, Vol. 401. London: Special Publications, 1–56.
Poulet, F., Arvidson, R. E., Gomez, C., Morris, R. V., Bibring, J.-P., Langevin, Y., et al. (2008). Mineralogy of Terra Meridiani and western Arabia Terra from OMEGA/MEx and implications for their formation. Icarus 195, 106–130. doi: 10.1016/j.icarus.2007.11.031
Poulet, F., Bibring, J.-P., Mustard, J. F., Gendrin, A., Mangold, N., Langevin, Y., et al. (2005). Phyllosilicates on Mars and implications for early Martian climate. Nature 438, 623–627. doi: 10.1038/nature04274
Seelos, F. P., Viviano-Beck, C. E., Morgan, M. F., Romeo, G., Aiello, J. J., Murchie, S. L., et al. (2016). “CRISM hyperspectral targeted observation PDS product sets—TERs and MTRDRs,” in Paper presented at 47th Lunar and Planetary Science Conference, (Texas, TX: Lunar and Planetary Institute). Abstract 1783.
Squyres, S. W., Arvidson, R. E., Bell, J. F. III, Brückner, J., Cabrol, N. A., Calvin, W., et al. (2004a). The Opportunity Rover’s athena science investigation at meridiani planum Mars. Science 306, 1698–1703. doi: 10.1126/science.1106171
Squyres, S. W., Arvidson, R. E., Bell, J. F., Brückner, J., Cabrol, N. A., Carr, M. H., et al. (2004b). The Spirit Rover’s athena science investigation at Gusev Crater. Mars. Sci. 305, 794–799. doi: 10.1126/science.3050794
Tanaka, K. L., Chapman, M. G., and Scott, D. H. (1992). Geologic Map of the Elysium Region of Mars. U.S. Geological Survey Misc. Inv. Series Map I-2147. Washington, DC: U.S. Department of the Interior.
Tanaka, K. L., Skinner, J. A., Dohm, J. M., Irwin, R. P. III, Kolb, E. J., Fortezzo, C. M., et al. (2014). Geologic Map of Mars. U.S. Geological Survey Scientific Investigations Map 3292. Available online at: https://dx.doi.org/10.3133/sim3292.
The National Academies Press (2011). Mars: Evolution of an Earth-Like World. Vision and Voyages for Planetary Science in the Decade 2013-2022. Washington, DC: The National Academies Press.
Vasavada, A. R., Grotzinger, J. P., Arvidson, R. E., Calef, F. J., Crisp, J. A., Gupta, S., et al. (2014). Overview of the Mars science laboratory mission: bradbury landing to yellowknife bay and beyond. J. Geophys. Res. Planets. 119, 1134–1161. doi: 10.1002/2014JE004622
Viviano-Beck, C. E., Seelos, F. P., Murchie, S. L., Kahn, E. G., Seelos, K. D., Taylor, H. W., et al. (2014). Revised CRISM spectral parameters and summary products based on the currently detected mineral diversity on Mars. J. Geophys. Res. 119, 1403–1431. doi: 10.1002/2014je004627
Wang, Y., and Wu, B. (2019). Active machine learning approach for crater detection from planetary imagery and digital elevation models. IEEE Trans. Geosci. Remote Sens. 57, 5777–5789. doi: 10.1109/tgrs.2019.2902198
Warner, N. H., Gupta, S., Calef, F., Grindrod, P., Boll, N., and Goddard, K. (2015). Minimum effective area for high resolution crater counting of martian terrains. Icarus 245, 198–240. doi: 10.1016/j.icarus.2014.09.024
Werner, S. C., and Tanaka, K. L. (2011). Redefinition of the crater-density and absolute-age boundaries for the chronostratigraphic system of Mars. Icarus 215, 603–607. doi: 10.1016/j.icarus.2011.07.024
Wray, J., Murchie, S., Ehlmann, B., Milliken, R., Seelos, K., Noe Dobrea, E., et al. (2011). Evidence for regional deeply buried carbonate-bearing rocks on Mars. Paper Presented at the 42nd Lunar and Planetary Science Conference, Texas, TX.
Keywords: Mars, geological processes, machine learning, chronology, CSFD, mineralogy, spectroscopy
Citation: Howari FM, Sharma M, Xavier CM, Nazzal Y and AlAydaroos F (2021) Chronological Analysis and Remote Sensing of Craters on the Surface of Mars. Front. Environ. Sci. 9:605893. doi: 10.3389/fenvs.2021.605893
Received: 13 September 2020; Accepted: 08 March 2021;
Published: 28 April 2021.
Edited by:
Maged Marghany, Syiah Kuala University, IndonesiaReviewed by:
Jawahar Kurniji, Sanjay Ghodawat IIT & Medical Academy, IndiaDinish Siwan, University of Balochistan, Pakistan
Copyright © 2021 Howari, Sharma, Xavier, Nazzal and AlAydaroos. This is an open-access article distributed under the terms of the Creative Commons Attribution License (CC BY). The use, distribution or reproduction in other forums is permitted, provided the original author(s) and the copyright owner(s) are credited and that the original publication in this journal is cited, in accordance with accepted academic practice. No use, distribution or reproduction is permitted which does not comply with these terms.
*Correspondence: Manish Sharma, TWFuaXNoLlNoYXJtYUB6dS5hYy5hZQ==