 Salma Habib
 Sami G. Al-Ghamdi
- Division of Sustainable Development, College of Science and Engineering, Hamad Bin Khalifa University, Doha, Qatar
Urban areas are significant sources of anthropogenic carbon dioxide (CO2), which elevates air pollution. However, urban greenery has a positive effect on mitigating air pollution and the impact of CO2 on the climate. Quantifying the benefits of greenery for urban environments involves complex calculations and requires significant resources. Such a quantifying exercise is not cost-effective. The satellite remote sensing method can analyze current and near-present carbon-stock dynamics through spectral band imaging. In this research study, field measurements determine above-ground carbon (AGC) stock. The field measurements are derived from three types of land use, comprising public parks and gardens, institutional parks, and street and avenue greenery in selected locations in Doha city in Qatar. These field measurements are then correlated with results from satellite images. Linear and non-linear regression models are established between AGC and five vegetative spectral indices (VIs) derived from the Landsat 8 Operational Land Imager (OLI). The AGC stock for the selected locations in Doha in 2014 is evaluated using the highest coefficient of determination with the highest accuracy expected. The results of the analysis reveal that both the normalized difference vegetation index (NDVI) (R2 = 0.64) and the relative ratio vegetation index (R2 = 0.71) significantly correlate with the AGC in public parks. In avenue vegetation, all the VIs exhibit high R2, but the best fit is NDVI (R2 = 0.87). The CO2 equivalent range evaluated from the AGC in the plots studied in Doha is measured as 650.6 tons for the period between 2014 and 2020, with an annual sequestration rate of 108.4 tons per year. This CO2 equivalent storage amount has the social value of USD 42,286, which is the equivalent of QR 155,192. The AGC-VI correlation in land-use groups may be influenced by the turf grass and impervious surfaces in the background of the images. Further study of urban landscapes and vegetation with high biomass is likely to show its positive effects for cities and that it can improve carbon dioxide abatement, resulting in more sustainable societies. This improvement in CO2 abatement in Qatar can be useful for various environmental estimations for the upcoming mega event of World Cup 2022.
Introduction and Background
Greenhouse gases (GHGs) have global warming potential that directly affects global climate change. Increased carbon dioxide (CO2) concentrations in the atmosphere, along with other GHGs result in degradation of climate quality. According to the 2015 United Nations Climate Conference (UNFCCC, 2015), the mitigation of atmospheric CO2 is vital to reduce the associated environmental problems. Elevated CO2 concentration is dangerous for biodiversity. Key strategies for reducing the level of CO2 in cities are urban vegetation and urban forests because they contribute effectively toward the sustainability of towns (McPherson et al., 1994; Nowak and Crane, 2002; McPherson and Muchnick, 2005). Trees play a significant role in combating climate change. They absorb CO2 and some air pollutants, purify rainwater, guard against landslides, and absorb water pollutants (nitrate and phosphate runoff). The photosynthesis process in vegetation allows the absorption and utilization of atmospheric CO2 and transforms it into energy stored in biomass (Nowak and Crane, 2002; Nowak et al., 2008; McPherson et al., 2011; Larondelle and Haase, 2013).
The changes that happen to the biomass of vegetation during a certain period within a specific area are the biomass growth rate. This variable is needed to establish a quantitative measurement of carbon sequestration and emission rate between the atmosphere and terrestrial ecosystems. Therefore, the term “biomass” applies to the biomass density of plants, which is mass per unit of living and dead plant content (Nowak et al., 2003; Iwata, 2007; Assefa et al., 2013). By increasing the biomass density in urban areas, there is a high potential for climate change mitigation and air quality improvement through enhancing carbon sequestration (DeFries et al., 2000; Global Forest Resources Assessment, 2020; Strohbach and Haase, 2012; Nyamugama and Kakembo, 2015; Bottalico et al., 2016). How to establish adaptation strategies for biodiversity evaluation and tracking and controlling of carbon is a key focus since these factors are necessary for meeting national climate change commitments. In land-cover areas, forests play a fundamental role as carbon sinks, contributing approximately 80% of global terrestrial above-ground biomass (AGB). However, information on these carbon sinks is difficult to obtain and there is uncertainty concerning their significance and role (Saatchi et al., 2007; Ometto et al., 2014). Most of this uncertainty derives from the absence of adequate information on the spatial distribution of carbon biomass (Durante et al., 2019).
Above-ground biomass (AGB) refers to all live biomass that resides above the soil including seeds, branches, stems, bark, stumps, and foliage. Measurement methods for AGB include harvesting (destructive), estimation (non-destructive), or a combination of these two methods (double sampling) (Natural Resources Conservation Service and Grazing Lands Technology Institute, 2000). Destructive harvesting requires the harvesting of a live tree to gain measurements of its actual weight and water content (Thevathasan and Gordon, 2004; Miller and Fujii, 2011; Wotherspoon et al., 2014; Thomas et al., 2020). Dimensional analysis (non-destructive) involves measuring the dimensions of leaves, trunk diameter, tree height, and crown diameter. Individual tree biomass can be predicted by studying the regularity of the disproportionate growth relationship between the plant’s height and diameter at breast height (DBH) and the biomass of a species or group of species (Clark et al., 1986; Nowak, 1993; McPherson et al., 1994). Overall, individual measurements are taken since they depend on the condition of the area of the plantation [climate zone, soil, water, surroundings (rural or urban)]. To gain large-scale (global) measurements, the generalized data need to be collected from different areas for optimization based on consistency and to account for uncertainty. In terms of equation configurations, input data requirements, and component designations, dimensional analysis (i.e., allometric equations) can help in estimating the biomass carbon anywhere on a broad scale and allowing for consistency.
Although field measurements are usually the most reliable method for providing accurate data on biomass and carbon values, this method becomes less efficient and more expensive when applied to large areas and forests. This method requires the expenditure of significant labor and time (De Gier, 2003; Pandapotan Situmorang and Sugianto, 2016). Therefore, broad-ranging research mainly focuses on remote sensing technology. For decades, this technology has been developed and employed to collect data related to many types of biomass in various conditions (Franklin and Hiernaux, 1991; Jianya et al., 2008; Kumar et al., 2015; Pandapotan Situmorang and Sugianto, 2016; Roy and Ravan, 1996). Satellite data are easily collected and used for estimating carbon stocks derived from spatio-temporal geographical and global dimensions (Gonzalez et al., 2010; Ko et al., 2017; Myeong et al., 2006; Xiao et al., 2015; Yao et al., 2015). Experiments employing remote sensing are used to generate regression models focusing on the relationships between field observations and satellite picture vegetation indicators for estimating above-ground carbon (AGC) stocks (Yao et al., 2015). A vegetation index (VI) is an index obtained through mathematical operations (subtraction, addition, and ratio fraction) between specific spectral bands of satellite imagery and can be mathematically related to vegetation [red, green, blue, and near-infrared (NIR) bands] (Yao et al., 2015). Furthermore, VIs are usually used to test and verify the carbon-stock data in the field in many urban carbon-stock studies (Issa et al., 2020; Pandapotan Situmorang and Sugianto, 2016; Vashum, 2012). These indices are commonly used to estimate the biomass level, density changes, and enhancements. In most tropical and temperate climates, the normalized difference vegetation index (NDVI) is generally considered to be the key vegetation index provided by the fitted model to allow for a satisfactory output for better biomass prediction from different satellite images (Durante et al., 2019; Xue and Su, 2017). The NDVI is the most appropriate and commonly used vegetative index for the study of carbon dynamics (Amoatey et al., 2018; Amoatey and Sulaiman, 2020; Durante et al., 2019; Issa et al., 2019; Myeong et al., 2006; Yao et al., 2015). NDVI is the most relevant for biomass and field measures as it offers information regarding the net primary production (vegetation) over time (Bayat et al., 2012; Neigh, 2008; Parece and Campbell, 2017; Xu et al., 2012; Zhu et al., 2017). However, NDVI saturation is observed in regions with high biomass as the link between biomass and NDVI is smaller. The enhanced vegetation index (EVI) is equivalent to the NDVI for quantifying green vegetation. However, EVI corrects background noise for certain ambient environments and the background of the canopy, which are more responsive to thick plants (Huete et al., 1999). These improvements enable index measurement to relate the factors between the R to NIR ratio, reduce background noise, saturation, and atmospheric interference (Amoatey et al., 2018). There are many other vegetative indices, including differential vegetative indices (DVI), ratio vegetative index (RVI), and soil adjusted vegetative index (SAVI) (Bausch, 1993; Payero et al., 2004; Qi et al., 1994). Several previous studies have shown that SAVI is the most appropriate VI in sparse foliage as it can minimize background influences (Barati et al., 2011; Bausch, 1993; Qi et al., 1994). Forest AGB assessments can further be combined and optimized with the same method of plot-level ground-based measurements and bio-geophysical spectral variables (Figure 1). In this study VIs variables were extracted from the Landsat 8 Operational Land Imager (OLI) satellite imagery system that was computed at different time ranges from 2014 to 2020. These methods are typically undertaken to spatially predict biomass and the related uncertainty (Ahmad, 2012; Tuanmu and Jetz, 2014; Xu et al., 2018). The urban vegetation in Doha city, Qatar was studied thoroughly to assess the effect of vegetation in improving Doha’s climatic conditions by abating CO2 from the atmosphere during the assigned period of 6 years.
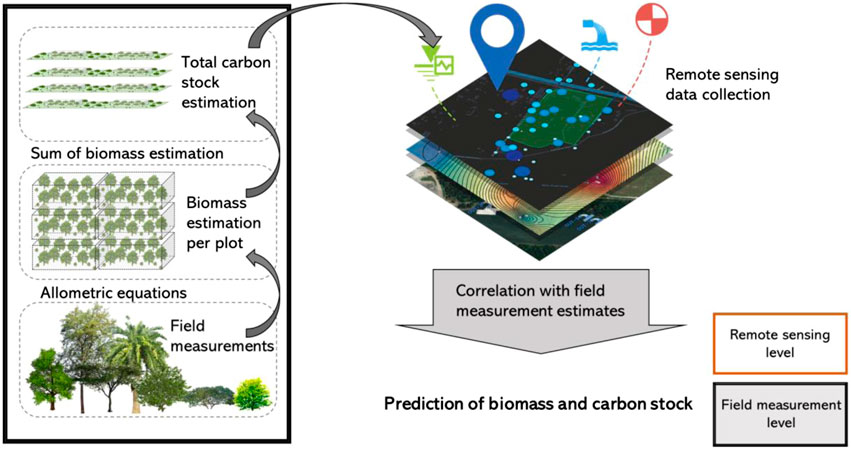
FIGURE 1. The road map of the methodology applied in this study.
This study presents an estimation of the potential of carbon stock in green areas established in Doha in the last decade. Doha is an arid city with minimal vegetation and primarily man-made, cultivated land. The government is pursuing a project of planting one million trees around the city (Ataullah, 2019). Therefore, assessing the effect of biomass increase on the absorption of CO2 is vital for Doha as a city. The assessment was carried out by measuring the AGC (storage and sequestration potential). The research combined direct field measurement with remote sensing analysis through the application of vegetation indices formulas for the targeted plot areas. Further measurements of the rate of change in the vegetation density from 2014 to 2020 were carried out. This paper assesses the carbon sequestered or to be sequestered from these urban landscapes. This investigation contributes to an understanding of the importance of atmospheric CO2 abatement in increasing the sustainability and resilience of these societies. Figure 1 illustrates a road map of the methodology applied in this study.
Methods and Procedures
Study Area
This study was conducted in Doha city, which is the capital of Qatar. Qatar is a gulf state in the Middle East. Doha is at latitude 25°17′12″N to 25°28′0″N and longitude 51°32′0″E to 51°52′0″E, on the Arabian Gulf, as shown in Figure 2. The elevation of Qatar ranges from 0 m near the coastal areas and a maximum of 100 m above sea level in the hills. The general climate of the area is arid. The climate ranges from mild with spring-like winters (lowest temperature of 7°C) to very hot humid summers (highest temperature 50°C). Rainfall provides a significant source of fresh water. The annual average rainfall can reach 100 mm and rain mostly occurs in winter. Qatar is experiencing substantial socioeconomic growth, which is associated with a significant increase in urbanization and industrialization. The population in Qatar increased from 592,468 in 2000 to 2,807,805 in 2020 (Ministry of Development Planning and Statistics, 2019). In Qatar, over the last 10°years, the importance of vegetation in urban landscapes has been emphasized as an essential part of sustainable urbanization. This emphasis has encouraged a rapid increase in plantings and the number of trees everywhere in the country, and especially in the capital. Doha has many parks and gardens distributed across the city and managed by the Ministry of Municipality and Environment. There are also several non-governmental parks in the city that are managed by private institutions.
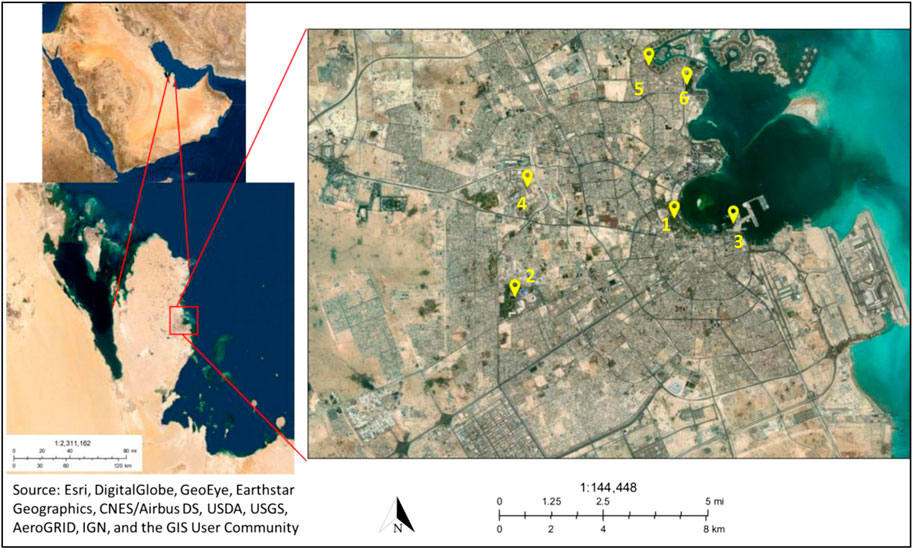
FIGURE 2. Qatar, Doha city map, at latitude 25°17′12″N and longitude 51°32′0″E. The pins in the map refer to the land investigated in this study: 1) Albidaa Park, 2) Aspire Park, 3) MIA Park, 4) Oxygen Park, 5) Alkhafji Street, and 6) Tarfa Street (USGS, 2019).
Identification of Urban Greenery
The selected parks and streets examined in this study were among the main green spaces found in Qatar. These green city areas were selected for study due to their significant social and environmental value. A field survey and Google Earth Pro software (images of the spaces in 2020) were used to identify green urban landscapes in Doha for the study. The types of land use for this study were selected based on functional and location-based classification and significance contribution to the green areas in Doha. Three main types of land use were found to be major elements in respect of vegetation in Doha city: public parks and gardens (PP), institutional parks and greeneries (IP), and the streets and avenues trees and plantings (AP) (Table 1). The randomly selected areas for the study contributed only 1.24% of the total land area (Table 2). Even though the sampled area is small, it contains the main planted area of all the land. (There is hard and soft land in the total parks area and the samples were all green lands with concentrated trees.)

TABLE 1. The land-use types and the selected parks and areas.
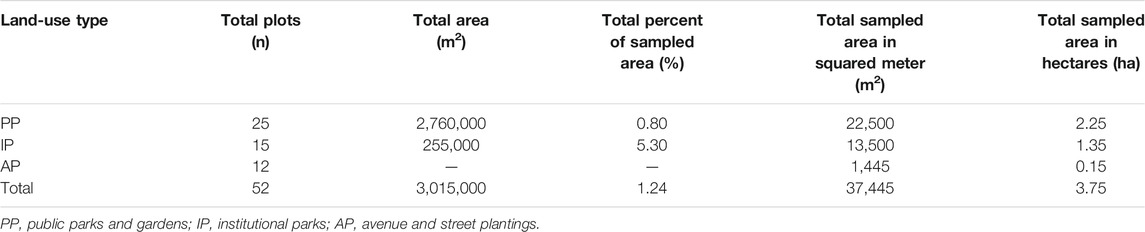
TABLE 2. Field data and land-use types.
Public Parks and Gardens
Public parks and gardens are usually all the vegetation found in public areas managed by the government rather than by business or commercial authorities. These areas are well-known for their benefits to the public through the provision of shade, picnic areas, and peaceful atmospheres. Maintenance procedures, such as watering, fertilizing, mowing, and leaf litter removal, are regularly carried out. The selected parks in this study were the two largest parks in Doha: Albidaa Park (ABP) and Aspire Park (ASP) (Figures 3A,B). The tree species in the two parks were mainly Phoenix sp (palm tree), Conocarpus lancifolius, Eucalyptus, Ficus benghalensis, Ficus altissima, Albizia lebbeck, Adansonia gregorii (Boab tree), Ceiba speciosa, Nilotica sp. Tamarindus indica, Azadirachta indica, Ficus religiosa, Vachellia nilotica, Acacia arabica (Arabic Gum tree), and Ceratonia siliqua.
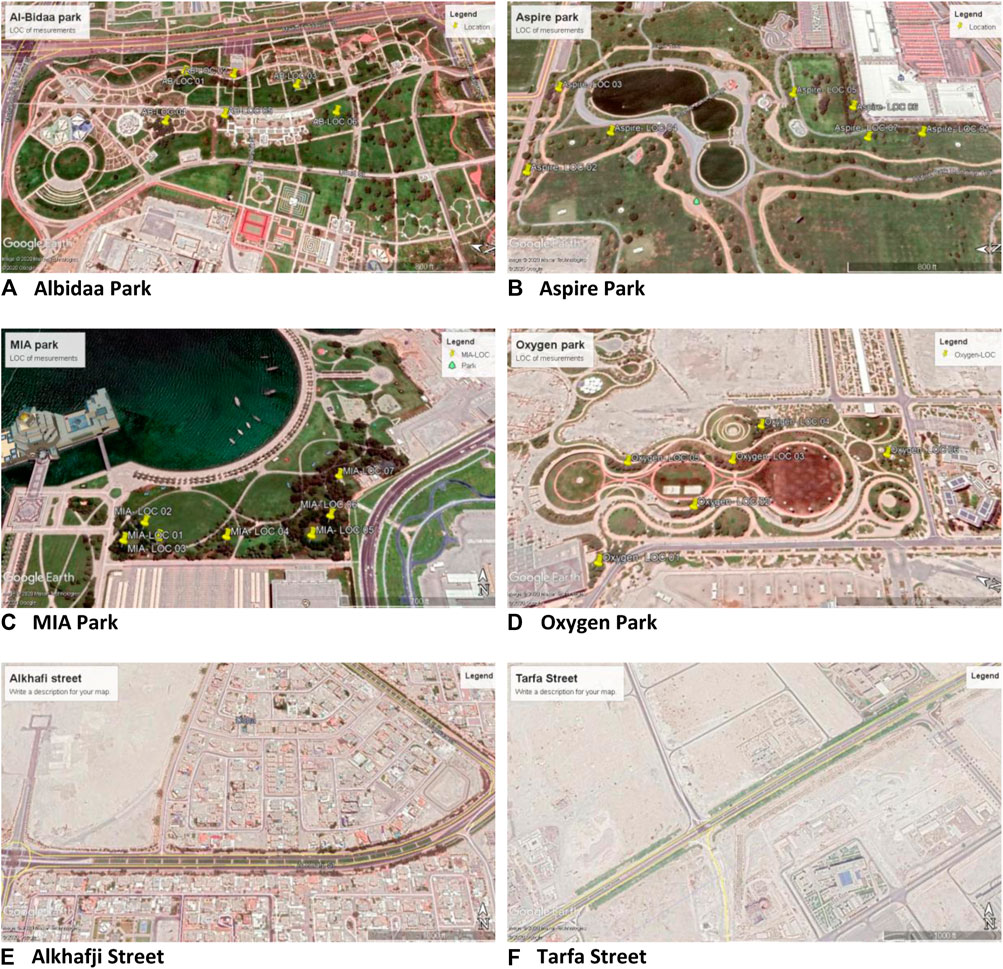
FIGURE 3. Locations assigned for the selected land-use types.
Institutional Parks
Institutional vegetation consists of landscapes found in institutions (which are usually open to the public but with some restrictions), such as primary ministries, hospitals, universities, or museums. Institutional parks provide relaxing and shaded areas for visitors, students, or attendees. Intensive maintenance in these green areas is similar to the PP and involves regular irrigating, mowing, fertilizing, and pruning. The parks studied were Oxygen Park, managed by the Qatar Foundation Authority in Education City and MIA Park belonging to the Museum of Islamic Art institution (Figures 3C,D). Trees and shrubs varied, and the main species found were Acacia tortilis, Alstonia scholaris (L.), Nilotica sp.Tamarindus indica, Vachellia nilotica, Acacia arabica (Arabic Gum tree), Azadirachta indica, Pithecellobium dulce, Phoenix dactylifera, Olea europaea, Conocarpus lancifolius, and Ziziphus spina-christi.
Street Plantings and Trees
Trees, shrubs, palm trees, and other plantings are found on the sides of streets, avenues, and highways. They provide protection from sand, winds, floods, and soil erosion, and provide a buffer for car accidents. Unlike the other two green areas outlined above, the maintenance of this vegetation is rather moderate and involves regular irrigating and pruning. The streets selected for study were Alkhafji and Tarfa Streets (Figures 3E,F). Alkhafji Street contained several types of trees, whereas the trees in Tarfa Street were mainly one type of tree. These trees were principally Azadirachta indica, Conocarpus lancifolius, and Acacia farnesiana.
Field Survey and Data Collection
A stratified sampling approach was used to collect field data in the selected strata (the three land-use types). This sampling approach was chosen to abate the uneven distribution of vegetation and to reduce the uncertainty of the measurements in total (biomass and carbon-stock calculations) (Stoffberg et al., 2010). In this study, 52 plots were studied in the six locations selected for three land-use types (PP, IP, and AP) with a total area of 37,445 m2. The sample areas of each plot in the first two land-use types (PP and IP) were divided into 30 × 30 m quadrats (Figure 4A). Since the street plantations (AP) form a line, the transect line method was applied, measuring trees randomly at intervals of 50 m for each 100 m path within a street line of 1 km length (Figure 4B) (Ramsey, 1979; Jensen and Meilby, 2012). The coordinates of each located plot were taken by a geographical coordinates app with an accuracy of 5–10 m in diameter. The collected data taken from these plots were mainly the diameter of trees at breast height (DBH at 1.3 m), the diameter (D) of shrubs and tree-like shrubs, and the height of palms (stem height Hstem). The measurements of the diameter were carried out using fiberglass measuring tape (20 m, Juneng JN080203, China). For the heights, the triangular method was applied with the aid of measuring tape (10 m, Juneng JN080117, China).

FIGURE 4. Field survey methods used for various land-use.
Biomass and Carbon-Stock Estimations
Biomass Calculations
Allometric equations were used to estimate the biomass values of the trees and the vegetation in the field. However, the variance of the tree types and difficulties in gaining specific regression models for each species (some species did not have allometric equations) resulted in some limitations to the effectiveness of this method. However, overall, using allometric regression equations has proved a reliable and non-destructive method for estimating AGC stocks. The formulation of allometric equations in this research focused on the subtropical thicket vegetation characteristics present in the study region together with those used by Amoatey et al. (2018), Myeong et al. (2006), Yao et al. (2015). A standard form of general equation was used based on the specific associated zone (temperate zone) (Table 3) (Nowak and Crane, 2002; Chave et al., 2005; Stoffberg et al., 2010; Liu and Li, 2012; Yao et al., 2015). Accordingly, DBH, Hstem, and Dshrubs were used, based on the assigned equation to estimate the AGB (Nowak and Crane, 2002; Myeong et al., 2006; Liu and Li, 2012). The AGB calculations were assigned to provide the nearest estimation of the AGC-stock values. Based on the type of land use, the biomass models might differ from one to another (depending on maintenance and land resources variations). All the selected locations were human-made landscapes, and the trees were planted rather than being self-seeding. This factor may affect the estimation of the biomass and, thus, the calculation of the carbon-stock values based on the growth rate and girth of each type of tree and palm. Therefore, to reduce this uncertainty and compensate the values with the closest estimations carried out with forest trees, any area with different conditions from naturally grown trees received a factor of 0.8 multiplied by the biomass value. Nevertheless, no changes were applied for the remaining areas where resemblance in environmental conditions was certain (McPherson, 1998; McPherson et al., 1999; Peper et al., 2001; Nowak et al., 2013).

TABLE 3. Specified biomass equations based on general allometric equations.
Carbon-Stock Estimation From the Field Data
The percentage of carbon in a tree biomass is approximately 50%. Hence, the carbon-stock values were evaluated by multiplying the total biomass (BM) by 0.5 (Eq. 1) (Nowak et al., 2003; Stoffberg et al., 2010; Liu and Li, 2012). A diagnostic procedure took place in which the tree condition might be significant in the assessment of carbon and biomass values. A health condition evaluation could be undertaken on a tree by rating it as excellent (1.0), poor (0.75), critical (0.42), dying (0.15), and dead (0.0). These calculations were based on the assigned factors of tree health (Nowak et al., 2013). The landscapes in this study exhibited higher growth rates than natural trees in normal conditions as they received intensive care and maintenance (irrigating, pruning, fertilizing, and applying pesticides). The evaluation of the trees’ conditions delivered ratings of excellent conditions and 1.0 health factors. Lastly, to evaluate the atmospheric CO2 weight fixed in the biomass, carbon weight (in kg or tons) was multiplied by the ratio of the CO2 molecular weight to the atomic carbon weight: 44/12 or 3.67 (Stoffberg et al., 2010; Assefa et al., 2013; Amoatey and Sulaiman, 2019).
Remote Sensing and Data Acquisition
Remote sensing analysis was carried out to gain an accurate estimation of the carbon stock above the ground in the selected landscapes. The map images and spectral data were obtained through Earth Explorer, which is operated by the U.S. Geological Survey (USGS) (USGS, 2019). Satellite images were acquired from the Landsat 8 OLI. These images, with full multispectral and thermal analysis, were used to estimate the vegetation indices (VI) with a resolution of 30 × 30 m (medium resolution). Landsat 8 OLI was launched in 2013 and collects approximately 11 spectral bands. Four spectral bands were relevant for this study: blue, green, red, and infrared (as shown in Figure 5). Additionally, two images were acquired from May 23, 2014 and May 23, 2020 and field measurements were carried out. These field measurements estimated carbon-stock changes and relative sequestration throughout this period. Environment Visualizing Images software (ENVI 5.3) was used to establish the VI evaluations. Relative radiometric and atmospheric corrections were applied to the two selected images using the ENVI 5.3 software. Radiometric correction was applied to eliminate the multitemporal images associated with the conditions of the atmosphere in the image. Atmospheric correction was carried out using the FLAASH (fast line-of-sight atmospheric analysis of spectral hypercubes) method. No adjustments were applied in the geometric analysis as the images from Landsat 8 OLI are corrected by NASA, using a digital elevation model (DEM) with ground control (L1T).
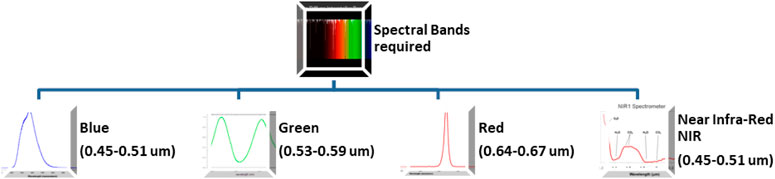
FIGURE 5. Spectral bands used to assess vegetative indices (in Landsat 8 OLI).
Carbon-Stock and Vegetative-Indices Correlation Models
The vegetation indices (VIs) used in this study were the primary types of index (Table 4). These indices are frequently used to verify AGC stock estimations. All the VI equations were calculated through the software with their specified equations (see Table 4). Regression equations were created (linear and non-linear) to correlate the relationship between the value of the VIs with the corresponding field measured carbon-stock values. These values depended mainly on two spectral bands: NIR and red. Linear and non-linear regression models have traditionally been the method of choice for predicting vegetation quantities (Dungan, 1998). The regression model was developed based on each plot studied and its corresponding VI values acquired from the ENVI 5.3 software. The values of the VIs were proposed as the independent variables and carbon-stock values were the dependent ones. The unit of carbon stock was taken as kg C per plot or pixel. The resulting graphs show a considerable coefficient of determination (R2) in the relationship between VI and AGC. These findings were then used to provide the best estimation of the total carbon stock in the total area under study at the present time and in a previous year (2020 and 2014, respectively). The regression model analyses were completed using IBM SPSS software V.26.
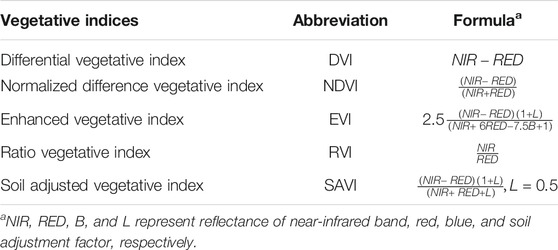
TABLE 4. Types of spectral vegetative indices used.
Results and Discussion
Estimating Above-Ground Biomass and Carbon Stock
The field measurements were carried out for three land-use types with 52 plots (30 × 30 m2) and 603 trees were investigated (Table 5). The DBH values varied significantly in each selected park or street, based on the type of trees planted. These values ranged from 20 up to 150 cm. Some circumferences reached up to 500 cm in ASP for some Ficus religiosa and Ficus benghalensis tree types. Regardless of the tree types, the general forms of allometric equations were used. The AGB and carbon values were estimated with 215, 261, and 127 trees measured in PP, IP, and AP and found to have approximately 279, 147, and 108 tons, respectively. With the assumption of an area occupied by trees or greeneries, the total biomass can reach up to 250 tons and around 125 tons of carbon per hectare (Eq. 2). These values were further used for the AGC-VIs modeling in which each specified plot has its carbon values estimated.

TABLE 5. Total amount of biomass and above-ground carbon in the selected land-use types.
Total biomass per hectare:
Where: W = total biomass per hectare (ton/ha); Wi = biomass of tree (ton); A = plot size a rea (m2); N = number of trees.
Modeling Vegetative Indices Based on Remote Sensing Landsat 8 Operational Land Imager to Predict Above-Ground Carbon
To predict the values of AGC, statistical models were built to relate the values measured in the field to the values of VIs calculated from the satellite images (NDVI, EVI, DVI, RVI, and SAVI). Linear and non-linear statistical regression models were constructed and optimized between each VI and the field survey data. The regression lines were plotted and the equations of the graphs with their coefficients of determination R2 and p-values were analyzed through IBM SPSS. Based on the lowest values of p-value, the highest R2 were selected to relate the models (regression equations) of the VIs and extract the most reliable equations to correlate the estimated AGC values with the predictions from Landsat 8 OLI images for each land-use type (Tables 6, 7, 8). Based on the statistical evaluation, all VIs showed very close results with good R2, but the highest values with the least relative deviation of determination coefficient was to the NDVI followed by SAVI. This outcome concurred with the findings in the literature where the exponential model was the most reliable in the case of NDVI-AGC (Bright et al., 2012; Ko et al., 2017; Myeong et al., 2006; Yao et al., 2015). With the regression modeling, the best-fitting model was the exponential model of AGC-NDVI for PP and AP with R2 (0.64, 0.87) and a p-value of less than 0.05% (0.005% for PP, and 0.001% respectively). Aspire Park exhibited higher NDVI results with the AGC values due to its tree types with one DBH reaching 120 cm. The high urban greenery biomass of Aspire Park may, therefore, affect the evaluation of VIs due to decreased soil and rock NIR reflections. Aspire Park has been similarly linked to large trees with significant diameter at breast height values and wide tree branches such as Ficus religiosa and Ficus benghalensis. The NDVI values showed slight differences, and when the curve was plotted, these small changes in NDVI value fitted with a significant increase in carbon values. In the case of the IP type, MIA and Oxygen Parks (OP) were chosen as models for institutional properties receiving intensive care. However, there were significant variations between them in planting types, greenery distribution, canopy cover, and biomass density. Oxygen Park has a lower biomass density and less turf grass compared to MIA Park. The trees in OP varied significantly in type, size (trees were mainly native and local and, thus, had small canopies, leaves, and DBH), and there was less vegetation surrounding the trees, with minimum turf grass and shrubs. These factors resulted in much lower AGC values in OP compared to MIA. Accordingly, the best-fitted model for NDVI was in the quadratic form rather than the exponential with R2 = 0.69 and p-value = 0.01%. In case of the avenue and streets plantings (AP), the NDVI model fitted in the exponential form with the relatively highest coefficient with an R2 = 0.87 and a p-value of 0.001%. The results in the high values of determination coefficient occurred because of the consistency in the relation between the AGC and NDVI values. This uniform behavior was due to the similarity in tree types, distribution, and canopy cover (together with the fact that Tarfa Street contained only one tree type, whereas Alkhafji Street contained four to five tree types with close DBH values). Since EVI is more accurate in denser canopy cover and compacted plantation (Huete et al., 1999; Pandapotan Situmorang and Sugianto, 2016), the regression analysis between EVI and AGC stock values showed lower determination coefficients than those of NDVI (R2 = 0.38, 0.78, and 0.52 for PP, IP, and AP respectively). Coefficients of determination of DVI values for the land-use types were PP = 0.56, IP = 0.19, and AP = 0.82. In comparison, R2 was not very reliable in representing the relation between AGC-DVI with IP. The DVI reflects the difference between the spectral bands only and the inconsistency of the high values increases the standard deviations, allowing considerable gaps between the points. The R2 values of all VIs were high for AP (Table 8) because of the consistency of AGC-VIs values, which helped to provide smooth curves with relatively low deviations. The RVI and SAVI presented relatively reasonable R2 values. Nevertheless, SAVI was more suitable for considering the soil and it might be affected by the hard landscapes around the green spaces. Overall, NDVI showed a relatively optimal correlation with the field measurements and AGC estimations. The AGC-NDVI model could represent consistent results with high R2 values, which match the findings of previous investigations and studies, including those using different satellite imagery (Bright et al., 2012; Yao et al., 2015; Lavista et al., 2016; Amoatey et al., 2018). Thus, this model was chosen as the most fitting vegetation index to interpret the correlation study for predicting AGC stock in urban green space. Figure 6 shows the NDVI maps of the selected land-use types, based on the images gained from Landsat 8 OLI on May 23, 2020 for A) Albidaa Park, B) Aspire Park, C) MIA Park, D) Oxygen Park, E) Alkhafji Street, and D) Tarfa Street.

TABLE 6. The regression model applied to estimate carbon stock in public parks (PP).

TABLE 7. The regression model applied to estimate carbon stock in institutional parks (IP).

TABLE 8. The regression model applied to estimate carbon stock in avenue and street plantings (AP).
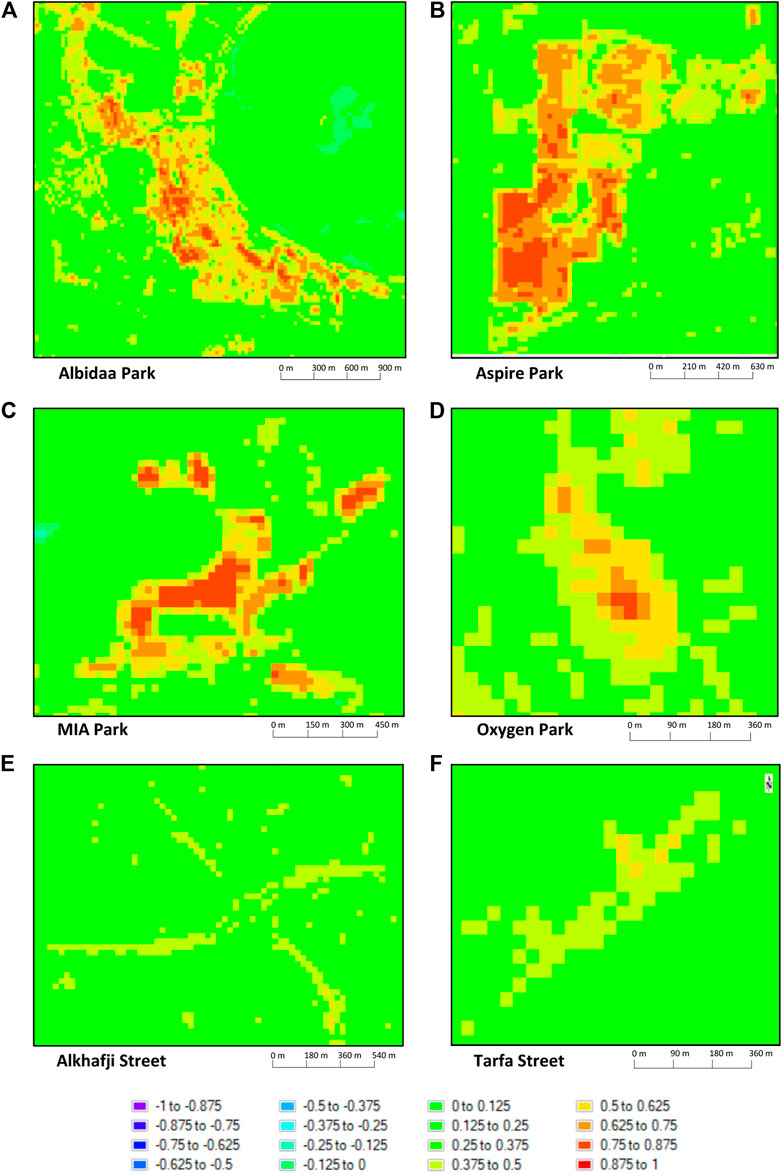
FIGURE 6. NDVI map of the selected land-use types based on the images acquired from Landsat 8 OLI on May 23, 2020.
To validate the regression models applied, some estimated AGC stock data from the field measurements were correlated with the predicted AGC values from the NDVI maps, using the extracted equations for each land-use type (Figure 7). The correlation analysis of PP, IP, and AP showed high Pearson correlation and determination coefficient (R2) values. Pearson correlation coefficients of PP, IP, and AP were 0.92, 0.89, and 0.92, and their coefficients of determination were 0.83, 0.78, and 0.84 respectively (Figures 8,9). These findings can provide reliable information on the total biomass of these areas with reference to the NDVI map and regression equations. These high values indicate the considerable reliability of the generated equations and, thus, can provide a clear evaluation of AGB and AGC stock for any vegetation area in Doha with similar variables to the measured landscapes with an accuracy level of 80–90%.
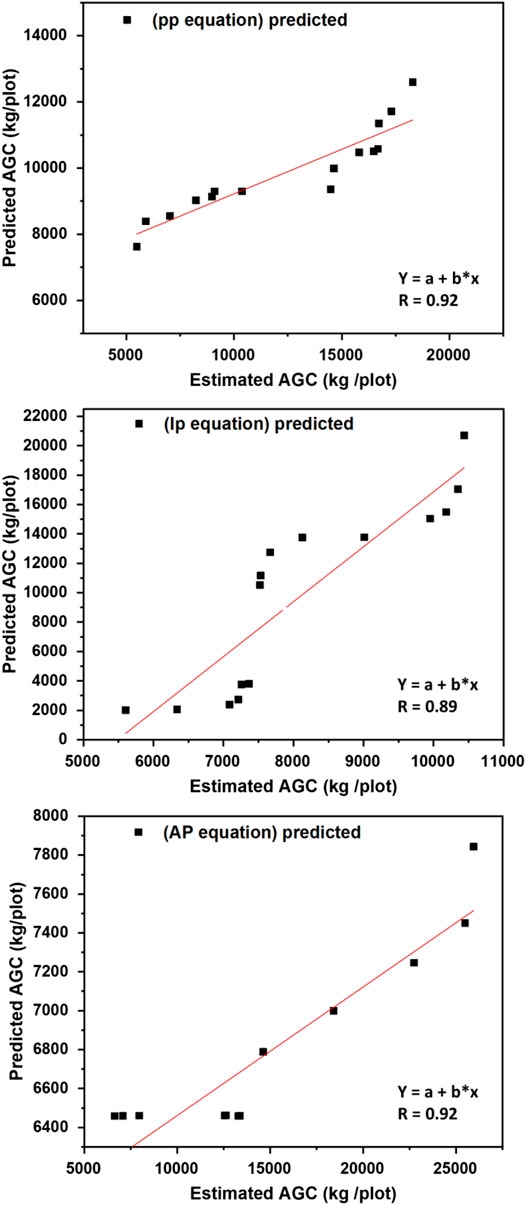
FIGURE 7. Pearson correlation analysis of the estimated AGC from the field and the predicted values related to NDVI and extracted regression equation.
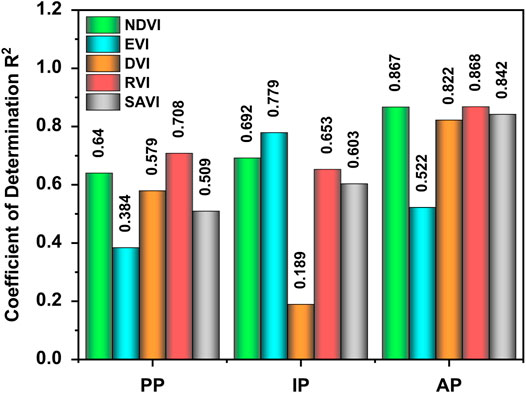
FIGURE 8. Comparison of regression coefficients of vegetative indices in urban greenery types.
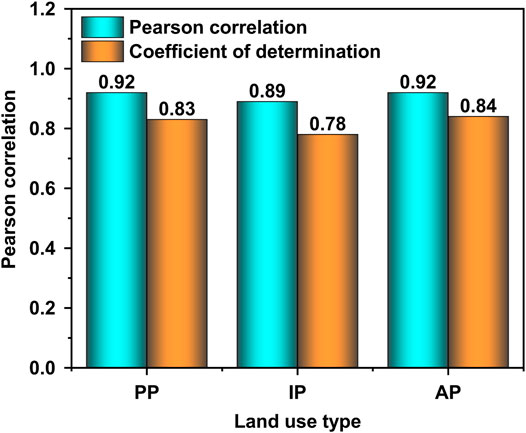
FIGURE 9. The Pearson correlation values and coefficients of determination for each land-use type. The comparison Illustrates the R2 of the regression model with the R2 of the correlation of the predicted data.
Timeline Comparison of Carbon Stock Between 2014 and 2020
Maps for the NDVI in Doha in 2014 and 2020 are shown in Figure 10. The color legend shows the improvement in vegetation through this period as the value of NDVI increased significantly in various areas around Doha city. Changes and variation between NDVI values in the surveyed plots were thoroughly investigated (Figures 11,12 and Table 9). The 603 trees inspected in this study were from only 52 plots among all the parks of which 215, 261, and 127 trees belonged to PP, IP, and AP respectively. The areas covered from these parks combined were only 1.2% of their total area. For the year in which this study was conducted (2020), the total AGC stock for these trees in the selected plots was 533.33 tons. For 2014, the total carbon stock for these plots was calculated from the NDVI equations and was 356.1 tons. These figures indicate a significant growth of the trees’ biomass with a mean overall growth rate of 46%, proving substantial absorption of atmospheric CO2. Total calculated CO2 absorbed from the atmosphere is 650.6 tons with a CO2 sequestration rate of 108.4 tons/year. These improvements in NDVI values and AGC were associated with the increase of vegetation around the selected areas. For instance, in 2014, Oxygen Park had not been established and its trees had not been planted. The establishment of Oxygen Park affected the value of AGC. Albidaa Park was under construction, and, therefore, new areas were established and replanted and greeneries were increased. In the streets, Tarfa Street has young trees that were planted less than 10 years ago so the carbon-stock change was more significant. Young trees build more biomass with faster processes due to their growth rate. In the cases of Aspire Park, Alkhafji Street, and MIA Park, the values showed slight increases compared with the other study subjects, but the carbon stock increased based on the growth of biomass. The social importance of removing CO2 from the atmosphere is demonstrated by the fact that the social value of the evaluated CO2 removed from the atmosphere for only the surveyed plots (52 plots) cost around USD 42,286 (which is approximately equivalent to 155,192 QR). This finding is based on a study showing that 1 kg of CO2 can be considered equal to USD 56 (QR 205) (Newbold et al., 2013). Nevertheless, this evaluation may not be precise due to the current increases in CO2 emissions and the concomitant increasing social cost. The benefits of reducing atmospheric CO2 through vegetation are increasingly important.
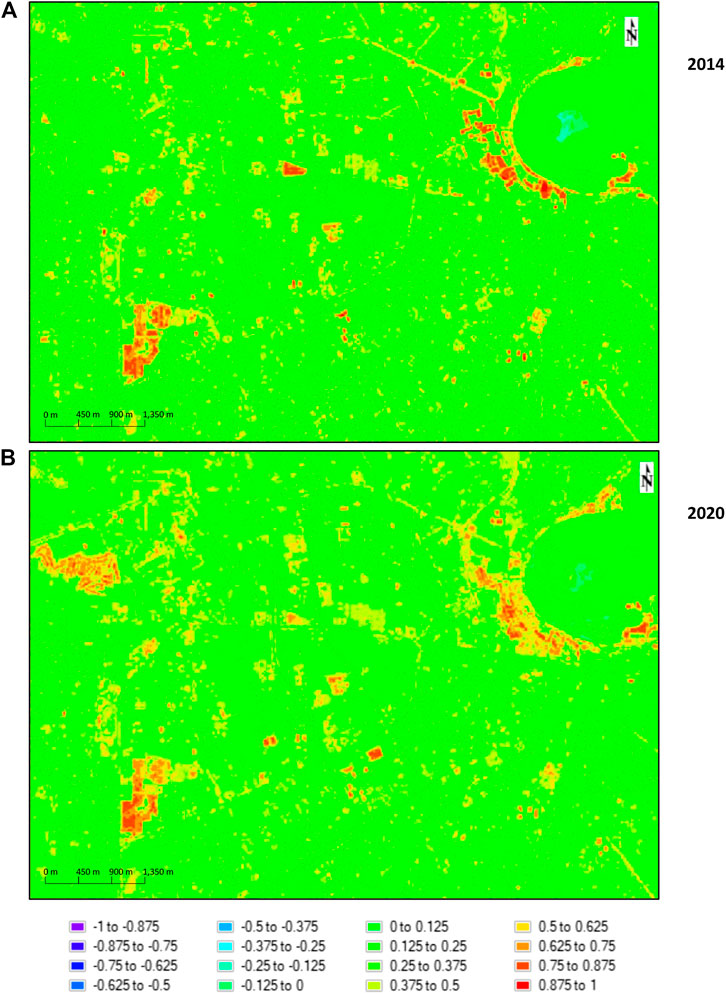
FIGURE 10. Normalized difference vegetation index (NDVI) maps for Doha city in 2014 and 2020.
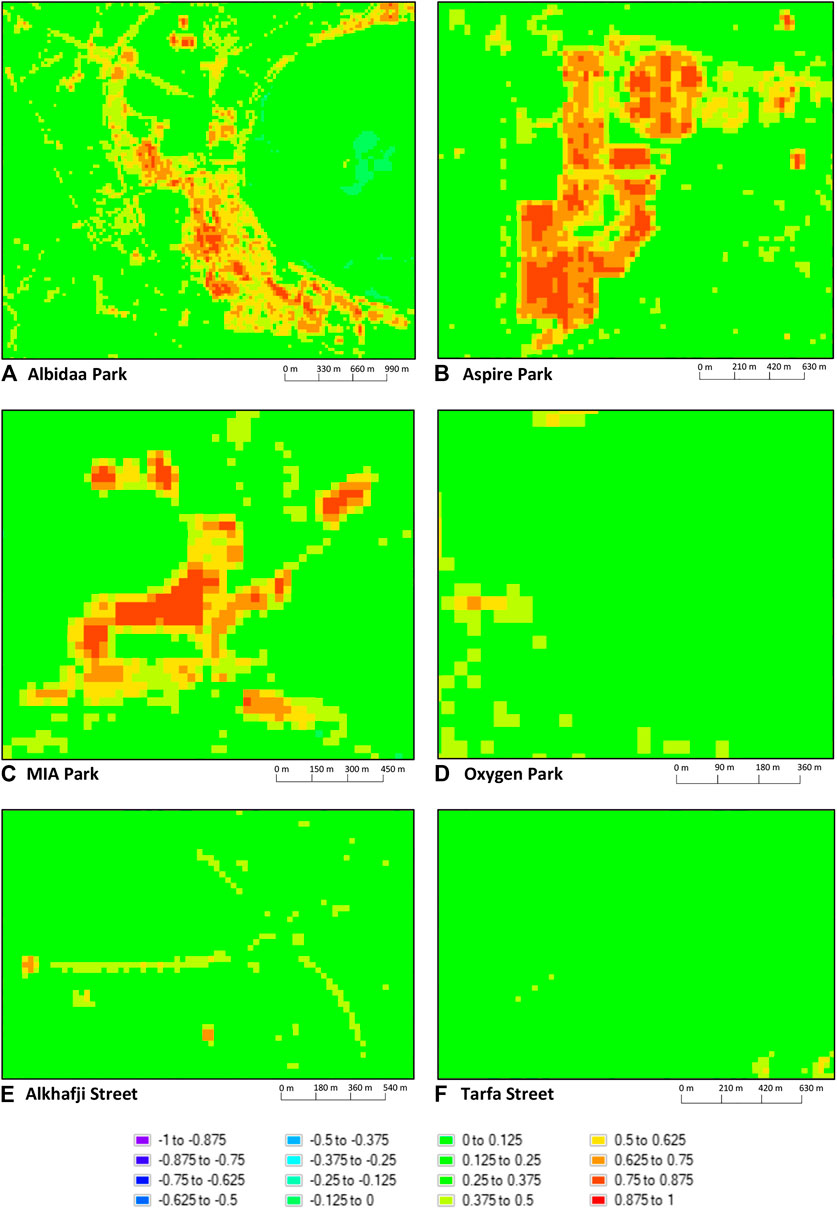
FIGURE 11. Normalized difference vegetation index (NDVI) maps of the selected land-use types based on the images acquired from Landsat 8 OLI on May 23, 2014.
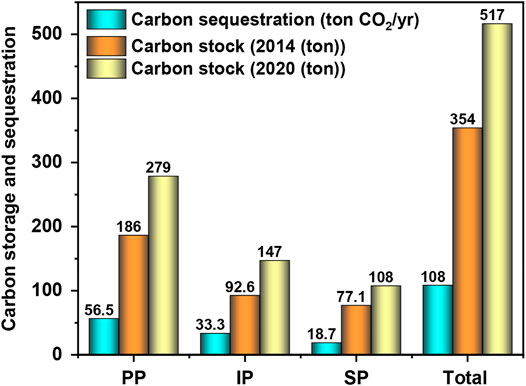
FIGURE 12. Carbon-stock and CO2 sequestration values of the selected urban green spaces in Doha between 2014 and 2020.
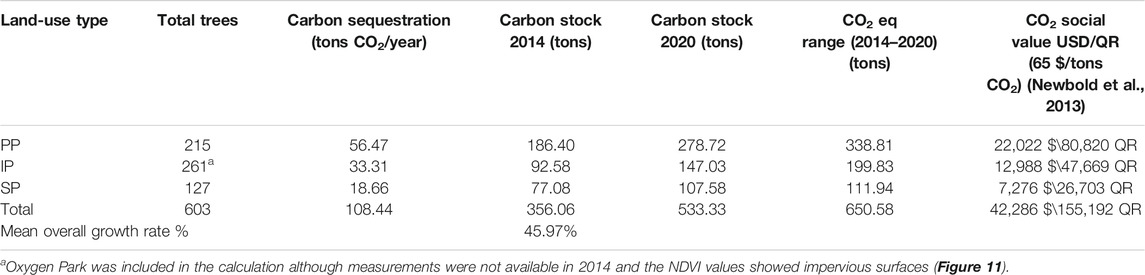
TABLE 9. A comparison of total carbon stock in the selected areas measured from vegetative indices and above-ground carbon between the years 2014 and 2020.
Impact of Qatar World Cup 2022 on Biomass and Carbon Stocks
Growing trees is one of the significant factors associated with the carbon neutrality missions and visions for the International Federation of Football Association (FIFA) 2022. According to FIFA, a key environmental requirement for the Mondial (World Cup) is the carbon neutral plans and projects accomplished by the local organizing committee (LOC). The LOC of the FIFA World Cup 2022 in Qatar is the Supreme Committee for Delivery and Legacy. This committee has highlighted the importance of natural carbon dioxide sequestration projects and emphasized the application of the best technologies to ensure a significant abatement of CO2 levels in Qatar and the accumulated atmospheric CO2 worldwide. Therefore, the committee has planned to plant approximately 16,000 trees of 60 types, 279,000 shrubs, and the equivalent of 1.2 million m2/year of turf grass around the stadiums hosting the event (FIFA, 2016; Sachin Kumar, 2018). The committee began the tree planting project in 2016 (8 years ahead of the FIFA 2022 event and four years from the time that this study was conducted) (Table 10). The land surface temperature (LST) was considerably decreased after the building of the stadium infrastructures because of the associated greenery around the stadiums. All the new stadiums are surrounded by massive areas of greenery and plantation with wisely selected trees and shrubs. This greenery contributes to lowering the overall temperature of the surroundings. Figure 13 (Al Bayt Stadium) presents an example of how the newly established stadiums are showing a reduction in LST due to their associated greenery. Furthermore, from the calculated LST for May 23, 2014 and May 23, 2020, it is evident that the vegetation has reduced the surface temperature and provided a positive impact on the environment (CO2 sequestration - Table 10).

TABLE 10. Rough estimations of the AGB, AGC, and CO2 sequestration values of the trees nursed and planted for the FIFA World Cup Qatar 2022.
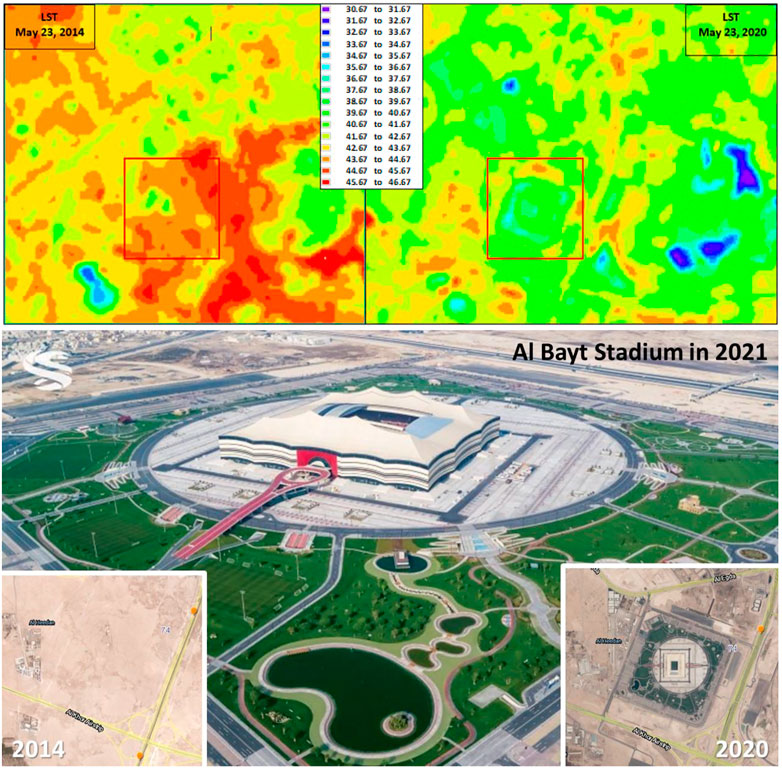
FIGURE 13. Calculated land surface temperature for May 23, 2014 and May 23, 2020 (using Landsat 8 images) for Al Bayt Stadium. The visual image of the stadium shows the substantial greenery surrounding the stadium.
The rough estimation of AGB, AGC, and CO2 sequestration values of the trees nursed and planted (16,000 trees) for the Qatar 2022 stadiums are shown in Table 10. Based on the assumptions outlined above, the predicted carbon stock accruing from the planted trees calculated for 2020 is close to 951.4 kg/tree, which could result in a reduction of up to 12,593 tons/year of atmospheric CO2 solely from this project. In 2022, the total CO2 sequestered from the atmosphere can be predicted to reach 75,558 tons CO2. From the estimated values, it can be assumed that the planted trees are likely to have a significant impact on CO2 abatement, which is likely to increase the environmental sustainability visions for Qatar and the FIFA World Cup 2022. The urban greenery irrigation is using recycled water, further reducing CO2 emission by avoiding the use of desalinated water (12.7 kgCO2eq/m3 DW, 0.67 kgCO2 eq/m3 RW) (Birge et al., 2019; Habib and Al-Ghamdi, 2020; Mannan and Al-Ghamdi, 2020).
Conclusion
While the primary purpose of vegetation and greenery in arid areas and cities is to provide shade and visual appeal, their importance also comes from their ability to reduce climate change and environmental impacts through sequencing and preserving anthropogenic CO2. The current study estimates the AGC inventory in Doha parks and urban green spaces in 2014 and 2020. Direct and indirect measurements through field surveys and remote sensing data from Landsat 8 OLI are used to evaluate and quantify the major contribution of urban green spaces in reducing CO2 emissions and increasing the city’s sustainability. Findings reveal that NDVI was the most accurate index to estimate the AGC inventory in three selected land-use types. The strongest correlation of AGC-NDVI were for AP with an R2 = 0.87 followed by satisfying results for PP with an R2 = 0.64. One of the impacting factors that enhanced the correlation is the presence of turf grass and surrounding shrubs in the background. Carbon-stock values showed substantial enhancement from 356 tons in 2014 to 533 tons in 2020 at 108.4 tons CO2/year sequestered from the atmosphere. This development justifies the intensive attention and care given to increasing the green spaces and landscapes around Doha city and its surroundings. According to the estimates carried out by the U.S. Environment Protective Agency (EPA), the social cost of the CO2 absorbed by the trees in the period from 2014 to 2020 was approximately QR 155,192 (USD 42,286). This cost can be considered as an important contribution toward CO2 reduction. The presence of these lands is of high social value to the people as these places contribute to public health and wellbeing and social activities. Furthermore, the cultivation and maintenance of these places create jobs for local people. This research is Qatar’s first study on this topic and offers benchmark evidence for a large-scale national carbon-stock tracking program in Qatar as a country and arid area.
Data Availability Statement
The original contributions presented in the study are included in the article/Supplementary Material, further inquiries can be directed to the corresponding author.
Author Contributions
SH: Conceptualization, methodology, software, formal analysis, data curation, validation, writing—original draft. SA-G: Conceptualization, methodology, validation, writing—review and editing, resources, supervision, project administration, funding acquisition.
Conflict of Interest
The authors declare that the research was conducted in the absence of any commercial or financial relationships that could be construed as a potential conflict of interest.
Acknowledgments
This research was supported by a scholarship from Hamad Bin Khalifa University (HBKU) a member of Qatar Foundation (QF). Any opinions, findings, and conclusions or recommendations expressed in this material are those of the author(s) and do not necessarily reflect the views of HBKU or QF. Open Access funding provided by the Qatar National Library.
Supplementary Material
The Supplementary Material for this article can be found online at: https://www.frontiersin.org/articles/10.3389/fenvs.2021.635365/full#supplementary-material
References
Ahmad, F. (2012). Detection of Change in Vegetation Cover Using Multi-Spectral and Multi-Temporal Information for District Sargodha, Pakistan. Soc. Nat. 24, 557–571. doi:10.1590/s1982-45132012000300014
Amoatey, P., Sulaiman, H., Kwarteng, A., and Al-Reasi, H. A. (2018). Above-ground Carbon Dynamics in Different Arid Urban green Spaces. Environ. Earth Sci. 77, 0. doi:10.1007/s12665-018-7613-1
Amoatey, P., and Sulaiman, H. (2019). Quantifying Carbon Storage Potential of Urban Plantations and Landscapes in Muscat, Oman. Environ. Dev. Sustain. 22, 7969–7984. doi:10.1007/s10668-019-00556-5
Amoatey, P., and Sulaiman, H. (2020). Assessing the Climate Change Impacts of cocoa Growing Districts in Ghana: the Livelihood Vulnerability index Analysis. Environ. Dev. Sustain. 22, 2247–2268. doi:10.1007/s10668-018-0287-8
Assefa, G., Mengistu, T., Getu, Z., and Zewdie, S. (2013). Training Manual on: Forest Carbon Pools and Carbon Stock Assessment in the Context of SFM and REDD+ 74. WondoGenet, Ethiopia: Hawassa University.
Barati, S., Rayegani, B., Saati, M., Sharifi, A., and Nasri, M. (2011). Comparison the Accuracies of Different Spectral Indices for Estimation of Vegetation Cover Fraction in Sparse Vegetated Areas. Egypt. J. Remote Sensing Space Sci. 14, 49–56. doi:10.1016/j.ejrs.2011.06.001
Bausch, W. C. (1993). Soil Background Effects on Reflectance-Based Crop Coefficients for Corn. Remote Sensing Environ. 46, 213-222. doi:10.1016/0034-4257(93)90096-G
Bayat, A. T., van Gils, H., and Weir, M. (2012). Carbon Stock of European Beech Forest; A Case at M. Pizzalto, Italy. APCBEE Proced. 1, 159–168. doi:10.1016/j.apcbee.2012.03.026
Birge, D., Mandhan, S., Qiu, W., and Berger, A. M. (2019). Potential for Sustainable Use of Trees in Hot Arid Regions: A Case Study of Emirati Neighborhoods in Abu Dhabi. Landscape Urban Plann. 190, 103577. doi:10.1016/j.landurbplan.2019.05.008
Bottalico, F., Pesola, L., Vizzarri, M., Antonello, L., Barbati, A., Chirici, G., et al. (2016). Modeling the Influence of Alternative forest Management Scenarios on wood Production and Carbon Storage: A Case Study in the Mediterranean Region. Environ. Res. 144, 72–87. doi:10.1016/j.envres.2015.10.025
Bright, B. C., Hicke, J. A., and Hudak, A. T. (2012). Estimating Aboveground Carbon Stocks of a forest Affected by Mountain pine Beetle in Idaho Using Lidar and Multispectral Imagery. Remote Sensing Environ. 124, 270–281. doi:10.1016/j.rse.2012.05.016
Brown, S. (1997). Estimating Biomass and Biomass Change of Tropical Forests: a Primer. Rome, Italy: FAO-Food and Agriculture Organization of the United Nations.
Chave, J., Andalo, C., Brown, S., Cairns, M. A., Chambers, J. Q., Eamus, D., et al. (2005). Tree Allometry and Improved Estimation of Carbon Stocks and Balance in Tropical Forests. Oecologia. 145, 87–99. doi:10.1007/s00442-005-0100-x
Clark, A., Saucier, J. R., and McNab, W. H. (1986). Total-tree Weight, Stem Eight, and Volume Tables for Hardwood Species in the Southeast. Asheville, NC: U.S. Department of Agriculture, Forest Service, Southeastern Forest Experiment Station.
De Gier, A. (2003). “A New Approach to Woody Biomass Assessment in Woodlands and Shrublands” in Geoinformatics for Tropical Ecosystems. Editor P. S. Roy, 161–198.
DeFries, R. S., Hansen, M. C., Townshend, J. R. G., Janetos, A. C., and Loveland, T. R. (2000). A New Global 1-km Dataset of Percentage Tree Cover Derived from Remote Sensing. Glob. Chang. Biol. 6, 247–254. doi:10.1046/j.1365-2486.2000.00296.x
Dungan, J. (1998). Spatial Prediction of Vegetation Quantities Using Ground and Image Data. Int. J. Remote Sensing 19, 267–285. doi:10.1080/014311698216242
Durante, P., Martín-Alcón, S., Gil-Tena, A., Algeet, N., Tomé, J., Recuero, L., et al. (2019). Improving Aboveground forest Biomass Maps: From High-Resolution to National Scale. Remote Sensing. 11, 795. doi:10.3390/rs11070795
FIFA (2016). Growing 16,000 Trees for 2022, Using Recycled Water. Available at: https://www.fifa.com/worldcup/news/growing-16-000-trees-for-2022-using-recycled-water-2847448.
Franklin, J., and Hiernaux, P. H. Y. (1991). Estimating Foliage and Woody Biomass in Sahelian and Sudanian Woodlands Using a Remote Sensing Model. Int. J. Remote Sensing. 12, 1387–1404. doi:10.1080/01431169108929732
Global Forest Resources Assessment 2020 (2020). Glob. For. Resour. Assess. 2020. doi:10.4060/ca8753en
Gonzalez, P., Asner, G. P., Battles, J. J., Lefsky, M. A., Waring, K. M., and Palace, M. (2010). Forest Carbon Densities and Uncertainties from Lidar, QuickBird, and Field Measurements in California. Remote Sensing Environ. 114, 1561–1575. doi:10.1016/j.rse.2010.02.011
Goodman, R. C., Phillips, O. L., Del Castillo Torres, D., Freitas, L., Cortese, S. T., Monteagudo, A., et al. (2013). Amazon palm Biomass and Allometry. For. Ecol. Management. 310, 994–1004. doi:10.1016/j.foreco.2013.09.045
Habib, S., and Al-Ghamdi, S. G. (2020). “Estimation of Atmospheric Carbon Mitigation through Urban Landscaping in Arid Areas Using Native Species,” in World Environmental and Water Resources Congress 2020, 280–289.
Huete, A., Chris, J., and Leeuwen, W. van. (1999). Modis Vegetation Index Algorithm Theoretical Basis. Available at: https://modis.gsfc.nasa.gov/data/atbd/atbd_mod13.pdf.
Issa, S., Dahy, B., Ksiksi, T., and Saleous, N. (2020). A Review of Terrestrial Carbon Assessment Methods Using Geo-Spatial Technologies with Emphasis on Arid Lands. Remote Sensing. 12, 2008. doi:10.3390/rs12122008
Issa, S., Dahy, B., Saleous, N., and Ksiksi, T. (2019). Carbon Stock Assessment of Date palm Using Remote Sensing Coupled with Field-Based Measurements in Abu Dhabi (United Arab Emirates). Int. J. Remote Sensing. 40, 7561–7580. doi:10.1080/01431161.2019.1602795
Iwata, N. (2006). World Trade Organization and the Recycling Trade: Trade Measures for Global Environmental Preservation. Jpn. Economy. 33, 45–64. doi:10.2753/jes1097-203x330403
Jensen, A., and Meilby, H. (2012). Assessing the Population Status of a Tree Species Using Distance Sampling:Aquilaria crassna(Thymelaeaceae) in Northern Laos. Int. J. For. Res. 2012, 1–11. doi:10.1155/2012/265831
Jianya, G., Haigang, S., Guorui, M., and Qiming, Z. (2008). “A Review of Multi-Temporal Remote Sensing Data Change Detection Algorithms,” in International Archives of the Photogrammetry (Beijing, China: Remote Sensing and Spatial Information Sciences - ISPRS Archives) 37, 757–762.
Ko, D. W., Kim, D., Narantsetseg, A., and Kang, S. (2017). Comparison of Field- and Satellite-Based Vegetation Cover Estimation Methods. J Ecology Environ. 41, 1–11. doi:10.1186/s41610-016-0022-z
Kumar, L., Sinha, P., Taylor, S., and Alqurashi, A. F. (2015). Review of the Use of Remote Sensing for Biomass Estimation to Support Renewable Energy Generation. J. Appl. Remote Sens. 9, 097696. doi:10.1117/1.jrs.9.097696
Kumar, S. (2018). Supreme Committee Opens Tree Nursery to Grow Turf & Greenery for 2022 FIFA World Cup Stadiums - the Peninsula Qatar. Qatar: Penins
Larondelle, N., and Haase, D. (2013). Urban Ecosystem Services Assessment along a Rural-Urban Gradient: A Cross-Analysis of European Cities. Ecol. Indicators. 29, 179–190. doi:10.1016/j.ecolind.2012.12.022
Lavista, L., Prasetyo, L. B., and Hermawan, R. (2016). Dynamics Change of the above Carbon Stocks in Bogor Agricultural University, Darmaga Campus. Proced. Environ. Sci. 33, 305–316. doi:10.1016/j.proenv.2016.03.081
Liu, C., and Li, X. (2012). Carbon Storage and Sequestration by Urban Forests in Shenyang, China. Urban For. Urban Green. 11, 121–128. doi:10.1016/j.ufug.2011.03.002
Mannan, M., and Al-Ghamdi, S. G. (2020). Environmental Impact of Water-Use in Buildings: Latest Developments from a Life-Cycle Assessment Perspective. J. Environ. Manage. 261, 110198. doi:10.1016/j.jenvman.2020.110198
McPherson, E. G. (1998). Atmospheric Carbon Dioxide Reduction by Sacramento’s Urban forest. J. Arboric. 24 (4), 215–223.
McPherson, E. G., and Muchnick, J. (2005). Effects of Shade on Pavement Performance. J. Arboric. 31 (6), 303–310.
Mcpherson, E. G., Nowak, D. J., and Rowntree, R. a. (1994). Chicago’s Urban Forest Ecosystem: Results of the Chicago Urban Forest Climate Project. Radnor, PA: U. S. Department of Agriculture, Forest Service, Northeastern Forest Experiment StationUrban Ecosyst.
McPherson, E. G., Simpson, J. R., Peper, P. J., and Xiao, Q. (1999). Benefit-cost Analysis of Modesto’s Municipal Urban forest. J. Arboric. 25 (5), 235–248.
McPherson, E. G., Simpson, J. R., Xiao, Q., and Wu, C. (2011). Million Trees Los Angeles Canopy Cover and Benefit Assessment. Landscape Urban Plann. 99 (1), 40–50. doi:10.1016/j.landurbplan.2010.08.011
Miller, R. L., and Fujii, R. (2011). Re-establishing Marshes Can Turn a Current Carbon Source into a Carbon Sink in the Sacramento-San Joaquin Delta of California, USA in River Deltas: Types, Structures and Ecology. Editors A. David (Hauppauge, NY: Nova Science Publishers).
Ministry of Development Planning and Statistics (2019). Monthly Figures on Total Population. [WWW Document]. June
Myeong, S., Nowak, D. J., and Duggin, M. J. (2006). A Temporal Analysis of Urban forest Carbon Storage Using Remote Sensing. Remote Sensing Environ. 101, 277–282. doi:10.1016/j.rse.2005.12.001
Natural Resources Conservation Service (2000). Grazing Lands Technology Institute. Arizona Supplement: National Range and Pasture Handbook
Neigh, C. (2008). Identifying and Understanding North American Carbon Cycle Perturbations from Natural and Anthropogenic Disturbances. University of Maryland
Newbold, S., Griffiths, C., Moore, C., Wolverton, A., and Kopits, E. (2013). A Rapid Assessment Model for Understanding the Social Cost of Carbon. Clim. Change Econ. 4 (1), 1–40. doi:10.1142/S2010007813500012
Nowak, D., Crane, D. E., Stevens, J. C., Hoehn, R. E., Walton, J. T., and Bond, J. (2008). A Ground-Based Method of Assessing Urban Forest Structure and Ecosystem Services. Arboric. Urban For. 34 (6), 347–358.
Nowak, D. J. (1993). Atmospheric Carbon Reduction by Urban Trees. J. Environ. Manage. 37, 207–217. doi:10.1006/jema.1993.1017
Nowak, D. J., and Crane, D. E. (2002). Carbon Storage and Sequestration by Urban Trees in the USA. Environ. Pollut. 116, 381–389. doi:10.1016/S0269-7491(01)00214-7
Nowak, D. J., Crane, D. E., Stevens, J. C., and Hoehn, R. E. (2003). The Urban forest Effects (UFORE) Model: Field Data Collection Manual. Syracuse, NY: USDA Forest Service, NortheasternResearch Station.
Nowak, D. J., Greenfield, E. J., Hoehn, R. E., and Lapoint, E. (2013). Carbon Storage and Sequestration by Trees in Urban and Community Areas of the United States. Environ. Pollut. 178, 229–236. doi:10.1016/j.envpol.2013.03.019
Nyamugama, A., and Kakembo, V. (2015). Estimation and Monitoring of Aboveground Carbon Stocks Using Spatial Technology. S. Afr. J. Sci. 111, 1–7. doi:10.17159/sajs.2015/20140170
Ometto, J. P., Aguiar, A. P., Assis, T., Soler, L., Valle, P., Tejada, G., et al. (2014). Amazon forest Biomass Density Maps: Tackling the Uncertainty in Carbon Emission Estimates. Climatic Change. 124, 545–560. doi:10.1007/s10584-014-1058-7
Pandapotan Situmorang, J., Sugianto, S., and ., D. (2016). Estimation of Carbon Stock Stands Using EVI and NDVI Vegetation Index in Production Forest of Lembah Seulawah Sub-district, Aceh Indonesia. Aceh Int. J. Sci. Technol. 5 (3), 126–139. doi:10.13170/aijst.5.3.5836
Parece, T. E., and Campbell, J. B. (2017). Assessing Urban Community Gardens' Impact on Net Primary Production Using NDVI. Urban Agric. Region. Food Syst. 2, 1–17. doi:10.2134/urbanag2016.07.0004
Payero, J. O., Neale, C. M. U., and Wright, J. L. (2004). Comparison of Eleven Vegetation Indices for Estimating Plant Height of Alfalfa and Grass. Appl. Eng. Agric. 20, 385-393. doi:10.13031/2013.16057
Peper, P. J., McPherson, E. G., and Mori, S. M. (2001). Equations for Predicting Diameter, Height, crown Width, and Leaf Area of San Joaquin valley Street Trees. J. Arboric. 27, 306–317.
Qi, J., Chehbouni, A., Huete, A. R., Kerr, Y. H., and Sorooshian, S. (1994). A Modified Soil Adjusted Vegetation index. Remote Sensing Environ. 48, 119–126. doi:10.1016/0034-4257(94)90134-1
Ramsey, F. L. (1979). Parametric Models for Line Transect Surveys. Biometrika. 66, 505-512. doi:10.1093/biomet/66.3.505
Roy, P. S., and Ravan, S. A. (1996). Biomass Estimation Using Satellite Remote Sensing Data-An Investigation on Possible Approaches for Natural forest. J. Biosci. 21, 535–561. doi:10.1007/BF02703218
Saatchi, S. S., Houghton, R. A., Dos Santos Alvalá, R. C., Soares, J. V., and Yu, Y. (2007). Distribution of Aboveground Live Biomass in the Amazon basin. Glob. Chang. Biol. 13, 816–837. doi:10.1111/j.1365-2486.2007.01323.x
Stoffberg, G. H., van Rooyen, M. W., van der Linde, M. J., and Groeneveld, H. T. (2010). Carbon Sequestration Estimates of Indigenous Street Trees in the City of Tshwane, South Africa. Urban For. Urban Green. 9, 9–14. doi:10.1016/j.ufug.2009.09.004
Strohbach, M. W., and Haase, D. (2012). Above-ground Carbon Storage by Urban Trees in Leipzig, Germany: Analysis of Patterns in a European City. Landscape Urban Plann. 104, 95–104. doi:10.1016/j.landurbplan.2011.10.001
Thevathasan, N. V., and Gordon, A. M. (2004). Ecology of Tree Intercropping Systems in the North Temperate Region: Experiences from Southern Ontario, Canada. Agroforestry Syst. 61-62, 257–268. doi:10.1023/B:AGFO.0000029003.00933.6d
Thomas, A. L., Kallenbach, R., Sauer, T. J., Brauer, D. K., Burner, D. M., Coggeshall, M. V., et al. (2020). Carbon and Nitrogen Accumulation within Four Black walnut Alley Cropping Sites across Missouri and Arkansas, USA. Agroforest Syst. 94, 1625–1638. doi:10.1007/s10457-019-00471-8
Tuanmu, M.-N., and Jetz, W. (2014). A Global 1-km Consensus Land-Cover Product for Biodiversity and Ecosystem Modelling. Glob. Ecol. Biogeogr. 23, 1031–1045. doi:10.1111/geb.12182
UNFCCC (2015). Report of the Conference of the Parties on its Twenty-First Session, Held in Paris from 30 November to 13 December 2015. Addendum-Part Two Action Tak. Conf. Parties. 01194, 1–36. Available at: http://unfccc.int/resource/docs/2015/cop21/eng/10a01.pdf. [WWW Document].
USGS (2019). EarthExplorer-Home. U.S. Geol. Surv. Available at https://earthexplorer.usgs.gov/.
Vashum, K. T. (2012). Methods to Estimate Above-Ground Biomass and Carbon Stock in Natural Forests - A Review. J. Ecosyst. Ecography 02, 1–7. doi:10.4172/2157-7625.1000116
Wotherspoon, A., Thevathasan, N. V., Gordon, A. M., and Voroney, R. P. (2014). Carbon Sequestration Potential of Five Tree Species in a 25-Year-Old Temperate Tree-Based Intercropping System in Southern Ontario, Canada. Agroforest Syst. 88, 631–643. doi:10.1007/s10457-014-9719-0
Xiao, Y., Li, Y., Ying, J., Tian, Y., Xiao, Y., and Mei, Z. (2015). Determination of Alditols by Capillary Electrophoresis with Indirect Laser-Induced Fluorescence Detection. Food Chem. 174, 233–239. doi:10.1016/j.foodchem.2014.11.046
Xu, C., Li, Y., Hu, J., Yang, X., Sheng, S., and Liu, M. (2012). Evaluating the Difference between the Normalized Difference Vegetation index and Net Primary Productivity as the Indicators of Vegetation Vigor Assessment at Landscape Scale. Environ. Monit. Assess. 184, 1275–1286. doi:10.1007/s10661-011-2039-1
Xu, Q., Dong, Y.-x., and Yang, R. (2018). Influence of Land Urbanization on Carbon Sequestration of Urban Vegetation: A Temporal Cooperativity Analysis in Guangzhou as an Example. Sci. Total Environ. 635, 26–34. doi:10.1016/j.scitotenv.2018.04.057
Xue, J., and Su, B. (2017). Significant Remote Sensing Vegetation Indices: A Review of Developments and Applications. J. Sensors. 2017, 1–17. doi:10.1155/2017/1353691
Yao, Z., Liu, J., Zhao, X., Long, D., and Wang, L. (2015). Spatial Dynamics of Aboveground Carbon Stock in Urban green Space: a Case Study of Xi'an, China. J. Arid Land. 7, 350–360. doi:10.1007/s40333-014-0082-9
Keywords: above-ground carbon, vegetative index, normalized difference vegetation index, remote sensing, carbon sequestration
Citation: Habib S and Al-Ghamdi SG (2021) Estimation of Above-Ground Carbon-Stocks for Urban Greeneries in Arid Areas: Case Study for Doha and FIFA World Cup Qatar 2022. Front. Environ. Sci. 9:635365. doi: 10.3389/fenvs.2021.635365
Received: 30 November 2020; Accepted: 17 May 2021;
Published: 15 June 2021.
Edited by:
Marco Casazza, University of Naples Parthenope, ItalyReviewed by:
Ahmed Kenawy, Mansoura University, EgyptWei Li, Massachusetts Institute of Technology, United States
Copyright © 2021 Habib and Al-Ghamdi. This is an open-access article distributed under the terms of the Creative Commons Attribution License (CC BY). The use, distribution or reproduction in other forums is permitted, provided the original author(s) and the copyright owner(s) are credited and that the original publication in this journal is cited, in accordance with accepted academic practice. No use, distribution or reproduction is permitted which does not comply with these terms.
*Correspondence: Sami G. Al-Ghamdi, c2FsZ2hhbWRpQGhia3UuZWR1LnFh