 Atsushi Hayakawa
 Hitoshi Ota
 Ryoki Asano2
 Hirotatsu Murano
 Tadashi Takahashi
- 1Department of Biological Environment, Faculty of Bioresource Sciences, Akita Prefectural University, Akita, Japan
- 2Department of Agro-Food Science, Faculty of Agro-Food Science, Niigata Agro-Food University, Tainai, Japan
- 3Department of Environmental Bioscience, Faculty of Agriculture, Meijo University, Nagoya, Japan
Sulfur-based denitrification may be a key biogeochemical nitrate (NO3−) removal process in sulfide-rich regions, but it is still poorly understood in natural terrestrial ecosystems. We examined sulfur-driven NO3− reduction using streambank soils in a headwater catchment underlain by marine sedimentary rock in Akita, Japan. In a catchment exhibiting higher sulfide content in streambed sediment, we sampled two adjacent streambank soils of streambank I (two layers) and of streambank II (eight layers). Anaerobic long-term incubation experiments (40 days, using soils of streambank I) and short-term incubation experiments (5 days, using soils of streambank II) were conducted to evaluate variations of N solutes (NO3−, NO2−, and NH4+), N gases (NO, N2O), and the bacterial flora. In both experiments, two treatment solutions containing NO3− (N treatment), and NO3− and S2O32− (N + S treatment) were prepared. In the N + S treatment of the long-term experiment, NO3− concentrations gradually decreased by 98%, with increases in the SO42−, NO2−, NO, and N2O concentrations and with not increase in the NH4+, indicating denitrification had occurred with a high probability. Temporal accumulation of NO2− was observed in the N + S treatment. The stoichiometric ratio of SO42− production and NO3− depletion rates indicated that denitrification using reduced sulfur occurred even without additional S, indicating inherent S also served as an electron donor for denitrification. In the short-term incubation experiment, S addition was significantly decreased NO3− concentrations and increased NO2−, NO, and N2O concentrations, especially in some subsoils with higher sulfide contents. Many denitrifying sulfur-oxidizing bacteria (Thiobacillus denitrificans and Sulfuricella denitrificans) were detected in both streambank I and II, which dominated up to 5% of the entire microbial population, suggesting that these bacteria are widespread in sulfide-rich soil layers in the catchment. We concluded that the catchment with abundant sulfides in the subsoil possessed the potential for sulfur-driven NO3− reduction, which could widely influence N cycling in and NO3− export from the headwater catchment.
Introduction
Human activities have dramatically increased the amount of reactive nitrogen (N) in global ecosystems and have increased food production; however, input of reactive N beyond appropriate uses can lead to eutrophication of surface water, causing degradation of aquatic ecosystems and problems such as toxic algal blooms, loss of dissolved oxygen, depletion of fish populations, and biodiversity loss (Vitousek, 1997; Galloway and Cowling, 2002). In forest ecosystems, losses of N mainly as nitrate (NO3−) via streams can be caused by increased levels of reactive N such as N deposition in the forest (Lovett and Goodale, 2011). Denitrification is a NO3− removal process and is generally performed by particular groups of ubiquitous heterotrophic bacteria that have the ability to use NO3− as an electron acceptor and organic carbon (C) as an electron donor during anaerobic respiration. Denitrification transforms NO3− to the final form (N2 gas) via four main steps: NO3− → NO2− → NO → N2O → N2 (Tiedje, 1994). Because denitrification ultimate removes reactive N as N2 gas from the ecosystem as one of soil functions of transforming nutrients (Adhikari and Hartemink, 2016; Lilburne et al., 2020), it is a highly valued ecosystem service in N-enriched catchments (Craig et al., 2010).
Some bacteria can use inorganic sources, such as reduced sulfur compounds and Fe2+, as the electron donor to grow chemoautotrophically (Korom, 1992; Straub et al., 1996). The oxidation of such inorganic species coupled with N oxide reduction is termed autotrophic denitrification. Autotrophic denitrification can proceed through the ability of some bacteria to couple the reduction of NO3− to the oxidation of reduced sulfur (Burgin and Hamilton, 2007). The most used electron donors of reduced sulfur compounds include elemental sulfur, sulfide and thiosulfate (De Capua et al., 2019). Some previous studies have detected NO3− removal coupled with sulfide oxidation in groundwater systems (Postma et al., 1991; Schwientek et al., 2008; Jørgensen et al., 2009; Craig et al., 2010; Vaclavkova et al., 2014), riverbed sediments (Hayakawa et al., 2013; Martínez-Santos et al., 2018; Yin et al., 2019), and sediment incubated with added sulfur (Brunet and Garcia-Gil, 1996; Garcia-Gil and Golterman, 1993; Jørgensen et al., 2009; Torrentó et al., 2010, 2011). NO3− reduction coupled with sulfide oxidation may be widespread and biogeochemically important in freshwater sediments (Burgin and Hamilton, 2008); however, the process has been reported less in freshwater than in marine and brackish marshes and tidal ecosystems (Hu et al., 2020) and the relative importance of the electron donor in the removal process remains uncertain at catchment scales.
Typical signs of sulfur-based denitrification using sulfide as an electron donor are decreasing NO3− accompanied by increasing SO42− and NO2− (Postma et al., 1991; Jørgensen et al., 2009; Torrentó et al., 2010; Chung et al., 2014) and the microbial stoichiometric reaction ratios of SO42− production and NO3− depletion rates (ΔSO42−/ΔNO3−) for sulfur-based denitrification (Hayakawa et al., 2013; Vaclavkova et al., 2014). Some bioreactor studies have reported that NO2− accumulation was observed during sulfur-based denitrification (Moon et al., 2004; Chung et al., 2014; Chen et al., 2018). Furthermore, a recent study has reported that accumulation of NO2− can also lead to build-up of NO and N2O during the sulfur-based denitrification process (Lan et al., 2019). Microbial community analysis can provide useful information about the key players and complementary evidence of sulfur-based denitrification (Torrentó et al., 2011; Hayakawa et al., 2013; Dolejs et al., 2015; Wang et al., 2021). Therefore, to obtain evidence of sulfur-based denitrification in natural soils and sediments in freshwater ecosystems, it may be important to detect the various signs (NO3− reduction accompanied by SO42− production, stoichiometric reactions inferred from the ΔSO42−/ΔNO3− ratio, accumulation of NO2− and gaseous forms of N, and elements of the microbial community) of sulfur-based denitrification.
The sulfur cycle is especially important in catchments that supply high concentrations of SO42− to stream water (Szynkiewicz et al., 2012) and may be closely related to the N cycle through reactions such as sulfur-based denitrification in the catchments (Burgin and Hamilton, 2008). Reservoirs of sulfur in freshwater catchments are dominated by dissolved sulfate in water and sulfate and sulfide minerals in sediments and soils (Wynn et al., 2010; Iribar and Abalos, 2011; Hayakawa et al., 2020). In catchments suppling high levels of SO42− to streams, it is expected to have much inherent sulfide. On one hand, the supplied SO42− can be reduced to sulfide by the activity of dissimilatory sulfate-reducing bacteria in anoxic condition (Plugge et al., 2011), and the sulfide can be re-distributed to soils and sediments in the catchments. Reduction-oxidation reactions occur during burial because the sediments contain such reactive mixtures of oxidized and reduced components (Roberts, 2015). Some previous studies reported sulfide-driven autotrophic denitrification had occurred in sulfide-rich riverbed sediments in those catchments (Hayakawa et al., 2013; Martínez-Santos et al., 2018; Yin et al., 2019; Li et al., 2021).
Our study area, the Lake Hachiro watershed, is located along the coast of the Japan Sea, and its main surface geology consists of marine sedimentary rocks. The region was submerged beneath the sea during the Neogene Period (Shiraishi and Matoba, 1992), and sulfide minerals (easily oxidizable sulfur; EOS) in streambed sediments occur throughout the watershed, including in the forested area of the upper mountains, and may supply SO42− to the streams from oxidation of sulfides (Hayakawa et al., 2020). High sulfide levels in streambed sediments can be reasonably expected to influence the N cycle through sulfur-based denitrification. Our previous study conducted in 35 headwater catchments in the Lake Hachiro watershed showed that in-stream NO3− concentrations tended to decrease with increasing EOS content in the streambed, indicating the probable occurrence of sulfur-based denitrification in the sulfide-rich catchment (Hayakawa et al., 2020). The composition of streambed sediment is affected by variations in the surface soil and geology of the catchment and has been used to identify sites with distinctive water quality (Horowitz and Elrick, 2017); thus, sulfide-rich soils are expected to be present somewhere in a catchment with a sulfide-rich streambed. In fact, soil with a high EOS content was found in a streambank where the EOS content in the streambed was high (Hayakawa et al., 2020). To clarify this point, we need to obtain detailed evidence of sulfide distribution and potential sulfur-based denitrification in the natural soils in the Lake Hachiro watershed.
We hypothesized that the catchment with higher sulfide content in its streambed possesses sulfide-rich soil layers and a higher potential of sulfur-based denitrification in those layers within the catchment. We focused on streambank soils because these soils constitute an interface between land and stream, and thus can influence the qualities of the streambed sediment and stream. Our main study objectives were: 1) to evaluate the vertical distribution of sulfide in streambank soils; 2) to evaluate NO3− reduction with production of SO42−, NO2−, NO, and N2O in sulfide-rich soils and to detect signs of sulfur-based denitrification by anaerobic incubation with and without S addition; and 3) to identify the most important sulfur-oxidizing bacteria that cause denitrification.
Materials and Methods
Site Description and Sediment Sampling
The Lake Hachiro watershed is located in western Akita Prefecture facing the Japan Sea (Figure 1). The entire watershed area is 894 km2. The geological strata of the watershed belong to the Green Tuff zone, consisting of volcanic rocks and sedimentary rocks of late Miocene age (Shiraishi, 1990). In the early part of the middle Miocene to the Pliocene (i.e., ca 13–2.5 Ma), the Akita region was drowned as a result of subsidence of the former land area (Shiraishi and Matoba, 1992). As a result, the sedimentary rocks in the watershed are mainly marine deposits and consist of thick mudstone layers (Shiraishi, 1990) with high levels of total sulfur (0.90%; Koma, 1992). Weather recordings for the region from the Gojome recording station (8 km away from the study catchment) for the period 1981-2010 (Japan Meteorological Agency, 2013) revealed that average precipitation was 1,553 mm year−1 and the annual mean temperature was 10.8°C. The lowest mean monthly temperature occured in January (−0.9°C), and the highest mean monthly temperature was in August (24°C). The average maximum snow depth during winter (December–February) is 48 cm. Japanese cedar (Cryptomeria japonica D. Don) plantations dominated the forested area, especially in the middle and northern parts of the watershed.
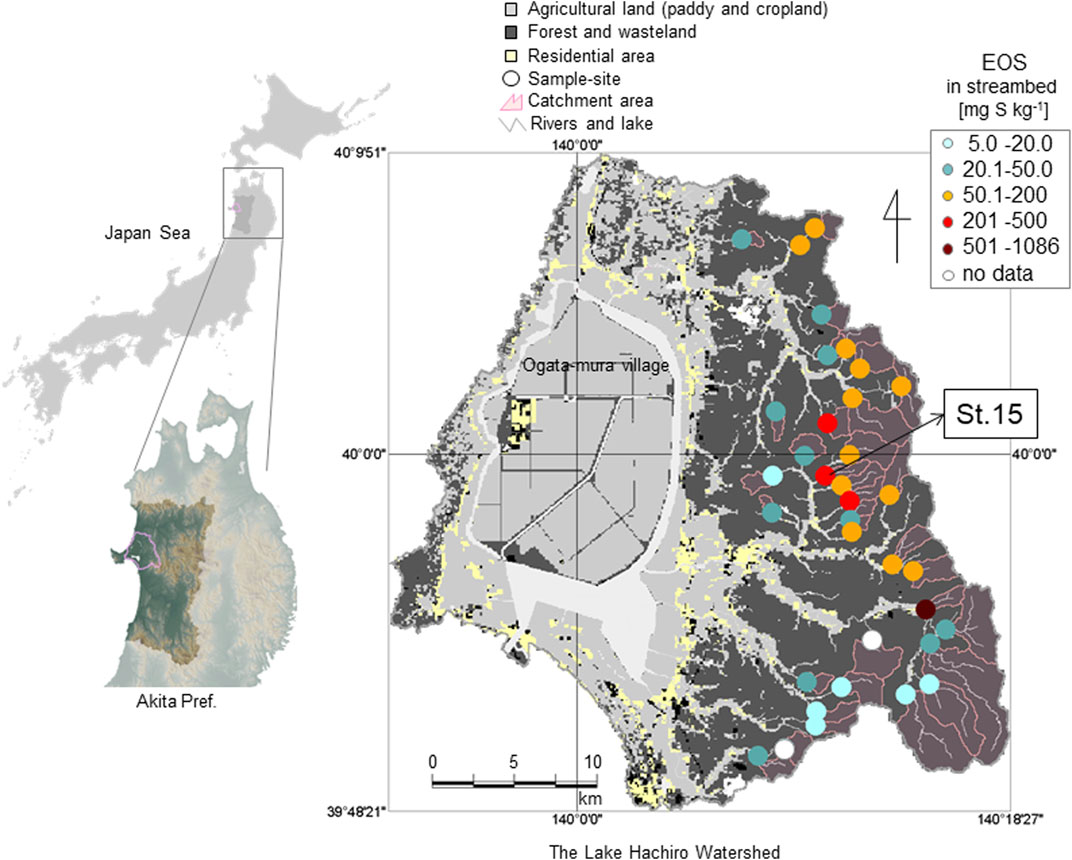
FIGURE 1. Map of the study site and the distribution of easily oxidizable sulfur (EOS) content in streambed sediments at each headwater catchment in the Lake Hachiro watershed (Hayakawa et al., 2020). St. 15 is the study catchment.
The study catchment was St. 15 in the Lake Hachiro watershed (1.61 km2, N39.9886, E140.1760), where the sulfide (EOS) content in streambed sediment is relatively high, as 0.254 g S kg−1 (Hayakawa et al., 2020; Figure 1). In a recent study, the stream-water chemistry in the catchment exhibited the highest SO42− (18.3 mg S L−1) but relatively lower NO3− (0.149 mg N L−1) concentrations among the 35 headwater catchments in the Lake Hachiro watershed (Hayakawa et al., 2020). Bulk N deposition to the catchment was 7.5 kg N ha−1 year−1 (Hayakawa et al., 2020), higher than the threshold value of 5 kg N ha−1 yr−1 that caused N leaching to streams in China (Fang et al., 2011).
Soil sampling was conducted at two streambanks, I and II, in St. 15 in April and May 2016, respectively (Figure 2). Streambank I is the right streambank, and was previously studied by Hayakawa et al. (2020). Streambank II is the left bank approximately 50 m downstream from streambank I, and was newly exposed as the result of a recent flood (Figure 2). These streambanks might had been formed by flooding (not tidal in present) or mountain-side slope collapse, and the sediments accumulated in the streambanks may contain old and newly re-deposited reduced sulfur. Samples were collected by trowel at depths of 1.3–1.7 m (I1) and 1.7–2.0 m (I2) at streambank I for the evaluation of sulfur-based denitrification between the expected sulfide rich layer (I2) and the expected non-sulfide layer (I1). At streambank II, eight samples were collected at depths of 0–0.1 m (II1), 0.1–0.3 m (II2), 0.3–0.4 m (II3), 0.7–0.9 m (II4), 1.3–1.5 m (II5), 1.8–2.0 m (II6), 2.2–2.4 m (II7), and 2.4–2.6 m (II8). In roughly, soil textures were fine sands and silts in I2, II1, II2, II4, and II8, and were coarse sands with gravel in other layers. The bluish gray color of the soils in II2, II4, and II8 (Figure 2) indicated these sediments were formed reducing conditions. To avoid contact with atmospheric oxygen, the sediments were taken by ca 15 cm depth from the streambank-wall surface and were sealed in sample bags for chemical analysis and incubation experiments and in 15 ml centrifuge tubes for bacterial analysis immediately after sampling and stored in a cooler box with ice packs. Samples for the incubation and for measurement of the bacterial community were stored at 4°C and −80°C until analysis, respectively.
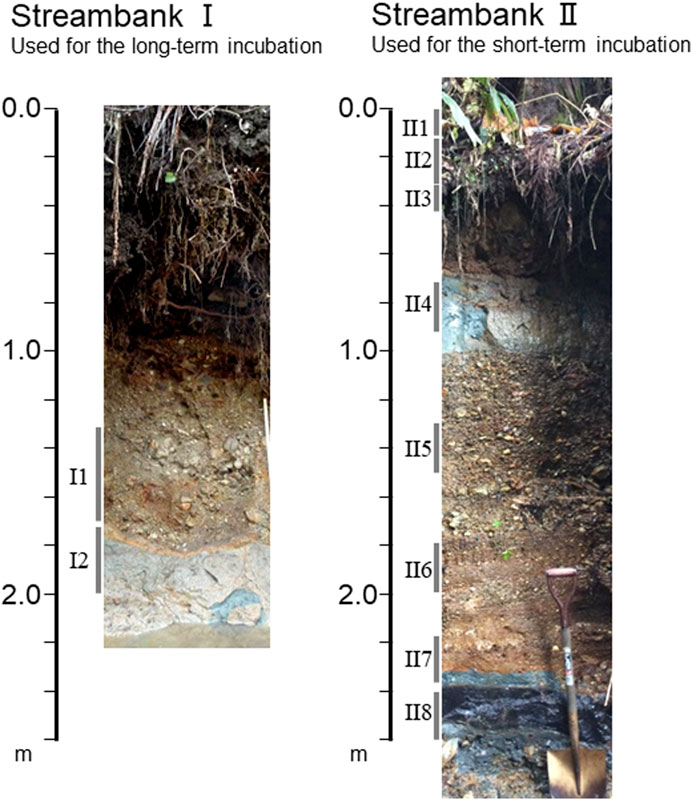
FIGURE 2. Streambanks I and II at St. 15, and the depths of the soils sampled for the incubation experiments.
Incubation Procedure
The incubation method was based on previous studies (Jørgensen et al., 2009; Hayakawa et al., 2013). Long-term incubation of soil from streambank I (I1 and I2) was conducted to evaluate changes in the NO3−, NO2−, NO, and N2O production/depletion patterns and the bacterial community. A 120 g quantity of fresh soil and 400 ml of solution were added to 550 ml glass bottles, which were then sealed with butyl rubber septa and an aluminum crimp. Two stainless-steel needles (Terumo, Tokyo, Japan, 23G × 32 mm; GL Sciences, Tokyo, Japan, 19G × 100 mm) were inserted into each septum and fitted with sterile three-way stopcocks for gas and solution sampling. Three treatment solutions were prepared: a deionized water control, CT; KNO3 (8 mg N L−1), N; and KNO3 + Na2S2O3 (20 mg S L−1), N + S. Thiosulfate (S2O32−) is considered to be a useful electron donor for sulfur-based denitrification (Chung et al., 2014; Qian et al., 2016). To achieve anoxic conditions, the solution and headspace in the bottles were purged with O2-free ultrapure N2 gas for 30 min. All bottles were prepared in triplicate and incubated at 25°C for 40 days in darkness. Because we intended to evaluate the potential of sulfur-based denitrification in the soils, the incubation was conducted in near the optimum growth temperature for sulfur denitrifying bacteria (e.g., Thiobachillus denitrificans, 28–32°C, Garrity et al., 2005).
Short-term incubation of soils from streambank II (II1–II8) was conducted to evaluate the vertical patterns of NO3−, NO2−, NO, and N2O production/depletion and the bacterial community. The incubation procedure was almost same as that of the long-term incubation, but in a smaller bottle. A 15 g amount of fresh soil and 50 ml of solution were added to 150 ml glass bottles. Two treatment solutions were prepared: KNO3 (5 mg N L−1), N; and KNO3 + Na2S2O3 (10 mg S L−1), N + S. All bottles were prepared in triplicate and incubated at 25°C for 5 days in darkness under anoxic conditions.
Water and Gas Sampling and Analysis
Water and gases in the incubation bottle were sampled eight times during the long-term incubation, at 1, 3, 6, 9, 14, 26, 30, and 40 days after the start of incubation, and twice during the short-term incubation, at 2 days (gas sample only) and 5 days after the start of incubation. In each sampling, 10- and 25 ml headspace gases in the bottle were sampled for the measurement of NO and N2O, respectively. The NO concentration was measured immediately after the sampling by using a NOx analyzer (MODEL42-i, Thermo Fisher Scientific, Yokohama, Japan). This analysis on the principle that NO and ozone (O3) react to produce a characteristic luminescence with an intensity linearly proportional to the NO concentration. For N2O analysis, the headspace gas was transferred from the syringe into a 15 ml evacuated glass vial and the N2O concentration was determined using a gas chromatograph (GC14-B, Shimadzu, Kyoto, Japan) equipped with an electron-capture detector. For water analysis, a 20 ml solution sample was extracted from the bottle with a 20 ml syringe. Immediately after the sampling, pH and electrical conductivity (EC) were measured in 5 ml of the sampled solution with a portable pH meter (B-212, HORIBA, Kyoto, Japan) and an EC meter (B-173, HORIBA, Kyoto, Japan). The remaining 15 ml of sampled solution was filtered through a 0.45 μm cellulose acetate membrane filter (DISMIC-13CP045AS, ADVANTEC, Tokyo, Japan). We measured the NO2−, NO3−, SO42−, and S2O32− concentrations in the solution using an ion chromatograph (DIONEX ICS-2100, Thermo Fisher Scientific, Yokohama, Japan). The detection limit for the analysis of S2O32− concentration is 0.003 mg S L−1. We determined the NH4+ concentration by colorimetry using the indophenol blue method with a continuous flow autoanalyzer (QuAAtro2-HR, BLTEC, Osaka, Japan). After every gas and water sampling, the same volume as the sampled gas and water of O2-free ultrapure N2 gas was added to the bottle by using a syringe with a needle.
Soil Analysis
We determined the total C and total S contents in the sediments using the combustion method for C (SUMIGRAPH NC-22F, SCAS, Japan) and for S (LECO S632, Tokyo, Japan). Sediment pH (H2O) and pH (H2O2) were determined by using soil/solution ratios of 1:2.5 (w/v) and 1:10 (w/v) (Murano et al., 2000), respectively. If the reduced sulfur are present in soils, they are often capable of rapid oxidation by H2O2, causing lowered pH (H2O2) values. The easily oxidizable S (EOS) content in the soils was calculated as the difference between the H2O2-soluble S content (H2O2-S) and the water-soluble S content (H2O-S) (Murano et al., 2000). EOS represents reduced sulfur such as pyrite in sediments (Murano et al., 2000).
Analysis of Bacterial Communities in the Soil
To describe the bacterial communities in the streambank soils, 16S rRNA genes were analyzed by means of PCR pyrosequencing. Total DNA was extracted from 0.5 g soil using a FastDNA SPIN Kit for Soil (MP Biomedicals, Carlsbad, CA, United States) according to the manufacturer’s instructions. DNA libraries were constructed based on two-step tailed PCR for 16S rRNA V4 region using primers (515f, 5′- GTGCCAGCMGCCGCGGTAA-3'; 806r, 5′- GGACTACHVGGGTWTCTAAT-3′) with an Illumina nextera barcode (Caporaso et al., 2011, https://jp.support.illumina.com/downloads/16s_metagenomic_sequencing_library_preparation.html). The mixture for the amplification of the first step consisted of 1 × KAPA HiFi HotStart Ready Mix (Roche, Basel, Switzerland), 0.25 μM of each primer, and 10 ng template DNA in a final volume of 25 μl. The amplification conditions were as follows: 94°C for 3 min; 25 cycles at 94°C for 60 s, 50°C for 60 s, and 72°C for 105 s; and a final extension at 72°C for 10 min. After purification on Agencourt AMPure XP (Beckman Coulter, Pasadena, CA, United States), second-step PCR was performed. The mixture for the amplification of the second step consisted of 1 × KAPA HiFi HotStart Ready Mix, 0.25 μM of each primer, and 5 μl first-step PCR product in a final volume of 50 μl. After purification on Agencourt AMPure XP, the concentrations were measured using a Qubit dsDNA BR Assay Kit (Thermo Fisher Scientific, Waltham, MA, United States). All PCR products were normalized to the same molecule concentration and mixed in equal volumes. The constructed libraries were subjected to 250-bp paired-end sequencing on an Illumina MiSeq with Miseq Reagent Kit v2 nano (500 Cycles).
Raw sequencing reads, which were divided into forward and reverse, were assembled using the Initial Process in the Ribosomal Database Project (RDP) Pyrosequencing Pipeline (http://pyro.cme.msu.edu/). Reads of 150 bp or fewer and those containing a sequence with a quality value of 20 or less were removed. Chimeric sequences were removed using Fungene chimera check Pipeline (http://fungene.cme.msu.edu/). Chimera-filtered sequences were classified phylogenetically using the RDP Classifier with a cut-off value of 0.8 (Supplementary Figures S1, S2). Sequences classified as belonging to sulfur-oxidizing bacteria were compared to sequences registered in the database of the DNA Databank of Japan by using the BLAST system (http://blast.ddbj.nig.ac.jp/blast/blastn?lang=en) to determine the most similar sequence type. In the sequences obtained in this study, sequences which exhibited more than 97% similarity to 16S rDNA sequences classified as SOB was, considered. The nucleotide sequence data were deposited in the DDBJ Read Archive (http://trace.ddbj.nig.ac.jp/dra/index_e.html) under accession number DRA011495.
Data Analysis
For the evaluation of NO3− depletion and SO42− production rates during incubation, the accumulated number of moles n (NO3− and SO42−) of element i removed from or released to the solution over time up to sampling occasion k was calculated from the measured concentration (Cmeas) following the method of Jørgensen et al. (2009) and Vaclavkova et al. (2014):
where
The chimera-filtered sequences were divided into operational taxonomic units (OTUs) for sequences with over 97% similarity to one another by uclust method and furthest clustering algorithm using the Qiime 1.9.0 (http://qiime.org/index.html). Diversity indices, such as Chao1 and the abundance-based coverage estimate (ACE), were also calculated using Qiime (Chao and Bunge 2002) (Supplementary Table S1). Differences in microbial community structure among in the samples were calculated from OTUs by unweighted UniFrac using Qiime, and principal coordinate analysis was performed (Supplementary Figure S3).
One-way ANOVA was used followed by Bonferroni’s test was used for multiple comparisons of variables among soils I1 and I2 in the long-term incubation. The Wilcoxon rank-sum test (U test) was used for comparisons between two treatments (N, N + S treatments). The Kruskal–Wallis test followed by the Steel–Dwass test were used for multiple comparisons of variables among soil layers II1 to II8, and bacterial communities among treatments in I2 during the long-term incubation. These statistical analyses were performed using R (R Development Core Team 2018; version 3.4.3).
Results
Physio-Chemical Properties of Streambank Soils
The characteristics of the soils in the two streambanks are listed in Table 1. The pH (H2O) was lowest in samples I2 (6.35) and II8 (5.54). The pH (H2O2) range was 3.04–7.08, with low values in I2, II1, II2, II4, and II8. EC was 2.9–726 mS m−1, with high values in I2, II1, II4, and II8. Total carbon content was the highest (48 g kg−1) in sample II1 of the surface soil. In contrast, high total sulfur contents were observed in subsoil samples I2, II4, and II8, and EOS levels were also high in those soil layers.
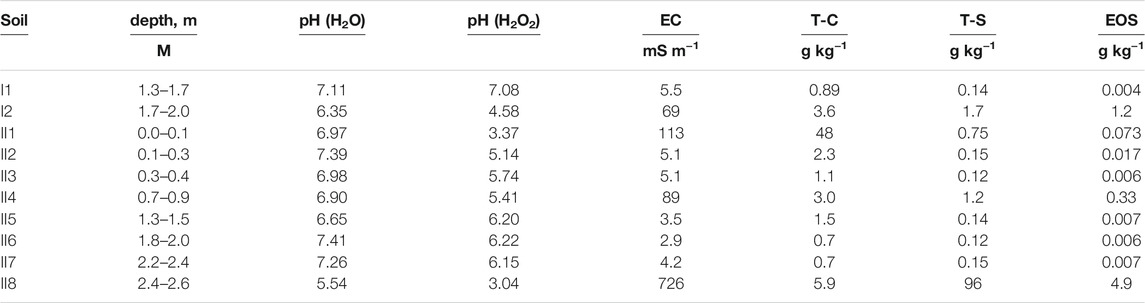
TABLE 1. Soil chemical properties at streambanks I and II. EC, electric conductivity; T-C, total carbon; T-S, total sulfur; EOS, easily oxidizable sulfur.
Long-Term Incubation Experiment
Temporal variations of the concentrations of aquatic and gaseous N species, S2O32−, and SO42− in different soil layers (I1 and I2) and treatments (N and N + S) during the long-term incubation experiment are shown in Figure 3. NO3− concentrations decreased more with time in I2 than in I1, and in the N + S treatment than in the N treatment for each layer. On day 14 day in I2, the NO3− concentration was markedly different between the N and N + S treatments, with values of 6.59 ± 1.7 and 1.94 ± 3.0 mg N L−1, respectively; the final values (on day 40) were 1.13 ± 0.73 and 0.22 ± 0.20 mg N L−1, respectively. In I2, the decrease in the NO3− concentration was followed by increases in the NO2−, NO, and N2O concentrations. NO2− accumulation was particularly observed in the first 14 days, with levels increasing to 0.76 mg N L−1 in the N treatment and 3.46 mg N L−1 in the N + S treatment. In contrast, in I1, the NO3− concentration did not fall markedly, but decreased more in the N + S treatment than in the N treatment. NH4+ was detected, but at relatively low levels (0.0–0.04 mg N L−1), and exhibited no clear differences among soils and treatments.
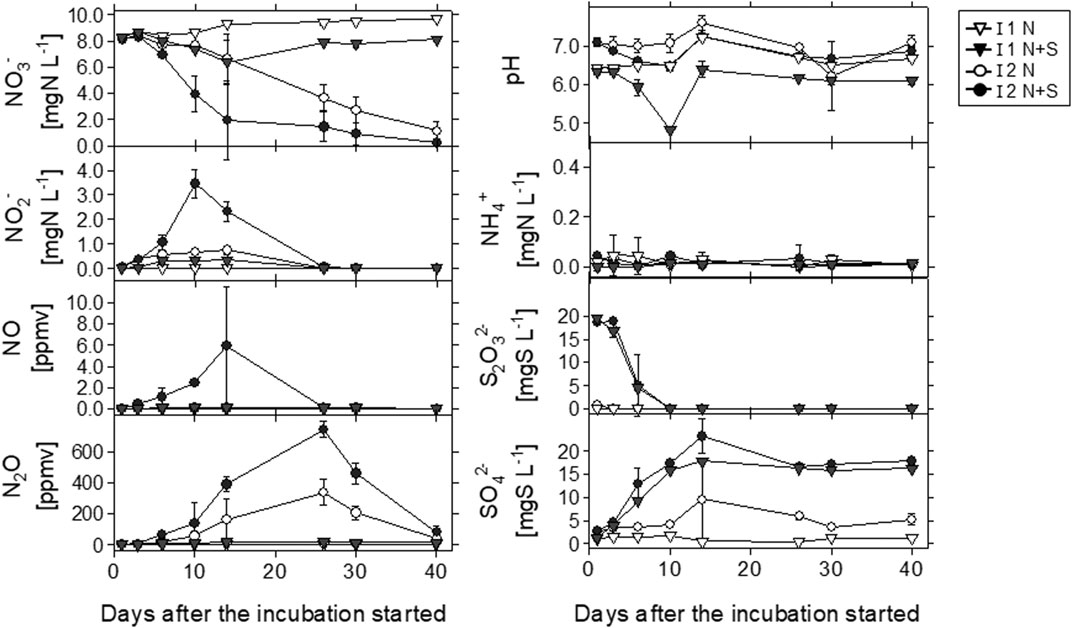
FIGURE 3. Temporal variations of pH and the concentrations of aquatic and gaseous nitrogen species, S2O32−, and SO42− with different soils (I1 and I2) and treatments (N and N + S) in the long-term incubation experiment. N, KNO3 solution; N + S, KNO3 and Na2S2O3 solution. Error bars indicate standard deviation (n = 3).
The NO concentration increased in I2 with N + S treatment to a maximum value of 5.96 ppmv on day 14, but was almost undetectable in I1 with N treatment. N2O was detected in both soils and treatments; the maximum values of 337 ppmv (N treatment) and 743 ppmv (N + S treatment) were observed in I2 on day 26. In I1 with N + S treatment, the maximum N2O concentration was approximately 1/43 (17 ppmv) of that in I2 with N + S treatment. The N2O concentration decreased rapidly after day 26, when NO2− and NO had almost disappeared. The S2O32− concentration decreased rapidly in the first 10 days and was oxidized to SO42− in both soils with N + S treatment. S2O32− was detected at 0.83 ± 0.02 mg S L−1 on day 1 in I2 without S addition (N treatment) but was not detected in I1 with N treatment throughout the incubation period.
The N + S treatment exhibited large fluctuations in water qualities and gas concentrations in sample I2 (Figure 4). By day 10, the NO3− concentration had fallen sharply, the NO2− concentration had increased, and the S2O32− concentration had decreased. During this interval, the pH fell from 7.1 to 6.5. After the NO2− peak on day 10, the maximum NO concentration was detected on day 14, at the same time as the pH increased to 7.2, followed by the N2O peak concentration on day 26.
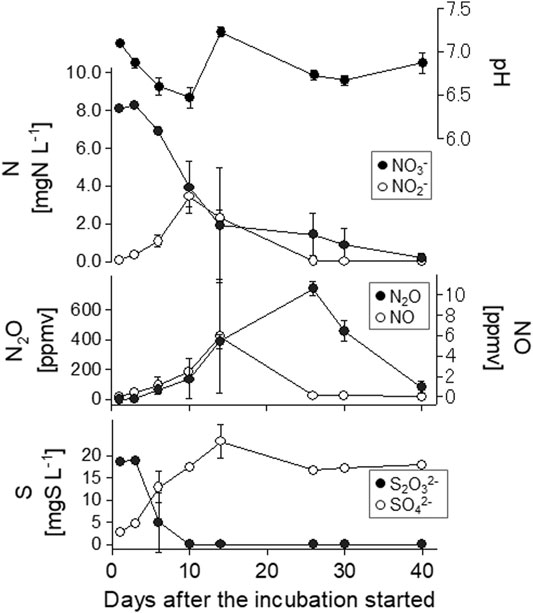
FIGURE 4. Temporal variations of aquatic and gaseous nitrogen species and S2O32− and SO42− concentrations in I2 with N + S treatment in the long-term incubation experiment. N, KNO3 solution; N + S, KNO3, and Na2S2O3 solution. Error bars indicate standard deviation (n = 3).
Using moles data in Supplementary Figure S4, the results of ΔNO3− and ΔSO42−, and ΔSO42−/ΔNO3− during different incubation periods are shown in Table 2. Since NO3− and SO42− were linearly changed especially during days 1–14 (Supplementary Figure S4), we estimated ΔNO3− and ΔSO42− values for days 1–14 and all the incubation period (1–40). In both the periods, ΔNO3− in I2 with N + S treatment was significantly larger than other treatments, and ΔSO42− was significantly larger in the added S treatments (Table 2). On one hand, ΔSO42−/ΔNO3− did not differ between soils and treatments during days 1–14 and was significantly larger in I1 with N + S treatment during days 1–40 (Table 2). The relationships between ΔNO3− and ΔSO42− of I1 and I2 with both treatments during different incubation periods showed that the results for I2 with N and N + S treatments plotted between the denitrification lines of S2O32− and FeS during days 1–14 with large variations (Figure 5A). During days 1–40, only I2 with N + S treatment plotted between these lines with small variations (Figure 5B). In the case of I1, relatively larger ΔSO42− than ΔNO3− resulted in higher ΔSO42−/ΔNO3− in the N + S treatment. In the N treatment of I1, both ΔNO3− and ΔSO42− were small; therefore, these results plotted near zero.
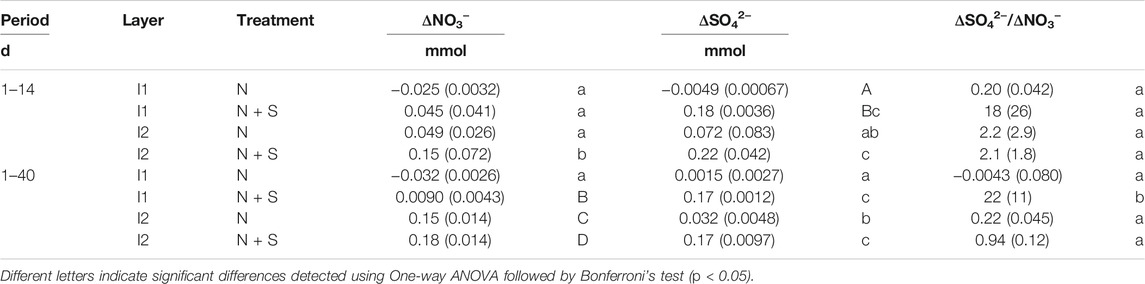
TABLE 2. Nitrate consumption (ΔNO3−) and sulfate production (ΔSO42−), and ΔSO42−/ΔNO3− of the different estimation periods during long-term incubation.
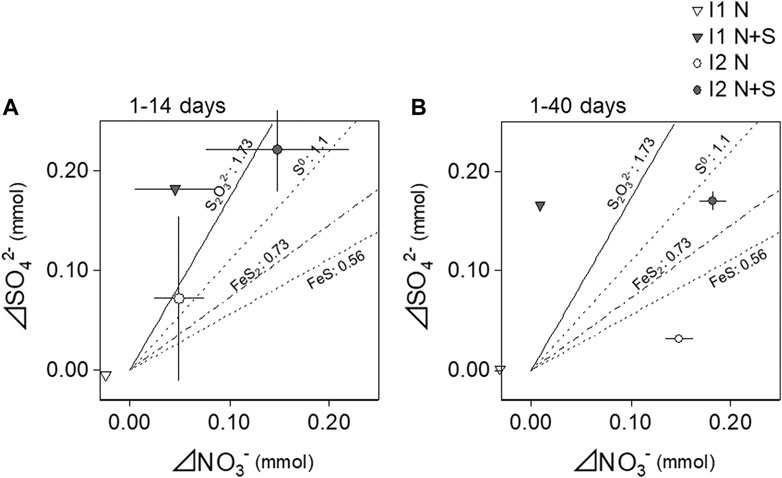
FIGURE 5. Relationships between nitrate consumption (ΔNO3−) and sulfate production (ΔSO42−) during long-term incubation. The estimation period for the consumption or the production values from days 1–14 (A) and from days 1–40 (B). Lines in the figure indicate stoichiometric S/N of sulfur-based denitrification using different electron donors of S. S2O32−, Matsui and Yamamoto (1986); S0, Batchelor and Lawrence (1978); FeS2, Tong et al. (2017); FeS, Schippers and Jørgensen (2002).
Short-Term Incubation Experiment
The NO3−, NO2−, NO, and N2O levels and the pH were compared among different treatments and soil layers in the short-term incubation experiment using soils II1–8 (Figures 6, 7, Table 3). Addition of S significantly decreased the NO3− concentration (p < 0.01) and pH (p < 0.01), and increased the NO2− (p < 0.01), NO (p < 0.05), and N2O (p < 0.05) concentrations (Figure 6). These N species also changed markedly in the different soil layers (Figure 7, p < 0.01). NO3− concentrations in II4 and II8 tended to be lower, especially with added S (Table 3; Figure 7). The NO2− concentration rose with S addition in II4 (to 2.1 mg N L−1) and II8 (to 0.57 mg N L−1) (Table 3). SO42− concentrations were higher in II4 (2.2 mg S L−1) and II8 (10 mg S L−1) without S addition (N treatment). S2O32− was below the detection limit in any treatments or layers (data not shown). NO and N2O concentrations after day 5 tended to be higher in II2, II4, and II8, especially with added S (Figure 7; Table 3). NO concentrations in II2, II4, and II8 with S addition increased to 12, 19, and 29 ppmv, respectively (Table 3); N2O concentrations in II2, II4, and II8 with S addition increased to 84, 58, and 260 ppmv, respectively (Table 3). In II1, the NO3− concentration decreased to almost 0 mg N L−1 in both treatments, and NO2−, NO, and N2O were also almost undetectable after day 5, but NO and N2O clearly increased after day 2 (Table 3). In II3, II5, II6, and II7, the decrease in NO3− and the increases in NO2−, NO, and N2O were relatively small.
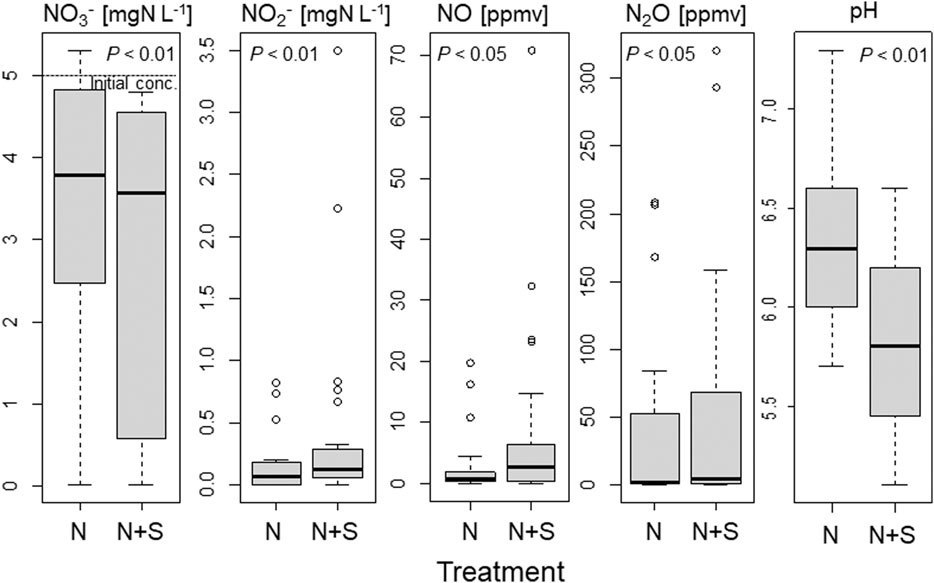
FIGURE 6. Comparisons of NO3−, NO2−, NO, and N2O concentrations and pH between treatments in the short-term incubation experiment using soils of streambank II. Thick line indicates median value, rectangle 25–75% of values. N, KNO3 solution; N + S, KNO3, and Na2S2O3 solution.
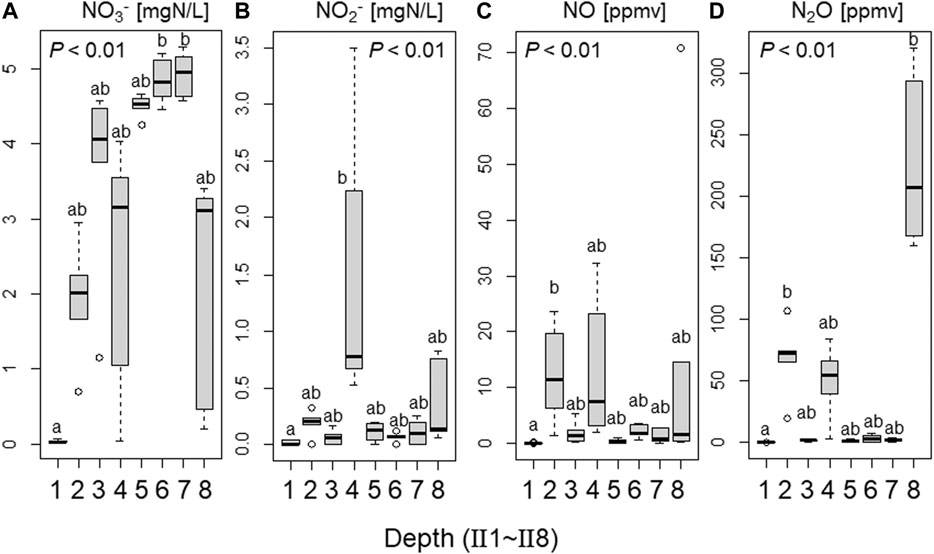
FIGURE 7. Comparisons of NO3−, NO2−, NO, and N2O concentrations between depths in the short-term incubation experiment using soils of streambank II. Thick line indicates median value, rectangle 25–75% of values. Different letters indicate significant differences detected using Kruskal–Wallis test followed by Steel–Dwass test (p < 0.05).
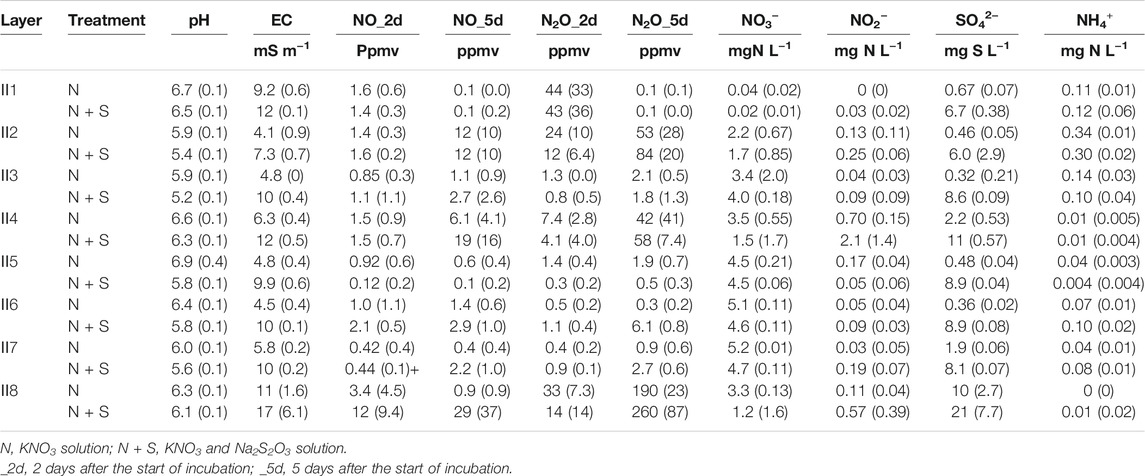
TABLE 3. Summary data of the short-term incubation experiment using soils from streambank II. Values in parentheses indicate standard deviation (n = 3).
Bacterial Communities in the Soil
The following were considered to be sulfur-oxidizing bacteria (SOB) in this study [name (Genbank accession number)]; Bacterium ML2-86 (DQ145977.1), Bacterium PE03-7G2 (AB127721.1), Halothiobacillus sp. SS13102 (KM979607.1), Rhodocyclaceae bacterium FTL11 (DQ451827.1), Sulfuricella denitrificans skB26 (AP013066.1), Sulfuricurvum kujiense DSM 16994 (CP002355.1), Sulfuricurvum kujiense YK-3 (AB080644.1), Sulfuritalea hydrogenivorans sk43H (AP012547.1), Sulfur-oxidizing bacterium OAII2 (AF170423.1), Thiobacillus aquaesulis (U58019.1), Thiobacillus denitrificans strain AGR/IICT/15B (LN614387.1), Thiobacillus thioparus strain NZ (KC542801.1), Thiomonas arsenivorans strain b6 (AY950676.1), Thiomonas sp. Ynys3 (AF387303.1). The relative abundances of SOB in I2 during the long-term incubation experiment are plotted in Figure 8. The significant differences (p < 0.05) among treatments were detected in S. denitrificans strain skB26 and S. kujiense, although no significant differences were detected any pairs of the data groups. The main SOB in the soil was S. denitrificans strain skB26, which accounted for 55% of SOB and 0.04% of all sequences in the original soil before incubation (Figure 8, Ori). In the N + S treatment, S. denitrificans and S. kujiense strain YK-3increased on day 10 (N + S_10), and the combined abundance of both sequences increased to 3.3% of all bacteria. On day 30, the abundance of SOB relative to bacteria in the N + S treatment decreased, but rose to 0.6% in the N treatment. The vertical profiles of SOB relative abundance in the soils of streambank II are plotted in Figure 9. The relative abundance of SOB ranged from 0.0% in II1 to 4.8% in II8. S. denitrificans was detected in II4, II7, and II8. Similarly, T. denitrificans strain AGR/IICT/15B was detected only in II8. Of the SOBs detected in the streambank II soil layers, S. denitrificans (II4, II7, and II8), T. denitrificans (II8), and S. hydrogenivorans (II8) all occurred in the I2 soil (Figures 8, 9).
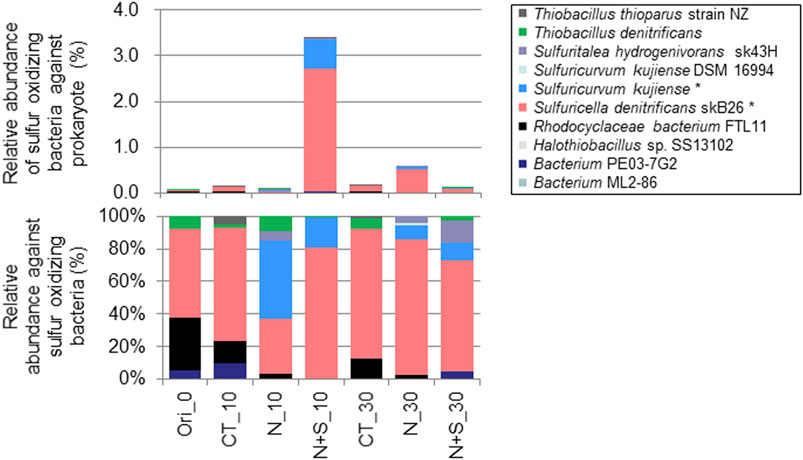
FIGURE 8. Comparison of relative abundances of sulfur-oxidizing bacteria between treatments during the long-term incubation experiment in the I2 soil. Ori, original soil before incubation; CT, control; N, N treatment; N + S, N + S treatment. 0, 10, and 30 indicate the number of days after the start of incubation. The figure legend * indicates significant differences among treatments detected using Kruskal–Wallis test (p < 0.05), but no significant differences were detected any pairs of the data groups by Steel-Dwass test.
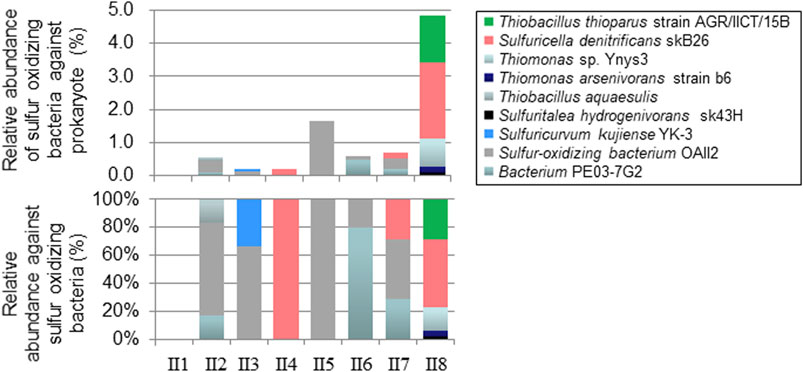
FIGURE 9. Relative abundances of sulfur-oxidizing bacteria at different depths in the streambank II soils.
Discussion
NO3− Reduction by Sulfur-Based Denitrification
Both the incubation experiments showed an NO3− reduction followed by increases in the NO2−, NO, and N2O concentrations in some soils (Figures 3, 7; Table 3), indicating that denitrification had occurred. No accumulation of NH4+ indicated dissimilatory nitrate reduction to ammonium (DNRA) (Friedl et al., 2018) was not a major NO3− removal process. Especially in the long-term incubation experiment in I2, the successive peaks of NO2−, NO, and N2O concentrations (Figure 4) strongly support the occurrence of biological denitrification (Tiedje 1994; Di Capua et al., 2019). The magnitude of the decrease of NO3− concentration indicates that the denitrification potential was higher in the soils of I2, II1, II2, II4, and II8 (Figures 3, 7). As discussed below, sulfur-based denitrification would be expected to occur predominantly in soils I2, II4, and II8, whereas other N-reduction processes such as heterotrophic denitrification could mostly take place in soils II1 and II2, depending on the availability of electron donors and/or bacteria for denitrification.
Addition of thiosulfate significantly promoted reduction of NO3− and production of NO2−, NO, and N2O (Figures 3, 6), indicating that sulfur-based denitrification had occurred. In I2 with N and N + S treatments, ΔSO42−/ΔNO3− for days 1–14 of incubation was large variation (2.1 ± 1.8, Table 2) and crossed to the denitrification line using thiosulfate, S0, and FeS2 as electron donors (Figure 5) with a decrease in pH (Figure 4), implying the occurrence of denitrification accompanying sulfur oxidation. II4 and II8 also exhibited relatively higher reduction of NO3− with added S (Table 3). These results indicate that sulfur-oxidizing bacteria in the soils had metabolized the added thiosulfate and had promoted denitrification. In fact, S. denitrificans and T. denitrificans, which were relatively abundant in I2, II4, and II8, possess the ability to metabolize thiosulfate and can reduce NO3− (Kojima and Fukui, 2010; Shao et al., 2010). The increase in the relative proportions of S. denitrificans and S. kujiense on day 10 of I2 with N + S treatment (Figure 8) suggests that these bacteria were activated by the addition of thiosulfate. S. kujiense, which was detected in I2 and II3, also has the ability to reduce NO3− as the electron acceptor using thiosulfate (Kodama and Watanabe, 2004). Therefore, these bacteria are thought to be the key players in reduction of NO3− to NO2− by using thiosulfate.
The results of the long-term incubation also indicated that the phases controlling N reduction changed dramatically between the initial 14 day period and thereafter (Figures 4, 5 and Supplementary Figure S4). Sulfur-based denitrification may have been the predominant NO3− reduction process during the first 14 days in I2, and other N reduction processes such as heterotrophic denitrification may have occurred after day 14. The evidence supporting this conclusion is as follows: reduction of NO3− to NO2− accompanied by thiosulfate oxidation was clear during the first 14 days (Figure 4); the stoichiometric ratio of ΔSO42−/ΔNO3− was similar to the denitrification line using thiosulfate (Matsui and Yamamoto, 1986) during the first 14 days (Figure 5); and sulfur-oxidizing bacteria with NO3− reduction potential were detected and increased in relative abundance during this period (Figure 8). Chen et al. (2018) reported in a reactor study using solid S0 as the electron donor for denitrification that the affinity of S0 for NO3− was considerably higher than that for NO2−; they also discussed the conversion of NO3− to NO2−, and of NO2− to N2, being performed by different microorganisms.
NO2− Accumulation and NO and N2O Production
Temporal accumulation of NO2− was observed in this study (Figure 4; Table 3), as has also been demonstrated in previous bioreactor studies with added S (Moon et al., 2004; Chung et al., 2014; Liu et al., 2017; Chen et al., 2018). NO2− clearly accumulated during the first 10 days, particularly in I2 with S addition (Figure 4). Because the sum of NO2− and NO3− concentrations during this period was stable at approximately 8 mg N L−1, which was equivalent to the added N concentration, NO2− reduction does not appear to have occurred, resulting in NO2− accumulation. Possible reasons for this are that the reduction of NO2− by sulfur-oxidizing bacteria is slower than the reduction of NO3− (Chung et al., 2014), and the higher affinity of sulfides for NO3− reduction than NO2− reduction, as discussed above. The S/N ratio in the added solution might also have been important for NO2− accumulation. Yamamoto-Ikemoto et al. (2000) observed accumulation of NO2− at added S/N (w/w) values of less than 4.35. Chung et al. (2014) reported that NO2− accumulation occurred at lower S/N ratios, possibly as a result of sulfide limitation, and complete denitrification required S/N of 5.1 (w/w). Liu et al. (2017) also observed NO2− accumulation at S/N values of 3.0 (w/w). In contrast, Qiu et al. (2020) reported that, in short-term batch tests in a sulfur-based denitrification system, organic supplementation accelerated NO2− reduction, indicating that denitrifiers likely use organics preferentially over sulfur as the electron donors to reduce NO2−. In our study, relatively lower added S/N (w/w) in the long-term (2.5) and short-term (2.0) incubations and probable lower available organic C in the subsoil possibly caused the temporal NO2− accumulation. Other possible mechanisms for NO2− accumulation may have to do with the abilities of sulfur-oxidizing bacteria. S. kujiense (detected in I2 and II3) and T. thioparus (detected in I2 and II8; Figures 8, 9) can utilize thiosulfate as the electron donor and NO3− as the electron acceptor under anaerobic conditions, but can transfer NO3− to NO2− only (Kodama and Watanabe, 2004; Vaclavkova et al., 2015); thus, these bacteria, especially S. Kujiense detected significant change among treatments (Figure 8), may also contribute to NO2− accumulation. Another possible reason for the NO2− peak may be that nitrite-reducing organisms start growing after the consumption of NO3−. In general, bacterial growth starts after substrate consumption (Maier and Pepper, 2014). Therefore, long-term incubation studies with higher substrate addition to subsoil which is expected to be low in bacteria, slower bacterial growth-rate may not be negligible for NO2− accumulation.
Our results also demonstrated that S addition to the soil markedly increased the production and temporal accumulation of NO and N2O. Especially in I2, II4, and II8, increases in NO and N2O concentrations were observed in association with S addition (Figures 4, 6, Table 3). This pattern may possibly result from the low added S/N ratio to the soils, the same reason as for the accumulation of NO2−. Lan et al. (2019) reported that a low S/N (w/w) ratio of one caused NO accumulation because competition for electrons caused incomplete denitrification (Velho et al., 2017; Pan et al., 2013). Another study reported that a high NO2− concentration (30 mg N L−1) promoted NO accumulation (Castro-Barros et al., 2016). Our results also showed that N2O concentration was higher with S addition, indicating enhanced N2O production and accumulation (Figures 4, 6). Lan et al. (2019) also reported N2O accumulation in a batch reactor experiment and discussed how higher NO2− levels can inhibit N2O reductase activity and cause N2O accumulation. In fact, a rapid reduction in N2O was observed from day 26, when NO2− had almost disappeared (Figure 4). In contrast, Yang et al. (2016) revealed that N2O accumulation at an S/N mass ratio of 5.0 was only 4.7% of that at 3.0 S/N, and found that the N2O reduction rate was linearly proportional to the sulfide concentration at pH 7.0. Recent study reported that the electron distribution was significantly affected by sulfide loading rate, and the electron competition among nitrogen oxide reductases was intensified with the most electrons flowing towards NO3− reductase, and the least electrons towards N2O reductase under decreased sulfide loading rate, which is more directly responsible for intermediates accumulation such as NO2−, NO, N2O in sulfur-based denitrification process (Oberoi et al., 2021). Therefore, considering the use of lower S/N values in our study, it seems that sulfide was predominantly used for NO3− reduction, after which NO2− accumulated because of a sulfide limitation, and the limited sulfide and accumulated NO2− might also have caused NO and N2O accumulation (Figure 4). Future work should incorporate experiments matching the S/N values observed in natural soils.
Sulfur-Based Denitrification Using Inherent S in Subsoil in Marine Sedimentary Rock Regions
The inherent sulfide in the subsoils might be derived from the marine sedimentary rocks, which are highly enriched in total sulfur in the Akita region (Koma, 1992), and this enrichment is likely reflected in the high EOS content in streambed sediments (Figure 1, Hayakawa et al., 2020) and in the subsoils in this study. The optimum growth rate of S. kujiense occurs in low-intensity salty conditions (Kodama and Watanabe, 2004); this species was detected in I2. The EC in the subsoil of the study area was relatively high (Table 1), suggesting that the subsoil remains a relatively salty environment, reflecting the influence of marine sedimentary rocks and possibly providing suitable conditions for such bacteria.
The indigenous sulfides observed in this study would be useful electron donors for ecosystem-wide sulfur-based denitrification in the subsoil. EOS represents reduced sulfur such as pyrite (Murano et al., 2000), which has been reported to act as an electron donor for sulfur-based denitrification in streambed sediments (Hayakawa et al., 2013). Because subsoils I2, II4, and II8, in which signs of sulfur-based denitrification were detected, had a high EOS content (Table 1), EOS in those soils could have been the electron donor for denitrification by sulfur-oxidizing bacteria. In the N treatment of I2, thiosulfate was detected at low levels on day 1, the SO42− concentration increased even without S addition (Figure 3; Table 2), and ΔSO42−/ΔNO3− was similar to the denitrification line using thiosulfate until day 14 (Figure 5). These results indicate that the original EOS in the I2 soil had provided available S as an electron donor for denitrification. In addition, the SO42− concentrations in II4 and II8 without S addition (N treatment) were higher than those in other soil layers (Table 3), suggesting that the inherent sulfide had been oxidized to SO42− and might have contributed to denitrification. However, detection of thiosulfate appears to be difficult, probably because the oxidation rate of inherent sulfide to thiosulfate is slow and the thiosulfate produced is rapidly oxidized to SO42− (Figure 3). Therefore, thiosulfate was not detected during the short-term incubation. HS− and S0 other than thiosulfate can be also electron donors for sulfur-based denitrification (De Capua et al., 2019) and iron sulfides (FeS and FeS2) can produce HS−, S0 and thiosulfate in their dissolution processes (Hu et al., 2020). X-ray powder diffraction analysis showed the diffraction patterns for I2, II4, and II8 soils were likely equivalent to pyrite (FeS2) and pentlandite [(Fe, Ni)9S8] (Supplementary Figure S5). Therefore, these iron sulfides might be electron donors for denitrification and the large variations of the stoichiometric ratios in I2 during days 1–14 (Figure 5 and Table 2) might have included the results of the oxidation of such iron sulfides from the indigenous sulfides in the catchment. Bacteria detected in this study subsoil also possess the ability to metabolize S0 (S. denitrificans, T. denitrificans, and S. kujiense) and HS− (T. denitrificans), and can reduce NO3− (Kodama and Watanabe, 2004; Kojima and Fukui, 2010; Shao et al., 2010; De Capua et al., 2019; Cron et al., 2019).
In general, most NO3− is reduced by denitrifying heterotrophs rather than by chemoautotrophs such as sulfur-oxidizing bacteria because NO3− reduction by organic matter should thermodynamically precede reduction by sulfide (Postma et al., 1991). In the surface soil, heterotrophic denitrification was probably the dominant NO3− reduction process. In II1, little NO3−, NO2−, NO, and N2O were detected after 5 days of incubation, but higher NO and N2O concentrations were detected after 2 days (Table 3), indicating that denitrification had occurred rapidly. Because sulfur-oxidizing bacteria were not detected in II1 (Figure 9), NO3− was likely reduced by heterotrophs using relatively abundant organic carbon as the electron donor in the surface soil (Table 1). Therefore, when the conditions are suitable, denitrification will proceed more rapidly in surface soil than in the underlying soil. Carbon was also present in the subsoils (Table 1), but may be too old to be available for bacteria. Baker et al. (2012) suggested that pyrite was the main electron donor in subsoil because no significant decrease in organic C content was observed, likely because hardly decomposable organic C could not be exploited by heterotrophic microbes in the old sediments of the Jurassic Lincolnshire limestone. In contrast, Vaclavkova et al. (2014) found that sulfur-based denitrification co-occurred and accounted for approximately 30% of the net NO3− reduction, despite the presence of organic carbon, in a variety of Danish sediments. Cron et al. (2019) suggested that sulfur-oxidizing bacteria (Sulfuricurvum kujiense, also detected in this study) could use soluble organics to stabilize stores of bioavailable S0 outside the cells. Recent bioreactor study reported key functional heterotrophic and autotrophic denitrifiers jointly contributed to high nitrogen removal efficiency by symbiotic relationships (Han et al., 2020). Although we did not measure organic C dynamics in this study, these symbiotic relationships may also occur in natural subsoil with lower available organic C in the study area.
The same denitrifying sulfur-oxidizing bacteria (S. denitrificans) were detected in the higher EOS subsoil layers I2, II4, II7, and II8 despite the different streambanks being located approximately 50 m apart (Figure 2), and beta diversity analysis shown that microbial communities in II4 and II8 were similar to those in I2 samples. (Supplementary Figure S3). S. denitrificans is a facultative anaerobic sulfur-oxidizing bacterium that was isolated from an anoxic layer (depth 40 m) from a freshwater lake in Japan (Kojima and Fukui, 2010). These results suggest that this bacterium is ubiquitous in the similar sulfide-containing layers in the catchments having higher EOS in riverbed sediments (Figure 1) and can contribute to NO3− reduction; in addition, because it is a freshwater bacterium, it is thought to have occurred in the soil only after the change from seawater to freshwater. However, the relative abundance of the bacterium was less than 5% of the total microbial community (Figures 8, 9). A previous sludge reactor study also reported that T. denitrificans accounted for less than 5% of the entire microbial population by fluorescent in situ hybridization, despite clear NO3− reduction being observed (Dolejs et al., 2015). A small number of key players may be responsible for sulfur-based denitrification, especially in natural subsoils and sediments.
Conclusions
We detected multiple signs of sulfur-based denitrification in streambank subsoils in a headwater catchment underlain by marine sedimentary rock. Specifically, NO3− reduction accompanied by SO42− production; a microbial stoichiometric ΔSO42−/ΔNO3− ratio indicative of denitrification using thiosulfate; accumulation of NO2−, NO, and N2O; and sulfur-oxidizing bacteria with the ability to reduce NO3− were detected in the subsoils with higher sulfide contents. The key player of sulfur-based denitrification in the subsoils appeared to be S. denitrificans, which is widespread and can exploit the inherent sulfide in those soils. These results revealed that the subsoils possess the potential for sulfur-based denitrification; therefore, sulfur-based denitrification in the subsoil is an important process for NO3− reduction and might control NO3− in the catchment. Further information on the quantity and three-dimensional distribution of sulfides and the functions associated with sulfur-oxidizing bacteria are required for better understanding and estimation of ecosystem-wide denitrification in sulfide-rich regions.
Data Availability Statement
The datasets presented in this study can be found in online repositories. The names of the repository/repositories and accession number(s) can be found below: https://www.ddbj.nig.ac.jp/, DRA011495.
Author Contributions
AH: Conceptualization, methodology, investigation, writing-reviewing and editing of this study. HO: Investigation, analysis of soil and gas, and writing-original draft preparation. RA: Bacterial community analysis. HM: Methodology of soil analysis especially easily oxidizable sulfur. TI: Investigation and reviewing. TT: Supervision of this study.
Funding
This study was partly supported by a Grant-in-Aid for Research (B), No. 26281011, provided by the Japan Society for the Promotion of Science (JSPS).
Conflict of Interest
The authors declare that the research was conducted in the absence of any commercial or financial relationships that could be construed as a potential conflict of interest.
Publisher’s Note
All claims expressed in this article are solely those of the authors and do not necessarily represent those of their affiliated organizations, or those of the publisher, the editors and the reviewers. Any product that may be evaluated in this article, or claim that may be made by its manufacturer, is not guaranteed or endorsed by the publisher.
Supplementary Material
The Supplementary Material for this article can be found online at: https://www.frontiersin.org/articles/10.3389/fenvs.2021.664488/full#supplementary-material.
References
Adhikari, K., and Hartemink, A. E. (2016). Linking soils to ecosystem services - A global review. Geoderma 262, 101–111. doi:10.1016/j.geoderma.2015.08.009
Baker, K. M., Bottrell, S. H., Hatfield, D., Mortimer, R. J. G., Newton, R. J., Odling, N. E., et al. (2012). Reactivity of pyrite and organic carbon as electron donors for biogeochemical processes in the fractured Jurassic Lincolnshire limestone aquifer, UK. Chem. Geology. 332-333, 26–31. doi:10.1016/j.chemgeo.2012.07.029
Batchelor, B., and Lawrence, A. W. (1978). Autotrophic Denitrification Using Elemental Sulfur. Journal (Water Pollution Control Federation) 50, 1986–2001.
Brunet, R. C., and Garcia-Gil, L. J. (1996). Sulfide-induced dissimilatory nitrate reduction to ammonia in anaerobic freshwater sediments. FEMS Microbiol. Ecol. 21, 131–138. doi:10.1016/0168-6496(96)00051-710.1111/j.1574-6941.1996.tb00340.x
Burgin, A. J., and Hamilton, S. K. (2007). Have we overemphasized the role of denitrification in aquatic ecosystems? A review of nitrate removal pathways. Front. Ecol. Environ. 5, 89–96. doi:10.1890/1540-9295(2007)5[89:hwotro]2.0.co;2
Burgin, A. J., and Hamilton, S. K. (2008). NO3 −-Driven SO4 2− Production in Freshwater Ecosystems: Implications for N and S Cycling. Ecosystems 11, 908–922. doi:10.1007/s10021-008-9169-5
Caporaso, J. G., Lauber, C. L., Walters, W. A., Berg-Lyons, D., Lozupone, C. A., Turnbaugh, P. J., et al. (2011). Global patterns of 16S rRNA diversity at a depth of millions of sequences per sample. Proc. Natl. Acad. Sci. 108, 4516–4522. doi:10.1073/pnas.1000080107
Castro-Barros, C. M., Rodríguez-Caballero, A., Volcke, E. I. P., and Pijuan, M. (2016). Effect of nitrite on the N2O and NO production on the nitrification of low-strength ammonium wastewater. Chem. Eng. J. 287, 269–276. doi:10.1016/j.cej.2015.10.121
Chao, A., and Bunge, J. (2002). Estimating the number of species in a stochastic abundance model. Biometrics 58 (3), 531–539. doi:10.1111/j.0006-341x.2002.00531.x
Chen, F., Li, X., Gu, C., Huang, Y., and Yuan, Y. (2018). Selectivity control of nitrite and nitrate with the reaction of S0 and achieved nitrite accumulation in the sulfur autotrophic denitrification process. Bioresour. Tech. 266, 211–219. doi:10.1016/j.biortech.2018.06.062
Chung, J., Amin, K., Kim, S., Yoon, S., Kwon, K., and Bae, W. (2014). Autotrophic denitrification of nitrate and nitrite using thiosulfate as an electron donor. Water Res. 58, 169–178. doi:10.1016/j.watres.2014.03.071
Craig, L., Bahr, J. M., and Roden, E. E. (2010). Localized zones of denitrification in a floodplain aquifer in southern Wisconsin, USA. Hydrogeol J. 18, 1867–1879. doi:10.1007/s10040-010-0665-2
Cron, B., Henri, P., Chan, C. S., Macalady, J. L., and Cosmidis, J. (2019). Elemental Sulfur Formation by Sulfuricurvum kujiense Is Mediated by Extracellular Organic Compounds. Front. Microbiol. 10, 2710. doi:10.3389/fmicb.2019.02710
Di Capua, F., Pirozzi, F., Lens, P. N. L., and Esposito, G. (2019). Electron donors for autotrophic denitrification. Chem. Eng. J. 362, 922–937. doi:10.1016/j.cej.2019.01.069
Dolejs, P., Paclík, L., Maca, J., Pokorna, D., Zabranska, J., and Bartacek, J. (2015). Effect of S/N ratio on sulfide removal by autotrophic denitrification. Appl. Microbiol. Biotechnol. 99, 2383–2392. doi:10.1007/s00253-014-6140-6
Fang, Y., Gundersen, P., Vogt, R. D., Koba, K., Chen, F., Chen, X. Y., et al. (2011). Atmospheric deposition and leaching of nitrogen in Chinese forest ecosystems. J. For. Res. 16, 341–350. doi:10.1007/s10310-011-0267-4
Friedl, J., De Rosa, D., Rowlings, D. W., Grace, P. R., Müller, C., and Scheer, C. (2018). Dissimilatory nitrate reduction to ammonium (DNRA), not denitrification dominates nitrate reduction in subtropical pasture soils upon rewetting. Soil Biol. Biochem. 125, 340–349. doi:10.1016/j.soilbio.2018.07.024
Galloway, J. N., and Cowling, E. B. (2002). Reactive Nitrogen and the World: 200 Years of Change. AMBIO: A J. Hum. Environ. 31, 64–71. doi:10.1579/0044-7447-31.2.64
Garcia-Gil, L. J., and Golterman, H. L. (1993). Kinetics of FeS-mediated denitrification in sediments from the Camargue (Rhone delta, southern France). FEMS Microbiol. Ecol. 13, 85–91. doi:10.1111/j.1574-6941.1993.tb00054.x
Garrity, G. M., Bell, J. A., and Lilburn, T. (2005). “Genus Thiobacillus,” In Bergey’s manual of systematic bacteriology. Vol. 2,2edn, PartB. Edited by G. M. Garrity 58–59. New York: Springer.
Han, F., Zhang, M., Shang, H., Liu, Z., and Zhou, W. (2020). Microbial community succession, species interactions and metabolic pathways of sulfur-based autotrophic denitrification system in organic-limited nitrate wastewater. Bioresour. Tech. 315, 123826. doi:10.1016/j.biortech.2020.123826
Hayakawa, A., Funaki, Y., Sudo, T., Asano, R., Murano, H., Watanabe, S., et al. (2020). Catchment topography and the distribution of electron donors for denitrification control the nitrate concentration in headwater streams of the Lake Hachiro watershed. Soil Sci. Plant Nutr. 66, 906–918. doi:10.1080/00380768.2020.1827292
Hayakawa, A., Hatakeyama, M., Asano, R., Ishikawa, Y., and Hidaka, S. (2013). Nitrate reduction coupled with pyrite oxidation in the surface sediments of a sulfide-rich ecosystem. J. Geophys. Res. Biogeosci. 118, 639–649. doi:10.1002/jgrg.20060
Horowitz, A. J., and Elrick, K. A. (2017). The use of bed sediments in water quality studies and monitoring programs. Proc. IAHS 375, 11–17. doi:10.5194/piahs-375-11-2017
Hu, Y., Wu, G., Li, R., Xiao, L., and Zhan, X. (2020). Iron sulphides mediated autotrophic denitrification: An emerging bioprocess for nitrate pollution mitigation and sustainable wastewater treatment. Water Res. 179, 115914. doi:10.1016/j.watres.2020.115914
Iribar, V., and Ábalos, B. (2011). The geochemical and isotopic record of evaporite recycling in spas and salterns of the Basque Cantabrian basin, Spain. Appl. Geochem. 26, 1315–1329. doi:10.1016/j.apgeochem.2011.05.005
Japan Meteorological Agency (2013). Information of meteorological statistics. Accessed April 19 2013 http://www.data.jma.go.jp/obd/stats/etrn/index.php.
Juncher Jørgensen, C., Jacobsen, O. S., Elberling, B., and Aamand, J. (2009). Microbial oxidation of pyrite coupled to nitrate reduction in anoxic groundwater sediment. Environ. Sci. Technol. 43, 4851–4857. doi:10.1021/es803417s
Kodama, Y., and Watanabe, K. (2004). Sulfuricurvum kujiense gen. nov., sp. nov., a facultatively anaerobic, chemolithoautotrophic, sulfur-oxidizing bacterium isolated from an underground crude-oil storage cavity. Int. J. Syst. Evol. Microbiol. 54, 2297–2300. doi:10.1099/ijs.0.63243-0
Kojima, H., and Fukui, M. (2010). Sulfuricella denitrificans gen. nov., sp. nov., a sulfur-oxidizing autotroph isolated from a freshwater lake. Int. J. Syst. Evol. Microbiol. 60, 2862–2866. doi:10.1099/ijs.0.016980-0
Koma, T. (1992). Studies on depositional environments from chemical components of sedimentary rocks-with special reference to sulfur abundance-. Bull. Geol. Surv. Jpn. 43, 473–548.
Korom, S. F. (1992). Natural denitrification in the saturated zone: A review. Water Resour. Res. 28, 1657–1668. doi:10.1029/92wr00252
Lan, L., Zhao, J., Wang, S., Li, X., Qiu, L., Liu, S., et al. (2019). NO and N2O accumulation during nitrite-based sulfide-oxidizing autotrophic denitrification. Bioresour. Tech. Rep. 7, 100190. doi:10.1016/j.biteb.2019.100190
Li, E., Deng, T., Yan, L., Zhou, J., He, Z., Deng, Y., et al. (2021). Elevated nitrate simplifies microbial community compositions and interactions in sulfide-rich river sediments. Sci. Total Environ. 750, 141513. doi:10.1016/j.scitotenv.2020.141513
Lilburne, L., Eger, A., Mudge, P., Ausseil, A.-G., Stevenson, B., Herzig, A., et al. (2020). The Land Resource Circle: Supporting land-use decision making with an ecosystem-service-based framework of soil functions. Geoderma 363, 114134. doi:10.1016/j.geoderma.2019.114134
Liu, C., Li, W., Li, X., Zhao, D., Ma, B., Wang, Y., et al. (2017). Nitrite accumulation in continuous-flow partial autotrophic denitrification reactor using sulfide as electron donor. Bioresour. Tech. 243, 1237–1240. doi:10.1016/j.biortech.2017.07.030
Lovett, G. M., and Goodale, C. L. (2011). A New Conceptual Model of Nitrogen Saturation Based on Experimental Nitrogen Addition to an Oak Forest. Ecosystems 14, 615–631. doi:10.1007/s10021-011-9432-z
Maier, R. M., and Pepper, I. L. (2014). “Chapter3-Bacterial Growth,” in Environmental Microbiology. Editors I. L. Pepper, C. P. Gerba, and T. J. Gentry. Third Edition (Amsterdam: Elsevier), 37–56.
Martínez-Santos, M., Lanzén, A., Unda-Calvo, J., Martín, I., Garbisu, C., and Ruiz-Romera, E. (2018). Treated and untreated wastewater effluents alter river sediment bacterial communities involved in nitrogen and sulphur cycling. Sci. Total Environ. 633, 1051–1061. doi:10.1016/j.scitotenv.2018.03.229
Matsui, S., and Yamamoto, R. (1986). A New Method of Sulphur Denitrification for Sewage Treatment by a Fluidized Bed Reactor. Water Sci. Tech. 18, 355–362. doi:10.2166/wst.1986.0308
Moon, H. S., Ahn, K.-H., Lee, S., Nam, K., and Kim, J. Y. (2004). Use of autotrophic sulfur-oxidizers to remove nitrate from bank filtrate in a permeable reactive barrier system. Environ. Pollut. 129, 499–507. doi:10.1016/j.envpol.2003.11.004
Murano, H., Yamanaka, T., and Mizota, C. (2000). Origin of sulfides and associated sulfates in Neogene sediments along the Kitakami River basin from northeast Japan—Sulfur isotopic characterization and implications for land consolidation. Pedologist 44, 81–90. (in Japanese with English summary). doi:10.18920/pedologist.44.2_81
Oberoi, A. S., Huang, H., Khanal, S. K., Sun, L., and Lu, H. (2021). Electron distribution in sulfur-driven autotrophic denitrification under different electron donor and acceptor feeding schemes. Chem. Eng. J. 404, 126486. doi:10.1016/j.cej.2020.126486
Pan, Y., Ye, L., and Yuan, Z. (2013). Effect of H2S on N2O Reduction and Accumulation during Denitrification by Methanol Utilizing Denitrifiers. Environ. Sci. Technol. 130710143655002, 130710143655002. doi:10.1021/es401632r
Plugge, C. M., Zhang, W., Scholten, J. C. M., and Stams, A. J. M. (2011). Metabolic Flexibility of Sulfate-Reducing Bacteria. Front. Microbio. 2, 81. doi:10.3389/fmicb.2011.00081
Postma, D., Boesen, C., Kristiansen, H., and Larsen, F. (1991). Nitrate Reduction in an Unconfined Sandy Aquifer: Water Chemistry, Reduction Processes, and Geochemical Modeling. Water Resour. Res. 27, 2027–2045. doi:10.1029/91WR00989
Qian, J., Zhou, J., Zhang, Z., Liu, R., and Wang, Q. (2016). Biological Nitrogen Removal through Nitritation Coupled with Thiosulfate-Driven Denitritation. Sci. Rep. 6, 27502. doi:10.1038/srep27502
Qiu, Y.-Y., Zhang, L., Mu, X., Li, G., Guan, X., Hong, J., et al. (2020). Overlooked pathways of denitrification in a sulfur-based denitrification system with organic supplementation. Water Res. 169, 115084. doi:10.1016/j.watres.2019.115084
Roberts, A. P. (2015). Magnetic mineral diagenesis. Earth-Science Rev. 151, 1–47. doi:10.1016/j.earscirev.2015.09.010
Schippers, A., and Jørgensen, B. B. (2002). Biogeochemistry of pyrite and iron sulfide oxidation in marine sediments. Geochimica et Cosmochimica Acta 66, 85–92. doi:10.1016/S0016-7037(01)00745-1
Schwientek, M., Einsiedl, F., Stichler, W., Stögbauer, A., Strauss, H., and Maloszewski, P. (2008). Evidence for denitrification regulated by pyrite oxidation in a heterogeneous porous groundwater system. Chem. Geology. 255, 60–67. doi:10.1016/j.chemgeo.2008.06.005
Shao, M.-F., Zhang, T., and Fang, H. H.-P. (2010). Sulfur-driven autotrophic denitrification: Diversity, biochemistry, and engineering applications. Appl. Microbiol. Biotechnol. 88, 1027–1042. doi:10.1007/s00253-010-2847-1
Shiraishi, T. (1990). Holocene geologic development of the Hachiro-gata lagoon, Akita Prefecture, Northeast Honshu, Japan. Mem. Geol. Soc. Jpn. 36, 47–69. (in Japanese with English summary).
Shiraishi, T., and Matoba, Y. (1992). Neogene paleogeography and paleoenvironment in Akita and Yamagata Prefectures, Japan Sea side of northeast Honshu, Japan. Mem. Geol. Soc. Jpn. 37, 39–51. (in Japanese with English summary).
Straub, K. L., Benz, M., Schink, B., and Widdel, F. (1996). Anaerobic, nitrate-dependent microbial oxidation of ferrous iron. Appl. Environ. Microbiol. 62, 1458–1460. doi:10.1128/aem.62.4.1458-1460.1996
Szynkiewicz, A., Johnson, A. P., and Pratt, L. M. (2012). Sulfur species and biosignatures in Sulphur Springs, Valles Caldera, New Mexico-Implications for Mars astrobiology. Earth Planet. Sci. Lett. 321-322, 1–13. doi:10.1016/j.epsl.2011.12.015
Tiedje, J. M. (1994). “Denitrifiers,” in Methods of Soil Analysis. Part 2. SSSA Book Ser. 5. Editor R. W. Weaver (Madison: Soil Science Society of America), 245–257.
Tong, S., Rodriguez-Gonzalez, L. C., Feng, C., and Ergas, S. J. (2017). Comparison of particulate pyrite autotrophic denitrification (PPAD) and sulfur oxidizing denitrification (SOD) for treatment of nitrified wastewater. Water Sci. Tech. 75, 239–246. doi:10.2166/wst.2016.502
Torrentó, C., Cama, J., Urmeneta, J., Otero, N., and Soler, A. (2010). Denitrification of groundwater with pyrite and Thiobacillus denitrificans. Chem. Geology. 278, 80–91. doi:10.1016/j.chemgeo.2010.09.003
Torrentó, C., Urmeneta, J., Otero, N., Soler, A., Viñas, M., and Cama, J. (2011). Enhanced denitrification in groundwater and sediments from a nitrate-contaminated aquifer after addition of pyrite. Chem. Geology. 287, 90–101. doi:10.1016/j.chemgeo.2011.06.002
Vaclavkova, S., Jørgensen, C. J., Jacobsen, O. S., Aamand, J., and Elberling, B. (2014). The Importance of Microbial Iron Sulfide Oxidation for Nitrate Depletion in Anoxic Danish Sediments. Aquat. Geochem. 20, 419–435. doi:10.1007/s10498-014-9227-x
Vaclavkova, S., Schultz-Jensen, N., Jacobsen, O. S., Elberling, B., and Aamand, J. (2015). Nitrate-Controlled Anaerobic Oxidation of Pyrite byThiobacillusCultures. Geomicrobiology J. 32, 412–419. doi:10.1080/01490451.2014.940633
Velho, V. F., Magnus, B. S., Daudt, G. C., Xavier, J. A., Guimarães, L. B., and Costa, R. H. R. (2017). Effect of COD/N ratio on N2O production during nitrogen removal by aerobic granular sludge. Water Sci. Tech. 76, 3452–3460. doi:10.2166/wst.2017.502
Vitousek, P. M. (1997). Human Domination of Earth's Ecosystems. Science 277, 494–499. doi:10.1126/science.277.5325.494
Wang, J.-J., Xu, L.-Z. -J., Huang, B.-C., Li, J., and Jin, R.-C. (2021). Multiple electron acceptor-mediated sulfur autotrophic denitrification: Nitrogen source competition, long-term performance and microbial community evolution. Bioresour. Tech. 329, 124918. doi:10.1016/j.biortech.2021.124918
Wynn, J. G., Sumrall, J. B., and Onac, B. P. (2010). Sulfur isotopic composition and the source of dissolved sulfur species in thermo-mineral springs of the Cerna Valley, Romania. Chem. Geology. 271, 31–43. doi:10.1016/j.chemgeo.2009.12.009
Yamamoto-Ikemoto, R., Komori, T., Nomuri, M., Ide, Y., and Matsukami, T. (2000). Nitrogen removal from hydroponic culture wastewater by autotrophic denitrification using thiosulfate. Water Sci. Tech. 42, 369–376. doi:10.2166/wst.2000.0405
Yang, W., Zhao, Q., Lu, H., Ding, Z., Meng, L., and Chen, G.-H. (2016). Sulfide-driven autotrophic denitrification significantly reduces N2O emissions. Water Res. 90, 176–184. doi:10.1016/j.watres.2015.12.032
Keywords: sulfur-oxidizing bacteria, ecosystem denitrification, nitrogen cycle, biogeochemistry, sulfur-based denitrification
Citation: Hayakawa A, Ota H, Asano R, Murano H, Ishikawa Y and Takahashi T (2021) Sulfur-Based Denitrification in Streambank Subsoils in a Headwater Catchment Underlain by Marine Sedimentary Rocks in Akita, Japan. Front. Environ. Sci. 9:664488. doi: 10.3389/fenvs.2021.664488
Received: 05 February 2021; Accepted: 23 August 2021;
Published: 07 September 2021.
Edited by:
Muhammad Shaaban, Bahauddin Zakariya University, PakistanReviewed by:
Fan Chen, Harbin Institute of Technology, ChinaXiangyu Xu, Hubei Academy of Agricultural Sciences, China
Copyright © 2021 Hayakawa, Ota, Asano, Murano, Ishikawa and Takahashi. This is an open-access article distributed under the terms of the Creative Commons Attribution License (CC BY). The use, distribution or reproduction in other forums is permitted, provided the original author(s) and the copyright owner(s) are credited and that the original publication in this journal is cited, in accordance with accepted academic practice. No use, distribution or reproduction is permitted which does not comply with these terms.
*Correspondence: Atsushi Hayakawa, aGF5YWthd2FAYWtpdGEtcHUuYWMuanA=