 Chenxia Su
 Ronghua Kang1,2
 Yunting Fang
- 1CAS Key Laboratory of Forest Ecology and Management, Institute of Applied Ecology, Chinese Academy of Sciences, Shenyang, China
- 2Key Laboratory of Isotope Techniques and Applications, Shenyang, China
- 3College of Land and Environment, Shenyang Agricultural University, Shenyang, China
Rainfed agriculture is one of the most common farming practices in the world and is vulnerable to global climate change. However, only limited studies have been conducted on rainfed agriculture, mainly using low-frequency manual techniques, which caused large uncertainties in estimating annual N2O emissions. In this study, we used a fully automated system to continuously measure soil N2O emissions for two years (April 2017 to March 2019) in a typical rainfed maize field in Northeast China. The annual N2O emissions were 2.8 kg N ha−1 in year 1 (April 2017 to March 2018) and 1.8 kg N ha−1 in year 2 (April 2018 to March 2019), accounting for 1.9 and 1.2% of the nitrogen fertilizer applied, respectively. The inter-annual variability was mainly due to different weather conditions encountered in years 1 and 2. A severe drought in year 1 reduced plant N uptake, leaving high mineral N in the soil, and the following moderate rainfalls promoted a large amount of N2O emissions. The seasonal pattern of N2O fluxes was mainly controlled by soil temperature and soil nitrate concentration. Both soil moisture and the molar ratio of NO/N2O indicate that N2O and NO were mainly derived from nitrification, resulting in a significant positive correlation between N2O and NO flux in the intra-rows (where nitrogen fertilizer was applied). Moreover, we observed that the N2O emissions during the freeze–thaw periods were negligible in this region for rainfed agriculture. Our long-term and high-resolution measurements of soil N2O emissions suggest that sampling between LST 9:00 and 10:00 is the best empirical sampling time for the intermittent manual measurements.
Introduction
Nitrous oxide (N2O) is a greenhouse gas, with a lifetime of 120 years in the troposphere and a global warming potential approximately 300 times greater than CO2 over a 100 year scale (Pachauri et al., 2014). N2O was identified as the dominant ozone-depleting substance throughout the 21st century (Ravishankara et al., 2009). The concentration of N2O in the atmosphere increased by more than 20% from 270 ppb in 1750 to 331 ppb in 2018 (Tian et al., 2020). Agricultural soils have been recognized as the largest global source of N2O, accounting for over 50% of the total global N2O emissions, due to the widespread application of nitrogen fertilizers (Pachauri et al., 2014; Shang et al., 2019).
Both soil nitrification and denitrification can produce N2O (Firestone and Davidson, 1989), with denitrification often considered the predominant process of N2O production (Mathieu et al., 2006; Laville et al., 2011). Using the conceptual hole-in-the-pipe (HIP) model (Firestone and Davidson, 1989; Davidson et al., 2000), nitrification is the aerobic oxidation of ammonium (NH4+) via hydroxylamine (NH2OH) to nitrite (NO2−) and nitrate (NO3−), and both N2O and nitric oxide (NO) are byproducts which leak from the pipe; Denitrification is the stepwise anaerobic reduction of NO3− to NO2−, NO, N2O, and N2, which is favored when soils are moist and anaerobic. These microbial processes are strongly affected by natural conditions (e.g., soil available N, temperature, moisture, and soil texture) and agricultural management (Yan et al., 2015; Fentabil et al., 2016; Xia et al., 2017; Zhang et al., 2019). Complex interactions between such factors result in large temporal and spatial variations in N2O emissions from croplands, and therefore, considerable uncertainties exist in the estimations of regional and global agricultural emissions (Bouwman et al., 2002).
Traditional N2O measurements are based on manual techniques with low sampling frequencies of once a few days or weeks (Dorich et al., 2020b; Shang et al., 2020). However, with the high daily temporal variations in N2O emissions (Liu et al., 2010; Laville et al., 2011), low-frequency measurements are unlikely to characterize emissions accurately and lead to uncertainty in the calculations of annual N2O emissions (Barton et al., 2015). In addition, low-frequency manual sampling will miss some N2O high emission periods, such as during N fertilization, irrigation, or rain events (Barton et al., 2008, 2013; Wolf et al., 2010). Additionally, most in-situ N2O measurements only monitor soil N2O emissions during the growing season and ignore the emissions during the non-growing season. Studies have shown that ignoring N2O emissions in the non-growing season will underestimate annual N2O emissions by 30% (Shang et al., 2020). Moreover, the freeze–thaw period is a critical emission period of N2O and may contribute up to 72% of the total annual flux (Wolf et al., 2010; Wagner-Riddle et al., 2017). Therefore, high-frequency and long-term monitoring is crucial for estimating annual N2O emissions.
Northeast China is one of the most important grain producing regions in China, and over 60% of the arable lands are rainfed (http://www.stats.gov.cn). Maize (Zea mays L.) is intensively cultivated in this area (approximately 12 million ha), accounting for over 30% of the national maize planting area in 2019 (data from http://data.stats.gov.cn). The cultivation of maize with its high N requirements (50–374 kg N ha−1) favors microbial activities to produce N2O. To date, limited studies have focused on N2O emissions from these rainfed agricultural soils and have reported a wide range of annual N2O emissions (range from 0.3 to 2.5 kg N ha−1 yr−1, Chen et al., 2002, 2014, 2016; Ni et al., 2012; Dong et al., 2018). We observed that all these studies were based on low-frequency manual techniques which may contribute to the large range of annual N2O emissions. Therefore, using a high-frequency measurement method to understand temporal patterns and major controllers of N2O fluxes from rainfed agricultural soils is required.
In this study, we used a fully automated system to continuously quantify N2O fluxes in a rainfed maize field in Northeast China for two years (from April 2017 to March 2019). Our objectives were a) to characterize diurnal, seasonal, and annual patterns of soil N2O emissions; b) to identify the major drivers of temporal changes in N2O flux; and c) to quantify the contribution of freezing and thawing periods to annual N2O emissions.
Materials and Methods
Experimental Site
The study was carried out at the National Field Observation and Research Station of Shenyang Agro-ecosystems of the Chinese Academy of Sciences, located in the Liaoning Province, Northeast China (41° 31′ N, 123° 22′ E). The mean annual temperature (MAT) is 7.5°C, and the mean annual precipitation (MAP) is 680 mm, with more than 80% precipitation during the crop-growing season (from May to September, Dong et al., 2018). The soil type is silt loam, with 24.1% clay, 59.6% silt, and 16.3% sand. The soil was acidic (pH 5.6 and 0–10 cm). The soil had a total carbon content of 11.3 g kg−1 and total N content of 1.31 g kg−1.
This study was performed over two consecutive years, from April 28, 2017 to March 31, 2019, at a rainfed maize (Zea mays L.) field. The soil was plowed on May 5, 2017 (year 1) and April 25, 2018 (year 2), and seeds were planted in the intra-row on May 7, 2017 and April 28, 2018. Maize plants were harvested on October 7, 2017 and September 24, 2018, respectively, and the maize residues were taken away in both years. In year 1, we reseeded on May 24 due to the failure of germination caused by severe drought. The experimental field received a fertilizer mix of urea and diammonium phosphate (at a 2:1 ratio), which was simultaneously applied within 2 cm of seeds on the intra-row (based on local agricultural management), at a rate of 150 kg N ha−1. The same plot was used for both years and received the same fertilizer treatment.
Measurement of Soil N2O Flux
N2O concentrations were continuously and automatically measured using a static chamber-based method between April 28, 2017 and March 31, 2019. The system used seven opaque chambers (20 cm diameter × 10 cm height), with three chambers placed in the intra-rows, three placed in the inter-rows, and one reference chamber (gas-tight bottom made of Teflon). During the measurement, each chamber was closed twice to measure NO and N2O emissions, respectively. For each chamber, first 6 min was for NO analyzing; gas samples were continuously transported at a flow rate of 0.4 L/min, and concentration of NO was measured at 10 s intervals by a chemiluminescence NO-NO2-NOx analyzer (42i, Thermo Electron Corporation, Waltham, MA, United States). After the NO analysis was finished, the chamber was opened for evacuation for 5 min, to remove any residual gas within the chamber and tubes. Then the same chamber was programmed to close for 20 min to determine the N2O flux. The gas was automatically sampled at three time points (i.e., 0, 10, and 20 min after the chamber closure). The N2O concentration was measured using a gas chromatograph (GC 2014; Shimadzu, Japan) equipped with an electron capture detector. The NO-NO2-NOx analyzer and GC were installed in a temporary cabin next to the study field. Although our automated system simultaneously measured nitric oxide (NO), herein, we only reported N2O data; NO data was presented in another unpublished manuscript. Both N2O and NO measurements for each chamber lasted 36 min. Therefore, the seven-chamber device allowed 40 flux measurements per day or 5 to 6 fluxes per day for each of the seven chambers.
The fluxes of N2O (FN2O, ng N m−2 s−1) were calculated using the following equation:
where
Daily fluxes were calculated as the arithmetic means of the 15 or 18 fluxes obtained from the three replicate chambers (5 or 6 fluxes per chamber per day) for the intra-row and inter-row locations. Estimates of field scale daily emissions were calculated using a weighted average of the spatial distribution of intra-row and inter-row areas. Annual cumulative N2O emissions were calculated using linear interpolation to fill periods with missing data. The ratio of N2O emissions to the fertilizer amount was calculated by the annual cumulative N2O emissions directly divided by N fertilizer amount (150 kg N ha−1).
Auxiliary Field Measurements
In addition to the gas-flux measurements, soil temperature (°C) and moisture (%; volumetric water content, VWC) were monitored at 0–6 cm soil depth using six sensors (Campbell Scientific CS650, North Logan, UT, United States): three in the intra-row and three in the inter-row. The VWCs of the intra-row and inter-row soils were converted into water-filled pore space (WFPS), using the respective bulk density (BD) of 1.17 and 1.25 g cm−3, and a theoretical particle density of 2.65 g cm−3 (
The mineral N concentrations (ammonium and nitrate) of the topsoil (0–10 cm) were separately sampled from intra-row and inter-row soils once a week after fertilization last one month, and bi-weekly to monthly during the remaining sample period. The soil was sieved (2 mm mesh), and 10 g of sieved soil was extracted with 50 ml of 2 M KCl solution. Extracts were frozen at −18°C and later analyzed by a discrete chemistry analyzer (Smartchem 200, Westco Scientific Instruments, Inc., Italy). The obtained values (mg N L−1) were converted to soil dry weight basis (mg N kg−1 soil).
Data Analysis
Statistical analyses were implemented using R, version 3.6.3 (R Core Team, 2019) and RStudio (version February 1, 5033). Graphics were implemented using both RStudio and Origin 9. The differences in the soil temperature, moisture, temperature and mineral N concentration between inter-rows and intra-rows were tested using a one-way ANOVA. A nonlinear or linear regression analysis was used to explore the relationship between soil N2O fluxes and environmental factors (e.g., soil temperature, moisture, and mineral N concentration). A significance level of P < 0.05 was used for all data analyses.
Results
Environmental Parameters
The annual precipitation was 439 and 642 mm in the first and second measurement years, respectively. This difference was largely due to the rainfall in the first 30 days following fertilization, with 13 mm in year 1 and 150 mm in year 2 (Figure 1A). The mean WFPS in the intra-rows during the growing season was 28 ± 12% WFPS in year 1, significantly lower than that in year 2 (31 ± 15% WFPS). The temporal pattern of soil moisture in the inter-rows was similar to the intra-rows but was significantly wetter (Figure 1B). The mean annual soil temperatures for the intra-rows were 9.7°C in year 1 and 9.1°C in year 2. There was no significant temperature difference between the rows and inter-rows (Figure 1C).
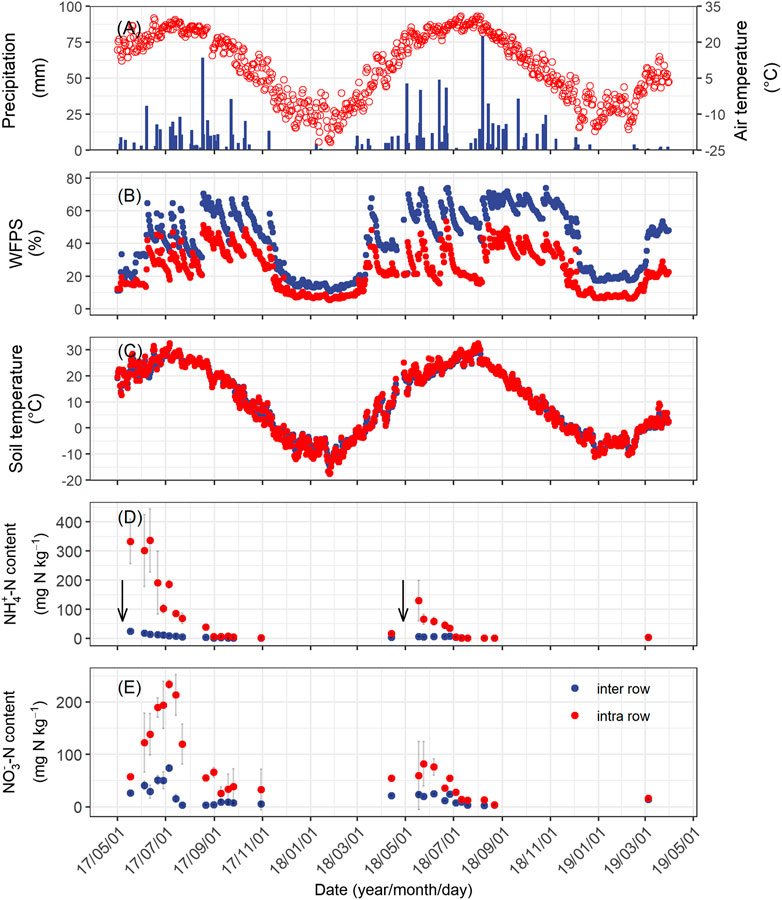
FIGURE 1. Seasonal changes in mean daily air temperature and daily precipitation (A), daily mean soil temperature (B), and moisture (C) at a depth of 5 cm; concentration of ammonium (D), and nitrate (E) at a depth of 0–10 cm soil of the intra-row and inter-row soils from April 2017 to March 2019. Error bars indicate standard errors. The downward arrows represent the time of fertilization.
Soil NH4+–N concentration in the intra-row increased markedly following fertilization on May 7, 2017 and April 28, 2018 (Figure 1D). In year 1, the NH4+–N concentration increased to 333 mg N kg−1 immediately following fertilizer application and remained at that level for approximately a month. After precipitation in early June, the NH4+–N concentration started to decrease, but still averaged 232 and 113 mg N kg−1 in June and July, respectively. In year 2, the NH4+–N concentration also increased following fertilization but reached a considerably lower level (120 mg N kg−1) compared to year 1. Then, it decreased gradually to only 2 mg N kg−1 in mid-July and remained at that level in the remaining months (Figure 1D). The NO3−–N concentration increased following the decrease in NH4+–N (Figure 1D–E). The peak concentration of NO3−–N concentration in both years was significantly lower than NH4+–N concentrations (234 mg N kg−1 on July 5, 2017 and 80 mg N kg−1 on May 24, 2018). In the inter-row, where no fertilizer had been applied, the mineral N concentrations were considerably lower than those in the intra-rows. In year 1, the mineral N concentrations showed a small pulse following fertilization, with NH4+–N concentration increasing to 25 mg N kg−1 and NO3−–N concentration increasing to 70 mg N kg−1 in the inter-row soils before immediately decreasing below 10 mg N kg−1 (Figure 1D–E).
Temporal Patterns of N2O Fluxes
We observed pronounced seasonal variations in N2O emissions during both measurement years (Figure 2), being highest after fertilizer application in summer and lowest in winter. Daily N2O fluxes from the intra-rows also exhibited large interannual variation (Figure 2), despite the application of the same amount of fertilizer. Mean daily N2O fluxes (ng N m−2 s−1) ranged from 1.4 to 122.1 (averaged 23.8 ± 3.2) in year 1, and −3.8 to 53.1 (averaged 10.0 ± 1.6) in year 2. In year 1, the peak N2O emission in the intra-row (122.1 ng N m−2 s−1, Figure 2) occurred on July 16, approximately two months following the fertilization, and the highest flux (35 ng N m−2 s−1) in year 2 appeared on May 30, approximately one month following fertilization (Figure 2). The high emission period in the intra-row following N application lasted approximately three months (from June to August) in year 1 and two months (May to June) in year 2. The average N2O fluxes from the inter-rows were 10.5 ± 1.6 ng N m−2 s−1 in year 1 and 7.3 ± 1.1 ng N m−2 s−1 in year 2; both were significantly lower than those from the intra-rows. In both years, we found no increase in N2O fluxes during the spring freeze–thaw period (Supplementary Figure S1).
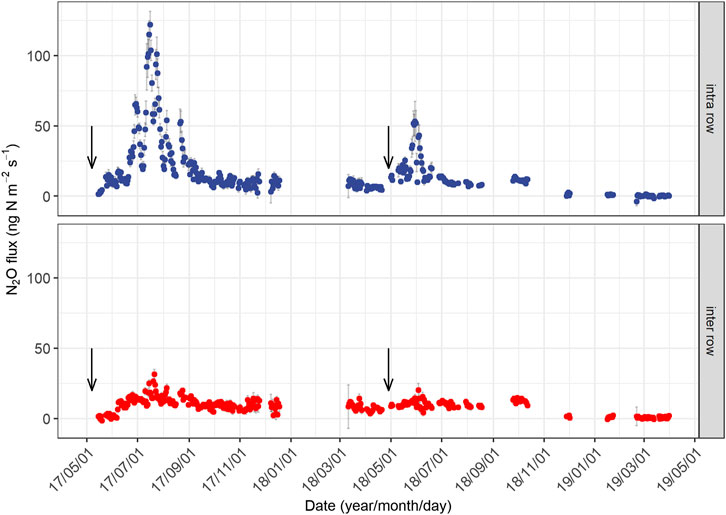
FIGURE 2. Seasonal changes in daily mean N2O fluxes from the intra-row and inter-row soils in two years. The downward arrows represent the time of fertilization. The period without data is because of equipment failure. Error bars indicate standard errors.
The cumulative annual N2O emissions in year 1 were 2.8 kg N ha−1, which was approximately 1.6 times higher than that in year 2 (1.8 kg N ha−1), accounting for 1.9 and 1.2% of the applied N fertilizer (150 kg N ha−1 yr−1). Approximately 70% of the difference in annual N2O emissions can be attributed to the different accumulated emissions from July and August (Supplementary Figure S2), when soils produced 1.5 kg N ha−1 in year 1 and 0.8 kg N ha−1 in year 2. N2O emissions during the non-growing season (November to March) contributed to 23.2% of the annual N2O emissions in year 1 and 9.7% in year 2.
For the diurnal cycles of N2O flux, we only observed clear diurnal patterns from intra-rows during the growing season, which correlated well with the changes in soil temperature (Figure 3). We found that sampling at LST (local standard time) 9:00–10:00 or 18:00–19:00 best represented the daily average N2O emissions in this area.
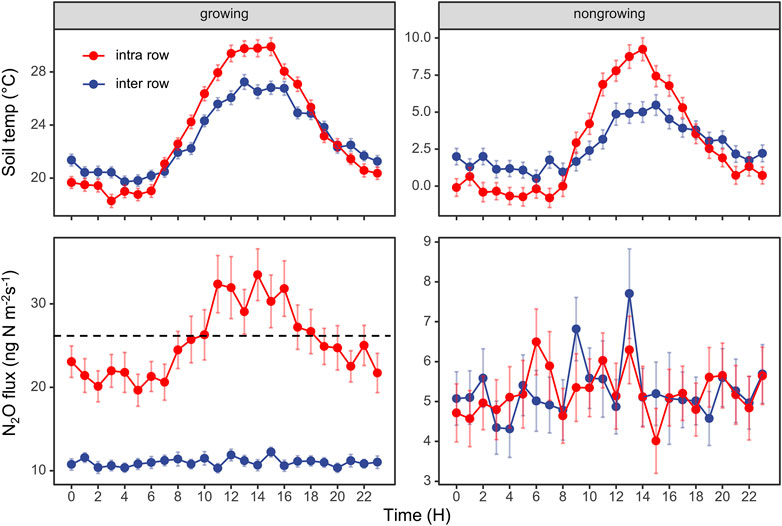
FIGURE 3. Diurnal variations in N2O fluxes and soil temperature at 5 cm depth. The data are average values aggregated for different times of the day, using the entire dataset from the intra-row and inter-row locations in growing season and nongrowing season. The dashed line represents the daily average of soil N2O fluxes. Error bars indicate standard errors.
We simultaneously measured NO flux; detailed analysis is provided in another unpublished manuscript; however, herein, we only present the daily molar ratio of NO and N2O fluxes (Figure 4). In the intra-rows (with high mineral N concentration and low soil moisture), the NO/N2O ratio >1 prevailed for 97 and 56% of the measured fluxes during the growing season in year 1 and year 2, respectively, (Figure 4). The NO emission was over 10 times greater than N2O emissions during the peak emission period, especially in year 1 (May to August), and the ratio began to decline when the NH4+–N concentration approached 0 mg N kg−1. The ratios in the inter-rows (with high soil moisture and low mineral N concentration) were usually less than one (Figure 4), with NO/N2O < 1 accounting for 60% of the measurements in year 1 and 84% in year 2. However, from April 28 to mid-June in year 1, when the inter-row soil moisture was very low (from 15 to 30% WFPS), the NO/N2O ratios were >1 (Figure 4).
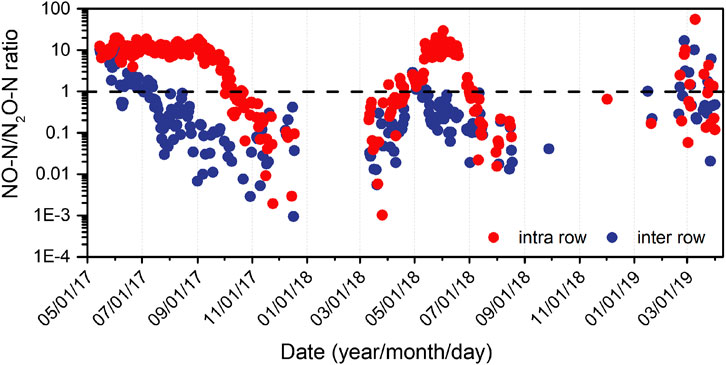
FIGURE 4. Seasonal changes in the molar ratio between NO to N2O fluxes from intra-row and inter-row soils in two years.
Figure 5 shows the relationship between N2O and NO fluxes from intra-rows and inter-rows during the growing and non-growing seasons. We found that there was a significant linear correlation between N2O and NO fluxes from intra-rows during the growing season, and the R2 reached 0.88. No significant relationships were found in the non-growing season (Figure 5).
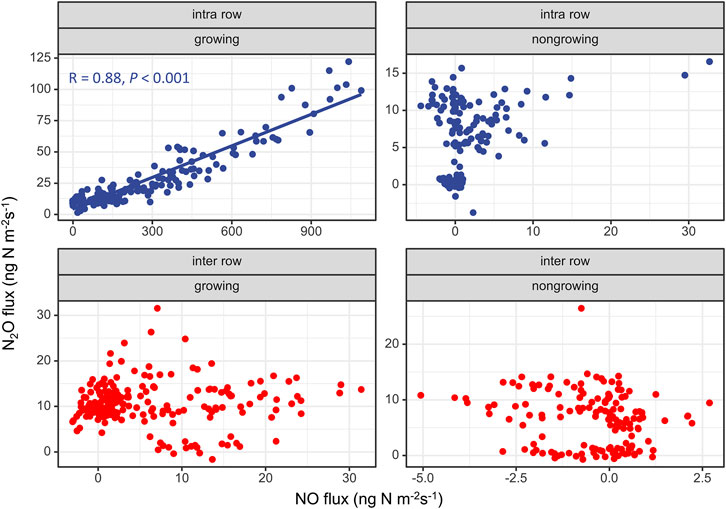
FIGURE 5. Correlations between N2O and NO fluxes.
Relationship of N2O Fluxes with Temperature, Soil Mineral N Concentration, and Moisture.
In this study, we divided the entire observation period into three periods: the growing season (May to September), non-growing season (October to February), and freeze–thaw period (March), to analyze the correlation between soil N2O flux and soil temperature or moisture (Figure 6, Supplementary Figure S3). The results showed that for the intra-rows, soil N2O fluxes were significantly and exponentially correlated with soil temperature during the growing seasons in both years and during the non-growing season in year 2 (Figure 6). For the inter-rows, the N2O fluxes are significantly correlated with the soil temperature during the growing season in year 1 and the non-growing season in year 2 (Figure 6). There were no significant relationships between N2O fluxes and soil temperature during the two-year freeze–thaw periods. No significant correlation between N2O flux and soil moisture were observed (Supplementary Figure S3), and the optimum moistures for N2O production were 25–30% WFPS in the intra-rows and 50–60% WFPS in the inter-rows during growing season in both measurement years (Supplementary Figure S3).
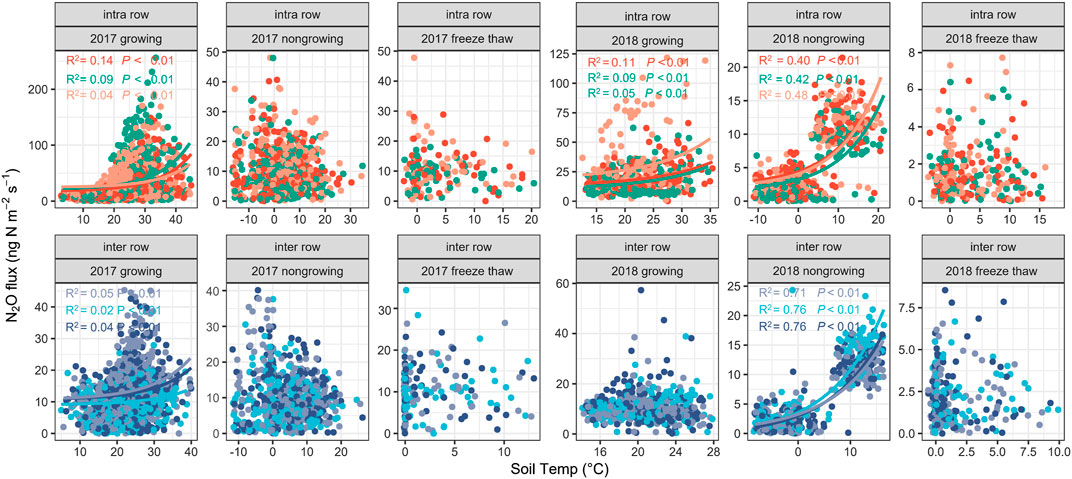
FIGURE 6. Correlations of N2O fluxes with soil temperature at 5 cm depth. Different dot colors indicate N2O fluxes from different chambers.
For soil available N, a positive and significant linear relationship with N2O fluxes was only found against NO3−–N in the intra-rows, and no significant correlation was found with NH4+–N for both intra-rows and inter-rows (Figure 7).
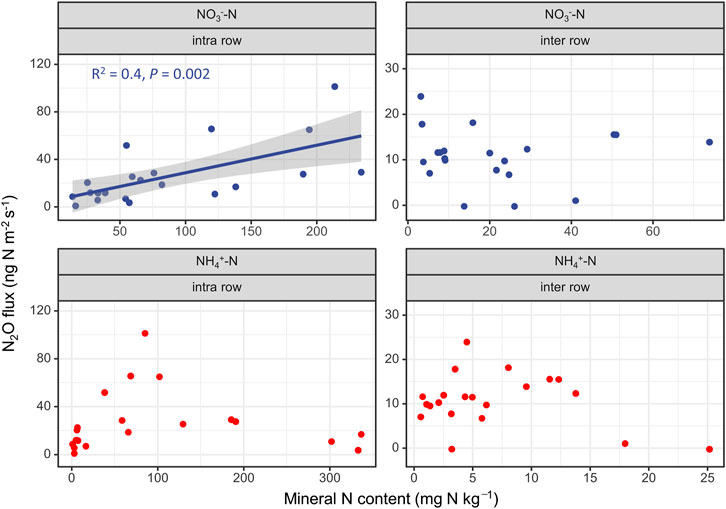
FIGURE 7. Correlations between N2O fluxes and mineral N content (NH4+–N and NO3−–N).
Discussion
Annual N2O Emissions
We monitored soil N2O fluxes based on an automatic and continuous method over two years for a rainfed maize field in Northeast China. The cumulative N2O emission in year 1 and year 2 was 2.8 and 1.8 kg N ha−1, respectively, which were comparable to another multiyear measurement obtained at the same field station (ranging from 0.3 to 2.5 kg N ha−1, Dong et al., 2018). However, it is higher than the N2O emission (0.1–0.6 kg N ha−1) reported by Ni et al. (2012) from another maize field in Northeast China, which may be attributed to their short-term monitoring (only measured the growing season). Shang et al. (2020) summarized more than 20 studies which monitored N2O emissions in-situ and found that ignoring N2O emissions in the non-growing season would lead to an underestimation of annual N2O emissions by 10–30%. Therefore, the measurement of N2O emissions over an entire year is essential to accurately estimate annual N2O emissions. In addition, our annual N2O emissions were considerably lower than those in the report of Gagnon et al. (2011), from a maize field in Canada (ranging from 4.6 to 22.8 kg N ha−1), which used the same type and amount of nitrogen fertilizer as in this study. Notably, the soil in Gagnon’s report was poorly drained, and the soil organic matter (SOC = 4.6%) was significantly higher than that in our study (1.1%), which may easily form an anaerobic environment and provide sufficient carbon to promote denitrification and produce more N2O (Stehfest and Bouwman, 2006; Dong et al., 2018).
The N2O emission factors (EF, in %) is defined as the N2O emission from fertilized treatment minus the emission from unfertilized control treatment expressed as a percentage of the N applied (Eggleston et al., 2006). However, our study had no unfertilized control treatments, neglecting background N2O emissions, the annual N2O emissions accounted for 1.9 and 1.2% of the fertilizer amount (150 kg N ha−1) in years 1 and 2, respectively. We assume that the N2O emissions from inter-rows (without fertilization) can be used as background N2O emissions, and their annual emissions for the two years were 1.9 and 0.9 kg N ha−1, respectively. Thus, the estimated EF–N2O for both years was 0.6%, which corresponds with other studies from rainfed maize fields in Northeast China (0.3–1.1%, Ni et al., 2012; Guo et al., 2013; Chen et al., 2014; Dong et al., 2018). However, this estimation might be conservative, due to the relatively high soil moisture of the inter-rows. The EF–N2O values of these rainfed agricultural soils were lower than those of irrigated agricultural soils. For example, McSwiney and Robertson (2005) monitored N2O emissions from irrigated maize fields for three years, and the EF–N2O values ranged from 2 to 7%. Liu et al. (2011) also reported an EF–N2O value of 2% from an irrigated maize field. A review by Aguilera et al. (2013) found that N2O emissions from rainfed agriculture were one order of magnitude lower than those from conventional irrigated fields in the Mediterranean climate cropping system. One of the main reasons is that the low precipitation and soil moisture in rainfed agricultural soil suppresses N2O production (Ni et al., 2012; Dong et al., 2018).
The cumulative annual N2O emission in year 1 (2.8 kg N ha−1) was considerably higher than in year 2 (1.8 kg N ha−1). Although the precipitation in the second year (634 mm) was more than that in the first year (439 mm). However, the severe drought before and after fertilization in the first year reduced the plants N uptake (maize emergence and extension was notably delayed in year 1), resulting in substantial levels of nitrogen remaining in soil, and the soil mineral N concentration (NH4+–N + NO3−–N) reached 460 mg N kg−1 in mid-May to early June in year 1, approximately three times higher than the highest soil N concentration in year 2 (Figures 1D–E). After the precipitation in early June, the mineral N concentration started to decrease but remained above 30 mg N kg−1 until late September. An extended period of high soil N concentrations in year 1 extended the window of N2O emissions (Figure 2), resulting in higher N2O emissions in year 1 than in year 2.
Microbial Processes Responsible for N2O Productions
We suggest that N2O emissions from the intra-rows were mainly attributed to nitrification, and the inter-row process was more complicated. First, the soil moisture of intra-rows was lower than 60% WFPS during the growing season (averaged 30 ± 10%, range from 12 to 53% WFPS), suggesting that nitrification would be dominant (Davidson, 1993; Bateman and Baggs, 2005; Pilegaard, 2013); the soil moisture of the inter-rows exhibited a wide range (from 10 to 75% WFPS), suggesting that both nitrification and denitrification processes may occur. Second, the molar ratio of NO/N2O has been used as a useful indicator for evaluating the contribution of nitrification (NO/N2O > 1) and denitrification (NO/N2O < 1; Anderson and Levine, 1986; Skiba et al., 1993; Davidson et al., 2000; Zhang et al., 2011). In the intra-rows, during the high emission period in year 1 (June to September) and year 2 (May to June), over 90% of the NO/N2O ratios were higher than one (Figure 4), suggesting that nitrification was dominant, and the soil NO/N2O ratio of the inter-rows was mostly less than 1 (80%), indicating that denitrification was dominant (Figure 4).
Surprisingly, we found a significant positive correlation between the NO and N2O emission rates from the intra-rows during the growing season (Figure 5), indicating that NO and N2O were produced by similar processes and controlled by similar environmental factors. In other words, when nitrification dominated NO and N2O production, their fluxes were significantly positively correlated. Similar results were also revealed by Ding et al. (2007) from a lab incubation experiment. This finding will aid building models to predict NO emissions (which is a reactive nitrogen gas and less in-situ measurements) based on N2O in-situ measurements (Dorich et al., 2020a). For the inter-rows, both nitrification and denitrification can occur, and there was no significant linear relationship between NO and N2O emissions.
N2O Emissions During the Freeze–Thaw Period
Many studies reported that soil freeze–thaw cycles promote N2O emissions, contributing 17–85% of the annual N2O emissions (Yanai et al., 2011; Abalos et al., 2016; Wagner-Riddle et al., 2017; Gao et al., 2018). Several hypotheses may explain the increase in N2O emissions during this period: 1) enhanced available C and N substrates due to the physical cracking of soil aggregates and the nutrients from the microbial community that died during winter freeze (de et al., 2009; Wolf et al., 2010); 2) increased soil moisture which formed an anaerobic environment and increased denitrifier activities (Priemé and Christensen, 2001; Teepe et al., 2001; Congreves et al., 2018). Several studies have observed that clay soil with high organic carbon content more easily produces high N2O emissions during the freeze–thaw period (Van et al., 2000; Müller et al., 2003; Groenevelt and Grant, 2013; Wang et al., 2014). Dong et al. (2018) found that the N2O pulses during freeze–thaw cycles are also related to the precipitation and depth of snow cover during the non-growing season. However, in our study, we found that there was no significant increase in N2O emissions during the freeze–thaw period in both years. The main reasons were 1) our study located in a temperate semi-humid continental monsoon climate with little snowfall episode in winter, leading to insufficient anaerobic conditions during the freeze-thaw period, which inhibits denitrification to occur; 2) the SOC is low (1.1 g C kg−1) in our study site and cannot provide sufficient carbon substrate for denitrification; and 3) the soil clay content is low (24.1%). Chen et al. (2014) also found that the contribution of the soil freeze–thaw period to annual N2O emissions from rainfed agriculture in Northeast China is negligible.
Impacts of Sampling Frequency and Time on Estimating Cumulative N2O Emissions
Most in-situ N2O measurements are still carried out by manual sampling, repeated usually in the intervals of days to weeks, and are in turn integrated across time to calculate annual losses. Such low-frequency measurements over or underestimate annual emission budgets (Liu et al., 2010). Barton et al. (2015) suggested that automated chambers should be continuously used to build guidelines for manual sampling. Here, we assume that the temporal coverage of manual flux measurements is daily, weekly, biweekly, and monthly, to analyze the influence of sampling frequency on calculating cumulative N2O emissions from May to October in 2017. The subset is the N2O flux between 09:00 and 12:00 extracted from our hourly measurements (similar to previous studies, e.g., Zhao et al., 2015; Guardia et al., 2017; Dong et al., 2018, 2018; Yao et al., 2019). Figure 8 shows that, compared with the high-resolution continuous measurements (5 times a day), low sampling frequencies can overestimate N2O emissions by 8–49% (Figure 8). Therefore, sampling between 09:00 and 12:00 with low-frequency manual measurements can lead to considerable uncertainties in quantifying annual emissions.
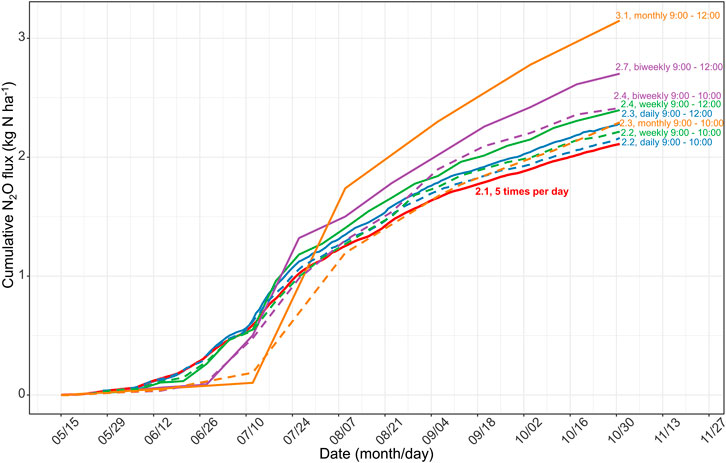
FIGURE 8. Difference in the estimated N2O emission during growing season (May to October) in 2017, due to different sample frequency (daily, weekly, biweekly, and monthly intervals presented in different colors) at the different sampling time (LST 09:00 to 12:00 presented in solid lines and LST 09:00 to 10:00 in dashed lines). The solid line in red represents the scenario with 5 measurements per day as mentioned in the present study. The numbers indicate the amounts of cumulative N2O emissions.
Previous studies reported that sampling at LST 08:15 (Laville et al., 2011) or 09:00 (Liu et al., 2010) best represented the daily average of N2O emissions; however, the best sampling time requires investigation across a broader range of land uses and climates (Smith and Dobbie, 2001; Barton et al., 2015). Here, we intended to reveal the best sampling time during the day for rainfed agriculture in our study region of Northeast China. After aggregating the entire dataset, Figure 3 shows that sampling at LST 9:00 to 10:00 am or 18:00 to 17:00 pm best represents the daily mean N2O flux. We then calculated the cumulative N2O emission sampling from 9:00 to 10:00 at daily, weekly, biweekly, and monthly intervals. We found that the deviations ranged from +2% to +9% (“+” indicated overestimations), which was considerably smaller than the deviation when sampling was performed between 9:00 and 12:00 (Figure 8). Therefore, we suggest that sampling between 9:00 and 10:00 is the best empirical sampling time for the intermittent manual measurements of N2O emissions in our study region. High-frequency flux measurements enabled us to identify the diurnal pattern and highlight the effect of sampling frequency and sampling time on N2O flux balance and provide guidance for low-frequency manual sampling.
Data Availability Statement
The original contributions presented in the study are included in the article/Supplementary Material, further inquiries can be directed to the corresponding author.
Author Contributions
CS, YF, and WH contributed to the conception and design of the study. CS, RK, and YF organized the database. CS wrote the first draft of the manuscript. All authors contributed to manuscript revision, read, and approved the submitted version.
Funding
This research was financially supported by the National Key Research and Development Program of China (grant no. 2017YFC0212700, grant no. 2016YFA0600802), the Key Research Program of Frontier Sciences of Chinese Academy of Sciences (grant no. QYZDB-SSWDQC002), the National Natural Science Foundation of China (grant no. 41773094).
Conflict of Interest
The authors declare that the research was conducted in the absence of any commercial or financial relationships that could be construed as a potential conflict of interest.
Acknowledgments
We are grateful to Xin Chen, Yi Shi and Caiyan Lu for their helpful comments and suggestions during the field measurements. We are grateful to the Shenyang Ecological Experimental Station, Chinese Academy of Sciences, for providing the experimental field and the meteorological data.
Supplementary Material
The Supplementary Material for this article can be found online at: https://www.frontiersin.org/articles/10.3389/fenvs.2021.668084/full#supplementary-material.
References
Abalos, D., Brown, S. E., Vanderzaag, A. C., Gordon, R. J., Dunfield, K. E., and Wagner-Riddle, C. (2016). Micrometeorological Measurements over 3 Years Reveal Differences in N2O Emissions between Annual and Perennial Crops. Glob. Change Biol. 22, 1244–1255. doi:10.1111/gcb.13137
Aguilera, E., Lassaletta, L., Sanz-Cobena, A., Garnier, J., and Vallejo, A. (2013). The Potential of Organic Fertilizers and Water Management to Reduce N2O Emissions in Mediterranean Climate Cropping Systems. A Review. Agric. Ecosyst. Environ. 164, 32–52. doi:10.1016/j.agee.2012.09.006
Anderson, I. C., and Levine, J. S. (1986). Relative Rates of Nitric Oxide and Nitrous Oxide Production by Nitrifiers, Denitrifiers, and Nitrate Respirers. Appl. Environ. Microbiol. 51, 938–945. doi:10.1128/aem.51.5.938-945.1986
Barton, L., Gleeson, D. B., Maccarone, L. D., Zúñiga, L. P., and Murphy, D. V. (2013). Is Liming Soil a Strategy for Mitigating Nitrous Oxide Emissions from Semi-arid Soils?. Soil Biol. Biochem. 62, 28–35. doi:10.1016/j.soilbio.2013.02.014
Barton, L., Kiese, R., Gatter, D., Butterbach-bahl, K., Buck, R., Hinz, C., et al. (2008). Nitrous Oxide Emissions from a Cropped Soil in a Semi-arid Climate. Glob. Change Biol. 14, 177–192. doi:10.1111/j.1365-2486.2007.01474.x
Barton, L., Wolf, B., Rowlings, D., Scheer, C., Kiese, R., Grace, P., et al. (2015). Sampling Frequency Affects Estimates of Annual Nitrous Oxide Fluxes. Scientific Rep. 5, 15912. doi:10.1038/srep15912
Bateman, E. J., and Baggs, E. M. (2005). Contributions of Nitrification and Denitrification to N2O Emissions from Soils at Different Water-Filled Pore Space. Biol. Fertil. Soils 41, 379–388. doi:10.1007/s00374-005-0858-3
Bouwman, A. F., Boumans, L. J. M., and Batjes, N. H. (2002). Modeling Global Annual N2O and NO Emissions from Fertilized Fields. Glob. Biogeochem. Cycles 16, 1080. doi:10.1029/2001gb001812
Chen, X., Cabrera, M. L., Zhang, L., Wu, J., Shi, Y., Yu, W. T., et al. (2002). Nitrous Oxide Emission from Upland Crops and Crop-Soil Systems in Northeastern China. Nutrient Cycling in Agroecosystems 62, 241–247. doi:10.1023/A:1021202114354
Chen, Z., Ding, W., Luo, Y., Yu, H., Xu, Y., Müller, C., et al. (2014). Nitrous Oxide Emissions from Cultivated Black Soil: A Case Study in Northeast China and Global Estimates Using Empirical Model. Glob. Biogeochem. Cycles 28, 1311–1326. doi:10.1002/2014gb004871
Chen, Z., Ding, W., Xu, Y., Müller, C., Yu, H., and Fan, J. (2016). Increased N2O Emissions during Soil Drying after Waterlogging and Spring Thaw in a Record Wet Year. Soil Biol. Biochem. 101, 152–164. doi:10.1016/j.soilbio.2016.07.016
Congreves, K. A., Wagner-Riddle, C., Si, B. C., and Clough, T. J. (2018). Nitrous Oxide Emissions and Biogeochemical Responses to Soil Freezing-Thawing and Drying-Wetting. Soil Biol. Biochem. 117, 5–15. doi:10.1016/j.soilbio.2017.10.040
Davidson, E. A., Keller, M., Erickson, H. E., Verchot, L. V., and Veldkamp, E. (2000). Testing a Conceptual Model of Soil Emissions of Nitrous and Nitric Oxides. BioScience 50, 667–680. doi:10.1641/0006-3568(2000)050[0667:tacmos]2.0.co;2
Davidson, E. A. (1993). “Soil Water Content and the Ratio of Nitrous Oxide to Nitric Oxide Emitted from Soil,” Biogeochemistry of Global Change: Radiatively Active Trace Gases Selected Papers from the Tenth International Symposium on Environmental Biogeochemistry, San Francisco, August 19–24, 1991. Editor R. S. Oremland (Boston, MA: Springer US), 369–386. doi:10.1007/978-1-4615-2812-8_20
de, B. A, Butterbach-Bahl, K., Blagodatsky, S., and Grote, R. (2009). Model evaluation of different mechanisms driving freeze–thaw N2O emissions. Agric. Ecosyst. & Environ. 133, 196–207. doi:10.1016/j.agee.2009.04.023
Ding, W., Yagi, K., Akiyama, H., Sudo, S., and Nishimura, S. (2007). Time-lagged Induction of N2O Emission and its Trade-Off with NO Emission from a Nitrogen Fertilized Andisol. Soil Sci. Plant Nutr. 53, 362–372. doi:10.1111/j.1747-0765.2007.00152.x
Dong, D., Kou, Y., Yang, W., Chen, G., and Xu, H. (2018). Effects of Urease and Nitrification Inhibitors on Nitrous Oxide Emissions and Nitrifying/denitrifying Microbial Communities in a Rainfed Maize Soil: A 6-year Field Observation. Soil Tillage Res. 180, 82–90. doi:10.1016/j.still.2018.02.010
Dorich, C. D., Conant, R. T., Albanito, F., Butterbach-Bahl, K., Grace, P., Scheer, C., et al. (2020a). Improving N2O Emission Estimates with the Global N2O Database. Curr. Opin. Environ. Sustainability 47, 13–20. doi:10.1016/j.cosust.2020.04.006
Dorich, C. D., De Rosa, D., Barton, L., Grace, P., Rowlings, D., Migliorati, M. D. A., et al. (2020b). Global Research Alliance N 2 O Chamber Methodology Guidelines: Guidelines for Gap‐filling Missing Measurements. J. Environ. Qual. 49, 1186–1202. doi:10.1002/jeq2.20138
Eggleston, H. S., Buendia, L., Miwa, K., Ngara, T., and Tanabe, K. (2006). 2006 IPCC Guidelines for National Greenhouse Gas Inventories. (Kanagawa, Japan: IGES). Available at: https://www.osti.gov/etdeweb/biblio/20880391.
Fentabil, M. M., Nichol, C. F., Neilsen, G. H., Hannam, K. D., Neilsen, D., Forge, T. A., et al. (2016). Effect of Micro-irrigation Type, N-Source and Mulching on Nitrous Oxide Emissions in a Semi-arid Climate: An Assessment across Two Years in a Merlot Grape Vineyard. Agric. Water Management 171, 49–62. doi:10.1016/j.agwat.2016.02.021
Firestone, M. K., and Davidson, E. A. (1989). Microbiological Basis of NO and N2O Production and Consumption in Soil. Exchange Trace Gases between terrestrial Ecosyst. Atmosphere 47, 7–21.
Gagnon, B., Ziadi, N., Rochette, P., Chantigny, M. H., and Angers, D. A. (2011). Fertilizer Source Influenced Nitrous Oxide Emissions from a Clay Soil under Corn. Soil Sci. Soc. Am. J. 75, 595–604. doi:10.2136/sssaj2010.0212
Gao, D., Zhang, L., Liu, J., Peng, B., Fan, Z., Dai, W., et al. (2018). Responses of Terrestrial Nitrogen Pools and Dynamics to Different Patterns of Freeze-Thaw Cycle: A Meta-Analysis. Glob. Change Biol. 24, 2377–2389. doi:10.1111/gcb.14010
Groenevelt, P. H., and Grant, C. D. (2013). Heave and Heaving Pressure in Freezing Soils: A Unifying Theory. Vadose Zone J. 12. doi:10.2136/vzj2012.0051
Guardia, G., Cangani, M. T., Andreu, G., Sanz-Cobena, A., García-Marco, S., Álvarez, J. M., et al. (2017). Effect of Inhibitors and Fertigation Strategies on GHG Emissions, NO Fluxes and Yield in Irrigated Maize. Field Crops Res. 204, 135–145. doi:10.1016/j.fcr.2017.01.009
Guo, Y., Luo, L., Chen, G., Kou, Y., and Xu, H. (2013). Mitigating Nitrous Oxide Emissions from a Maize-Cropping Black Soil in Northeast China by a Combination of Reducing Chemical N Fertilizer Application and Applying Manure in Autumn. Soil Sci. Plant Nutr. 59, 392–402. doi:10.1080/00380768.2013.775006
Laville, P., Lehuger, S., Loubet, B., Chaumartin, F., and Cellier, P. (2011). Effect of Management, Climate and Soil Conditions on N2O and NO Emissions from an Arable Crop Rotation Using High Temporal Resolution Measurements. Agric. For. Meteorology 151, 228–240. doi:10.1016/j.agrformet.2010.10.008
Liu, C., Wang, K., Meng, S., Zheng, X., Zhou, Z., Han, S., et al. (2011). Effects of Irrigation, Fertilization and Crop Straw Management on Nitrous Oxide and Nitric Oxide Emissions from a Wheat-Maize Rotation Field in Northern China. Agric. Ecosyst. Environ. 140, 226–233. doi:10.1016/j.agee.2010.12.009
Liu, C., Zheng, X., Zhou, Z., Han, S., Wang, Y., Wang, K., et al. (2010). Nitrous Oxide and Nitric Oxide Emissions from an Irrigated Cotton Field in Northern China. Plant Soil 332, 123–134. doi:10.1007/s11104-009-0278-5
Mathieu, O., Hénault, C., Lévêque, J., Baujard, E., Milloux, M.-J., and Andreux, F. (2006). Quantifying the Contribution of Nitrification and Denitrification to the Nitrous Oxide Flux Using 15N Tracers. Environ. Pollut. 144, 933–940. doi:10.1016/j.envpol.2006.02.005
McSwiney, C. P., and Robertson, G. P. (2005). Nonlinear Response of N2O Flux to Incremental Fertilizer Addition in a Continuous Maize (Zea mays L.) Cropping System. Glob. Change Biol. 11, 1712–1719. doi:10.1111/j.1365-2486.2005.01040.x
Müller, C., Kammann, C., Ottow, J. C. G., and Jäger, H.-J. (2003). Nitrous Oxide Emission from Frozen Grassland Soil and during Thawing Periods. J. Plant Nutr. Soil Sci. 166, 46–53. doi:10.1002/jpln.200390011
Ni, K., Ding, W., Zaman, M., Cai, Z., Wang, Y., Zhang, X., et al. (2012). Nitrous Oxide Emissions from a Rainfed-Cultivated Black Soil in Northeast China: Effect of Fertilization and Maize Crop. Biol. Fertil. Soils 48, 973–979. doi:10.1007/s00374-012-0709-y
Pachauri, R. K., Allen, M. R., Barros, V. R., Broome, J., Cramer, W., Christ, R., et al. (2014). “Climate Change 2014: Synthesis Report,” in Contribution of Working Groups I, II and III to the Fifth Assessment Report of the Intergovernmental Panel on Climate Change. Editors R. K. Pachauri, and L. Meyer, Available at: https://epic.awi.de/id/eprint/37530/.
Pilegaard, K. (2013). Processes Regulating Nitric Oxide Emissions from Soils. Phil. Trans. R. Soc. B 368, 20130126. doi:10.1098/rstb.2013.0126
Priemé, A., and Christensen, S. (2001). Natural Perturbations, Drying-Wetting and Freezing-Thawing Cycles, and the Emission of Nitrous Oxide, Carbon Dioxide and Methane from Farmed Organic Soils. Soil Biol. Biochem. 33, 2083–2091. doi:10.1016/s0038-0717(01)00140-7
Ravishankara, Daniel., Daniel, J. S., and Portmann, J. S. (2009). Nitrous Oxide (N2O): The Dominant Ozone-Depleting Substance Emitted in the 21st Century. 326, 4.doi:10.1126/science.1176985
Shang, Z., Abdalla, M., Kuhnert, M., Albanito, F., Zhou, F., Xia, L., et al. (2020). Measurement of N2O Emissions over the Whole Year Is Necessary for Estimating Reliable Emission Factors. Environ. Pollut. 259, 113864. doi:10.1016/j.envpol.2019.113864
Shang, Z., Zhou, F., Smith, P., Saikawa, E., Ciais, P., Chang, J., et al. (2019). Weakened Growth of cropland‐N 2 O Emissions in China Associated with Nationwide Policy Interventions. Glob. Change Biol. 25, 3706–3719. doi:10.1111/gcb.14741
Skiba, U., Smith, K. A., and fowler, D. (1993). Nitrification and Denitrification as Sources of Nitric Oxide and Nitrous Oxide in a Sandy Loam Soil. Soil Biol. Biochem. 25, 1527–1536. doi:10.1016/0038-0717(93)90007-x
Smith, K. A., and Dobbie, K. E. (2001). The Impact of Sampling Frequency and Sampling Times on Chamber-Based Measurements of N2 O Emissions from Fertilized Soils. Glob. Change Biol. 7, 933–945. doi:10.1046/j.1354-1013.2001.00450.x
Stehfest, E., and Bouwman, L. (2006). N2O and NO Emission from Agricultural Fields and Soils under Natural Vegetation: Summarizing Available Measurement Data and Modeling of Global Annual Emissions. Nutr. Cycl Agroecosyst 74, 207–228. doi:10.1007/s10705-006-9000-7
Teepe, R., Brumme, R., and Beese, F. (2001). Nitrous Oxide Emissions from Soil during Freezing and Thawing Periods. Soil Biol. Biochem. 33, 1269–1275. doi:10.1016/s0038-0717(01)00084-0
Tian, H., Xu, R., Canadell, J. G., Thompson, R. L., Winiwarter, W., Suntharalingam, P., et al. (2020). A Comprehensive Quantification of Global Nitrous Oxide Sources and Sinks. Nature 586, 248–256. doi:10.1038/s41586-020-2780-0
Van, B. E., Prévost, D., and Pelletier, F. (2000). Effects of Freeze–Thaw and Soil Structure on Nitrous Oxide Produced in a Clay Soil. Soil Sci. Soc. America J. 64, 1638–1643. doi:10.2136/sssaj2000.6451638x
Wagner-Riddle, C., Congreves, K. A., Abalos, D., Berg, A. A., Brown, S. E., Ambadan, J. T., et al. (2017). Globally Important Nitrous Oxide Emissions from Croplands Induced by Freeze-Thaw Cycles. Nat. Geosci. 10, 279–283. doi:10.1038/ngeo2907
Wang, J., Song, C., Hou, A., Miao, Y., Yang, G., and Zhang, J. (2014). Effects of Freezing-Thawing Cycle on Peatland Active Organic Carbon Fractions and Enzyme Activities in the Da Xing'anling Mountains, Northeast China. Environ. Earth Sci. 72, 1853–1860. doi:10.1007/s12665-014-3094-z
Wolf, B., Zheng, X., Brüggemann, N., Chen, W., Dannenmann, M., Han, X., et al. (2010). Grazing-induced Reduction of Natural Nitrous Oxide Release from Continental Steppe. Nature 464, 881–884. doi:10.1038/nature08931
Xia, L., Lam, S. K., Chen, D., Wang, J., Tang, Q., and Yan, X. (2017). Can Knowledge-Based N Management Produce More Staple Grain with Lower Greenhouse Gas Emission and Reactive Nitrogen Pollution? A Meta-Analysis. Glob. Change Biol. 23, 1917–1925. doi:10.1111/gcb.13455
Yan, G., Yao, Z., Zheng, X., and Liu, C. (2015). Characteristics of Annual Nitrous and Nitric Oxide Emissions from Major Cereal Crops in the North China Plain under Alternative Fertilizer Management. Agric. Ecosyst. Environ. 207, 67–78. doi:10.1016/j.agee.2015.03.030
Yanai, Y., Hirota, T., Iwata, Y., Nemoto, M., Nagata, O., and Koga, N. (2011). Accumulation of Nitrous Oxide and Depletion of Oxygen in Seasonally Frozen Soils in Northern Japan - Snow Cover Manipulation Experiments. Soil Biol. Biochem. 43, 1779–1786. doi:10.1016/j.soilbio.2010.06.009
Yao, Z., Yan, G., Wang, R., Zheng, X., Liu, C., and Butterbach-Bahl, K. (2019). Drip Irrigation or Reduced N-Fertilizer Rate Can Mitigate the High Annual N2O+NO Fluxes from Chinese Intensive Greenhouse Vegetable Systems. Atmos. Environ. 212, 183–193. doi:10.1016/j.atmosenv.2019.05.056
Zhang, X., Meng, F., Li, H., Wang, L., Wu, S., Xiao, G., et al. (2019). Optimized Fertigation Maintains High Yield and Mitigates N2O and NO Emissions in an Intensified Wheat-Maize Cropping System. Agric. Water Management 211, 26–36. doi:10.1016/j.agwat.2018.09.045
Zhang, Y., Liu, J., Mu, Y., Pei, S., Lun, X., and Chai, F. (2011). Emissions of Nitrous Oxide, Nitrogen Oxides and Ammonia from a Maize Field in the North China Plain. Atmos. Environ. 45, 2956–2961. doi:10.1016/j.atmosenv.2010.10.052
Keywords: nitrous oxide, chamber method, rainfed agriculture, drought, nitrification
Citation: Su C, Kang R, Huang W and Fang Y (2021) Temporal Patterns of N2O Fluxes From a Rainfed Maize Field in Northeast China. Front. Environ. Sci. 9:668084. doi: 10.3389/fenvs.2021.668084
Received: 16 February 2021; Accepted: 12 April 2021;
Published: 22 April 2021.
Edited by:
Hatano Ryusuke, Hokkaido University, JapanCopyright © 2021 Su, Kang, Huang and Fang. This is an open-access article distributed under the terms of the Creative Commons Attribution License (CC BY). The use, distribution or reproduction in other forums is permitted, provided the original author(s) and the copyright owner(s) are credited and that the original publication in this journal is cited, in accordance with accepted academic practice. No use, distribution or reproduction is permitted which does not comply with these terms.
*Correspondence: Yunting Fang, ZmFuZ3l0QGlhZS5hYy5jbg==