 Shikha Singh1
 Sindhu Jagadamma1*
 Junyi Liang2
 Stephanie N. Kivlin3
 Jeffrey D. Wood4Gangsheng Wang5
 Christopher W. Schadt6
 Jesse I. DuPont7Prasanna Gowda7
 Melanie A. Mayes1,2
- 1Department of Biosystems Engineering and Soil Science, University of Tennessee, Knoxville, TN, United States
- 2Environmental Sciences Division and Climate Change Science Institute, Oak Ridge National Laboratory, Oak Ridge, TN, United States
- 3Department of Ecology and Evolutionary Biology, University of Tennessee, Knoxville, TN, United States
- 4School of Natural Resources, University of Missouri, Columbia, MO, United States
- 5Institute for Environmental Genomics, Department of Microbiology and Plant Biology, School of Civil Engineering and Environmental Sciences, University of Oklahoma, Norman, OK, United States
- 6Biosciences Division, Oak Ridge National Laboratory, Oak Ridge, TN, United States
- 7Grazinglands Research Laboratory, USDA-ARS, El Reno, OK, United States
Soil microbial respiration is one of the largest sources of carbon (C) emissions to the atmosphere in terrestrial ecosystems, which is strongly dependent on multiple environmental variables including soil moisture. Soil moisture content is strongly dependent on soil texture, and the combined effects of texture and moisture on microbial respiration are complex and less explored. Therefore, this study examines the effects of soil moisture on the mineralization of soil organic C Soil organic carbon in three different soils, Ultisol, Alfisol and Vertisol, collected from mixed forests of Georgia, Missouri, and Texas, United States , respectively. A laboratory microcosm experiment was conducted for 90 days under different moisture regimes. Soil respiration was measured weekly, and destructive harvests were conducted at 1, 15, 60, and 90 days after incubation to determine extractable organic C (EOC), phospholipid fatty acid based microbial community, and C-acquiring hydrolytic extracellular enzyme activities (EEA). The highest cumulative respiration in Ultisol was observed at 50% water holding capacity (WHC), in Alfisol at 100% water holding capacity, and in Vertisol at 175% WHC. The trends in Extractable Organic Carbon were opposite to that of cumulative microbial respiration as the moisture levels showing the highest respiration showed the lowest EOC concentration in all soil types. Also, extracellular enzyme activities increased with increase in soil moisture in all soils, however, respiration and EEA showed a decoupled relationship in Ultisol and Alfisol soils. Soil moisture differences did not influence microbial community composition.
Introduction
Soil organic carbon (SOC) is the largest and most dynamic terrestrial C reserve (Jobbágy and Jackson, 2000) and understanding SOC decomposition in response to environmental changes is critical for predicting CO2 feedbacks driving future climates (Davidson and Janssens, 2006; Schmidt et al., 2011; Hao et al., 2017; Su et al., 2020). Globally, 60 to 80 Pg of C is emitted to the atmosphere by microbial soil respiration, which is one of the largest C fluxes between the terrestrial ecosystem and atmosphere (Raich and Schlesinger, 1992; Jian et al., 2018; Warner et al., 2019). Approximately 10% of the atmospheric CO2 cycles through soils each year and environmental changes that influence C cycling in soil impart a strong effect on atmospheric CO2 concentrations (Rodeghiero and Cesscatti, 2005). Given the large amounts of soil C stocks and flux to the atmosphere, a major concern is that future climate change will create a positive feedback loop by increasing soil respiration (Trumbore, 1997; Davidson et al., 2000; Schlesinger and Andrews, 2000; Brangari et al., 2020).
Soil moisture plays a very important role in regulating microbial activity (Yan et al., 2018; Schimel et al., 2018). The existing literature shows that the soil moisture-respiration relationship is complex and site-specific, and is strongly controlled by porosity, bulk density, texture, and SOC concentration (Franzluebbers, 1999; Thomsen et al., 1999; Moyano et al., 2012; Herbst et al., 2016; Homyak et al., 2018; Li et al., 2020). However, such studies have focused mainly on determining the index of soil moisture that best predicts the microbial respiration (e.g., water-filled pore space, water potential) or elucidating the unified function that best describes the relationship between soil moisture and microbial respiration (e.g., linear, polynomial, etc.) (Ilstedt et al., 2000; Paul et al., 2003). Soil C models tend to rely on empirical soil moisture-respiration functions which are developed and validated based on site-specific studies (Bauer et al., 2008; Falloon et al., 2011). Moreover, these functions represent an average response of the moisture-respiration relationships, thus can introduce uncertainties into predictions of the SOC budget (Sierra et al., 2015).
Soil physico-chemical properties such as soil texture, can also impart a significant control on how moisture influences microbial mineralization of SOC (Franzluebbers et al., 1996; Moyano et al., 2012; Li et al., 2020). While clay content does not affect the mineralization of so-called labile SOC early in the decomposition process, during the later stages when non-labile SOC is mineralized, high clay content slows down decomposition rates as clay protects SOC (Wang et al., 2003). On the contrary, sandy soils poorly protect SOC against microbial respiration (Mutuo et al., 2006). The soil water content, a function of soil pore space and pore size distribution, is also governed by soil texture (Childs, 1940). Coarse textured soils tend to exhibit a lower water holding capacity (WHC) as the pore size distribution is dominated by macropores with minimum ability to retain water while fine textured soils, dominated by micropores, have the highest WHC and tend to retain much more water than coarse textured soils at same water potentials.
The low and high extremes of soil moisture content are not congenial for microbial respiration. Low soil moisture levels hinder microbial respiration by decreasing substrate accessibility to microbes. Under extremely dry conditions, microbes may undergo a state of low metabolic activity or dormancy (Manzoni et al., 2012; Manzoni et al., 2014). On the contrary, high soil moisture levels impede microbial respiration by reducing O2 diffusion (Moyano et al., 2013). Extracellular enzyme activities that provide information on soil microbial metabolic functioning (Stott et al., 2010) are also strongly influenced by soil moisture (Acosta-Martinez et al., 2007) and soil texture (Günal et al., 2018). Despite the critical role of soil moisture in regulating SOC mineralization, the soil moisture sensitivity of terrestrial C cycling has received less attention in comparison to soil temperature sensitivity (Wang et al., 2019). Therefore, this paper aims to experimentally establish soil moisture-soil respiration relationships and determine how microbial respiration changes under changing soil moisture conditions in three different soils with distinctly different textures and other attributes. With these objectives in mind, we conducted a laboratory-scale microcosm experiment using three soils for 90 days. Our main aim was to determine if the measured soil properties would interact with soil moisture levels and this interactive response serves as the dominant factor controlling the microbial respiration.
Materials and Methods
Study Sites
Three different soils-Ultisol, Alfisol, and Vertisol-were collected from mixed forests located in the southern United States. The Ultisol belonged to the Cowart series (fine-loamy, kaolinitic, thermic Typic Kanhapludults) and was collected from Taylor County in Georgia (32.54°N, 84.22°W). The predominant tree species comprising the forest are Quercus alba, Acer saccharum, Quercus velutina, Juniperus virginiana, Carya spp., Pinus clausa, Nyssa sylvatica, Magnolia grandiflora, and Liriodendron tulipifera. Mean annual temperature and precipitation at this site is 20°C and 1,200 mm, respectively. The Alfisol belonged to the Weller series (fine, smectitic, mesic Aquertic Chromic Hapludalfs) and was collected from the Missouri Ozark AmeriFlux (MOFLUX) site in central Missouri. This site is located at the University of Missouri Baskett Wildlife Research and Education Center (38.74°N, 92.20°W) in an upland oak-hickory forest with major tree species consisting of Quercus alba, Carya ovata, Acer saccharum and Juniperus virginiana (Gu et al., 2015; Wood et al., 2018). Mean annual temperature and precipitation at this site is 12°C and 986 mm, respectively. The Vertisol belonged to the Buxin series (very-fine, smectitic, thermic Aquic Hapluderts) and was collected from Bowie County, Texas (33.44°N, 94.48°W). At this site the predominant tree species are Pinus taeda, Pinus echinata, Quercus spp, Carya spp, and Cupressus spp. Mean annual temperature and precipitation at this site is 17°C and 900 mm, respectively. Basic properties of these three soils are reported in Table 1.
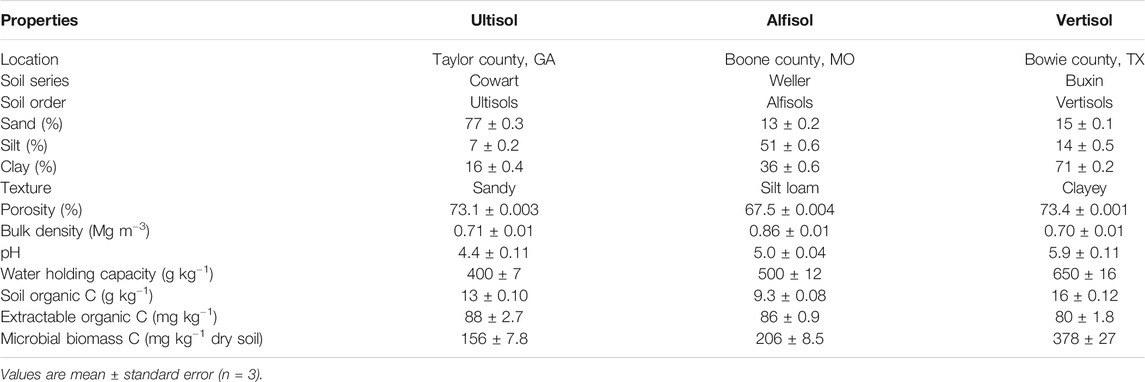
TABLE 1. Properties of the soils used in the study.
Soil Sampling and Characterization
Soil cores of 5 cm diameter were collected from several random locations at each site to a depth of 15 cm, after removing the litter layer, and combined to obtain a composite sample per site (Mavi et al., 2012; Jagadamma et al., 2014). Three additional undisturbed cores per site were collected to determine WHC. The soil samples were transported to the research laboratory in coolers with dry ice. The composite samples were immediately sieved through a 2 mm sieve. One section of the sieved samples was air-dried for the initial soil characterization (n = 3), and the remainder was stored at 4°C for 48 h to use for the microcosm experiment. Soil texture was determined by the Bouyoucos hydrometer method (Gee and Or, 2002). Soil pH was measured in a 1:2 soil:water suspension (Thomas, 1996) using a pH meter (Mettler Toledo, Columbus, Ohio). Total C was determined on finely ground samples by the dry combustion method using a Vario TOC cube CN analyzer in solid mode (Elementar, Hanau, Germany). As all the soils were acidic (pH < 6), total C was assumed to be equal to SOC (Al-Kaisi et al., 2005). Extractable organic C (EOC) was determined based on the method by Jones and Willett (2006). Briefly, soils were mixed with 0.5 M K2SO4 (1:4 soil:solution), shaken at 200 revolutions per minute for 1 h, and centrifuged at 3,500 rpm for 3 min. The supernatant was passed through a 0.45 μm filter paper (Whatman No. 42) and analyzed using a Vario TOC cube CN analyzer in liquid mode (Elementar, Hanau, Germany).
Soil Moisture Treatments and Incubation Experiment
This study included five soil moisture treatments: air-dried, 25, 50, 100, and 175% WHC. The WHC of the three soils was determined using pressure plate extractor method (Klute and Dirksen, 1986) by placing the saturated soil cores in the pressure plate extractors at −0.33 bar and then measuring the gravimetric soil moisture content of the core (Mavi et al., 2012; Zhou et al., 2014; Bao et al., 2016). We also determined the WHC using the funnel method (Jenkinson and Powlson, 1976). As the WHC values obtained from both methods were similar, the WHC obtained using pressure plate extractors is reported. Except for the air-dried treatments, the moisture treatment manipulations involved adding MilliQ water to the soils based on the moisture treatments (Zhou et al., 2014). Prior to the start of incubation, soil samples were pre-incubated for 1 week at environmental conditions similar to the experiment (i.e., at room temperature (20°C) in the dark). Thirty grams of soil sample (on a dry weight basis) was added to plastic cups and MilliQ water was added to manipulate corresponding soil moisture treatments followed by gently mixing with a spatula. The cups were then placed in 1 L glass jars and closed with lids fitted with sampling ports at the center. A total of 12 replicates per treatments were prepared for each soil type to destructively harvest three replicates at days 1, 15, 60, and 90 of the incubation. Soil collected from the destructive harvests were frozen at −20°C pending analysis. To maintain constant soil moisture during the course of the incubation, water loss was checked on a weekly basis by weighing each soil container and corrected by adding MilliQ water as necessary. At the most, 0.1–0.2 ml of water was added every week.
Gas Sampling and CO2 Measurement
Gas samples (15 ml) from the headspace of the jars (n = 3) were collected through the sampling port on the lids on days 0, 1, 2, 5, 7, 12, 19, 26, 34, 41, 48, 55, 62, 69, 76, 83, and 90 using a syringe-needle assembly and transferred to evacuated exetainer vials (Labco, United Kingdom). The jars were sampled before opening the lids and after gas sample collection, the jars were opened, and electrical fans were used for blowing air into the jars to maintain an aerobic incubation environment. For blank correction, gas samples were collected from triplicate empty (without soil) jars at all time points. The CO2 concentration in the gas samples was measured using a flame ionization detector on a gas chromatograph (Shimadzu GC-2014, Japan). Microbial respiration rate was calculated using the linear response curve of CO2 concentrations versus time (Curiel-Yuste et al., 2007).
Soil Extracellular Enzyme Assays
The activities of four C-acquiring hydrolytic enzymes, α-glucosidase (AG), β-glucosidase (BG), cellobiohydrolase (CBH), and β-xylosidase (XYL), were determined from all treatments at all the destructive sampling time points (day 1, 15, 60, and 90) in 96-well plates according to German et al. (2011b). Each column of 12 wells on each plate corresponded to one soil sample. Another plate was used to create a standard curve for each sample at 25°C. Each column in the standard curve plate contained a soil slurry with a different concentration of the 4-methylumbelliferone (MUB) standard (0, 2.5, 5, 10, 25, 50, and 100 μM) in each of the wells. The reference standards for the enzymes AG, BG, CBH, and XYL are 4-MUB-α-D-glucopyranoside, 4-MUB-β-D-glucopyranoside, 4-MUB-β-D-cellobioside, and 4-MUB-β-D- xylopyranoside, respectively. A 2.75 g of frozen soil sample from each treatment was thawed to room temperature and homogenized with 91 ml of 50 mM sodium acetate buffer (pH adjusted according to the pH of the soil types shown in Table 1) for 1 min in a Waring laboratory grade blender on high speed to prepare a slurry. Homogenization was followed by adding 800 μL of the soil slurry into each of the eight wells of one column. After adding 12 samples in a plate, 200 μL of 200 μM respective substrates were added. The plates were incubated for 3 h at 25°C. After incubation, the plates were centrifuged at 350 × g for 3 min and 250 μL of the supernatant from each well was transferred to a 96-well black plate. A plate reader (Synergy-BioTek Instruments, Inc, Vermont, United States) was used to measure fluorescence at wavelengths 365 and 450 nm for excitation and emission, respectively. The standard curve plates were used to construct a linear standard curve to determine each enzymes’ activity for each sample as nmol g−1 dry soil h−1. Total activity of the C acquiring hydrolytic enzymes was defined as the sum of CBH, AG, BG, and XYL.
Phospholipid Fatty Acid Extraction and Analysis
Microbial community composition was determined using the phospholipid fatty acid (PLFA) and neutral fatty acid (NLFA) analyses (Buyer and Sasser, 2012). Briefly, 1.5–2 g of freeze-dried soil were used for Bligh-Dyer lipid extraction (Bligh and Dyer, 1959). The extracted fatty acids were dried and analyzed using a gas chromatograph (Agilent 7890A, Agilent Technologies, Wilmington, DE, United States ) after trans-esterification for quantitative analysis relative to an internal standard. Fatty acid profiles were identified using MIDI PLFAD1 calibration mix and software SHERLOCK version 6.2 (MIDI, Inc, DE, United States ). Bacteria, fungi, and arbuscular mycorrhizal fungi (AMF) were targeted using the fatty acid markers, where gram-positive bacteria markers were 15:0, i15:0, a15:0, i16:0, 16:0ω9, i17:0, and cy17:0, and gram-negative bacteria markers were 16:1ω7, 18:1ω7, and cy19:0 (Frostegård and Baath, 1996). The amount of PLFA 18:2ω6 was used as a marker of non-mycorrhizal fungal abundance and NLFA 16:1ω5 for AMF (Olsson et al., 1995; Olsson, 1999).
Exponential Decay Modeling
The CO2 data corresponding to each moisture treatment in each soil was best fitted using a double pool exponential decay model based on the best fit model parameters among single, double, and triple-pool models (lowest Akaike Information Criterion values and dependencies, and highest R2) (Farrar et al., 2012; Jagadamma et al., 2014; Das et al., 2019).
where Ct is the total CO2-C production per unit soil weight (μg C g−1 dry soil), t is the time in days, C1 is the fast mineralizing SOC pool (active pool), C2 is the slow mineralizing SOC pool (slow pool) within time t, and k1 and k2 are the mineralization rates for C1 and C2, respectively. For each set of data, the model was fit using Sigma plot v14 (Systat Software Inc, IL, United States). Parameter constraints while fitting the model were k1 > 0 and k2 > 0 and C1 + C2 = 100% (Das et al., 2019).
Statistical Analyses
Statistical analyses were conducted using SAS software v 9.4 (SAS Institute Inc., 2002). The effect of moisture on CO2 and EOC over the incubation period for each soil was analyzed using repeated measures ANOVA with incubation length as the repeated measure. Post hoc comparisons for determining the effect of soil moisture on respiration was performed using PROC GLIMMIX in SAS. The mean separation was done using Tukey’s test. The dependence of observed microbial respiration to various soil properties including soil pore space, bulk density, SOC, pH, MBC, EOC and contents of sand, silt and clay was determined using multiple linear regression analysis by applying stepwise model selection procedure. In all statistical tests, the mean differences were considered significant if p ≤ 0.05. Moisture sensitivity for enzyme assays was estimated using regression analyses of measured enzyme activities for the moisture treatments, soil types, each destructive sampling time, and the total incubation length. To compare enzyme activities among soil moisture treatments on each day of destructive sampling, one-way ANOVA was used.
To understand how the microbial community composition varies across various moisture levels in all soil types, permutational multivariate analysis of variance (PERMANOVA) was used in R software (R Development Core Team, 2011) on the matrix of abundances of each microbial type for all soil types and moisture treatments. The Bray-Curtis distance metric and 9,999 permutations of residuals for the model were used (Kivlin et al., 2019). The Mantel test was also performed in R to assess correlations between enzyme activity and microbial community composition.
Results
Microbial Respiration
The CO2 respiration rate showed significant responses to soil moisture content in all soils (Figure 1) (p < 0.0001–0.032 for Ultisol; < 0.0001–0.004 for Alfisol; < 0.0001 for Vertisol across the time points). The lowest respiration rate was observed at the lowest moisture content (air-dried soils) in all the three soils throughout the incubation. However, the highest CO2 respiration rate was observed at different moisture levels for the different soil types. For Ultisol, after the first 5 days of incubation, the highest respiration rate was consistently observed at 50% WHC throughout the incubation (Figure 1A). For Alfisol, after a week of incubation, the highest respiration was observed at 100% WHC for the remaining incubation period (Figure 1B). For Vertisol, the highest respiration rate was observed at 175% WHC consistently throughout the incubation period (Figure 1C). Also, we observed a slight increase in respiration rate around day 34 in all soils, however, the trendline over time did not show an increase in any of the soils. The repeated measures ANOVA results showed significant effects of soil moisture (p < 0.0001), time of sampling (p < 0.0001), and their interaction (p < 0.001) on soil respiration for all soil types (Table 2). Cumulative CO2 production at the end of incubation (day 90) was also the lowest in the air-dried treatments for all the three soils (Figure 2). However, across the moisture levels, cumulative CO2 production showed a bell-shaped second-order polynomial response with increased soil moisture was observed for Ultisol and Alfisol soils (Figures 2A,B), and an increasing second-order polynomial response for the Vertisol soil (Figure 2C). The second order polynomial curves were made using the actual soil moisture values, which are continuous variable. For Ultisol, soil respiration varied from 89 μg C g−1 dry soil to 265 μg C g−1 dry soil with the lowest respiration observed in air-dried treatment and the highest at 50% WHC (Figure 2A). Similarly, for Alfisol, the cumulative CO2 production was the highest in the 100% WHC treatment which was over 200% higher than the CO2 production in the air-dried treatment (Figure 2B). The cumulative CO2 production from the 175% WHC treatment also averaged 17% lower than that at 100% WHC. In the Vertisol, the cumulative CO2 increased with increased moisture (Figure 2C). Multiple linear regression of microbial respiration to soil properties revealed that respiration was significantly dependent on clay content, soil moisture, and SOC content (Table 3).
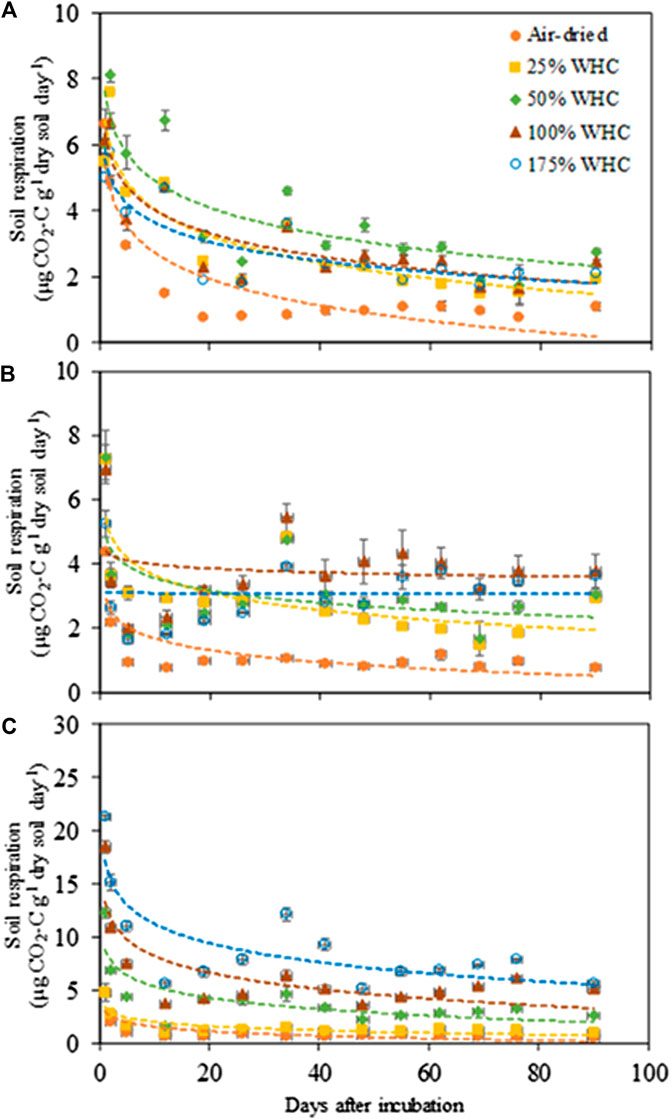
FIGURE 1. Microbial respiration rate in response to soil moisture levels in (A) Ultisol, (B) Alfisol, and (C) Vertisol soils. Error bars represent standard error (n = 3). The regression functions are logarithmic for all soil moisture treatments in all soil types. Note the y axis scale is 3 × larger for clay soils.
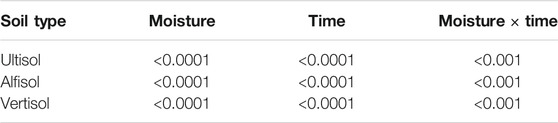
TABLE 2. Repeated measures ANOVA statistics (p value) for soil moisture and time effects on microbial respiration.
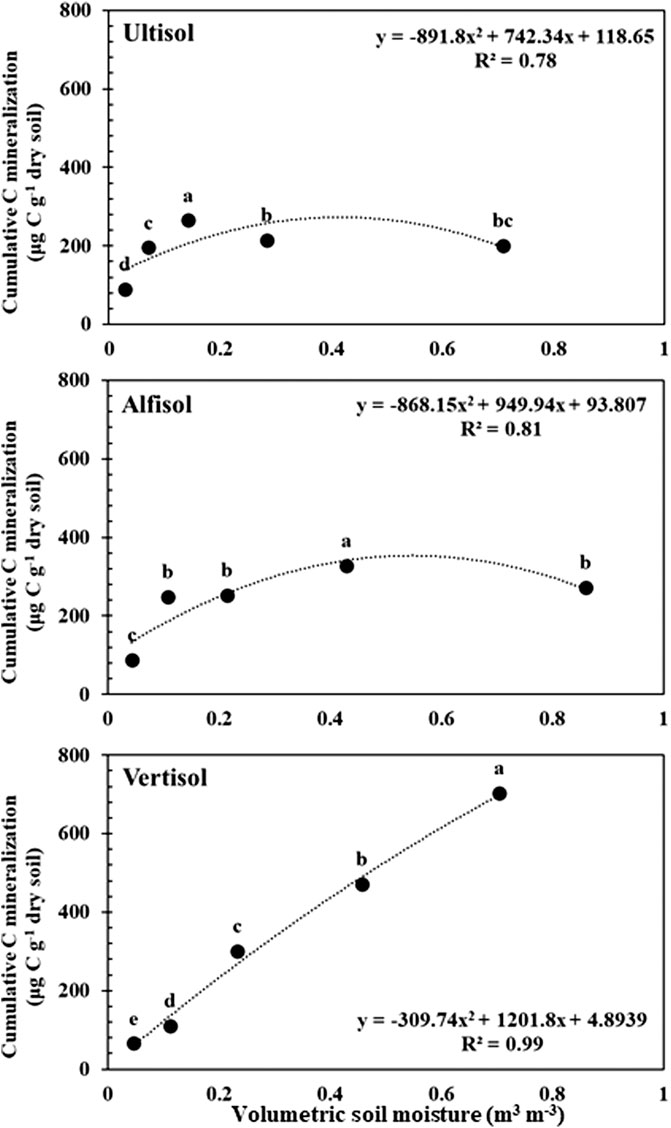
FIGURE 2. Cumulative C mineralization per unit dry soil after day 90 from Ultisol (A), Alfisol (B), and Vertisol (C) soils in response to increasing soil moisture. Error bars represent standard errors (n = 3). Different letters represent statistical significance at p < 0.05. The curves represent the second-order polynomial response of cumulative C mineralization to soil moisture levels.
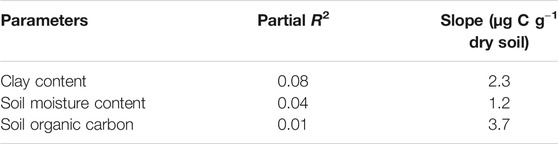
TABLE 3. Multiple linear regression metrics for microbial respiration.
Soil Organic Carbon Pool Sizes and Mineralization Rates
Microbial respiration data was modeled by a double pool exponential decay model to determine SOC fractions that are actively decomposing (active pool, C1) as well as relatively slowly decomposing (slow pool, C2) at different moisture levels. Regardless of soil texture and soil moisture differences, < 1.5% of the initial SOC respired was partitioned as C1 (Table 4). For both loamy and clayey soils, C1 decreased with increasing moisture content. However, for Ultisol, C1 was similar for all moisture levels except the air-dried treatment. The size of C2 only varied between 99.2 and 99.7% of initial SOC among all soil types and soil moisture levels, and no significant differences were observed among soil moisture treatments.
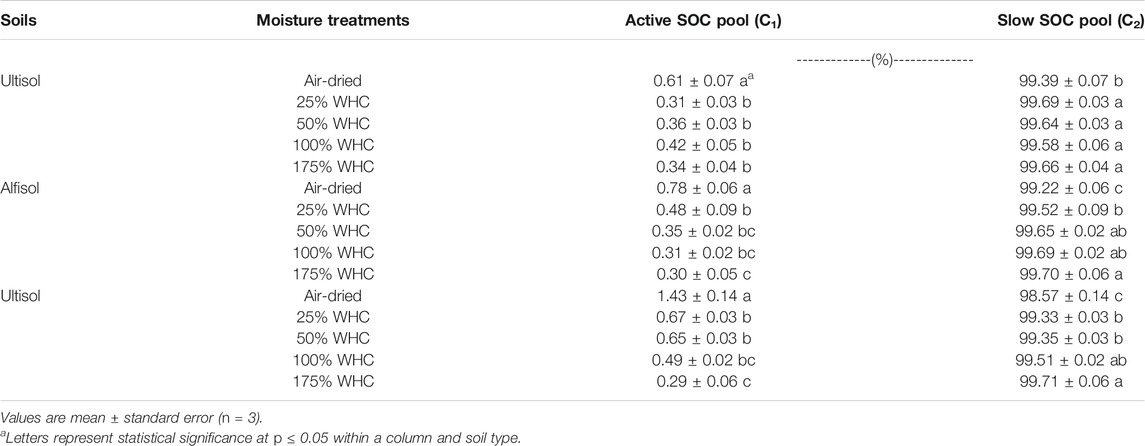
TABLE 4. Effects of soil moisture on soil organic carbon pool sizes as a percentage of initial soil organic carbon.
Mineralization rate, k1 of C1 pool was the highest at 50% WHC (0.23 days−1) for Ultisol, at 100% WHC (0.21 days−1) and at 175% WHC (0.23 days−1) moisture treatments for Alfisol, and at 175% WHC moisture content (0.17 days−1) for Vertisol (Figure 3A). Mineralization rate, k2, of C2 pool was one to two order of magnitude lower than k1 and showed no significant differences across moisture levels in all the three soils (Figure 3B). Comparing the soil types, Ultisol had comparatively higher k2 followed by Alfisol and Vertisol.
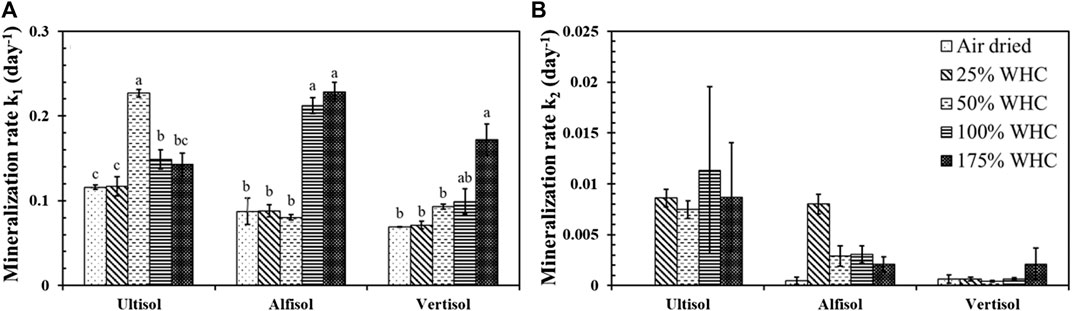
FIGURE 3. Effect of soil moisture levels on k1, the mineralization rates of active SOC pool (A) and k2, the mineralization rate of slow SOC pool (B) in Ultisol, Alfisol and Vertisol soils. Different letters represent statistical significance at p ≤ 0.05 within each soil type. No letters mean no statistical significance. Error bars represent standard error (n = 3).
Extractable Organic Carbon
The EOC values were generally higher in the drier treatments compared to the wetter treatments (Figure 4). For Ultisol, EOC was statistically influenced by moisture (p < 0.001), length of incubation (p < 0.0001), and their interaction (p < 0.001) while for Alfisol and Ultisol soils, moisture and length of incubation significantly influenced the EOC and the interaction between moisture and length of incubation was not significant (p > 0.05). The EOC concentration at day 1 for all moisture levels and soil types was significantly higher (60–115 mg kg−1) than that at days 15 (33–103 mg kg−1), 60 (24–94 mg kg−1), and 90 (22–89 mg kg−1). As incubation progressed, for Ultisol and Alfisol soils, we observed no significant differences in EOC content of the driest treatment with time but for other treatments EOC decreased with time. However, for Vertisol, EOC in the driest treatment also decreased with incubation length. More importantly, beginning day 15, the lowest EOC content in each soil type was recorded from the moisture treatment which produced the highest cumulative respiration: at 50, 100, and 175% WHC for Ultisol, Alfisol, and Vertisol soils, respectively, (Figures 2, 4).
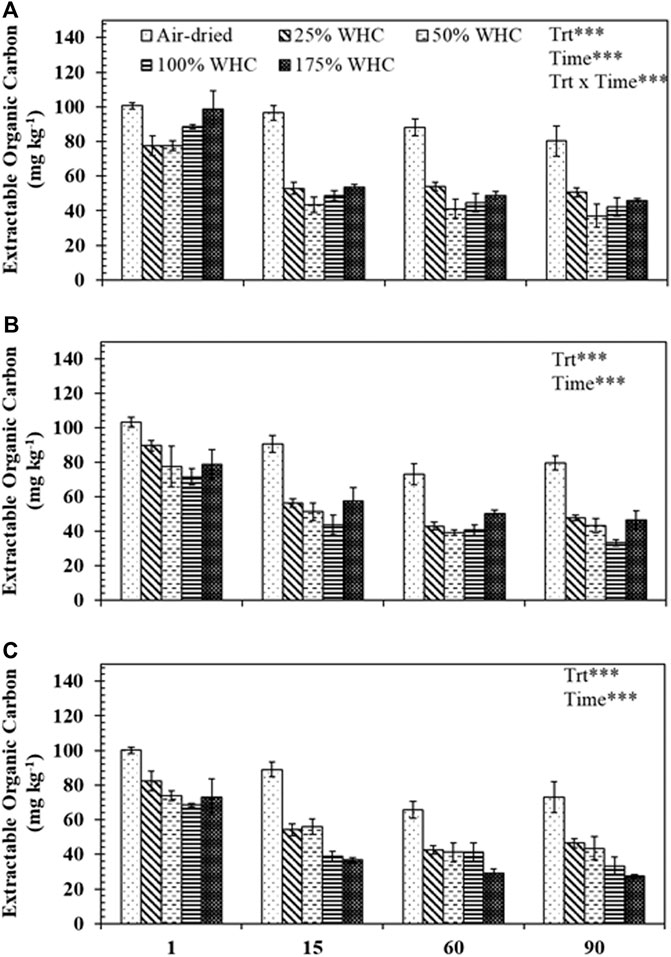
FIGURE 4. Extractable organic carbon concentrations for different soil moisture treatments in (A) Ultisol, (B) Alfisol, and (c) Vertisol at each destructive sampling time. Error bars represent the standard errors (n = 3). *** denotes p < 0.001 for the effects of treatment (Trt), time, and treatment and time interaction (Trt x Time).
Extracellular Enzyme Activity and Microbial Community Composition Responses
There was a consistent increase in total C acquisition enzyme activities (sum of BG, AG, CBH, and XYL) with increase in soil moisture. The highest enzyme activity was observed at the highest soil moisture content for all the three soils at all time points (Figure 5). Also, regardless of soil types, air-dried treatments consistently showed the lowest enzyme activity and there was a decrease in enzyme activity with the length of incubation. For Ultisol, on day 1, we observed a significant increase in enzyme activity with an increase in moisture treatments but on day 90, no statistical difference in enzyme activity was observed in the moist treatments (only air-dried treatment showed lowest activity). The regression analysis showed a significant positive relationship between soil moisture and enzyme activity (Table 5). However, the PERMANOVA analysis revealed that soil moisture treatments did not influence the microbial community composition derived by PLFA in any soil type (p = 0.35 for Ultisol, 0.41 for Alfisol, and 0.12 for Vertisol) (Supplementary Table S2). Our Mantel test results showed that the microbial community composition did not influence the enzyme activity (p > 0.05) (Supplementary Table S1).
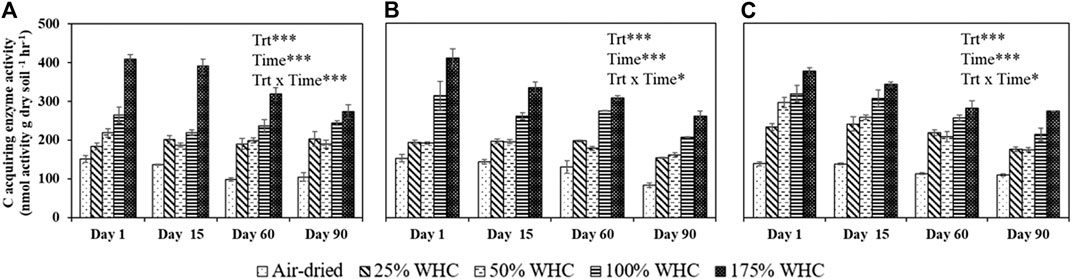
FIGURE 5. Activity of sum of four C-acquiring extracellular enzymes in Ultisol (A), Alfisol (B), and Vertisol (C) soils at each destructive sampling time. Error bars represent the standard errors (n = 3). *** denotes p < 0.001, * denotes p < 0.05 for the effects of treatment (Trt), time, and treatment and time interaction (Trt x Time).
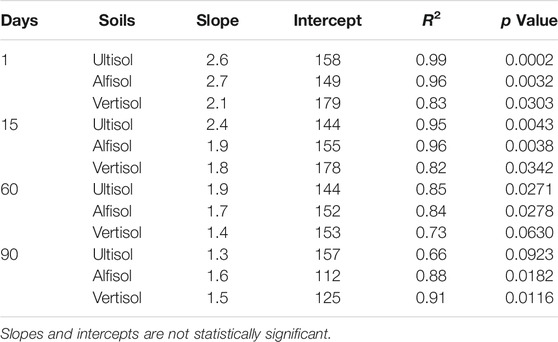
TABLE 5. Linear regression statistics of moisture sensitivity of C acquiring extracellular enzyme assays.
Discussion
In accordance with our hypothesis, soil microbial respiration was influenced by soil moisture levels and showed variable responses in the three different soils. In all soils, significantly lower microbial respiration was observed in the drier treatments (Figure 1), likely due to limited substrate diffusion in the soil matrix that impeded microbial metabolism (Bell et al., 2009; Manzoni et al., 2012; Evans et al., 2014; Zhou et al., 2014, Yan et al., 2018). The slight increase in respiration rate around day 34 was due to moisture addition in soils on day 30 to maintain a steady moisture level. The moisture content at which the maximum soil respiration occurred varied across soil types (Figure 2). Over the incubation length of 90 days, we observed consistently highest respiration at 50% WHC for Ultisol, at WHC for Alfisol, and at 100% saturation for Vertisol. This clearly reflects persistently high microbial activity at respective moisture contents for all soil types which overrides the effect of substrate depletion over time (Zhou et al., 2014). Vertisol showed consistent increase in CO2 efflux with 3-4 fold higher cumulative CO2 at moisture optima (175% WHC) compared to moisture optima for Alfisol (100% WHC) and Ultisol (50% WHC) soils. The Vertisol soil may have remnant air-filled micropores even at highly moist conditions to support aerobic microbial metabolism (Taboada, 2003). It is also important to note that Vertisol has an exceptional shrink-swell capacity that could promote the trapping of air in micropores (Taboada, 2003). The significant increase in microbial respiration from the Vertisol with increased moisture could also be explained mechanistically by the zonal theory of organic C layering on clay minerals (Kleber et al., 2007). Based on this theory, increased moisture may facilitate easy exchange of loosely adsorbed C molecules with the soil solution, making them available for microbial acquisition (Kögel-Knabner et al., 2008). For Ultisol and Alfisol soils, the decrease in respiration beyond optimum soil moisture treatment (i.e., peak respiration) is probably due to the decreased diffusion of O2, thereby limiting aerobic microbial respiration (Prado and Airoldi, 1999; Keiluweit et al., 2016). Also, Ultisol was sandy in texture which exhibits very high proportion of macropores leading to lower moisture retention and availability to microbes. This was probably the reason why the Ultisol exhibited the highest microbial respiration at 50% WHC. Li et al. (2020) also reported strong control of particle size distribution on C mineralization.
The microbial respiration data from this 90-day incubation was satisfactorily described by a double-pool exponential decay model. The air-dried soils showed the lowest k1 and k2, reflecting the lowest microbial activity. The moisture treatments which showed the highest cumulative microbial respiration (Figure 2) in all soil types also showed the highest k1 values (Figure 3) indicating the tight coupling across soil texture, moisture content, and microbial activity. The k2 was one to two orders of magnitude lower than k1 and did not show significant differences among the moisture treatments for all the soil types despite following the order Ultisol > Alfisol > Vertisol. This is in line with our understanding that finer silt and clay sized particles tend to retain more SOC than coarser sandy particles (Hassink, 1997) due to enhanced physical and chemical protection. Nonetheless, the length of incubation is a key factor to determine the number of SOC pools with distinct turnover rates using kinetic modeling. Scharnagl et al. (2010) reported that long-term incubations with duration ranging from 600–900 days are best fit by triple-pool models (fast, intermediate, and slow SOC pools) unlike short-term incubations like ours which are best fit by double-pool models (Guntinas et al., 2013; Guo et al., 2014; Das et al., 2019).
The cumulative respiration and mineralization rate results were also supported by the EOC change across soil moistures (Figure 4). The EOC concentrations were the lowest at the moisture levels that resulted in the highest cumulative respiration, suggesting the highest rate of microbial uptake of EOC (Zsolnay, 1996). No significant decrease in EOC concentrations was observed in soils on days 60 and 90 as compared to day 15 which can plausibly be explained by the addition of C by microbial turnover (Coleman and Jenkinson, 1996; Franzluebbers et al., 1999). In addition, we observed consistently higher EOC concentrations in air-dried soils compared to higher moisture levels, similar to the trend in the size of active SOC pool, again suggesting lower microbial mineralization of SOC due to moisture limitation (Schjønning et al., 2003; Or et al., 2007; Butcher et al., 2020).
In accordance with the general understanding that C acquiring extracellular enzymes are highly sensitive to changes in moisture (Steinweg et al., 2012; Zhou et al., 2013), we observed a strong positive effect of soil moisture on the total activity of C acquiring extracellular enzymes (BG, AG, CBH, and XYL) (Table 4). Unlike EOC and mineralization rates that followed the same trend as cumulative microbial respiration by showing sensitivity to different moisture optima for different soils, extracellular enzyme activity was decoupled from cumulative microbial respiration in alignment with the findings of Brangari et al. (2020). These laboratory assays were short, and therefore discerned the activity of extant enzymes pool rather than newly synthesized enzymes due to substrate addition (Steinweg et al., 2012). Enzyme activities displayed a monotonic increase with increasing moisture levels, especially in Ultisol and Alfisol soils. This trend was more visible during the early days of incubation but as the incubation progressed, the difference in enzyme activity among moist treatments reduced. For instance, for Ultisol, there was no significant difference in enzyme activity among all the moisture treatments except air-dried treatment on day 90. Nonetheless, the enzyme activity was the highest at 175% WHC regardless of the soil types and incubation time. The enzyme activity was the lowest in the air-dried soils for all three soils, and consistent with the cumulative microbial respiration results. This was probably due to decreased substrate and enzyme diffusion, reducing the direct enzyme-substrate interaction (German et al., 2011a; German et al., 2011b; Burns et al., 2013; Ren et al., 2017) and/or increased adsorption of enzymes on soil particles (Kandeler, 1990; George et al., 2007) at lower moisture content. Also, under dry conditions, enzyme production and activity are lowered as the nutrient requirement for enzyme production exceeds the nutrient availability for microbes (Allison and Vitousek, 2005). The enzyme activities showed a consistent decrease across the length of incubation (Figure 5) probably due to substrate exhaustion (Acosta-Martinez et al., 2007) and lack of new production of enzymes.
Soil moisture did not influence microbial community composition determined by PLFA (Supplementary Table S2). Some past studies also reported no effect of soil moisture on microbial community composition (Griffiths et al., 2003; Buyer et al., 2010), while others reported the opposite (Williams, 2007; Kaisermann et al., 2015) depending on factors such as type of studies (laboratory vs field), duration of experiment, temperature, nutrient status, etc. The lack of influence of moisture on microbial community composition in our study is likely due to the short length of incubation. Nonetheless, changes in microbial community composition in laboratory microcosms may not be an accurate reflector of the activity of in situ microbial community. In the field, legacy field soil moisture content also contributes to shaping the microbial community (Schimel et al., 1999; Banerjee et al., 2016). The finding that microbial respiration is changing with soil moisture content, however, microbial community is not, probably implying microbial acclimation to varying moisture regimes (e.g., microbial dormancy under very low moisture). Overall, these results showed that short-term laboratory incubations at different soil moisture levels did not change microbial community composition, however, microbial activity was affected as indicated by changes in EOC, C acquiring enzyme activities and CO2 fluxes.
Conclusion
Understanding the dependency of microbial respiration on soil moisture and soil texture is important for reducing the uncertainty in modeling SOC dynamics under changing climate. Results from this study showed that soil moisture effects on microbial respiration were strongly controlled by soil texture (clay content). Consequently, different moisture optima were observed in Ultisol, Alfisol, and Vertisol soils for maximum microbial respiration, extractable organic C content, and SOC mineralization rates. Higher soil moisture supported higher enzyme activities and enhanced substrate availability, yet microbial respiration declined at higher soil moistures, but only for Ultisol and Alfisol soils. For Vertisol, respiration and enzyme activities were consistently increased with increase in soil moisture content. Our results indicate that soil moisture can potentially decouple from microbial activity in more coarsely textured soils, but such decoupling is less likely in finely textured soils.
Data Availability Statement
The data will be made available by the authors upon request, without undue reservation.
Author Contributions
SJ and SS designed the study. SS conducted the experiments, JD and PG trained SS on Phospholipid Fatty Acid analysis. SS and SK conducted data analysis. SS prepared the manuscript draft, SJ, MM, SK, JL, JW, GW, CS, JD, and PG reviewed and revised the manuscript draft, MM funded the research.
Funding
This work is financially supported by the United States Department of Energy (DOE) Office of Biological and Environmental Research through the Terrestrial Ecosystem Science Scientific Focus Area at Oak Ridge National Laboratory (ORNL). ORNL is managed by UT-Battelle, LLC, under contract DE-AC05-00OR22725 with the United States DOE. The work is also supported by the Ralph E. Powe Junior Faculty Enhancement Award from the Oak Ridge Associated Universities for the corresponding author.
Conflict of Interest
The authors declare that the research was conducted in the absence of any commercial or financial relationships that could be construed as a potential conflict of interest.
Acknowledgments
We appreciate the assistance of Jeff Cook (University of Georgia Extension), Bennett Wickenhauser (Graduate student, University of Missouri), and Alan Peer (USDA-NRCS, Nacogdoches, TX) for collecting soil samples from Georgia, Missouri, and Texas sites, respectively.
Supplementary Material
The Supplementary Material for this article can be found online at: https://www.frontiersin.org/articles/10.3389/fenvs.2021.682450/full#supplementary-material
References
Acosta-Martínez, V., Cruz, L., Sotomayor-Ramírez, D., and Pérez-Alegría, L. (2007). Enzyme Activities as Affected by Soil Properties and Land Use in a Tropical Watershed. Appl. Soil Ecol. 35, 35–45. doi:10.1016/j.apsoil.2006.05.012
Al-Kaisi, M. M., Yin, X., and Licht, M. A. (2005). Soil Carbon and Nitrogen Changes as Influenced by Tillage and Cropping Systems in Some Iowa Soils. Agric. Ecosyst. Environ. 105, 635–647. doi:10.1016/j.agee.2004.08.002
Allison, S. D., and Vitousek, P. M. (2005). Responses of Extracellular Enzymes to Simple and Complex Nutrient Inputs. Soil Biol. Biochem. 37, 937–944. doi:10.1016/j.soilbio.2004.09.014
Banerjee, S., Helgason, B., Wang, L., Winsley, T., Ferrari, B. C., and Siciliano, S. D. (2016). Legacy Effects of Soil Moisture on Microbial Community Structure and N2O Emissions. Soil Biol. Biochem. 95, 40–50. doi:10.1016/j.soilbio.2015.12.004
Bao, X., Zhu, X., Chang, X., Wang, S., Xu, B., Luo, C., et al. (2016). Effects of Soil Temperature and Moisture on Soil Respiration on the Tibetan Plateau. PLoS One 11, 9–15. doi:10.1371/journal.pone.0165212
Bauer, J., Herbst, M., Huisman, J. A., Weihermüller, L., and Vereecken, H. (2008). Sensitivity of Simulated Soil Heterotrophic Respiration to Temperature and Moisture Reduction Functions. Geoderma 145, 17–27. doi:10.1016/j.geoderma.2008.01.026
Bell, C. W., Acosta-Martinez, V., McIntyre, N. E., Cox, S., Tissue, D. T., and Zak, J. C. (2009). Linking Microbial Community Structure and Function to Seasonal Differences in Soil Moisture and Temperature in a Chihuahuan Desert Grassland. Microb. Ecol. 58, 827–842. doi:10.1007/s00248-009-9529-5
Bligh, E. G., and Dyer, W. J. (1959). A Rapid Method of Total Lipid Extraction and Purification. Can. J. Biochem. Physiol. 37, 911–917. doi:10.1139/y59-099
Brangarí, A. C., Manzoni, S., and Rousk, J. (2020). A Soil Microbial Model to Analyze Decoupled Microbial Growth and Respiration during Soil Drying and Rewetting. Soil Biol. Biochem. 148, 107871. doi:10.1016/j.soilbio.2020.107871
Burns, R. G., DeForest, J. L., Marxsen, J., Sinsabaugh, R. L., Stromberger, M. E., Wallenstein, M. D., et al. (2013). Soil Enzymes in a Changing Environment: Current Knowledge and Future Directions. Soil Biol. Biochem. 58, 216–234. doi:10.1016/j.soilbio.2012.11.009
Butcher, K. R., Nasto, M. K., Norton, J. M., and Stark, J. M. (2020). Physical Mechanisms for Soil Moisture Effects on Microbial Carbon-Use Efficiency in a sandy Loam Soil in the Western United States. Soil Biol. Biochem. 150, 107969. doi:10.1016/j.soilbio.2020.107969
Buyer, J. S., and Sasser, M. (2012). High Throughput Phospholipid Fatty Acid Analysis of Soils. Appl. Soil Ecol. 61, 127–130. doi:10.1016/j.apsoil.2012.06.005
Buyer, J. S., Teasdale, J. R., Roberts, D. P., Zasada, I. A., and Maul, J. E. (2010). Factors Affecting Soil Microbial Community Structure in Tomato Cropping Systems. Soil Biol. Biochem. 42, 831–841. doi:10.1016/j.soilbio.2010.01.020
Childs, E. C. (1940). The Use of Soil Moisture Characteristics in Soil Studies. Soil Sci. 50, 239–252. doi:10.1097/00010694-194010000-00001
Coleman, K., and Jenkinson, D. (1996). “RothC-26.3-A Model for the Turnover of Carbon in Soil,”in. Evaluation of Soil Organic Matter Models. Editors D. S. Powlson, P. Smith, and J. U. Smith (NATO ASI Series), Vol. I 38, 265–271.
Curiel Yuste, J., Baldocchi, D. D., Gershenson, A., Goldstein, A., Misson, L., and Wong, S. (2007). Microbial Soil Respiration and its Dependency on Carbon Inputs, Soil Temperature and Moisture. Glob. Change Biol. 13, 2018–2035. doi:10.1111/j.1365-2486.2007.01415.x
Das, S., Richards, B. K., Hanley, K. L., Krounbi, L., Walter, M. F., Walter, M. T., et al. (2019). Lower Mineralizability of Soil Carbon with Higher Legacy Soil Moisture. Soil Biol. Biochem. 130, 94–104. doi:10.1016/j.soilbio.2018.12.006
Davidson, E. A., and Janssens, I. A. (2006). Temperature Sensitivity of Soil Carbon Decomposition and Feedbacks to Climate Change. Nature 440, 165–173. doi:10.1038/nature04514
Davidson, E. A., Trumbore, S. E., and Amundson, R. (2000). Soil Warming and Organic Carbon Content. Nature 408, 789–790. doi:10.1038/35048672
Evans, S. E., Wallenstein, M. D., and Burke, I. C. (2014). Is Bacterial Moisture Niche a Good Predictor of Shifts in Community Composition under Long-Term Drought? Ecology 95, 110–122. doi:10.1890/13-0500.1
Falloon, P., Jones, C. D., Ades, M., and Paul, K. (2011). Direct Soil Moisture Controls of Future Global Soil Carbon Changes: An Important Source of Uncertainty. Glob. Biogeochem. Cycles 25, 14. doi:10.1029/2010gb003938
Farrar, J., Boddy, E., Hill, P. W., and Jones, D. L. (2012). Discrete Functional Pools of Soil Organic Matter in a UK Grassland Soil Are Differentially Affected by Temperature and Priming. Soil Biol. Biochem. 49, 52–60. doi:10.1016/j.soilbio.2012.02.018
Franzluebbers, A. J., Haney, R. L., and Hons, F. M. (1999). Relationships of Chloroform Fumigation-Incubation to Soil Organic Matter Pools. Soil Biol. Biochem. 31, 395–405. doi:10.1016/s0038-0717(98)00142-4
Franzluebbers, A. J., Haney, R. L., Hons, F. M., and Zuberer, D. A. (1996). Active Fractions of Organic Matter in Soils with Different Texture. Soil Biol. Biochem. 28, 1367–1372. doi:10.1016/s0038-0717(96)00143-5
Franzluebbers, A. J. (1999). Microbial Activity in Response to Water-Filled Pore Space of Variably Eroded Southern Piedmont Soils. Appl. Soil Ecol. 11, 91–101. doi:10.1016/s0929-1393(98)00128-0
Frostegård, Å., and Bååth, E. (1996). The Use of Phospholipid Fatty Acid Analysis to Estimate Bacterial and Fungal Biomass in Soil. Biol. Fertil. Soils 22, 59–65.
Gee, G. W., and Or, D. (2002). “Particle-size Analysis,” in Methods of Soil Analysis, Part 4 – Physical Methods. Editors J. H. Dame, and G. C. Topp (Madison, WI: Soil Science Society of America), 255–293.
George, T. S., Simpson, R. J., Gregory, P. J., and Richardson, A. E. (2007). Differential Interaction of Aspergillus niger and Peniophora Lycii Phytases with Soil Particles Affects the Hydrolysis of Inositol Phosphates. Soil Biol. Biochem. 39, 793–803. doi:10.1016/j.soilbio.2006.09.029
German, D. P., Chacon, S. S., and Allison, S. D. (2011a). Substrate Concentration and Enzyme Allocation Can Affect Rates of Microbial Decomposition. Ecology 92, 1471–1480. doi:10.1890/10-2028.1
German, D. P., Weintraub, M. N., Grandy, A. S., Lauber, C. L., Rinkes, Z. L., and Allison, S. D. (2011b). Optimization of Hydrolytic and Oxidative Enzyme Methods for Ecosystem Studies. Soil Biol. Biochem. 43, 1387–1397. doi:10.1016/j.soilbio.2011.03.017
Griffiths, R. I., Whiteley, A. S., O'Donnell, A. G., and Bailey, M. J. (2003). Physiological and Community Responses of EstablishedGrassland Bacterial Populations to WaterStress. Appl. Environ. Microbiol. 69, 6961–6968. doi:10.1128/aem.69.12.6961-6968.2003
Gu, L., Pallardy, S. G., Hosman, K. P., and Sun, Y. (2015). Drought-influenced Mortality of Tree Species with Different Predawn Leaf Water Dynamics in a Decade-Long Study of a central US forest. Biogeosciences 12, 2831–2845. doi:10.5194/bg-12-2831-2015
Günal, E., Erdem, H., and Demirbaş, A. (2018). Effects of Three Biochar Types on Activity of β-glucosidase Enzyme in Two Agricultural Soils of Different Textures. Arch. Agron. Soil Sci. 64, 1963–1974. doi:10.1080/03650340.2018.1471205
Guntinas, M. E., Gil-Sotres, F., Leirós, M. C., and Trasar-Cepeda, C. (2013). Sensitivity of Soil Respiration to Moisture and Temperature. J. Soil Sci. Plant Nutr. 13 (2), 445–461.
Guo, J., Yang, Y., Chen, G., Xie, J., and Yang, Z. (2014). Carbon Mineralization of Chinese Fir (Cunninghamia Lanceolata) Soils under Different Temperature and Humidity Conditions. Acta Ecologica Sinica 34, 66–71. doi:10.1016/j.chnaes.2013.11.008
Hao, Y. B., Zhou, C. T., Liu, W. J., Li, L. F., Kang, X. M., Jiang, L. L., et al. (2017). Aboveground Net Primary Productivity and Carbon Balance Remain Stable under Extreme Precipitation Events in a Semiarid Steppe Ecosystem. Agric. For. Meteorology 240-241, 1–9. doi:10.1016/j.agrformet.2017.03.006
Hassink, J. (1997). The Capacity of Soils to Preserve Organic C and N by Their Association with clay and silt Particles. Plant Soil 191, 77–87. doi:10.1023/a:1004213929699
Herbst, M., Tappe, W., Kummer, S., and Vereecken, H. (2016). The Impact of Sieving on Heterotrophic Respiration Response to Water Content in Loamy and sandy Topsoils. Geoderma 272, 73–82. doi:10.1016/j.geoderma.2016.03.002
Homyak, P. M., Blankinship, J. C., Slessarev, E. W., Schaeffer, S. M., Manzoni, S., and Schimel, J. P. (2018). Effects of Altered Dry Season Length and Plant Inputs on Soluble Soil Carbon. Ecology 99 (10), 2348–2362. doi:10.1002/ecy.2473
Ilstedt, U., Nordgren, A., and Malmer, A. (2000). Optimum Soil Water for Soil Respiration before and after Amendment with Glucose in Humid Tropical Acrisols and a Boreal Mor Layer. Soil Biol. Biochem. 32, 1591–1599. doi:10.1016/s0038-0717(00)00073-0
Jagadamma, S., Mayes, M. A., Steinweg, J. M., and Schaeffer, S. M. (2014). Substrate Quality Alters the Microbial Mineralization of Added Substrate and Soil Organic Carbon. Biogeosciences 11, 4665–4678. doi:10.5194/bg-11-4665-2014
Jenkinson, D. S., and Powlson, D. S. (1976). The Effects of Biocidal Treatments on Metabolism in Soil-V. Soil Biol. Biochem. 8 (3), 209–213. doi:10.1016/0038-0717(76)90005-5
Jian, J., Steele, M. K., Thomas, R. Q., Day, S. D., and Hodges, S. C. (2018). Constraining Estimates of Global Soil Respiration by Quantifying Sources of Variability. Glob. Change Biol. 24, 4143–4159. doi:10.1111/gcb.14301
Jobbágy, E. G., and Jackson, R. B. (2000). The Vertical Distribution of Soil Organic Carbon and its Relation to Climate and Vegetation. Ecol. Appl. 10, 423–436. doi:10.1890/1051-0761(2000)010[0423:tvdoso]2.0.co;2
Jones, D., and Willett, V. (2006). Experimental Evaluation of Methods to Quantify Dissolved Organic Nitrogen (DON) and Dissolved Organic Carbon (DOC) in Soil. Soil Biol. Biochem. 38, 991–999. doi:10.1016/j.soilbio.2005.08.012
Kaisermann, A., Maron, P. A., Beaumelle, L., and Lata, J. C. (2015). Fungal Communities Are More Sensitive Indicators to Non-extreme Soil Moisture Variations Than Bacterial Communities. Appl. Soil Ecol. 86, 158–164. doi:10.1016/j.apsoil.2014.10.009
Kandeler, E. (1990). Characterization of Free and Adsorbed Phosphatases in Soils. Biol. Fertil. Soils 9, 199–202. doi:10.1007/bf00335808
Keiluweit, M., Nico, P. S., Kleber, M., and Fendorf, S. (2016). Are Oxygen Limitations under Recognized Regulators of Organic Carbon Turnover in upland Soils? Biogeochemistry 127 (2), 157–171. doi:10.1007/s10533-015-0180-6
Kivlin, S. N., Kazenel, M. R., Lynn, J. S., Lee Taylor, D., and Rudgers, J. A. (2019). Plant Identity Influences Foliar Fungal Symbionts More Than Elevation in the Colorado Rocky Mountains. Microb. Ecol. 78, 688–698. doi:10.1007/s00248-019-01336-4
Kleber, M., Sollins, P., and Sutton, R. (2007). A Conceptual Model of Organo-mineral Interactions in Soils: Self-Assembly of Organic Molecular Fragments into Zonal Structures on mineral Surfaces. Biogeochemistry 85, 9–24. doi:10.1007/s10533-007-9103-5
Klute, A., and Dirksen, C. (1986). “Hydraulic Conductivity and Diffusivity:laboratory Methods,” in Methods of Soil Analysis.Part 1: Physical and Mineralogical Methods. Editor A. Klute (Madison, WI: American Society ofAgronomy Inc), 687–734.
Kögel-Knabner, I., Guggenberger, G., Kleber, M., Kandeler, E., Kalbitz, K., Scheu, S., et al. (2008). Organo-mineral Associations in Temperate Soils: Integrating Biology, Mineralogy, and Organic Matter Chemistry. J. Plant Nutr. Soil Sci. 171, 61–82. doi:10.1002/jpln.200700048
Li, H., Van den Bulcke, J., Wang, X., Gebremikael, M. T., Hagan, J., De Neve, S., et al. (2020). Soil Texture Strongly Controls Exogenous Organic Matter Mineralization Indirectly via Moisture upon Progressive Drying - Evidence from Incubation Experiments. Soil Biol. Biochem. 151, 108051. doi:10.1016/j.soilbio.2020.108051
Manzoni, S., Schaeffer, S. M., Katul, G., Porporato, A., and Schimel, J. P. (2014). A Theoretical Analysis of Microbial Eco-Physiological and Diffusion Limitations to Carbon Cycling in Drying Soils. Soil Biol. Biochem. 73, 69–83. doi:10.1016/j.soilbio.2014.02.008
Manzoni, S., Schimel, J. P., and Porporato, A. (2012). Responses of Soil Microbial Communities to Water Stress: Results from a Meta‐analysis. Ecology 93, 930–938. doi:10.1890/11-0026.1
Mavi, M. S., Marschner, P., Chittleborough, D. J., Cox, J. W., and Sanderman, J. (2012). Salinity and Sodicity Affect Soil Respiration and Dissolved Organic Matter Dynamics Differentially in Soils Varying in Texture. Soil Biol. Biochem. 45, 8–13. doi:10.1016/j.soilbio.2011.10.003
Moyano, F. E., Manzoni, S., and Chenu, C. (2013). Responses of Soil Heterotrophic Respiration to Moisture Availability: an Exploration of Processes and Models. Soil Biol. Biochem. 59, 72–85. doi:10.1016/j.soilbio.2013.01.002
Moyano, F. E., Vasilyeva, N., Bouckaert, L., Cook, F., Craine, J., Curiel Yuste, J., et al. (2012). The Moisture Response of Soil Heterotrophic Respiration: Interaction with Soil Properties. Biogeosciences 9, 1173–1182. doi:10.5194/bg-9-1173-2012
Mutuo, P. K., Shepherd, K. D., Albrecht, A., and Cadisch, G. (2006). Prediction of Carbon Mineralization Rates from Different Soil Physical Fractions Using Diffuse Reflectance Spectroscopy. Soil Biol. Biochem. 38, 1658–1664. doi:10.1016/j.soilbio.2005.11.020
Olsson, P. A., Bååth, E., Jakobsen, I., and Söderström, B. (1995). The Use of Phospholipid and Neutral Lipid Fatty Acids to Estimate Biomass of Arbuscular Mycorrhizal Fungi in Soil. Mycol. Res. 99, 623–629. doi:10.1016/s0953-7562(09)80723-5
Olsson, P. l. A. (1999). Signature Fatty Acids Provide Tools for Determination of the Distribution and Interactions of Mycorrhizal Fungi in Soil. FEMS Microb. Ecol. 29, 303–310. doi:10.1111/j.1574-6941.1999.tb00621.x
Or, D., Smets, B. F., Wraith, J. M., Dechesne, A., and Friedman, S. P. (2007). Physical Constraints Affecting Bacterial Habitats and Activity in Unsaturated Porous media - a Review. Adv. Water Resour. 30, 1505–1527. doi:10.1016/j.advwatres.2006.05.025
Paul, K. I., Polglase, P. J., O'Connell, A. M., Carlyle, J. C., Smethurst, P. J., and Khanna, P. K. (2003). Defining the Relation between Soil Water Content and Net Nitrogen Mineralization. Eur. J. Soil Sci. 54, 39–48. doi:10.1046/j.1365-2389.2003.00502.x
Prado, A. G. S., and Airoldi, C. (1999). The Influence of Moisture on Microbial Activity of Soils. Thermochim. Acta 332, 71–74. doi:10.1016/s0040-6031(99)00062-3
R Development Core Team, (2011). R: A Language and Environment for Statistical Computing. Vienna, Austria: R Foundation for Statistical Computing. 3-900051-07-0. Available at: http://www.R-project.org.
Raich, J. W., and Schlesinger, W. H. (1992). The Global Carbon Dioxide Flux in Soil Respiration and its Relationship to Vegetation and Climate. Tellus B 44, 81–99. doi:10.1034/j.1600-0889.1992.t01-1-00001.x
Ren, C., Zhao, F., Shi, Z., Chen, J., Han, X., Yang, G., et al. (2017). Differential Responses of Soil Microbial Biomass and Carbon-Degrading Enzyme Activities to Altered Precipitation. Soil Biol. Biochem. 115, 1–10. doi:10.1016/j.soilbio.2017.08.002
Rodeghiero, M., and Cescatti, A. (2005). Main Determinants of forest Soil Respiration along an Elevation/temperature Gradient in the Italian Alps. Glob. Change Biol. 11, 1024–1041. doi:10.1111/j.1365-2486.2005.00963.x
Scharnagl, B., Vrugt, J. A., Vereecken, H., and Herbst, M. (2010). Information Content of Incubation Experiments for Inverse Estimation of Pools in the Rothamsted Carbon Model: a Bayesian Perspective. Biogeosciences 7, 763–776. doi:10.5194/bg-7-763-2010
Schimel, J. P. (2018). Life in Dry Soils: Effects of Drought on Soil Microbial Communities and Processes. Annu. Rev. Ecol. Evol. Syst. 49, 409–432.
Schimel, J. P., Gulledge, J. M., Clein-Curley, J. S., Lindstrom, J. E., and Braddock, J. F. (1999). Moisture Effects on Microbial Activity and Community Structure in Decomposing Birch Litter in the Alaskan Taiga. Soil Biol. Biochem. 31, 831–838. doi:10.1016/s0038-0717(98)00182-5
Schjønning, P., Thomsen, I. K., Moldrup, P., and Christensen, B. T. (2003). Linking Soil Microbial Activity to Water-And Air-phase Contents and Diffusivities. Soil Sci. Soc. Am. J. 67, 156–165.
Schlesinger, W. H., and Andrews, J. A. (2000). Soil Respiration and the Global Carbon Cycle. Biogeochem. 48, 7–20. doi:10.1023/a:1006247623877
Schmidt, M. W. I., Torn, M. S., Abiven, S., Dittmar, T., Guggenberger, G., Janssens, I. A., et al. (2011). Persistence of Soil Organic Matter as an Ecosystem Property. Nature 478, 49–56. doi:10.1038/nature10386
Sierra, C. A., Trumbore, S. E., Davidson, E. A., Vicca, S., and Janssens, I. (2015). Sensitivity of Decomposition Rates of Soil Organic Matter with Respect to Simultaneous Changes in Temperature and Moisture. J. Adv. Model. Earth Syst. 7, 335–356. doi:10.1002/2014ms000358
Steinweg, J. M., Dukes, J. S., and Wallenstein, M. D. (2012). Modeling the Effects of Temperature and Moisture on Soil Enzyme Activity: Linking Laboratory Assays to Continuous Field Data. Soil Biol. Biochem. 55, 85–92. doi:10.1016/j.soilbio.2012.06.015
Stott, D. E., Andrews, S. S., Liebig, M. A., Wienhold, B. J., and Karlen, D. L. (2010). Evaluation of β-Glucosidase Activity as a Soil Quality Indicator for the Soil Management Assessment Framework. Soil Sci. Soc. Am. J. 74, 107–119. doi:10.2136/sssaj2009.0029
Su, F., Wang, F., Li, Z., Wei, Y., Li, S., Bai, T., et al. (2020). Predominant Role of Soil Moisture in Regulating the Response of Ecosystem Carbon Fluxes to Global Change Factors in a Semi-arid Grassland on the Loess Plateau. Sci. Total Environ. 738, 139746. doi:10.1016/j.scitotenv.2020.139746
Taboada, M. A. (2003). in Soil Shrinkage Characteristics in Swelling Soils (Trieste: College on Soil Physics). doi:10.1016/j.scitotenv.2020.139746
Thomas, G. W. (1996). “Soil pH and Soil Acidity,” in Methods of SoilAnalysis, Part 3 – Chemical Methods. Editor D. L. Sparks (Madison,Wisconsin, USA: Soil Science Society of America), 475–490.
Thomsen, I. K., Schjønning, P., Jensen, B., Kristensen, K., and Christensen, B. T. (1999). Turnover of Organic Matter in Differently Textured Soils. Geoderma 89, 199–218. doi:10.1016/s0016-7061(98)00084-6
Trumbore, S. E. (1997). Potential Responses of Soil Organic Carbon to Global Environmental Change. Proc. Natl. Acad. Sci. 94, 8284–8291. doi:10.1073/pnas.94.16.8284
Wang, G., Huang, W., Mayes, M. A., Liu, X., Zhang, D., Zhang, Q., et al. (2019). Soil Moisture Drives Microbial Controls on Carbon Decomposition in Two Subtropical Forests. Soil Biol. Biochem. 130, 185–194. doi:10.1016/j.soilbio.2018.12.017
Wang, W. J., Dalal, R. C., Moody, P. W., and Smith, C. J. (2003). Relationships of Soil Respiration to Microbial Biomass, Substrate Availability and clay Content. Soil Biol. Biochem. 35, 273–284. doi:10.1016/s0038-0717(02)00274-2
Warner, D. L., Bond-Lamberty, B., Jian, J., Stell, E., and Vargas, R. (2019). Spatial Predictions and Associated Uncertainty of Annual Soil Respiration at the Global Scale. Glob. Biogeochem. Cy. 7, 983.
Williams, M. A. (2007). Response of Microbial Communities to Water Stress in Irrigated and Drought-Prone Tallgrass Prairie Soils. Soil Biol. Biochem. 39, 2750–2757. doi:10.1016/j.soilbio.2007.05.025
Wood, J. D., Knapp, B. O., Muzika, R. M., Stambaugh, M. C., and Gu, L. (2018). The Importance of Drought–Pathogen Interactions in Driving Oak Mortality Events in the Ozark Border Region. Environ. Res. Lett. 13, 015004. doi:10.1088/1748-9326/aa94fa
Yan, Z., Bnd-Lamberty, B., Todd-Brown, K. E., Bailey, V. L., Li, S., Liu, C., et al. (2018). A Moisture Function of Soil Heterotrophic Respiration That Incorporates Microscale Processes. Nat. Commun. 9 (1), 1–10.
Zhou, W., Hui, D., and Shen, W. (2014). Effects of Soil Moisture on the Temperature Sensitivity of Soil Heterotrophic Respiration: a Laboratory Incubation Study. PLoS One 9, e92531. doi:10.1371/journal.pone.0092531
Zhou, X., Chen, C., Wang, Y., Xu, Z., Han, H., Li, L., et al. (2013). Warming and Increased Precipitation Have Differential Effects on Soil Extracellular Enzyme Activities in a Temperate Grassland. Sci. Total Environ. 444, 552–558. doi:10.1016/j.scitotenv.2012.12.023
Keywords: microbial respiration, soil moisture content, soil texture, mineralization rate, extracellular enzyme activity 3
Citation: Singh S, Jagadamma S, Liang J, Kivlin SN, Wood JD, Wang G, Schadt CW, DuPont JI, Gowda P and Mayes MA (2021) Differential Organic Carbon Mineralization Responses to Soil Moisture in Three Different Soil Orders Under Mixed Forested System. Front. Environ. Sci. 9:682450. doi: 10.3389/fenvs.2021.682450
Received: 18 March 2021; Accepted: 04 June 2021;
Published: 22 June 2021.
Edited by:
Rosa Francaviglia, Council for Agricultural and Economics Research, ItalyReviewed by:
Stefano Manzoni, Stockholm University, SwedenNicola Dal Ferro, University of Padua, Italy
Copyright © 2021 Singh, Jagadamma, Liang, Kivlin, Wood, Wang, Schadt, DuPont, Gowda and Mayes. This is an open-access article distributed under the terms of the Creative Commons Attribution License (CC BY). The use, distribution or reproduction in other forums is permitted, provided the original author(s) and the copyright owner(s) are credited and that the original publication in this journal is cited, in accordance with accepted academic practice. No use, distribution or reproduction is permitted which does not comply with these terms.
*Correspondence: Sindhu Jagadamma, c2phZ2FkYTFAdXRrLmVkdQ==