 Philipp Censkowsky
 Ilona M. Otto
- 1Guest Researcher at Potsdam Institute for Climate Impact Research, Research Domain I-Earth System Analysis, Potsdam, Germany
- 2Professor in Societal Impact of Climate Change at Wegener Center for Climate and Global Change, University of Graz, Graz, Austria
- 3Project Leader at Potsdam Institute for Climate Impact Research, Research Domain I-Earth System Analysis, Potsdam, Germany
This paper takes a new look on transition processes in social-ecological systems, identified based on household use of direct ecosystem services in a case study in KwaZulu-Natal, South Africa. We build on the assumption that high dependence on local ecosystems for basic needs satisfaction corresponds to a “green loop” type of system, with direct feedbacks between environmental degradation and human well-being. Increasing use of distant ecosystems marks a regime shift and with that, the transition to “red loops” in which feedbacks between environmental degradation and human well-being are only indirect. These systems are characterized by a fundamentally different set of sustainability problems as well as distinct human-nature connections. The analysis of a case study in KwaZulu-Natal, South Africa, shows that social-ecological systems identified as green loops in 1993, the average share of households using a characteristic bundle of direct ecosystem services drops consistently (animal production, crop production, natural building materials, freshwater, wood). Conversely, in systems identified as red loops, mixed tendencies occur which underpins non-linearities in changing human-nature relationships. We propose to apply the green to red loop transition model to other geographical contexts with regards to studying the use of local ecosystem services as integral part of transformative change in the Anthropocene.
Introduction
In sustainability research the concept of regime shifts has repeatedly been referred to as a fundamental re-organization of a system, typically resulting in irreversible biophysical change (Scheffer et al., 2001; Biggs et al., 2012; Lade et al., 2013). The rise of global capitalism as the dominant system of production has led to an increase of the frequency and scale of shifting regimes (Millennium Ecosystem Assessment 2005; McMichael 2009; Moore 2015). Several modeling approaches are used to demonstrate the ecological and economic impacts regime shifts create (e.g., Folke et al., 2004; Lade et al., 2013; Levin et al., 2013; SRC 2019). Further transgressing planetary boundaries puts the Earth system at risk of being pushed into an entirely new state (e.g., Steffen et al., 2015). In the Anthropocene, referred to as a beginning new geological epoch in which human activity became the driving force of change, this could mark a regime shift at unprecedented scale (e.g., Steffen et al., 2018).
However, the focus on changing biophysical and economic properties in shifting regimes largely leaves aside relational shifts between humans and the ecosystems they co-inhabit. This concerns manifold types of relations, including metabolic, cultural or spiritual relationships of humans and surrounding ecosystems and questions in how far regime shifts alter such relationships. Despite an increasing recognition of the interconnectedness between natural and human system components, to date, examining this interface between human and non-human nature in social-ecological system (SES) research is under-researched. This is likely due to a persistent dichotomic understanding of human-nature relationships in modern science (Moore 2015; Weber 2016). Moving beyond conceptions of nature as a mechanical-causal object, both ontologically and epistemologically, will require a similar paradigmatic shift than the supersession of Newtonian physics by quantum physics at the beginning of the 20th century (ibid.). This being an aspiration beyond the purpose and possibility of this paper, we aim to establish an entry point to examine “fundamental shifts in perspectives, world views and institutions” (Folke et al., 2011, 719) required to reconnect humans to the biosphere and transform toward more stable and just regimes in SES.
To explore this dimension of regime shifts, we use household level data on the use of direct ecosystem provisioning services (ES)1 required to satisfy basic needs to understand such relational shifts in the interaction between human and non-human counterparts in SES. In doing so, we extend a methodological approach developed by Hamann et al. (2015) identifying SES based a characteristic bundle of ES, including energy, food, water and shelter. These authors use cross-sectional data. The novelty of the research is underpinned by the use of panel data which permits to analyze the dimension of time in shifting regimes. This is examined in the case study area in KwaZulu-Natal, South Africa, over the period 1993 and 2011.
Conceptually, the approach is rooted in the “green-to-red loop” transition model that was developed by Cumming et al. (2014) and aims to understand implications of agricultural transitions and urbanization for ES. In this model, two archetypal systems exist. On the one hand, “green loops”, or rural-agricultural systems, which are characterized as types of SES in which households tend to heavily rely on locally sourced (direct) ES to satisfy basic needs, e.g., subsistence farming of crops and animals, self-collection of wood for energy, use of locally available building materials for shelter or the fetching of water. In these systems there are direct feedback mechanisms between environmental integrity and human well-being. The authors further describe a “green trap” as the consequence of ecological breakdown caused by overexploitation and degradation of the local natural resource base and reinforced by rural poverty (ibid.).
Contrarily to that, “red loops” or urban-industrialized systems denote a type of SES in which households largely rely on faraway (indirect) ES to satisfy the same basic needs. This tends to occur through marketized, transported and packaged ES in a monetary economy. Thus, the economy is built on remote extraction of ES from distant ecosystems which involves a much larger complexity, scale and degree of the division of labor. A “red trap” is described as the consequence of excessive consumption and failure to regulate ecological decline as an economy’s resource needs are scaled up. In these systems, the connections to ecosystems are “less obvious and immediate” than in green loops (ibid., p.55). To avoid environmental collapse, both types of systems need to fundamentally re-organize and address distinct sustainability challenges and avoid green or red traps, respectively (Figure 1).
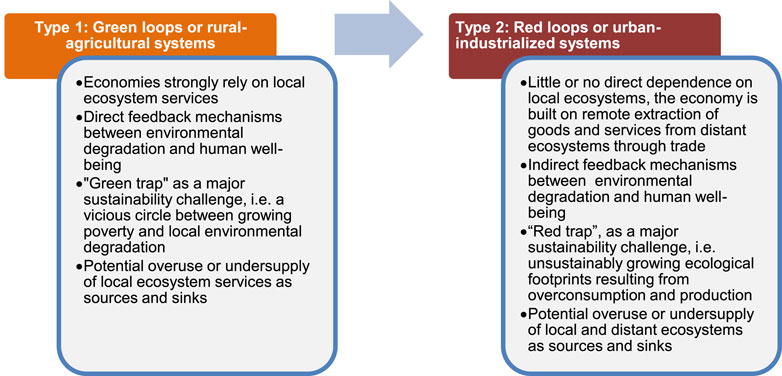
FIGURE 1. Characteristics of green and red loops and related sustainability challenges. Based on Cumming et al. (2014) and Hamann et al. (2015).
The transition from green to red loops involves a variety of historically specific and interrelated factors (Folke et al., 2004; Cumming et al., 2014). This typically leads to gradually shifting regimes. However, regime shifts can also occur abruptly, for instance when slowly changing variables concur with an external shock that can “tip” the entire system into an alternative state (Biggs et al., 2012). One example of the latter are coral reefs or grasslands have been found highly sensible to invading species (e.g., Levin et al., 2013). Here, the more narrowly a system is defined, the higher the likelihood to find variables that abruptly change in response to shocks or stressors. In systems at higher forms of aggregation it becomes increasingly complex to identify critical thresholds that mark a regime shift. We focus our analysis on the household use of ecosystem services which serve as provisioning systems - and depending on the type of use - may indicate the occurence of a regime shift.
The paper proceeds as follows. The section Methods and data presents the case study area as well as the methods and data used to identify regime shifts from changing ES use. The section Results presents the changing ES use in the case study area of KwaZulu-Natal in the observation period between 1993 and 2011. Moreover, the spatial distribution is mapped using official shapefile data from the year 2011. The subsequent section discusses the findings focusing on empirical challenges related to the study of regime shifts within archetypal analysis (e.g., Eisenack et al., 2019). The last section provides an outlook on using the presented approach to studying variegated human-nature relationships in the context of transformative change.
Methods and Data
Case Study Area and Data
KwaZulu-Natal is one of nine provinces in the south-east of South Africa (Figure 2A). It covers with 9.335.137 hectares some eight percent of South Africa’s total land area and with over 10 million inhabitants more than 20 percent of the total population (Stats SA 2012a; Driver et al., 2015). Important economic activities are extractive industries like coal and iron, tourism and trade logistics that revolve around the economic hub Durban which is not only the third largest city of South Africa but also hosts the largest maritime port in Southern Africa. The population in the most recent census was composed of Africans (86.8%), Asians (7.4%), Whites (4.2%) and Coloreds (1.4%). In most of the province, the main language is Zulu, alongside with Xhosa, English and Afrikaans (Stats SA 2012b). Politically, KwaZulu-Natal is divided into 11 district municipalities and 44 local municipalities (Figure 2B). This study uses the local municipality as main spatial unit of observation.
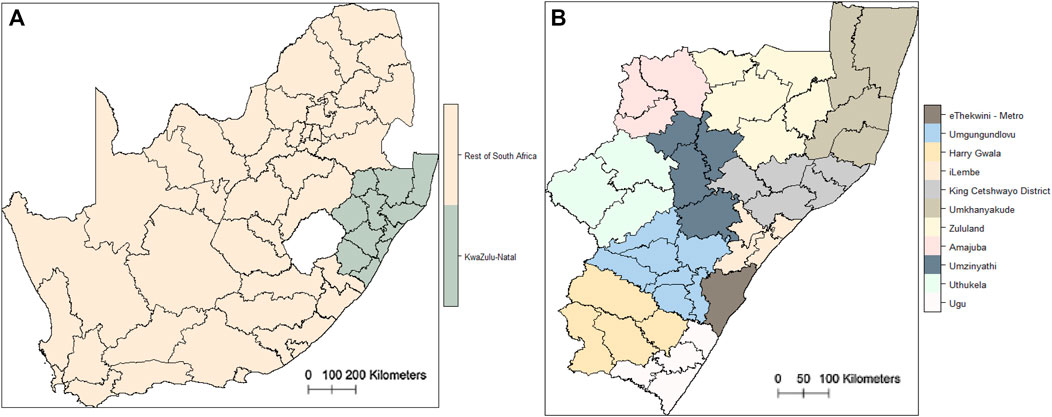
FIGURE 2. (A) Location of KwaZulu-Natal in SA. District municipality borders are shown. (B) District municipalities in KwaZulu-Natal. Local municipality borders are shown. Data: Official shapefiles from the South African Demarcation Board (2016).
Historically, the arrival of the British in the 19th century initiated the enclosure of immense areas for sugar cane plantations that required large amounts of low-skilled labor. Colonization thus paved the way for today’s agro-industry and forestry. Sugar cane and timber plantations together are the dominating land use category in KwaZulu-Natal today and represent some 12% of the total land area (Driver et al., 2015). Next to this, degraded or fallow land represents some 8%, subsistence agriculture 7%, built-up areas 2% of total land cover. Land classified as “natural land” decreased from 66% in 2005 to 59% in 2008 (ibid.). KwaZulu-Natal is one of the few provinces in SA in which the rates of land use conversion loss are currently high enough to potentially irreversibly lose natural habitat within the next 3 decades (Driver, Sink, and Nel 2012). The threat of losing vital ecosystem services through land conversion underpins the relevance of choosing this geography with regard to their use by households.
The study relies on data from the “KwaZulu-Natal Income Dynamics Study (KIDS)”, the first ever collected set of panel data containing information on ES use based on questions regarding basic needs satisfaction of households. The data set followed an initial set of 1,519 households and spans back until before the end of apartheid in 1993 (University of KwaZulu-Natal 2004). For selected variables, KIDS data is comparable to the second data source, national census data from 2011 (Stats SA, 2012b). In South Africa, census data is collected every 10 years with an expected next release in 2022, a year in which this analysis could potentially be updated. Using both data sources permits the study to observe not only the distribution of different types of SES but also ES use dynamics within each type of system. The data sets are representative at the respective level of aggregation and population weights have been used to calculate the results. Lastly, the results from survey data are mapped and spatially represented using the most recent and official shapefile data downloaded from the South African Demarcation Board (2016). Note that several municipal border changes inhibited a consistent spatial analysis of KIDS data.
Understanding Regime Shifts From Direct Ecosystem Service Use in Social-Ecological Systems
We propose to use household-level data on direct ES use as a proxy for the underlying dynamics of SES building on the premise that there exist characteristic bundles of ES that represent “integrated expressions of different underlying social-ecological systems” (Hamann et al., 2015, 218). A similar bundle has been chosen from 2011 census data according to local circumstances and data availability by these authors reflecting vital basic needs, including variables that indicate how food, energy, shelter and water are accessed (Table 1-Composition of the characteristic bundle of ES adopted from Hamann et al. (2015) for both census and KIDS data.). The main difference is that in several cases, KIDS data is more detailed. For instance, in the KIDS data set, additional information exists on the frequency with which households self-collect wood per week as well as the number of household members engaged in self-collection of wood. Conversely, census data only indicates the main source of energy for cooking or heating, among “wood” is one out of several possible sources. In such cases, the minimum common denominator between the two datasets has been chosen with regards to enhancing consistency across data waves.
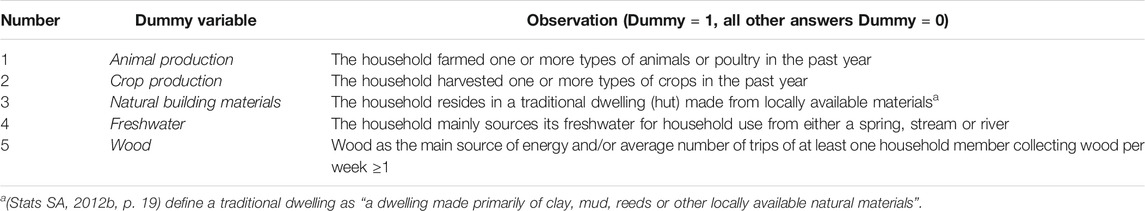
TABLE 1. Composition of the characteristic bundle of ES adopted from Hamann et al. (2015) for both census and KIDS data.
ES use data are assumed to be expressive of the metabolic relationship each household2 with their surrounding ecosystems. Such metabolic relationships can be indicative of variegated relational forms between the human and non-human counterparts of a system, including cultural, spiritual or economic relationships. Uses of other ES are likely to be correlated with the use of the five ES but cannot be included in the characteristic bundle due to the lack of purpose-collected data. Indeed, many studies underpin the importance of hundreds of wild resources as significant components of livelihood constituencies in Sub-Saharan Africa, especially in rural areas (Cavendish 2000; Shackleton and Shackleton 2011; Neves 2017). Thus, the assumption also implies a higher likelihood that households which satisfy their basic needs with the chosen bundle of direct ES also make use of a larger basket of natural (or “wild”) resources. This underpins the characteristics found for green loops. Conversely, in red loops the approach rests on the assumption that non-use of direct ES implies the reliance on distant ecosystems. As a corollary, red loop dynamics presuppose an economic system able to extract, transport and distribute the ES necessary for basic needs, a high degree of the division of labor, a high degree of the regional or supra-regional integration of value chains as well as a potentially higher material-energy throughput of the system due to economies of scale and scope. A last necessary assumption for the approach taken is the premise that green and red loops form spatial units which are relatively coherent (Hamann et al., 2015). The scale of these units depends on spatial explicitness of survey data and the possibilities to cross-link ES use data with geospatial information. As described further below, in this study we use the local municipality as the spatial unit of observation, and analyze household characteristics of changing ES use within these units. The main premises of this approach are summarized in Table 2.
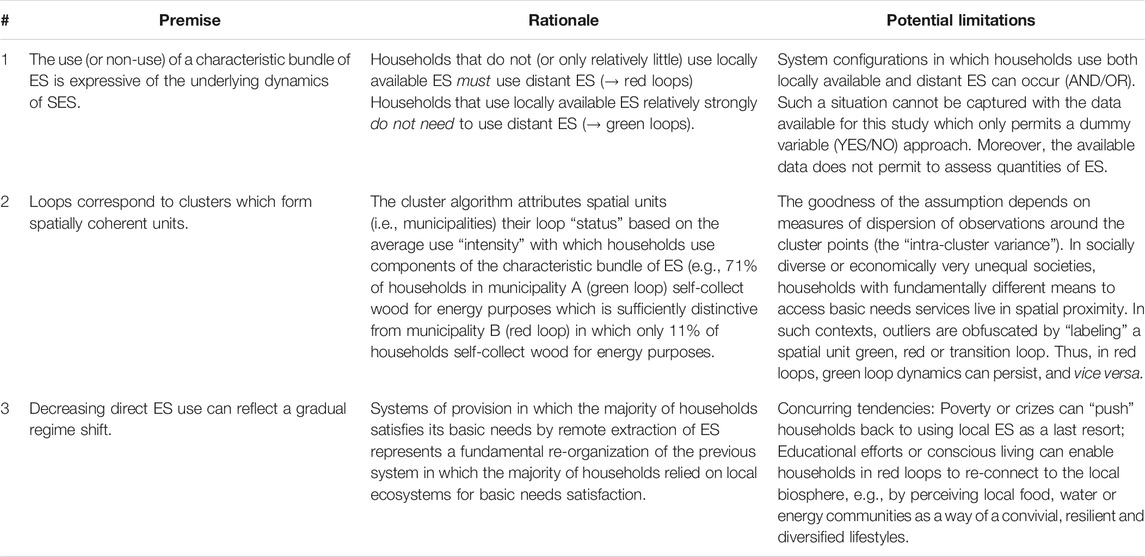
TABLE 2. Main premises of the methodological approach, including their rationale and potential limitations.
The type of loop is identified using a kmeans cluster algorithm which groups units (=local municipalities) with the highest average direct ES use into green loops and units with the lowest average direct ES use into red loops. Following Hamann et al. (2015), a third category of SES (so-called “transition loops”) is included in the analysis in addition to green and red loops. The choice of three clusters was validated using the clValid package in R fitting the optimal number of clusters for comparability.
The procedure to identify loop types based on household-level use of the characteristic bundle of ES at local municipality level is as follows:
1. Determine the average share of households using individual ES (n = 5) at local municipality level (n = 44) and by year (n = 4)
2. Run a calibrated kmeans cluster algorithm to subdivide the 44 municipalities into clusters of high similarity: green loop (= high average use), transition loop (= medium average use) and red loops (= low average use) in the first year of the observation
3. Visualize the within-cluster change of average ES use in subsequent years comparing with the initial 1993 cluster solution
4. Spatially map the results of the analysis connecting geospatial data (official shapefiles) to spatial information contained in socio-economic survey data, where possible3
K means-clustering relies on the Hartigan-Wong algorithm (Wong and Hartigan, 1979). The algorithm minimizes the within sum of squares given by:
where WSS is the within sum of squares or total intra-cluster variance, Ck is one out of k ε {1,2,3} clusters, xi represents the individual data observation of a single municipality and μk the mean value of all municipalities clustered in k. The method picks random starting values for each of the groups (n = 25) and allocates individual observations to one of the three groups corresponding to the lowest WSS defined by numerical iteration (n = 10.000). By minimizing the WSS for each random starting point, the algorithm converges against pre-defined centroids that contain the least dissimilar observations. These centroids correspond to the amount of clusters (k = 3) based on internal and stability tests performed in the stats package in R as well as for comparison with Hamann et al. (2015). The distance between each centroid indicates the degree of similarity (or dissimilarity) between the three types of systems. As there is no predefined threshold (e.g. a minimum share of households that using an ES), the cluster algorithm will always find three solutions even if use intensities across all municipalities are comparable. Since we are interested in the question how average ES use intensities change over time within clusters, in subsequent section we use the kmeans clustering to identify the distribution of loop types in 1993–the first year for which ES use data is available. In a subsequent step, we analyze the average ES use intensities in subsequent data collection waves in 1998 and 2004 within the loops identified in 1993. This permits to observe the within-system dynamics of changing ES use which is illustrated by colored lines in Figure 3. The same figure indicates through stars the 2011 cluster solution as observed from census data for comparison. The line is not continuous since the 2011 value can only serve as a comparison. Due to limitations stemming from differences in the data structure (e.g., in sample sizes, geographical aggregation as well as questionnaires) we decided to use stars instead of a continuous line to indicate some reservation when comparing KIDS and census data.
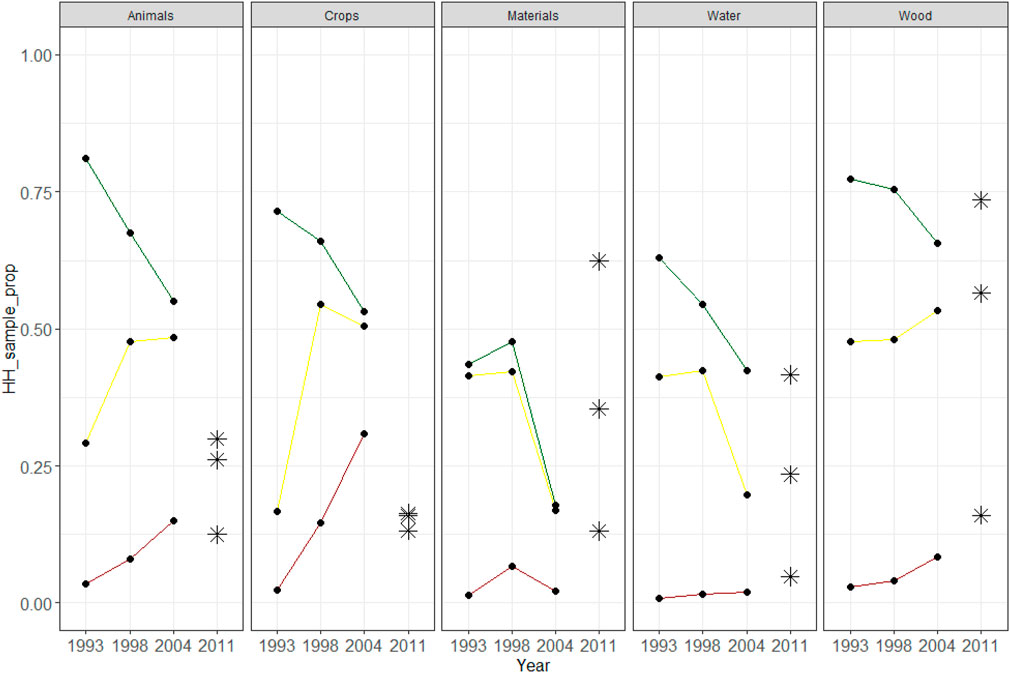
FIGURE 3. Evolution of average direct ES use in KwaZulu-Natal between 1993 and 2004 at municipality level. Green lines correspond to green loops yellow lines to transition loops and red lines to red loops. Results from 2011 reported with stars for comparison. Standard errors (se) are within the range of se ε (0.008; 0.042). Data: KIDS 1993–2004 and 2011 census data. Note: The analysis relies on the clustering of a municipality as green, transition or red loop in 1993 to observe changes within that municipality over subsequent data collection waves. Due to limited comparability between KIDS and census data and some inconsistencies seem apparent (e.g., “Materials” where the data waves between 2004 and 2011 are not reasonably comparable).
Results
Overall Trends and Characteristics Between 1993 and 2011
Direct ES use changed substantively in all three types of SES, green, transition and red loops, over the period between 1993 and 2011 (Figure 3). When interpreting these tendencies, it is important to keep the share of households per type of loop in mind. In 1993, some 54% of all households in the KIDS sample were living in spatial units classified as red loops. Thus, more than half of the households in the sample already lived in red loops when the period of observation begins. By 2011, their share rose to 62% in 2011 in the census population. This potentially reflects the continuation of a gradual regime which has been ongoing since many decades. Moreover, in 1993, 16% of all households in the KIDS sample were living in spatial units classified as green loops, a share which decreased to 14% in the 2011 census population. Also, the share of households living in transition loops first increased from 30% in 1993 to 32 and 38% in 1998 and 2004, respectively, and drops to 24% in the census population in 2011.4 Also this trend reflects the expected linear change away from green loops and toward red loops. However, non-linearities exist in the co-evolution of the type of loops. This is visible from several jump discontinuities in the graph, e.g., for the use of locally available natural building materials. More importantly, this can be seen in opposing tendencies of ES use between green and transition or red loops. While the average ES use in green loops drops, it augments at the same time in transition or red loops, especially for the variables concerning food (animal and crop production) and wood. That households increasingly use local ecosystems to satisfy basic needs in the case study area is underpinned by the fact that between 2005 and 2011 the land cover area in KwaZulu-Natal used for subsistence agriculture almost tripled (Driver et al., 2015).
With few exceptions, k means clustering identifies sufficiently dissimilar ES use across the three types of SES. This can be seen through the distance between the black dots (or stars, for census data) in each year of data observation. The black dots (or stars, for census data) indicate the average share of households using an individual bundle component in a respective cluster and year. One exception for poor variance across clusters is the US “crops” and “animals” in 2011, where we see that the share of households using this individual ES does barely vary across clusters. This may be explained by the fact that in South Africa there exists a separate census for agricultural households potentially rendering data quality in the standard survey comparatively poor.
The use of ES were found to correlate significantly with one another and we can reasonably expect that households using multiple components of the characteristic bundle of ES also use many more ES not comprised by the bundle (Hamann et al., 2015; Shackleton and Shackleton 2011). In KwaZulu-Natal, the strongest correlations in the KIDS panel data set were found between the use fuelwood and natural building materials (r = 0.49) as well as fuelwood and water from a natural source (r = 0.41). The least correlated is crop use with sourcing water from a natural source (r = 0.037). Table 3 provides an overview of all correlation coefficients of bundle components as observed for KwaZulu-Natal from census data in the year 2011.
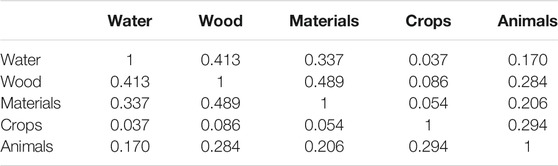
TABLE 3. Correlation coefficients between the five components of the characteristic bundle of ES.
By Type of Social-Ecological System
In systems identified as green loops in 1993, the average share of households using direct ES from local ecosystems decreased consistently for all five components of the characteristic bundle of ES (Figure 3, green lines). Most notably, food-related provisioning services (animal and crop farming) and the use of natural building materials dropped over period of 18 years under observation. Locally sourced water and fuelwood use dropped less rapidly and remain on a comparatively high level in 2004 and 2011. In systems identified as transition loops in 1993, mixed tendencies are observed across the five components of the characteristic bundle of ES (Figure 3, yellow lines). Food-related ES (animal and crop farming) and locally collected fuelwood use become relatively more important to households’ livelihoods, while natural building material use and water use from local sources significantly drop. The sudden surge of a food and energy-related provisioning services can indicate the exposure of households to food insecurity or economic hardship. In systems identified as red loops in 1993, also mixed tendencies occur across the five components of the characteristic bundle of ES, comparable to the tendencies in transition loops (Figure 3, red lines). Food-related ES (animal and crop farming) and fuelwood from local sources become relatively more important to households’ livelihoods, while natural building material and water use from local sources are oscillating relatively little, remaining on levels of below 10% across all data waves.
By Type of Ecosystem Service
The importance of the characteristic bundle of direct ES for livelihoods varies. Clear tendencies can only be observed for the provision of drinking water and fuelwood. In all three types of systems, households decreasingly depend on natural sources for their drinking water. This is likely to be due to the increased supply of municipal tab water which has been one key pillar of urban and rural development strategies of post-apartheid South Africa. In the case of fuelwood, households seem to become increasingly reliant. Despite almost 78% of households using electricity for lighting in 2011 (Stats SA, 2012b), fuelwood continues to remain a very significant and increasingly important source of energy for cooking and heating. Across the three system types, fuelwood is used on average by 74% of all households in green loops, some 57% transition loops and some 16% in red loops. This mirrors studies that examine the continued strong use of fuelwood and in Sub-Saharan Africa (e.g., Dovie, Witkowski, and Shackleton 2004; Neves 2017). Given its importance, we conducted a first estimate of biophysical quantities of annual household use of fuelwood (Table 4). Provided that energy efficiency parameters, for instance, with regard to cookstoves, did not significantly change over the observation period, we assume that the total annual fuelwood consumption is strongly correlated with population growth which was between 1996 and 2011 more than 20% (Stats SA, 2012b). Moreover, the results in Figure 3 indicate that the share of households using fuelwood as primary energy source increased since 1993, especially in transition and red loops.
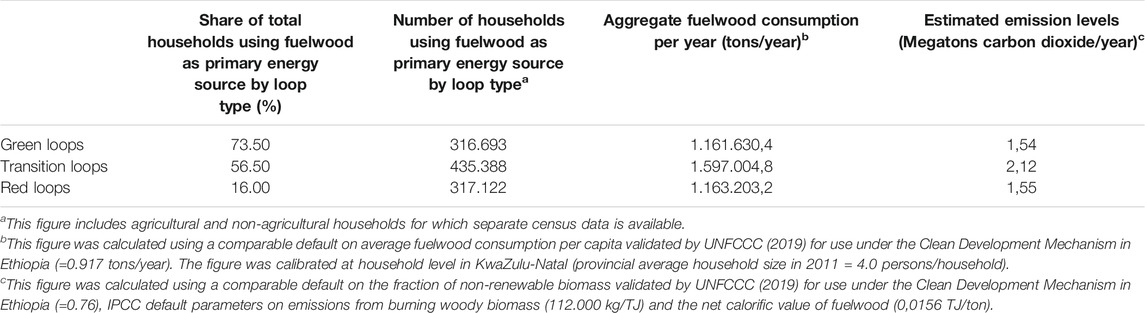
TABLE 4. Estimate of annual fuelwood consumption in KwaZulu-Natal.
Natural building materials are decreasingly used to a lesser extent across all types of systems. The sudden drop of households indicating to live in dwellings made of locally available materials in 1998 however is due to a data inconsistency between KIDS and census data. Due to the higher representativeness, census data should ultimately be preferred for interpretation and it is likely that KIDS underestimated the number of households living in dwellings made of locally available materials. Moreover, food-related direct ES have seen a strong decrease in green loops and opposed to that, an increasing trend in transition and red loops. This is interesting in so far as that while in green loops self-grown food decreases in relative importance, in transition and red loops, they strongly increase between 1993 and 2004 and approximate levels comparable to green loops. Comparing the KIDS data to census data is also here possible only with reservation. Yet, given that red loops and transition loops represent over 65% of the total land area of KwaZulu-Natal, the finding is consistent with the most recent physical account of land cover change between 2005 and 2011 which showed that subsistence agricultural land increased almost by a factor of three between 2005 and 2011. Moreover, the increasing share of subsistence agriculture in red loops may be interpreted as a rising interest in urban agriculture, a trend found of particular relevance in urban townships (Coetzee and Van Averbeke 2011).
Which ecosystem services in which spatial unit are used is a function of biophysical supply of ES and socio-economic and political factors (SRC 2011; Biggs et al., 2012). The combination of these factors eventually defines the properties of the emerging system. In KwaZulu-Natal the biophysical supply of ES varies across municipalities (SANBI 2018). This variance highlights another limitation of our approach which implicitly assumes an equal distribution of biophysical supplies across KwaZulu-Natal. This is because we define the characteristic bundle of ES uniformly across all municipalities, regardless of whether analyzing the mountainous hinterland with continental climate of the province or the coastal belt with milder climatic conditions. Hamann et al. (2015) use additional variables like the local supply of wood, the mean annual runoff of water and the grazing and cultivation potential of municipalities to predict the type of loop with biophysical supply factors. This type of analysis could also be extremely valuable, especially when linking the question of the quality of biophysical supplies to dynamics of green or red traps. With the data available for this study, we only conducted an additional analysis to predict the ES use intensity from social factors (e.g., household income, gender of household head etc.). Since this type of causality analysis is not the focus of this paper, the preliminary results are presented in Supplementary Table A2.
Spatial Distribution of Loop Types in 2011
The compatibility of census data with recent border demarcation in KwaZulu-Natal permits to associate green, transition and red loops with shapefile data from the South African Demarcation Board (2016). Spatially mapping SES assumes that it possible to assign clear spatial boundaries to SES whereas in reality boundaries in complex systems are likely to be less pronounced (Cilliers 2001). The emerging map of green, transition and red loops shows a clear non-random pattern of distribution in 2011 (Figure 4). Green loops appear in clusters in the north, center and south of the province while red loops dominate in the most populous coastal areas. In KwaZulu-Natal, green loops visibly overlap with the distribution former bantustan or homeland areas of South Africa where Zulu or Xhosa people were forcefully settled as an act of racial segregation by the apartheid regime (Supplementary Figure 1). Of the total number of households, 62.26% of all households in KwaZulu-Natal live in red loops, 24.21% in transition loops and 13.53% in green loops (Supplementary Table 1). This corresponds to 15, 25 and 11 local municipalities, respectively. Further research demonstrated that human wellbeing in green loops tends to be lower than in red loops (Hamann et al., 2016).
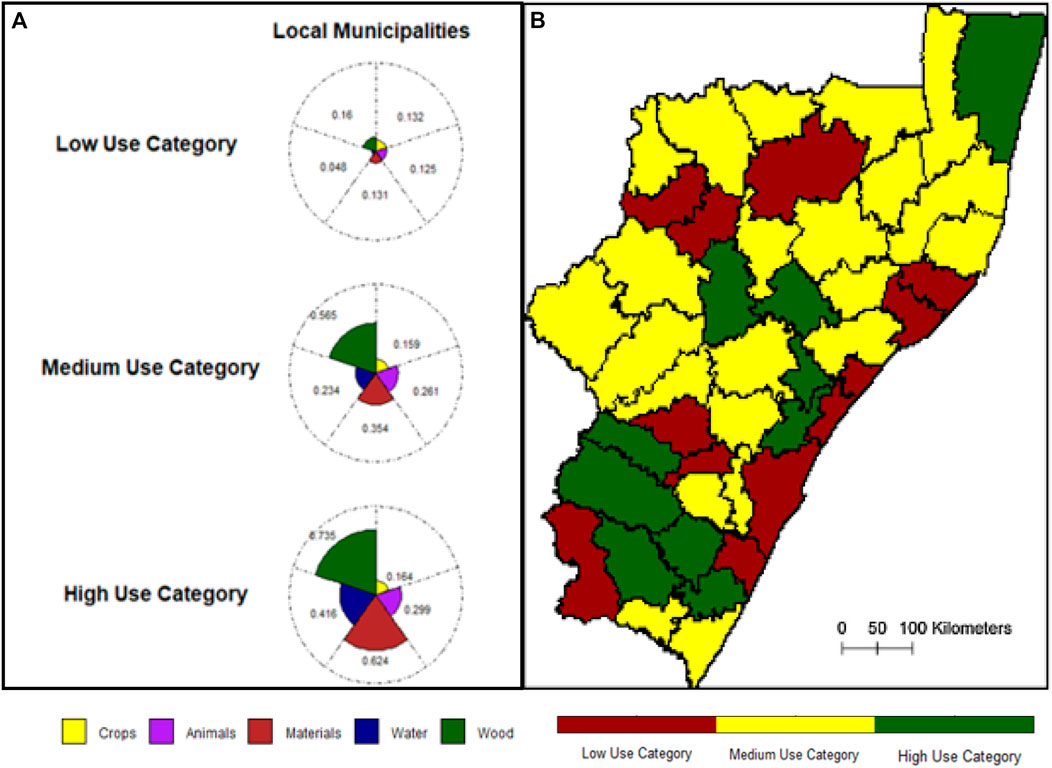
FIGURE 4. (A) Typical composition of direct ES use at municipality level. Low use category corresponds to red loops, medium to transition loops and high to green loop types of SES. Petal lengths indicate the average percentage of households in a given category using one direct ES. Standard errors (se) range within se ε (0.008; 0.042). (B) Distribution of use categories across KwaZulu-Natal. Data: Census 2011 and official shapefile data for border demarcation.
The different geographical aggregation of KIDS panel data as well as several shifts in local and district municipal border demarcation between 1993 and 2011 made it impossible to spatially map the changing types of systems over time. This is why spatial mapping could only be performed for 2011 census data. Changes in ES use could well be mapped with upcoming 2022 release of census data.
Discussion
This study observed the relationship of households with surrounding ecosystems based on analyzing the changing use of a characteristic bundle of ES relevant to satisfy basic needs over time. Embedded in the green-to-red loop transition model, in three main aspects are discussed. First of all, this concerns the empirical limits and possibilities of identifying a regime shift using a characteristic bundle of ES as a proxy. The second section discusses the assumptions and limitations of the analysis. The third section discusses the underlying drivers of change based on existing research. The fourth section discusses the potential of using this approach as an entry point to study the diverse relationships between humans and ecosystems in the context of transformative change toward safely and justly staying within planetary boundaries.
Green-to-Red Loop Transition: Has a Regime Shift Occurred?
The term regime shift is repeatedly used to describe processes within social-ecological systems that fundamentally alter the organization of underlying system dynamics (SRC 2011; Biggs et al., 2012). The exact meaning of such fundamental change strongly depends on the definition, the scale and scope of the system under investigation and therefore notably on the theoretical and methodological choices in the context of a specific case study. This study examines a substitution process where locally sourced ES get increasingly replaced by faraway indirect ES in the case study area of KwaZulu-Natal (Figure 3). We found that in green loops identified in 1993, the average use of ES consistently dropped across all ES composing the characteristic bundle. In transition loops, the tendencies are rather mixed and in initial red loops, the average use of several ES even increased throughout the observation period. Given this mix of tendencies, we argue that more scientific effort is needed to calibrate thresholds upon transgression of which one can robustly identify a regime shift. This should take into account sufficient leeway for non-linearities to account for increased pressures in red loops on local ecosystems, e.g., local forests or locally available arable land in times of crisis.
However, in our view, the substitution process of locally sourced direct ES by faraway sourced indirect ES can very relevantly underpin the understanding of regime shifts and provide an important entry point to studying the relational shifts between societies and their natural environment in SES research. In the past, this process was typically geared from green to red loops, i.e., from strong reliance on local ecosystems toward the remote extraction of ES (Cumming et al., 2014). Gradual regime shifts presuppose that slowly changing variables within a system entail its fundamental re-organization. Despite the uncertainty on thresholds, we acknowledge from the empirical observations that red loop dynamics increasingly take precedence over other type of loops in the case study area. This implies an entire set of historically specific variables to change within that process, including infrastructural provisions, increased division of labor, integration of local economies into global value chains of certain locally available ES and many more. These dynamics reflect the history of humankind which is so far, in brief, the transformation from hunter-gatherer societies to urban-industrialized ones. Globally, this process has taken place over the course of millennia, and was only relatively recently accelerated through agricultural and industrial revolutions, as well as globalized in an initial stage through colonization and trade (Cumming et al., 2014). While sub-Saharan Africa has a millennia-long history of trade, remote extraction of ES necessary for basic needs likely only commenced with South Africa’s largely coal-driven electrification as part of a gradual extension of trade and service infrastructure since the end of the 19th century. Today, coal-fired electricity generation continues to represent about 70% of total installed capacity (IEA 2021). With consumption mainly stemming areas where the majority of household and industry demand are located, red loops are thus the main drivers of South Africa’s energy-related greenhouse gas emissions which continue to be unaligned with the objectives of the Paris Agreement even in light of stated policies under its updated nationally determined contribution (CAT, 2021). Also in green loops, burning locally collected fuelwood for cooking and heating contributes to global climate change through increased deforestation and a reduction of the net carbon stock of the country (see Table 4). Depending on the type of loop, the energy sector poses different sustainability management challenges and risks to enter into trap dynamics. Furthermore, the increase in reliance on fuelwood in transition and red loops buttresses research on unequally distributed access to a reliable and affordable electricity grid as well as local ecosystems as ‘provisioning systems of last resort’, e.g., in times of crisis (Shackleton and Shackleton 2011; Baker and Phillips 2019).
In summary, our findings illustrate a critical fraction of a systemic transformation of basic needs provisioning systems in South Africa which is ongoing since decades. However, we believe that the speed of change in the observation period in post-apartheid South Africa is substantively to be higher compared to previous decades. The findings support the view that the case study area of KwaZulu-Natal is a highly heterogeneous landscape in which different types of social-ecological systems co-exist and co-evolve over time (Figure 3). We call for future research defining comparable thresholds for the speed of change from green loops (=local ES use) to red loops (=distant ES use) as a regime shift as well as on second-order conditions for “trap dynamics”, e.g., derived from downscaled frameworks on planetary boundaries or doughnut economies (e.g., Cole, Bailey and New 2014; Raworth 2017) and tipping elements (e.g., Lenton et al. 2008; Otto et al., 2020). Partially reflecting these ideas studies in the context of regime shifts already exist in food or energy production and distribution systems (McMichael 2009; Hamann et al., 2015; Pereira et al., 2020).
Assumptions and Limitations of the Analysis
The expressiveness of the selected characteristic bundle of direct ES represents an important underlying assumption to infer system dynamics based on its use or non-use. We argue that while it represents a first-best and context-appropriate measure of the immediacy with which a household depends on local ecosystems, more comprehensive data is needed to include and tailor-make characteristic bundles of direct ES for case study areas. This may include differentiations between the rural-urban nexus, but also North-South differences of application. At the same time, more research is needed on the expressiveness of non-use of direct ES, which in our analysis, indicates that households rely on distant ES brought by to the site of consumption through market-based means of exchange. Across all loops, direct ES use can be seen as expressive not only of the economic status and social vulnerability of the household, but also of its cultural, historical and spiritual connection to (or disconnection from) local ecosystems. However, further qualitative inquiry would be needed to study potentially differing subjective perceptions of local environments between loop types and direct ES uses, sentiments of responsibility or of spiritual closeness to the biosphere. One strict limitation of this study is the sole use of secondary data. With exception on the use of fuelwood, for which default data could be used to quantify an estimated material-energy throughput of woody biomass, the use quantities of the different bundle components could not be analyzed as part of this study. This, however, could highly be relevant, e.g., in relation to increased purchasing power and related rebound effects, especially in urban areas.
We furthermore identify relatively coherent spatial units based on municipality-wide averages of household-level use of direct ES. This assumption reflects archetype analysis which aims at identifying recurrent patterns across similar types of systems (Eisenack et al., 2019). However, as anticipated above, it likely obfuscates relevant intra-cluster differences between households, especially given the pronounced socio-economic inequality present in South Africa. Knowing that predominantly social factors predict the use intensity of direct ES at municipality level (Supplementary Table A2), more research would be needed to estimate the robustness of using municipality-wide averages of household-level use of direct ES as proxies for more aggregate SES dynamics. Using this approach however is highly useful, e.g., to formulate spatially targeted policies in the domain of land use policy, sustainability management or common pool governance strategies (Ostrom 2007; Hamann et al., 2015; 2016).
As described above, this study does not use an ex-ante determined threshold (e.g., an average percentage or range) that once transgressed, marks a regime shift i.e., the transition from a green to red loop. Rather, the classification of the type of social-ecological system was guided by kmeans clustering which grouped average ES use data from local municipalities into a pre-determined number of groups. The number of centroids should depend on internal or stability measures that provide an optimal number of clusters, corresponding to green, transition and red loops (Hamann et al., 2015). For KIDS data, also three was chosen as the number of centroids for which stability measures scored highest, however not across all ES (e.g., crop farming). Using clustering is a common method to study social-ecological systems (e.g., Janssen et al., 2012). Cluster algorithms come with trade-offs when comparing results to potential future studies in the field. This stems from the fact that kmeans clustering uses relative measures of proximity. This allows to group spatial units into clusters of highest similarity within one heterogeneous geography. However, more comparative research in the field would be necessary to derive absolute thresholds from similar bundles of ES use to form common benchmarks. Moreover, one further limitation of the analysis is that we cannot take into account migratory activities based on the KIDS or census data, despite evidence that the period of observation experienced significant migration. That migration plays a role is illustrated by KIDS data which follows household heads from 1993 to 2004. The possibility that these households have moved from urban areas (=likely red loops) back to rural areas (=likely green loops) at the end of the survey period is reflected by linkages of urban labor markets with rural areas and the common practice for aging South Africans to spend their pension life in rural areas with family roots (Supplementary Table A2).
Understanding Underlying Drivers of Change
System properties emerge as a function of biophysical supply of ES and socio-economic and political factors relating to their governance (SRC 2011; Biggs et al., 2012). Hamann et al. (2015) have found that, in South Africa, social factors predominantly predict the type of social-ecological systems, including household income, high proportions of female household headship and land under traditional tenure. Ecological supply factors, such as the mean annual run-off of water, grazing land potential or the supply of wood, have been found to only partially explain high direct ES use patterns (ibid.). This insight is crucial for understanding the use dynamics within green, transition and red loops. For KIDS data, panel regression analysis partially confirms these findings, where the availability of data permits to do so (Supplementary Table A2). Factors determining land access, and with that, direct ES use warrant separate analyses in the context of the complex agrarian political economy of South Africa and its failed land reform (Aliber and Hart, 2009; Cousins, 2010; Cousins, 2017). Indeed, land grabbing and forced removals of indigenous populations mark the most important contributor to changing dynamics in social-ecological systems over the last 350 years (e.g., Platzky and Walker 1985; Cousins 2017). That large parts of areas in KwaZulu-Natal identified as green loops overlap with the former homeland areas of South Africa is telling of the fact that using the characteristic bundle of direct ES is an indicator of social vulnerability and deprivation. Although direct ES use decreases in these areas continuously, it remains relatively high across all five direct ES, especially in the category of energy supply through local fuelwood uses, and also for drinking water from natural local sources. The dynamics of direct ES use supports the argument that in South Africa local ecosystems are a safety nets in the absence of a welfare state (Shackleton and Shackleton, 2011; Neves, 2017). This may especially be important in old age or times of crisis. Examining for instance, to what extent the lockdown of critical basic needs infrastructure during the covid-crisis pushed South Africans to increasingly use ES would be highly interesting to examine, including in combination of studying problems of overuse and undersupply of local ES. The methodology applied here can only identify the dynamics and the distribution of ES use. However, it cannot explain the drivers of change, i.e., underlying causalities of regime shifts. This remains an important area for future research.
Associating underlying causalities of change by empirical analysis could furthermore help to explain not only the past evolution of system transformation over time but can also help understand future barriers to transformative change. Next to socio-economic and biophysical standard data surveys, such an analysis needs to take into account the political economy of transition processes. Indeed, questions of power, history and class have not received much attention in transdisciplinary sustainability research, even in ecological economics (Pirgmaier and Steinberger 2019). Especially in the case of land access and agrarian reform in South Africa, such inquiry is certainly apt (Cousins 2010). This is why we call for studying the political economy of green or red loops as a future research avenue to enhance a better understanding of barriers to profound transformative change in SES.
Identifying and Mapping Social-Ecological Systems as an Entry Point to Studying Transformative Change
We identified and mapped SES based on the use of a characteristic bundle of five direct ES and examined changing direct ES use patterns over time. It was shown that this approach provides a heuristic to observe and understand the past evolution and current distribution of different types of SES. We argue that this transition model cannot only be deployed descriptively, but also forward-looking in a normative setting (Figure 5). Sparking social-ecological transformation toward more sustainable futures may require “fundamental shifts in perspectives, world views and institutions” (Folke et al., 2011, 719). This can include for instance participation in initiatives that aim at reconnecting people with the biosphere (Hamann et al., 2015; Pereira et al., 2020). Such initiatives notably explore the possibilities of re-localizing and de-centralizing food and energy provisioning systems (ibid.). In the case of food production regimes for instance, Pereira et al. (2020) find that enhanced certification and labeling of food products as a key innovation to spur transformative change through alternative food networks independent of anonymous global supply chains. Moreover, community-supported agriculture (CSA) projects can approximate producers and consumers and increase consciousness of the origin of food products. Increasing recognition of traditional agroecological knowledge can help to respond to pressing sustainability challenges of current agro-industrial food system (e.g., Guerrero et al., 2019).
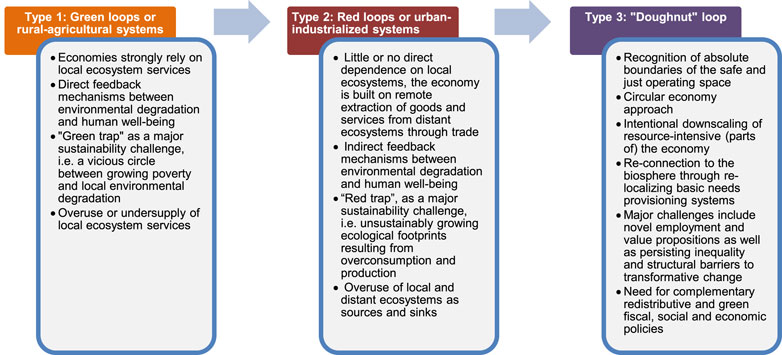
FIGURE 5. The expanded loop transition model. Adopted from Cumming et al. (2014) and Raworth (2017).
Purpose-collected data could help to build more detailed characteristic bundle of direct ES used for identifying and mapping transformative change at societal level. With purpose-collected data, it would be possible to differentiate between the quality and intention of ES use, which, in combination with more disaggregated geospatial and biophysical data could provide an excellent basis for identifying social and ecological deprivation on the one side, and on the other, seeds of transformative change (Figure 5). This could help to enrich the loop transition model and distinguish sustainable loops from unsustainable ones. Moreover, the use of additional variables as part of characteristic bundles of ES use could further expand the expressiveness of underlying relationships of households with ecosystems.
Conclusion and Research Outlook
In this paper, we explored the concept of regime shifts based on direct ES use of households in the context of the green-to-red loop transition model. First of all, we observed a clear tendency of changing systems of provision for basic needs in the transition from green to red loops. This analysis was based on decreasing use of a characteristic bundle of direct is ES. This is indicative of a gradual regime shift, however, the absence of comparative studies and quantified thresholds hindered the conclusive identification of a regime shift. Moreover, such insight likely requires longer observation periods than the 18 years observed between 1993 and 2011 in this study. The research however shows important dynamics of how direct ES use non-linearly evolves over time and to what extent locally available ES continue to be of significant importance today, even for livelihoods in red loop type of systems. We furthermore identify the spatial distribution of SES in 2011 similar to the analysis by Hamann et al. (2015) at provincial level in the case study province of KwaZulu-Natal. Based on the empirical results of the analysis, we discussed general aspects relating to the study of regime shifts in the context of the green-to-red loop transition, including the questions how to identify thresholds which apt to determine the frontier between one and another type of system. In addition to that, the results are discussed in the context of existing research on factors determining the transition between green and red loops and points at the importance of perspectives of agrarian political economy for understanding the history and status quo of land access in South Africa. Indeed, what the paper cannot achieve is distinguishing between the qualities and intentions with which households access direct ES, an aspect that could with purpose-collected data be an excellent opportunity for further study of regime shifts in the context of system transformation. Owing to its holistic nature and high adaptiveness to different geographical and cultural contexts, there exist many potential future research avenues. This includes for instance identifying and mapping social-ecological systems based on different compositions of characteristic ES use bundles, combinations with local or regional doughnut economy indicator frameworks or illustrations of emerging alternative food or energy production networks.
Data Availability Statement
The raw data supporting the conclusions of this article are available under the links provided in the references University of KwaZulu-Natal (2004) and Stats SA (2012b).
Ethics Statement
The authors used secondary and anonymized data. Therefore no ethical approval was needed to include the observations in this study.
Author Contributions
Conceptualization, methodology design and data analysis were part of the corresponding author’s master thesis to which IO acted as supervisor of.
Conflict of Interest
The authors declare that the research was conducted in the absence of any commercial or financial relationships that could be construed as a potential conflict of interest.
Acknowledgments
The corresponding author has benefitted as guest researcher from the office and knowledge infrastructure at PIK Potsdam for carrying out all research. This work would not have been possible without the master’s program EPOG that accepted a topic which may, at first sight, seem quite uneconomic or at least unconventional in its focus. Moreover, the corresponding author wants to thank a number of people including IO from the Potsdam Institute for Climate Impact Research who supported him for more than 1year in drafting his research, Liliana Cano from the University of Paris 13 for devoting many hours for discussion Gavin Capps and Bob Scholes from the University of the Witwatersrand in Johannesburg for valuable comments, and lastly, Maike Hamann from the Institute on the Environment at the University of Minnesota, Ryan Blanchard from the Council for Scientific and Industrial Research (CSIR) in South Africa and Fazel Hoosen from the South African Demarcation Board for supporting this research with crucial data issues.
Supplementary Material
The Supplementary Material for this article can be found online at: https://www.frontiersin.org/articles/10.3389/fenvs.2021.695348/full#supplementary-material
Footnotes
1Note that in the remainder of the study we use the abbreviation “ES use” or “direct ES use” interchangeably. For a full classification of ES and a distinction between direct and indirect uses see Millennium Ecosystem Assessment (2005).
2Defined as “a group of persons who live together and provide themselves jointly with food or other essentials for living, or a single person who lives alone. Note that a household is not necessarily the same as a family” (Stats SA 2011, 55). Note that KIDS has a similar, but somewhat looser definition of households.
3Mapping local municipalities was only possible for the year 2011 (census data) due to shifting municipality borders between 1993 and 2004.
4The absolute numbers and relative shares of sample households living in green, transition or red loops as well as the absolute number of clusters classified as either type of loop is provided in Supplementary Table 1.
5Stats SA (2012b, p. 19) define a traditional dwelling as “a dwelling made primarily of clay, mud, reeds or other locally available natural materials”.
References
Aliber, M., and Hart, T. G. (2009). Should Subsistence Agriculture Be Supported as a Strategy to Address Rural Food Insecurity? Agrekon 48 (4), 434–458. doi:10.1080/03031853.2009.9523835
Baker, L., and Phillips, J. (2019). Tensions in the Transition: The Politics of Electricity Distribution in South Africa. Environ. Plann. C: Polit. Space 37 (1), 177–196. doi:10.1177/2399654418778590
Biggs, R., Blencker, T., Folke, C., Gordon, L., Norström, A., and Peterson, G. (2012). “Regime Shifts,” in Encyclopedia of Theoretical Ecology (Berkeley: University of California Press), 609–617.
CAT (2021). [CAT] Climate Action Tracker. South Africa. Available at: https://climateactiontracker.org/climate-target-update-tracker/south-africa/(Accessed June 28, 2021).
Cavendish, W. (2000). Empirical Regularities in the Poverty-Environment Relationship of Rural Households: Evidence from Zimbabwe. World Develop. 28 (11), 1979–2003. doi:10.1016/S0305-750X(00)00066-8
Cilliers, P. (2001). Boundaries, Hierarchies and Networks in Complex Systems. Int. J. Innov. Mgt. 05, 135–147. doi:10.1142/s1363919601000312
Coetzee, M., and Van Averbeke, W. (2011). “Poverty, Land and Food Production in South African Townships.,” in Reforming Land and Resource Use in South Africa. Impacts on Livelihoods. Paul Hebinck and Charlie Shackleton (London; New York: Routledge), 275–294.
Cole, M. J., Bailey, R. M., and New, M. G. (2014). Tracking Sustainable Development with a National Barometer for South Africa Using a Downscaled "safe and Just Space" Framework. Proc. Natl. Acad. Sci. USA 111 (42), E4399–E4408. doi:10.1073/pnas.1400985111
Cousins, B. (2017). Land Reform in South Africa Is Failing. Can it Be Saved?. Transformation: Crit. Perspect. South. Africa 92 (1), 135–157. doi:10.1353/trn.2016.0030
Cousins, B. (2010). What Is a ‘Smallholder’? Class-Analytic Perspectives on Small-Scale Farming and Agrarian Reform in South Africa’. PLAAS Working Paper 16. Available at: http://www.plaas.org.za/plaas-publication/wp-16.
Cumming, G. S., Buerkert, A., Hoffmann, E. M., Schlecht, E., von Cramon-Taubadel, S., and Tscharntke, T. (2014). Implications of Agricultural Transitions and Urbanization for Ecosystem Services. Nature 515 (7525), 50–57. doi:10.1038/nature13945
Dovie, D. B. K., Witkowski, E. T. F., and Shackleton, C. M. (2004). The Fuelwood Crisis in Southern Africa - Relating Fuelwood Use to Livelihoods in a Rural Village. GeoJournal 60 (2), 123–133. doi:10.1023/b:gejo.0000033597.34013.9f
Driver, A., Nel, J., Daniels, F., Poole, C., Jewitt, D., and Escott, B. (2015). Land and Ecosystem Accounting in KwaZulu-Natal, South Africa. Pretoria: South African National Biodiversity InstituteAvailable at: http://www.statssa.gov.za/wp-content/uploads/2016/08/Land-and-Ecosystem-Accounting-in-KZN-Discussion-Document-FINAL.pdf.
Driver, A., Sink, K., and Nel, J. (2012). National Biodiversity Assessment 2011: Synthesis Report - an Assessment of South Africa’s Biodiversity and Ecosystems. Pretoria: South African National Biodiversity Institute and Department of Environmental AffairsAvailable at: http://biodiversityadvisor.sanbi.org/wp-content/uploads/2016/07/NBA-2011-Synthesis-Report-low-resolution.pdf.
Eisenack, K., Villamayor-Tomas, S., Epstein, G., Kimmich, C., Magliocca, N., Manuel-Navarrete, D., et al. (2019). Design and Quality Criteria for Archetype Analysis. Ecol. Soc. 24, 6. doi:10.5751/ES-10855-240306
Folke, C., Carpenter, S., Walker, B., Scheffer, M., Elmqvist, T., Gunderson, L., et al. (2004). Regime Shifts, Resilience, and Biodiversity in Ecosystem Management. Annu. Rev. Ecol. Evol. Syst. 35 (1), 557–581. doi:10.1146/annurev.ecolsys.35.021103.105711
Folke, C., Jansson, Å., Rockström, J., Olsson, P., Carpenter, S. R., Chapin, F. S., et al. (2011). Reconnecting to the Biosphere. Ambio 40 (7), 719–738. doi:10.1007/s13280-011-0184-y
Guerrero, L., Laura, L., Pereira, M., Ravera, F., and Jiménez-Aceituno, A. (2019). Flipping the Tortilla: Social-Ecological Innovations and Traditional Ecological Knowledge for More Sustainable Agri-Food Systems in Spain. Sustainability 11 (5), 1222. doi:10.3390/su11051222
Hamann, M., Biggs, R., and Reyers, B. (2016). An Exploration of Human Well-Being Bundles as Identifiers of Ecosystem Service Use Patterns. PLOS ONE 11 (10), e0163476. doi:10.1371/journal.pone.0163476
Hamann, M., Biggs, R., and Reyers, B. (2015). Mapping Social–Ecological Systems: Identifying ‘Green-Loop’ and ‘Red-Loop’ Dynamics Based on Characteristic Bundles of Ecosystem Service Use. Glob. Environ. Change 34 (September), 218–226. doi:10.1016/j.gloenvcha.2015.07.008
IEA (2021). [IEA] International Energy Agency. South Africa. Available at: https://www.iea.org/countries/south-africa (Accessed June 28, 2021).
Janssen, P., Walther, C., and Lüdeke, M. (2012). Cluster Analysis to Understand Social-Ecological Systems: A Guideline. Potsdam: Potsdam Institute for Climate Impact Research (PIK) Report.
Lade, S., Tavoni, A., Levin, S., and Schlüter, M. (2013). Regime Shifts in a Social-Ecological System. Grantham Research Institute on Climate Change and the Environment Working Paper, 105.
Lenton, T. M., Held, H., Kriegler, E., Hall, J. W., Lucht, W., Lucht, W., et al. (2008). Tipping Elements in the Earth's Climate System. Proc. Natl. Acad. Sci. 105 (6), 1786–1793. doi:10.1073/pnas.0705414105
Levin, S., Xepapadeas, T., Crépin, A.-S., Norberg, J., de Zeeuw, A., Folke, C., et al. (2013). Social-Ecological Systems as Complex Adaptive Systems: Modeling and Policy Implications. Envir. Dev. Econ. 18 (2), 111–132. doi:10.1017/S1355770X12000460
McMichael, P. (2009). A Food Regime Genealogy. J. Peasant Stud. 36 (1), 139–169. doi:10.1080/03066150902820354
Millennium Ecosystem Assessment (2005). Ecosystems and Human Well-Being: Synthesis. Washington, DC: Island Press. https://www.millenniumassessment.org/documents/document.356.aspx.pdf.
Moore, J. (2015). Capitalism in the Web of Life: Ecology and the Accumulation of Capital. 1st Edition. London: Verso.
Neves, D. (2017). “Reconsidering Rural Development: Using Livelihood Analysis to Examine Rural Development in the Former Homelands of South Africa.” Africa Portal. June 30, 2017. Available at: https://www.africaportal.org/publications/reconsidering-rural-development-using-livelihood-analysis-examine-rural-development-former-homelands-south-africa/.
Ostrom, E. (2007). A Diagnostic Approach for Going beyond Panaceas. Proc. Natl. Acad. Sci. 104 (39), 15181–15187. doi:10.1073/pnas.0702288104
Otto, I. M., Donges, J. F., Cremades, R., Bhowmik, A., Hewitt, R. J., Lucht, W., et al. (2020). Social Tipping Dynamics for Stabilizing Earth's Climate by 2050. Proc. Natl. Acad. Sci. USA 117 (5), 2354–2365. doi:10.1073/pnas.1900577117
Pereira, L. M., Drimie, S., Maciejewski, K., Tonissen, P. B., and Biggs, R. (2020). Food System Transformation: Integrating a Political-Economy and Social-Ecological Approach to Regime Shifts. Int. J. Environ. Res. Public Health 17 (4), 1313. doi:10.3390/ijerph17041313
Pirgmaier, E., and Steinberger, J.. 2019. Roots, Riots, and Radical Change-A Road Less Travelled for Ecological Economics.” Sustainability, 11, 2001. doi:10.3390/su11072001
Platzky, L., and Walker, C. (1985). The Surplus People: Forced Removals in South Africa. Johannesburg: Ravan Press.
Raworth, K. (2017). A Doughnut for the Anthropocene: Humanity's Compass in the 21st century. Lancet Planet. Health 1 (2), e48–e49. doi:10.1016/S2542-5196(17)30028-1
SANBI (2018). [SANBI] South African National Biodiversity Assessment. The Status of South Africa’s Ecosystems and Biodiversity“. South African National Biodiversity Institute, 2019. Available at: https://www.sanbi.org/wp-content/uploads/2019/10/NBA-Report-2019.pdf.
Scheffer, M., Carpenter, S., Foley, J. A., Folke, C., and Walker, B. (2001). Catastrophic Shifts in Ecosystems. Nature 413, 591–596. doi:10.1038/35098000
Shackleton, S., and Shackleton, C. (2011). “Exploring the Role of Wild Natural Resources in Poverty Alleviation with an Emphasis on South Africa,” in Reforming Land and Resource Use in South Africa - Impact on Livelihoods (New York: Routledge), 209–235.
South African Demarcation Board (2016). 2016 Boundaries - District Municipalities. Available at: http://www.demarcation.org.za/site/documents/2016-boundaries-district-municipalities/.
SRC (2019). Regime Shifts Database. Available at: https://www.regimeshifts.org/.
SRC (2011). [SRC] Stockholm Resilience Centre. “Insight #2 REGIME SHIFTS.” Stockholm Resilience Centre. Available at: https://www.stockholmresilience.org/download/18.3e9bddec1373daf16fa438/1459560363336/Insights_regimeshifts_120111-2.pdf.
Stats SA (2011). Census 2011 - How the Count Was Done. Available at: https://www.datafirst.uct.ac.za/dataportal/index.php/catalog/485/download/8288.
Stats SA (2012a). Census 2011 - Metadata - Report No. 03-01-47. Available at: http://www.statssa.gov.za/census/census_2011/census_products/Census_2011_Metadata.pdf.
Stats SA (2012b). Statistical Release Census 2011. Available at: https://www.statssa.gov.za/publications/P03014/P030142011.pdf and https://www.datafirst.uct.ac.za/dataportal/index.php/catalog/485.
Steffen, W., Richardson, K., Rockström, J., Cornell, S. E., Fetzer, I., Bennett, E. M., et al. (2015). Sustainability. Planetary Boundaries: Guiding Human Development on a Changing Planet. Science 347 (6223), 1259855. doi:10.1126/science.1259855
Steffen, W., Rockström, J., Richardson, K., Lenton, T. M., Folke, C., Liverman, D., et al. (2018). Trajectories of the Earth System in the Anthropocene. Proc. Natl. Acad. Sci. USA 115 (33), 8252–8259. doi:10.1073/pnas.1810141115
UNFCCC (2019). [UNFCCC] United Nations Framework Convention on Climate Change. Standardized Baselines. ASB0044-2019: Improved Institutional Cookstoves in Ethiopia. Available at: https://cdm.unfccc.int/methodologies/standard_base/2015/sb142.html (Accessed June 28, 2021).
University of KwaZulu-Natal (2004). Kwa-Zulu Natal Income Dynamics Study (KIDS) - Third Wave, 2004, Public Release Version 1.1. Available at: https://www.datafirst.uct.ac.za/dataportal/index.php/catalog/93 (data waves 1 and 2) https://www.datafirst.uct.ac.za/dataportal/index.php/catalog/286 (data wave 3).
Weber, A. (2016). Enlivenment - toward a Poetics for the Anthropocene. Fröhliche Wissenschaft 079. Berlin: Matthes & Seitz Berlin.
Keywords: regime shifts, social-ecological systems, ecosystem services, human-nature relationships, land use change (LUC), doughnut economy, provisioning systems
Citation: Censkowsky P and Otto IM (2021) Understanding Regime Shifts in Social-Ecological Systems Using Data on Direct Ecosystem Service Use. Front. Environ. Sci. 9:695348. doi: 10.3389/fenvs.2021.695348
Received: 14 April 2021; Accepted: 05 July 2021;
Published: 19 July 2021.
Edited by:
Alex Oriel Godoy, Universidad del Desarrollo, ChileReviewed by:
Laura Nahuelhual, Universidad Austral de Chile, ChileVíctor H Marín, University of Chile, Chile
Copyright © 2021 Censkowsky and Otto. This is an open-access article distributed under the terms of the Creative Commons Attribution License (CC BY). The use, distribution or reproduction in other forums is permitted, provided the original author(s) and the copyright owner(s) are credited and that the original publication in this journal is cited, in accordance with accepted academic practice. No use, distribution or reproduction is permitted which does not comply with these terms.
*Correspondence: Philipp Censkowsky, UGhpbGlwcC5jZW5za293c2t5QHBvc3Rlby5kZQ==