 Martin Siegert
 Pam Pearson
- 1Grantham Institute and Department of Earth Science and Engineering, Imperial College London, London, United Kingdom
- 2International Cryosphere Climate Initiative, Lund, Sweden
Sea-level rise is one of the most critical issues the world faces under global warming. Around 680 million people (10% of the world’s population) live in low-lying coastal regions that are susceptible to flooding through storm surges and from sea-water infiltration of fresh groundwater reserves, degradation of farmland and accelerated coastal erosion, among other impacts. Rising sea level will exacerbate these problems and lead to societal impacts ranging from crop and water-supply failures to breakdowns of city infrastructures. In time, it is likely such changes will necessitate the migration of people with substantial economic cost and social upheaval. Here, we discuss the physical processes influencing 21st Century sea-level rise, the importance of not using 2100 alone as a benchmark, the changes that are already locked in, especially after 2100, and those that can be avoided. We also consider the need for both adaptation and mitigation measures and early warning systems in this challenging global problem. Finally, we discuss how the scientific prediction of sea level rise can improved through international coordination, cooperation and cost sharing.
Introduction
Sea level has risen by ∼20 cm over the last 150 years or so (Figure 1). The rate of change has been increasing through time, however, and in the early 21st Century it is ∼3.3 mm/yr and growing at a rate of ∼0.8 mm/yr per decade (Nerem et al., 2018). In the last 3 decades, sea level has risen by 10 cm, roughly equalling the amount over the preceding 120 years (WMO, 2021) (Figure 2). When compounded by storm surges, these changes have been seen in a number of coastal flooding incidents this century in both major cities (e.g. Houston in 2018, New York in 2012, New Orleans in 2005) and across wide regions in developing countries (e.g., Bangladesh in 2004, 2005, 2015, and 2017). Sea levels will continue to rise in coming decades and millennia, and up to 5 m by 2150 cannot be ruled out (IPCC, 2021).
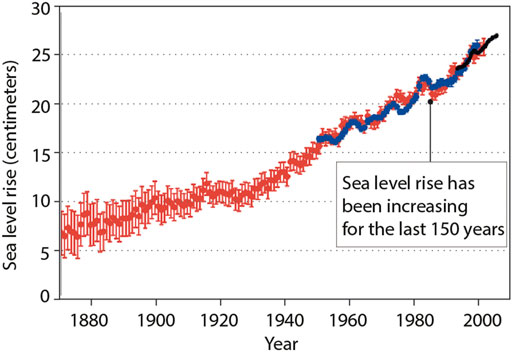
FIGURE 1. Global sea-level change since the 1850s. Although the early measurements were quite simple and lacked accuracy, they reveal an upwards trend in sea level (about 0.8 mm every year) that is greater than the margin of error. By the mid 1900s measurements became much more accurate (the blue line) and show the rate of sea level rise to have increased to around 2 mm per year. In the last few decades satellite measurements (the black line) have provided highly accurate records of sea level and show the rate of sea-level rise to now be over 3 mm each year. Taken from Siegert (2017).
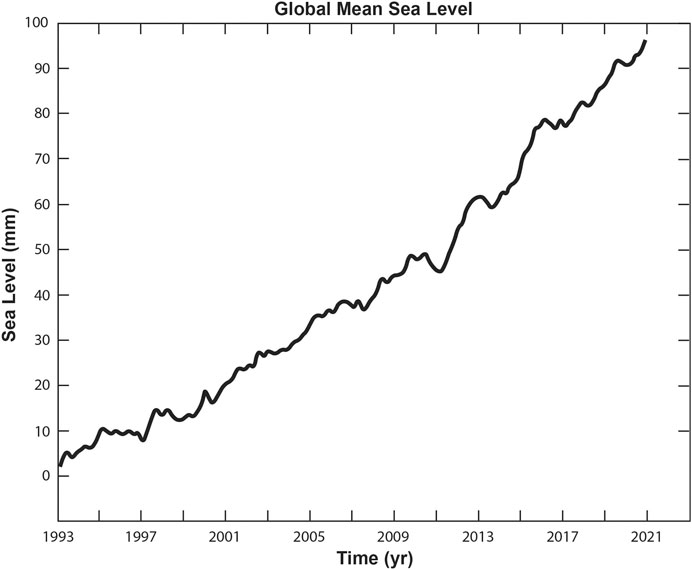
FIGURE 2. Global sea level rise in the last 30 years. Adapted from the World Meteorological Organisation (2021).
Global sea levels change on timescales of decades to millennia in three ways (Frederikse et al., 2020): 1) the net loss of mass from glaciers and ice sheets to the oceans; 2) the expansion of ocean water as it warms; and 3) changes in non-glacial water storage on land, including groundwater aquifers and water held behind dams and on rivers. The oceans hold around 97% of all water on Earth. Of the remaining 3%, around two thirds are held as ice within glaciers and ice sheets (the other third being in lakes, soils, rivers and the atmosphere). Ice sheets and glaciers thus hold nearly 70% of the planet’s freshwater (Siegert, 2006). By far the greatest ice volume is in Antarctica; if melted, sea level would rise by over 57 m. The next largest ice sheet is in Greenland, containing enough water to increase sea level by about 7 m. The remaining ice caps and glaciers in the world, if they too melted, would raise sea level by only ∼0.32 m (Farinotti et al., 2019). Hence, the greatest uncertainties to future sea-level rise relate to how the massive polar ice sheets will react to global warming and at what point this response becomes impossible to halt, or irreversible, on human time scales.
Sea level integrates and aggregates a range of climate processes and, because of the long reaction times of ice and ocean processes, lags climate forcing. Consequently, during episodes of global warming, sea-level rise experienced at a particular date is unlikely to represent the maximum expected from that warming. “Built in” sea-level rise demands we consider adaptation measures to protect our coastal communities, as well as ways to reduce the problem through mitigation. The amount that is built in and the level to which can mitigate further increases are key issues for the 21st Century, including in the near term of the next 2 decades given persistently high emissions levels. This will determine whether and how we can inhabit today’s coastal regions for the rest of this century and beyond (Siegert et al., 2020; Aschwanden et al., 2021).
Sea Level Change Present and Past
Valuable insights into future sea-level rise can be obtained by looking into records of past change over the last few decades, as well as much further back in time during periods of previous global warming. The fact that we know how much sea level has risen in the last 150 years is due to a combination of tide-gauge measurements from the 19th Century to highly precise satellite-observations of ocean levels in the 21st Century. Satellite altimetry from the last 30 years shows that all parts of Greenland’s ice sheet are now losing mass (Sasgen et al., 2020) (Figure 3). Furthermore, important regions of the Antarctic ice sheet, where the ice rests on a bed >1 km below sea level that deepens upstream, are thinning and losing mass rapidly (Figure 3). Satellite data reveal the rate of West Antarctic mass loss has increased six-fold since the early 1990s (Shepherd et al., 2018), and it is the “marine” sections of the ice sheet - where the ice is in contact with relatively warm water - that are most vulnerable. In contrast, while the world’s glaciers also contribute significantly to sea-level rise, the rate of acceleration is smaller than for the ice sheets (Ciracì et al., 2020). The ice-sheet contribution to sea level rise (mostly from Greenland) now exceeds that from the world’s glaciers and, in combination, they now exceed sea-level rise from thermal expansion of the ocean. This trend is certain to continue in the coming decades and indicates that future sea-level rise is likely to be dominated by the response of the vast polar ice sheets to warming-related processes. This will occur especially at high levels of emissions and warming, as projections show that valley glacier and ice cap loss will peak at mid-century and subsequently decline as glacier ice disappears almost entirely around 2200 under such scenarios.
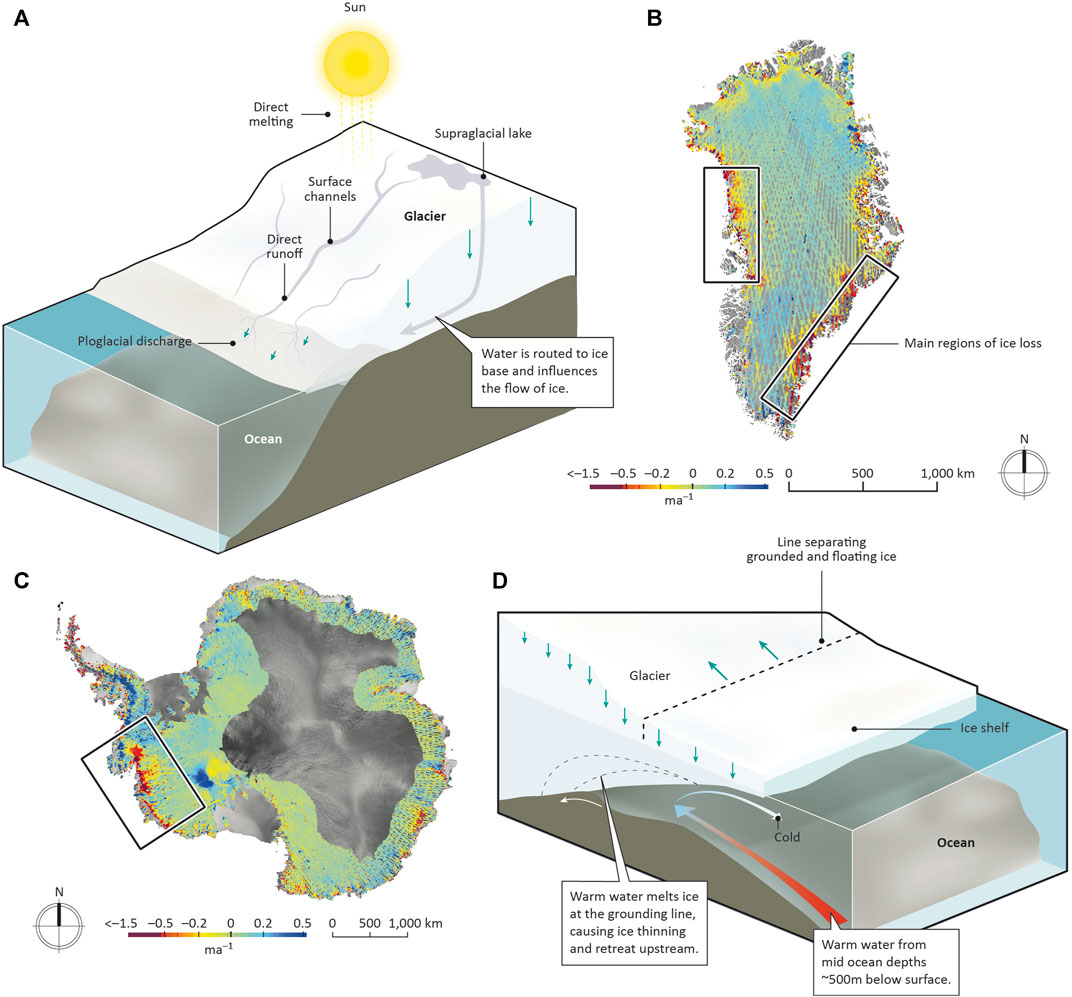
FIGURE 3. (A) Ice-loss in Greenland through direct melting of ice, caused by warm air and run-off of the water into the ocean. (B) Satellite measurements of ice surface elevation change in Greenland, showing the zones of major ice sheet loss (in red)–the boxes show where most melting occurs. (C) Satellite measurements of ice surface elevation change in Antarctica. The red colours show where ice is being lost and the box shows where this is happening most. (D) Ice-loss in Antarctica, through ocean-driven melting of the ice sheet and floating ice shelves. In Antarctica the warm ocean flows beneath the floating ice shelf, causing it to melt from its underside, which leads to further loss of the grounded part of the ice sheet. (B,C) are adapted from Pritchard et al. (2009). Taken from Siegert (2017).
Further back in time, extensive evidence shows that warming has repeatedly driven large, rapid sea-level rise from ice-sheet loss. At the peak of the last Ice Age, around 20,000 years ago, ice sheets captured so much water from the oceans that global sea level was ∼130 m lower than now (Lambeck et al., 2014). Ice Ages are instigated by slight variations in Earth’s orbit and attitude, which lead to changes in the amount of solar radiation cast onto the Earth, nudging the Earth system to drawdown atmospheric CO2 to, and then release it back from, the deep ocean so amplifying and globalising a major climate change response. Such changes – ice ages paced by Earth’s orbit and driven by atmospheric CO2 – have been recorded in the ice core record for the last 800,000 years (Figure 4, Lüthi et al., 2008), and in the sedimentary record for millions of years. The last deglaciation was driven by an atmospheric CO2 increase from about 180 to 280 parts per million (ppm), leading to a global-average temperature rise of ∼6°C to approximately pre-industrial temperatures, and sea level to increase, on average, by 1.3 m per century for about 10,000 years. While useful for a general understanding of how ice sheets respond to warming, this long-term average masks considerable variability at global and regional scales (Harrison et al., 2019). At the height of the last deglacial warming, during the Bølling-Allerød period around 14,000 years ago, sea-levels rose about 18 m during 350 years, most likely driven by the collapse of the Laurentide ice sheet (Deschamps et al., 2012; Dutton et al., 2015). Although the vulnerable sectors of today’s ice sheets are not so massive as the Laurentide, this relatively recent event in Earth’s history indicates the potential for rapid ice loss, and resulting sea-level rise, over a period of only a few human generations.
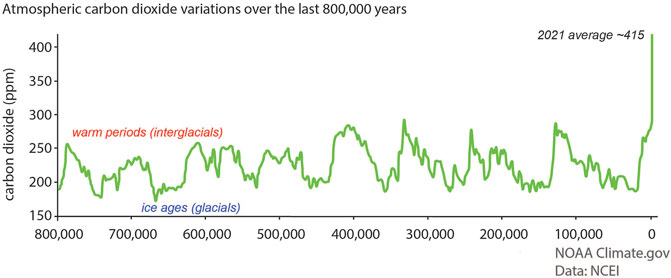
FIGURE 4. CO2 Levels over the past 800,000 years. Note consistent pattern of glacial (ice age) CO2 concentrations around 180 ppm, and Inter-glacial (warmer/pre-industrial) periods with around 280 ppm. The pre-industrial CO2 value was 277 ppm and today it is around 415 ppm. Adapted from Lüthi et al. (2008).
Ice sheets, and their interactions with the ocean, were critical to rapid climate change in the last deglaciation and will likely be so this coming Century. They influenced climate by releasing large quantities of water, via direct melting or by iceberg calving into the oceans, so affecting ocean salinity-driven circulation (Broecker, 2010). Ocean circulation is, in turn, important to ice sheet growth/loss and climate change for three reasons. First, oceans are capable of transporting heat between latitudes and hemispheres. Second, ocean thermal conditions are one of several factors affecting the growth of sea ice, which is an important feedback on surface reflectivity and the amplification of warming. Third, ocean temperatures are a control on the rate of ice-sheet decay where the ice is in direct contact with the water, as in West Antarctica, and on the maintenance and stability of ice shelves, which serve to slow ice sheet loss (Figure 3). Hence, through ice-ocean-atmospheric interactions, the gentle rise in global temperatures through the last deglaciation was punctuated regionally by episodes of rapid (on the order of decades or shorter) and extreme (in some areas >±5°C) regional temperature change.
In 2021, the average annual concentration of atmospheric CO2 is now at ∼415 ppm, and at a level comparable to a period around 5.3–2.6 million years ago, know as the Pliocene, when global temperatures were around 3°C warmer than today and sea level was at least 20 m higher at times. Whether the Pliocene represents a direct analogue for our future, or whether the high rate of change experienced over the last 150 years will push Earth toward a different state, is a serious issue in climate and Earth system science.
How Much Higher Could Sea Level Get by 2100?
Sea level rise will continue in the 21st Century, and well beyond it (Siegert et al., 2020). Whether this rise will be contained to <1 m, or be much higher, will depend on whether 1) we can curtail greenhouse gas emissions to “net zero” by mid-Century, thus stalling the atmospheric CO2 concentration – and then bringing it down – so that global warming can be restricted to the 1.5°C target (relative to the pre-industrial level), and 2) the polar ice sheets will react more rapidly than observed to date, in ways we know they can and have in the past (IPCC, 2019). At present, sea level is tracking along the most severe prediction associated with unabated emissions (e.g., the IPCC’s representative carbon pathway RCP8.5) and consequent warming (Figure 5, Slater et al., 2020).
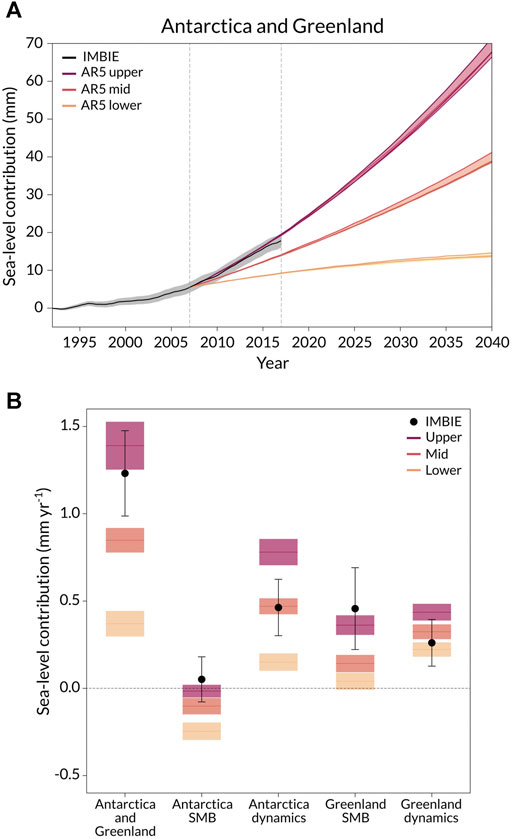
FIGURE 5. Analysis of ice-sheet mass balance and IPCC sea level projections. (A) Measured ice loss from Greenland and Antarctica plotted against IPCC 5th Assessment Report predictions. “AR5 upper” range relates to the “business and usual” RCP8.5 scenario, whereas the “AR5 lower” range corresponds to the RCP2.6 scenario of strong action on carbon dioxide emissions. (B) Components of observed (IMBIE) and predicted (as in (A)) annual sea-level contributions from Greenland and Antarctica between 2007 and 2017, broken into components of ice-dynamics and surface mass balance (SMB). Adapted with permission from Slater et al. (2020).
Some glaciologists use numerical ice-sheet models to understand how fast the polar ice sheets can release mass to the ocean under warming scenarios. While such experiments are useful in understanding processes that may be responsible for mass loss, and much progress has been made in ice-sheet modelling over the last few decades, there still exists a number of limitations to the models that preclude accurate 21st Century predictions. Siegert et al. (2020) point to six issues that urgently need to be resolved as they would help reduce uncertainties in predictions: 1) mapping of subglacial topography, as model outputs are only as good as the inputs, and the landscapes beneath the Greenland and Antarctic ice sheets are far less well resolved than the potential resolution of the models; 2) collecting more ocean data at the ice-sheet marine margins to better comprehend the supply of heat to the most vulnerable sections of the ice sheet; 3) acquiring geophysical information from the ice-bed interface, as the material properties of the bed dictate how rapid the ice can flow to the ocean; 4) improving the coupling between ice sheet, ocean and atmospheric models, to allow feedbacks and process interplays to be factored into predictions; 5) undertaking laboratory investigations of ice fracturing, as it can lead to sudden changes in ice-sheet conditions – such by the disintegration of floating ice shelves; and 6) enhancing our knowledge of past changes in order to “train” models.
Depending on which model is chosen and which climate scenario plays out, one can arrive at predictions of both less than (Edwards et al., 2021) and more than (DeConto et al., 2021) 1 m of sea level rise this Century from all sources. A reasonable characterisation of the problem might be to conclude sea-level rise of around 1 m by this Century is certainly possible, but higher outcomes cannot be ruled out given uncertainties in the models and the warming that will occur in coming decades. Resolving modelling issues would help the problem greatly and is possible, but would require a significant research effort and funding. Given the benefit of reduced uncertainty in expected 21st Century sea level rise to hundreds of millions of livelihoods, and trillions of dollars of capital locked into coastal towns and cities, it seems obvious that it should be a research imperative.
Improving models and their inputs alone may not be enough to drive the necessary policies, however. In addition, an ‘early warning system’ is needed to know whether the ice-sheet environment is on a path to a >1 m sea-level rise by 2100. Such a system, comprising satellites, airborne platforms, robotic devices, field investigators and expert knowledge, is already good but has major weaknesses in the ice-sheet regions that are most vulnerable, and so this too requires urgent action. The required technology to do this is largely available, but the scale of deployment is presently inadequate.
Sea-Level Rise Under Mid-Century Temperature Threshold Exceedance
Although studies using aggregated Earth system modelling, such as Edwards et al. (2021), and more dynamical observation-based models, such as DeConto et al. (2021), may appear to diverge in 21st century sea-level estimates, much of these differences disappear in longer time frames. Unfortunately, however, too few studies look beyond 2100 (a date set by the IPCC over 30 years ago for its first assessment of climate change, AR1) despite the long-term response of ice sheets to warming. Much of the public examination of DeConto et al. (2021) failed to take up its finding of massive irreversible sea-level rise, especially under high emissions (IPCC’s ‘RCP8.5’) where rates exceeded 5 cm per year by 2150, resulting in 10 m sea-level rise from Antarctica alone by 2300. In their model, under current nationally-determined contribution (NDC) policies and measures (agreed in Paris in 2015 and updated by some since), which might lead to warming of 2°C around mid-century and 3°C by 2100, aggressive CO2 removal initiated after 2060 (returning concentrations to pre-industrial levels) could not halt continued ice loss. This is because of the ocean-ice sheet interaction noted above, where the ocean continues to hold heat even after the atmosphere begins to cool, preventing maintenance of buttressing ice shelves that could restrict ice loss. DeConto et al. (2021) found threshold behaviour around 2°C of warming above pre-industrial levels, after which significant ice loss from Antarctica becomes irreversible. Under continued high-emissions consistent with RCP8.5, as is currently occurring with annual rates of increase in atmospheric CO2 of between 2 and 3 ppm (Schwalm et al., 2020), this 2°C threshold might be passed in less than 20 years. DeConto et al. (2021) also found a leap in rates of sea-level rise this century under RCP8.5 once 3°C of warming was exceeded, a finding not inconsistent with Edwards et al. (2021) when looking at 2100. The main acceleration did not occur until 2120, however.
The latest Working Group I IPCC Assessment (AR6) of the physical science took up these potential outcomes, stating in the Summary for Policymakers that with very high emissions, global mean sea level up to 2 m by 2100 and 5 m by 2150 “cannot be ruled out due to deep uncertainty in ice sheet processes” (IPCC, 2021). Such long-term outcomes would commit hundreds of millions of people to managed retreat in some of the most populated urban areas of the world. While this may not necessarily occur during the 21st century, many children of today are likely to still be living when the consequences of decisions made by adults today become apparent.
The contrast between the results of DeConto et al. (2021) and Edwards et al. (2021) points to two urgent research needs. First, to better understand committed and irreversible sea-level rise requires that models look beyond 2100, in order to more fully capture the total ice-sheet response, which primarily arises after the arbitrary 2100 benchmark. To stop at 2100 minimizes awareness of the impact of warming, as well as future needs for adaptation and, indeed, whether there are limits to what can be adapted (Haasnoot et al., 2020). Second, rather than continuing to aggregate modelling studies that often do not differentiate between more and less robust models in terms of capturing ice sheet behaviour, more dynamic-based studies are needed because, as Bassis et al. (2021) indicate, different assumptions about ice sheet behaviour may change estimates and rates of sea-level rise to significant degrees.
Focusing future research efforts on the development of more realistic, dynamical, observation-based models designed to reach beyond the 2100 benchmark, will greatly improve projections of coastal sea-level rise. It would provide invaluable support to nations for planning purposes, as well as potentially stimulating climate ambition by making the consequences of delayed mitigation more accessible to decision makers, including in the finance and insurance sectors.
Internationally-Coordinated Research, with Funding Appropriate to the Risk
While the scientific challenge is urgent yet tractable, it requires two essential elements. The first is a substantial increase in funding to allow the required advances in modelling technology and measurements. The second is international agreement and collaboration, because this is an issue shared by many that only requires one answer.
On funding, it is interesting to understand the present level at which field and computer-based research into sea-level rise is supported. Satellite data have proven essential to appreciate the increasing severity of the issue, and several have been launched over the last few decades on the order of £50–100m per satellite, with consequential funding needed to process data around £1–2m per year. While the former, as it is a research asset, can be supported by one-off investments, the latter, as it requires recurrent spending, would come from the annual budget of a national research council. To place the problem into context, the annual budget of United Kingdom Natural Environment Research Council (NERC) is around £300m, and that of the British Antarctic Survey is around £50m. These sums might seem like a lot, but they must support all areas of environmental science, maintain infrastructure and provide logistics. While government funds can be found to support large infrastructure needs, such as the United Kingdom’s new £200m polar research vessel RRS Sir David Attenborough, the funding to perform science using the ship must come out of NERC’s annual budget, potentially displacing other work if the costs are substantial. Hence, it seems challenging to see how an annual investment of, say, £100m for 10 years (£1Bn) into sea-level change would be possible from the United Kingdom alone, given the present funding arrangements.
While receiving less attention than polar bases and research vessels, the human and computer resource needs for the production of updated models, that encompass complex ice sheet dynamics and ocean-ice-sheet-atmosphere interactions, should not be underestimated. Use of less sophisticated models, and those ending at 2100, is not merely an issue of habit and “ease of use” for researchers, but results from limitations on available post-doctoral and graduate students, computer scientists and mathematicians to develop these more complex models. Use of improved models, especially running multi-century calculations in order to more fully capture the totality of ice sheet and sea level response, is constrained by availability of the super-computers needed to run and fine-tune experiments, often stretching into weeks or even months of computer time. Similar to polar research expeditions, a system of more national and international efforts to produce models that can be used as prognostic tools is needed to replace today’s more ad hoc system of grants to individual research teams competing for extremely limited funding.
This is not to say that expensive polar-based scientific projects have not, and cannot be, supported. The IceCube neutrino array at South Pole cost around $280m in 2010, the bulk of which can from the US National Science Foundation (NSF). However, while we cannot discount the possibility of substantial increases in the budgets of research councils specifically for sea level research, there may be an alternative approach that can be accommodated by more modest levels of national support; international coordination, collaboration and cost-sharing.
One programme that could be used as a template for future collaborative efforts is the International Thwaites Glacier Consortium (ITGC), led by the NSF and NERC, but also involving other nations, to better understand the processes driving mass loss in this vulnerable section of the West Antarctic Ice Sheet, the collapse of which may lead to unusually high rates of sea-level rise. There are multiple benefits of such an arrangement: 1) pooling talent; 2) deploying logistics; 3) mobilising facilities; and 4) sharing costs. The outcome is a programme that achieves more science than a national programme and at a reduced cost per nation. Such a programme also makes good use of facilities and logistics, and forms long-term research relationships that may lead to future collaboration. There are other examples, such as the ANDRILL and Cape Roberts drilling programmes, and the Integrated Ocean Drilling Programme (IODP), each having a similar collaborative element at their cores. With cost sharing between 10 nations, £10m each per year for 10 years would deliver £1Bn but this may still seem prohibitive from a research council perspective.
While the £1bn over 10 years price tag is nominal (although probably in the right ball park), it should be noted that this was precisely the level of funding agreed in 2016 by the Oil and Gas Climate Initiative (OGCI)- ten major oil and gas companies each providing £10m per year for 10 years – which initially was formed to support research and innovation on (predominantly) methane leaks and carbon capture and storage, so reducing emissions while reducing inefficiencies and potentially extending their existence into the zero carbon transition. Surely we can provide a similar amount for coordinated sea level research, especially given the need for more realistic and responsive coastal planning that ultimately would reduce loss and damage?
The answer to the sea-level funding problem is to realise that while research investment is needed, the major beneficiaries from the knowledge generated are likely to be non-scientific; i.e., our coastal communities, and the governments (local and national) overseeing adaptation plans and the development of new city infrastructure, as well as those in finance and insurance responsible for the security of investments. Because of this, it is perhaps inappropriate to expect scientific research councils to fund such a programme from their existing resources. As an international problem of the most critical nature, it requires an international solution with a suitable allocation of central government support, such as has been offered to alleviate the global COVID-19 crisis.
As international leaders convene in Glasgow in November 2021 to agree emissions reduction targets, they should also consider how international cooperation and support can lead to reduced sea-level rise uncertainty, and form a plan to achieve this within the coming decade. Political leaders and the scientific community would thereby provide a more secure future not only for the latter half of this century, but also for coming generations.
Data Availability Statement
The original contributions presented in the study are included in the article/supplementary material, further inquiries can be directed to the corresponding author.
Author Contributions
All authors listed have made a substantial, direct, and intellectual contribution to the work and approved it for publication.
Conflict of Interest
The authors declare that the research was conducted in the absence of any commercial or financial relationships that could be construed as a potential conflict of interest.
Publisher’s Note
All claims expressed in this article are solely those of the authors and do not necessarily represent those of their affiliated organizations, or those of the publisher, the editors and the reviewers. Any product that may be evaluated in this article, or claim that may be made by its manufacturer, is not guaranteed or endorsed by the publisher.
References
Aschwanden, A., Bartholomaus, T. C., Brinkerhoff, D. J., and Truffer, M. (2021). Brief Communication: A Roadmap towards Credible Projections of Ice Sheet Contribution to Sea-Levelin Review. Copernicus Publications. [preprint]. doi:10.5194/tc-2021-175
Bassis, J. N., Berg, B., Crawford, A. J., and Benn, D. I. (2021). Transition to marine Ice Cliff Instability Controlled by Ice Thickness Gradients and Velocity. Science 372, 1342–1344. doi:10.1126/science.abf6271
Broecker, W. (2010). The Great Ocean Conveyor: Discovering the Trigger for Abrupt Climate Change. Princeton: Princeton University Press. 9780691143545
Ciracì, E., Velicogna, I., and Swenson, S. (2020). Continuity of the Mass Loss of the World's Glaciers and Ice Caps from the GRACE and GRACE Follow‐On Missions. Geophys. Res. Lett. 47, e2019GL086926. doi:10.1029/2019GL086926
DeConto, R. M., Pollard, D., Alley, R. B., Velicogna, I., Gasson, E., Gomez, N., et al. (2021). The Paris Climate Agreement and Future Sea-Level Rise from Antarctica. Nature 593, 83–89. doi:10.1038/s41586-021-03427-0
Deschamps, P., Durand, N., Bard, E., Hamelin, B., Camoin, G., Thomas, A. L., et al. (2012). Ice-sheet Collapse and Sea-Level Rise at the Bølling Warming 14,600 Years ago. Nature 483, 559–564. doi:10.1038/nature10902
Dutton, A., Carlson, A. E., Long, A. J., Milne, G. A., Clark, P. U., DeConto, R., et al. (2015). Sea-level Rise Due to Polar Ice-Sheet Mass Loss during Past Warm Periods. Science 349, aaa4019. doi:10.1126/science.aaa4019
Edwards, T. L., Nowicki, S., Marzeion, B., Hock, R., Goelzer, H., Seroussi, H., et al. (2021). Projected Land Ice Contributions to Twenty-First-century Sea Level Rise. Nature 593, 74–82. doi:10.1038/s41586-021-03302-y
Farinotti, D., Huss, M., Fürst, J. J., Landmann, J., Machguth, H., Maussion, F., et al. (2019). A Consensus Estimate for the Ice Thickness Distribution of all Glaciers on Earth. Nat. Geosci. 12, 168–173. doi:10.1038/s41561-019-0300-3
Frederikse, T., Landerer, F., Caron, L., Adhikari, S., Parkes, D., Humphrey, V. W., et al. (2020). The Causes of Sea-Level Rise since 1900. Nature 584, 393–397. doi:10.1038/s41586-020-2591-3
IPCC (2019). “Summary for Policymakers,” in IPCC Special Report on the Ocean and Cryosphere in a Changing Climate. Editors H.-O. Pörtner, D. C. Roberts, V. Masson-Delmotte, P. Zhai, M. Tignor, E. Poloczanska, K. Mintenbeck, A. Alegría, M. Nicolaiet al. United Nations. https://www.ipcc.ch/srocc/chapter/summary-for-policymakers/.
Haasnoot, M., Biesbroek, R., Lawrence, J., Muccione, V., Lempert, R., and Glavovic, B. (2020). Defining the Solution Space to accelerate Climate Change adaptation. Reg. Environ. Change 20, 37. doi:10.1007/s10113-020-01623-8
Harrison, S., Smith, D. E., and Glasser, N. F. (2019). Late Quaternary Meltwater Pulses and Sea Level Change. J. Quat. Sci. 34, 1–15. doi:10.1002/jqs.3070
Lambeck, K., Rouby, H., Purcell, A., Sun, Y., and Sambridge, M. (2014). Sea Level and Global Ice Volumes from the Last Glacial Maximum to the Holocene. Proc. Natl. Acad. Sci. 111 (15), 15296–15303. doi:10.1073/pnas.1411762111
Lüthi, D., Le Floch, M., Bereiter, B., Blunier, T., Barnola, J.-M., Siegenthaler, U., et al. (2008). High-resolution Carbon Dioxide Concentration Record 650,000-800,000 Years before Present. Nature 453 (7193), 379–382. doi:10.1038/nature06949
Nerem, R. S., Beckley, B. D., Fasullo, J. T., Hamlington, B. D., Masters, D., and Mitchum, G. T. (2018). Climate-change-driven accelerated Sea-Level Rise Detected in the altimeter Era. Proc. Natl. Acad. Sci. USA 115, 2022–2025. doi:10.1073/pnas.1717312115
Pritchard, H. D., Arthern, R. J., Vaughan, D. G., and Edwards, L. A. (2009). Extensive Dynamic Thinning on the Margins of the Greenland and Antarctic Ice Sheets. Nature 461, 971–975. doi:10.1038/nature08471
Sasgen, I., Wouters, B., Gardner, A. S., King, M. D., Tedesco, M., Landerer, F. W., et al. (2020). Return to Rapid Ice Loss in Greenland and Record Loss in 2019 Detected by the GRACE-FO Satellites. Commun. Earth Environ. 1, 8. doi:10.1038/s43247-020-0010-1
Schwalm, C. R., Glendon, S., and Duffy, P. B. (2020). RCP8.5 Tracks Cumulative CO2emissions. Proc. Natl. Acad. Sci. USA 117, 19656–19657. doi:10.1073/pnas.2007117117
Shepherd, A., Ivins, E., Rignot, E., Smith, B., van den Broeke, M., Velicogna, I., et al. (2018). Mass Balance of the Antarctic Ice Sheet from 1992 to 2017. Nature 558, 219–222. doi:10.1038/s41586-018-0179-y
Siegert, M., Alley, R. B., Rignot, E., Englander, J., and Corell, R. (2020). Twenty-first century Sea-Level Rise Could Exceed IPCC Projections for strong-warming Futures. One Earth 3, 691–703. doi:10.1016/j.oneear.2020.11.002
Siegert, M. J. (2006). “Role of Glaciers and Ice Sheets in Climate and the Global Water Cycle,”. in Encyclopaedia of Hydrological Sciences. Editor M. G. Anderson Chichester, UK: Wiley 4–164. doi:10.1002/0470848944.hsa170
Siegert, M. J. (2017). Why Should We Worry about Sea Level Change? Front. Young Minds, 5, 41, doi:10.3389/frym.2017.00041
Slater, T., Hogg, A. E., and Mottram, R. (2020). Ice-sheet Losses Track High-End Sea-Level Rise Projections. Nat. Clim. Chang. 10, 879–881. doi:10.1038/s41558-020-0893-y
Keywords: ice sheets, climate warming, carbon dioxide, sea level, international collaboration
Citation: Siegert M and Pearson P (2021) Reducing Uncertainty in 21st Century Sea-Level Predictions and Beyond. Front. Environ. Sci. 9:751978. doi: 10.3389/fenvs.2021.751978
Received: 17 August 2021; Accepted: 15 September 2021;
Published: 30 September 2021.
Edited by:
Folco Giomi, Independent Researcher, Padova, ItalyReviewed by:
Alberto Barausse, University of Padua, ItalyCarlo Giupponi, Ca’ Foscari University of Venice, Italy
Copyright © 2021 Siegert and Pearson. This is an open-access article distributed under the terms of the Creative Commons Attribution License (CC BY). The use, distribution or reproduction in other forums is permitted, provided the original author(s) and the copyright owner(s) are credited and that the original publication in this journal is cited, in accordance with accepted academic practice. No use, distribution or reproduction is permitted which does not comply with these terms.
*Correspondence: Martin Siegert, bS5zaWVnZXJ0QGltcGVyaWFsLmFjLnVr