 Andrew Rebeiro-Hargrave1*
 Pak Lun Fung2
 Samu Varjonen1
 Andres Huertas1Salla Sillanpää3
 Krista Luoma2
 Tareq Hussein4
 Tuukka Petäjä2
 Hilkka Timonen5
 Jukka Limo6
 Ville Nousiainen7Sasu Tarkoma1
- 1Department of Computer Science, University of Helsinki, Helsinki, Finland
- 2Institute for Atmospheric and Earth System Research/Physics, University of Helsinki, Helsinki, Finland
- 3Expert services, Finnish Meteorological Institute, Helsinki, Finland
- 4University of Jordan, Amman, Jordan
- 5Atmospheric Composition Research, Finnish Meteorological Institute, Helsinki, Finland
- 6City of Helsinki, Urban Environment Division, Helsinki, Finland
- 7Forum Virium, Helsinki, Finland
Air pollution is a contributor to approximately one in every nine deaths annually. Air quality monitoring is being carried out extensively in urban environments. Currently, however, city air quality stations are expensive to maintain resulting in sparse coverage and data is not readily available to citizens. This can be resolved by city-wide participatory sensing of air quality fluctuations using low-cost sensors. We introduce new concepts for participatory sensing: a voluntary community-based monitoring data forum for stakeholders to manage air pollution interventions; an automated system (cyber-physical system) for monitoring outdoor air quality and indoor air quality; programmable platform for calibration and generating virtual sensors using data from low-cost sensors and city monitoring stations. To test our concepts, we developed a low-cost sensor to measure particulate matter (PM2.5), nitrogen dioxide (NO2), carbon monoxide (CO), and ozone (O3) with GPS. We validated our approach in Helsinki, Finland, with participants carrying the sensor for 3 months during six data campaigns between 2019 and 2021. We demonstrate good correspondence between the calibrated low-cost sensor data and city’s monitoring station measurements. Data analysis of their personal exposure was made available to the participants and stored as historical data for later use. Combining the location of low cost sensor data with participants public profile, we generate proxy concentrations for black carbon and lung deposition of particles between districts, by age groups and by the weekday.
1 Introduction
Outdoor and indoor air pollution is considered the biggest environmental risk to health, carrying responsibility for about one in every nine deaths annually (Landrigan et al., 2018). In response, many cities commit to a fixed network of stations that monitor outdoor air quality in real-time. However, the high costs of installation and maintenance of these stations results in a sparse monitoring of outdoor ambient air, satisfying the conventional legislative requirements for population exposure but not for personal health protection. For example, in Europe, large cities tend to invest in one reference grade air quality PM2.5 monitor per 100,000–600,000 residents (Pinder et al., 2019) and in Africa, invest in one reference grade monitor per 4.5 million residents (Carvalho, 2016). Conversely, there are no networks of reference grade stations monitoring indoor air quality even though most people spend about 80–90% of their time indoors, 1–7% in a vehicle, and only 2–7% outdoors (Dias and Tchepel, 2018).
The sparse coverage of air quality monitoring and dissemination of personal exposure information can be alleviated by massive deployment of low cost sensors (Motlagh et al., 2020). Particularly, small sensor units that can be carried or worn all day long by people, enabling robust 24/7 personal exposure measurements (including indoor air). These sensor units are relatively low cost (€300 to €400 each), which allows large numbers of units to be purchased and enables simultaneous monitoring of a large number of places (Mahajan and Kumar, 2020). However, there is a large literature questioning the accuracy of low cost devices (Castell et al., 2017), and much effort spent in applying calibration techniques improving the data accuracy (Lin et al., 2018; Williams, 2019). Accepting the data quality issues, portable low cost sensor units have many benefits over fixed instruments such as be able to measure several air pollutants closer to the emission source and nearer to the individual’s inhaled air.
There is a mismatch between published city air quality index and an individual’s exposure to air pollution. Every individual has been exposed to air pollution during their life based on the concentration of air pollutant breathed at a particular time and place in both indoor and outdoor micro-environments. To assess personal exposure to air pollution therefore requires a full understanding of the individual’s mobility patterns (Dias and Tchepel, 2018). Knowledge of individual’s exposure to air pollution helps to reveal the links between pregnancy and low birth rate (Bekkar et al., 2020); childhood and working memory and attentiveness (Rivas et al., 2019), childhood and asthma hospitalization (Kuo et al., 2018), and elderly and reduction in memory and dementia (Peters et al., 2019). The duration of time individual’s spend in different micro environments underlines the associations between exposure and common health outcomes. For example, short term elevated exposure to ultrafine black carbon particles carrying toxic components along busy roads incidences with cardiopulmonary and respiratory diseases (Janssen et al., 2011). Variation in particulate matter and gases, such as NO2 and O3, in micro-environments are difficult to measure by stationary monitoring but can be estimated using portable sensor units with GPS carried by the users.
The dichotomy between individuals exposure to air pollution and population health can be rectified through participatory sensing of outdoor and indoor air quality data. There are four alternatives to applying low costs sensors for public health protection. The first is a citizen science project comprising citizen engagement, awareness raising, and co-creation with workshops to self-assemble their own sensors (Mahajan et al., 2020). The second is crowd sourcing or participatory sensing campaigns and asking citizens volunteering to carry sensors and supply air quality measurements in exchange for useful information that allow them to better understand and prevent harmful exposures they face (Jerrett et al., 2017). The third is deploy a voluntary community-based monitoring platform gathering citizens to aid in collecting, archiving, sharing, and using data for compulsory local or larger-scale assessment, planning, and decision-making. With community-based monitoring stakeholders “Do-it-Together” and use sensors and mobile phones to address local air pollution (Mahajan et al., 2021). The fourth is to allow citizens open access to an automated system - a cyber-physical system - providing a feedback loop between their sensor measurements, time activity patterns and exposure to air pollution (Rebeiro-Hargrave et al., 2020). These participatory sensing approaches help to influence local government city planning investments (Van Brussel and Huyse, 2019), sometimes through confrontation (Carton and Ache, 2017), and other times triggering behavioral change. However with these approaches there are sustainability issues. Citizen science and participatory sensing require on ground support and participation motivation is difficult to maintain over the long term (Sauermann et al., 2020).
We identify the research gap as the lack of a comprehensive computational framework to provide individuals personal exposure to air pollution information for outdoor and indoor micro-environments and calculate population health data at the district level for a city in real time. There is a need for an automated system enabling individuals from all age groups to connect low-cost sensors and creates a feedback loop between local air quality data and their time-space actions. This allows residents to be the owners of their air quality data and plan their own mitigation actions. In this paper, we present the design, development and deployment of the community based monitoring for participatory sensing air quality. Our contributions are as follows: community-based monitoring concept for low cost air quality monitoring. MegaSense, a cyber-physical system design for city-wide air-quality sensing using participatory sensed data. A battery-powered, portable low-cost air quality sensor design, tested in Helsinki by 136 volunteers. Network programmability concept for improving the data accuracy of attached low-cost sensors and creating three new virtual sensors. Analysis and demonstration use case of resulting air quality measurements.
2 Methods
As part of the EU Urban Innovative Actions project called HOPE (Healthy Outdoor Premises for Everyone), we developed a community-based monitoring system to simultaneously measure air quality from three districts in Helsinki, Finland with various challenges using participatory sensing during 2019–2021. We asked citizens to carry sensor units and supply outdoor and indoor air quality measurements during 3 month data campaigns where their live (Figure 1). In Jätkäsaari, a district with heavy port related traffic where the main air quality issue is construction dust (PM10). Jätkäsaari is one of the largest construction sites in Helsinki. Over a thousand new homes are currently being built. In Vallila, a district with street canyons and over 40,000 daily vehicles where the main air quality issues are street dust (PM10) during the spring time and traffic (NO2 and PM2.5). The spring-time street dust is mainly created through road gravel dust and studded tyres grinding the tarmac. Studded winter tires wear the asphalt, creating dust, which rises into the air as the roads dry. and in Pakila, a district affected by main roads but the main air quality issue is small-scale wood burning at homes contributing significantly to the emissions of PM2.5 and black carbon. Wood is burnt in most detached houses for supplementary heating, recreational purposes or in sauna stoves.
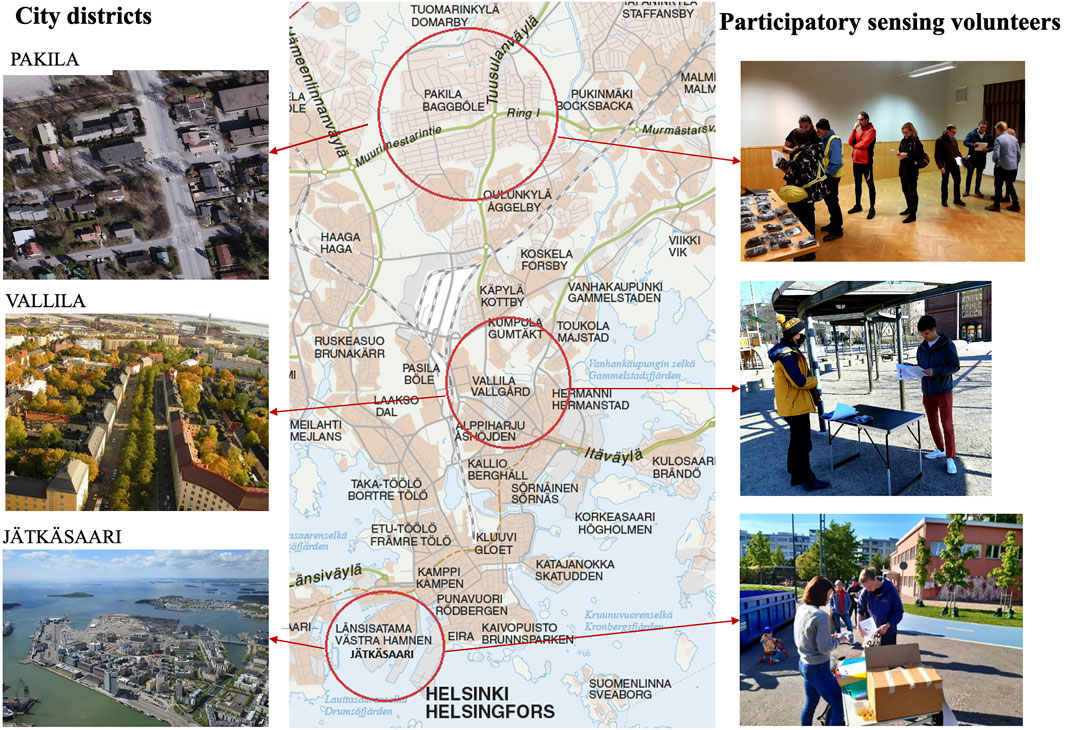
FIGURE 1. HOPE project city districts and participatory sensing air quality monitoring volunteers in Helsinki, Finland.
2.1 Community-Based Monitoring
To reach participants, we created a community based monitoring data forum allowing multi-stakeholders to exchange air quality measurements and receive air quality information (Figure 2). Led by the City of Helsinki, the HOPE project stakeholders had a shared objective to empower Helsinki residents to participate in the management of reducing air pollution in their districts. Forum Virium organized citizen volunteers for participatory sensing from the three districts for six data campaigns. Helsinki Regional Environmental Services (HSY) gave access to local city monitoring stations data to calibrate the HOPE sensor units. The University of Helsinki provided the citizen volunteers HOPE sensor units during to monitor outdoor and indoor air quality and HOPE mobile phone app to visualize their personal exposure. Finnish Meteorological Institute upgraded their city-wide ENFUSER Air Quality Land Use Regression service (Nurminen et al., 2020). Vaisala extended the fixed air quality network (Petäjä et al., 2021). UseLess provided digital voting app for city interventions. Private companies were invited to pitch new air quality solutions through innovation competitions.
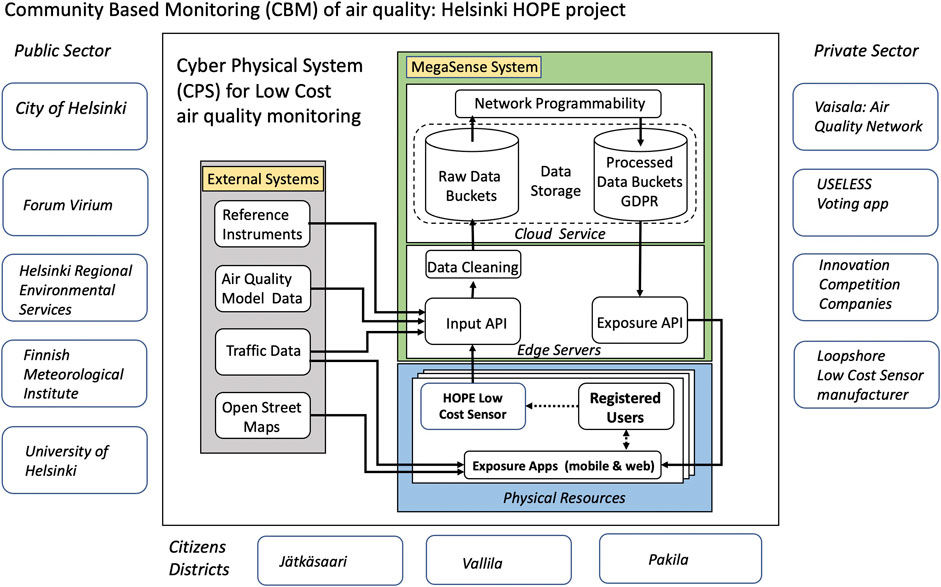
FIGURE 2. Community-based monitoring with cyber-physical system architecture for air quality monitoring.
2.2 MegaSense Cyber-Physical System
To automate the receipt and processing of participatory sensing data and provide users air quality information in real-time, we developed the MegaSense cyber-physical system. We implemented an architecture with a centralised cloud and distributed edge layer (Figure 2). The edge layer is a network of low-cost edge servers (€1000 to €2000 each) located nearer to the source of sensor units air quality measurements and data suppliers, such as in a shopping mall or in a city district. When active, a HOPE sensor unit is connected to the edge server as client secured by Hypertext Transfer Protocol Secure (HTTPS) which is an extension of the Hypertext Transfer Protocol (HTTP) and location data is encrypted using Transport Layer Security (TLS). When transmitting, the sensor unit measurements are received at the edge server’s input application programming interface (API). The data is cleaned (filtered) and sent to the centralized cloud for storage and analysis. The cloud service converts the raw measurement data to processed measurement data using analytical tools, stores the processed data, and makes the processed measurement data available for the edge exposure API. The cloud storage system is based on Lustre, a distributed production-grade file system similar to Amazon S3. The raw data and processed data are stored in buckets, representing different data sets enabling project separation, access control, and privacy. In data management, we adhere to General Data Protection Regulations (GDPR, 2018) and protect the registered users identifiable information. We share the HOPE sensor unit location only to the user. We apply strict security measures to protect the confidentiality, integrity, and availability of personal data when transferring, storing, or processing it. We use physical, administrative, and technical security measures to reduce the risk of loss, misuse, or unauthorized access, disclosure, or modification of stored personal data. All personal data is stored on secure servers operated by University of Helsinki with access limited to authorized personnel only. All administrative connections use Secure Shell (SSH), applying public/private key encryption, a block cipher, and a MAC to authenticate, validate, verify, and encrypt the sessions to the databases. At the end of the HOPE project, the research register is archived without identification data in the information systems of the Department of Computer Science of the University of Helsinki.
We applied an network programmability approach to automate the network of attached HOPE sensor units and continuously maximize network efficiency and functionality. We developed platform software to pull external data to the edge rest input API from open sources such as weather data from National Meteorological institutions, city reference station air pollution data from municipal bodies for sensor unit calibration and virtual sensors (see Section 2.4.2), traffic behaviour from city info sharing services, and geo-spatial applications such as OpenStreetMaps. Our approach allows for Land-Use Regression modelling, as it integrates different urban features to determining air quality patterns at different scale (Weissert et al., 2019). The service relays the processed measurement data and information to a web-based exposure app allowing the registered users to view personal air pollution exposure information as well as local pollution information in real time. We update network programmability component with the latest artificial intelligence techniques therefore simultaneously improving historical stored data and current data for the registered users.
2.3 HOPE Sensor Unit
To operationalize the MegaSense cyber-physical system and provide citizens a convenient and affordable method to measure their exposure to air pollution, the University of Helsinki designed a sensing unit based on a BMD-340 system module and mobile phone app called HOPE sensor unit (Rebeiro-Hargrave et al., 2020). The HOPE unit connects to Android and iOS smartphones over Bluetooth Low Energy, and the smartphones report their readings further to the collecting server and to the MegaSense system. The unit consists of low-cost sensing components purchased from different manufactures (Table 1) and we designed the connectivity between the components (Figure 3). The sensing unit samples the surrounding air based on cycle timer and writes the measurements to a data packet. The current cycle lasts 3 min in which the CO and NO2 sensor and O3 sensor heat up to 300–500°C before powering off for the next cycle. The reported readings include the temperature Temp, relative humidity RH, air pressure, battery level, UV, PM in different size ranges (PM1, PM2.5, PM4, PM10), NO2, CO, O3, positioning information and a timestamp. The unit is powered with a 3,500 mAh battery and enclosed in a 3D-printed case made of ESD-PETG filament. The form dimensions are: width 75 mm, depth 33 mm, height 127 mm, with weight 165 g. The front is protected by an aluminium mesh. General battery life before recharging via micro USB interface: 26 h. Indicator LEDs are used for communication and charging. Simple maintenance to clean away dust can be performed using pressurised air. The users attaches the HOPE sensor to backpack or a bag. The HOPE sensor unit is managed by the HOPE app for smartphones. The HOPE app from Android Smartphone was downloadable from Google play store under the name of HOPE project https://play.google.com/store/apps/details?id=com.loopshore.hope_app. For iOS the smartphones app was downloadable from Apple Testflight.
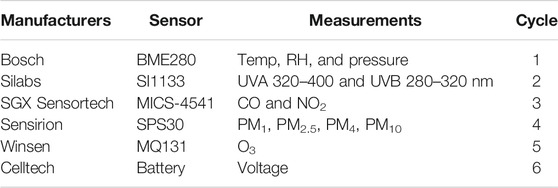
TABLE 1. Manufacturers of the sensors components, their measurements and when they are used by the cycle timer.
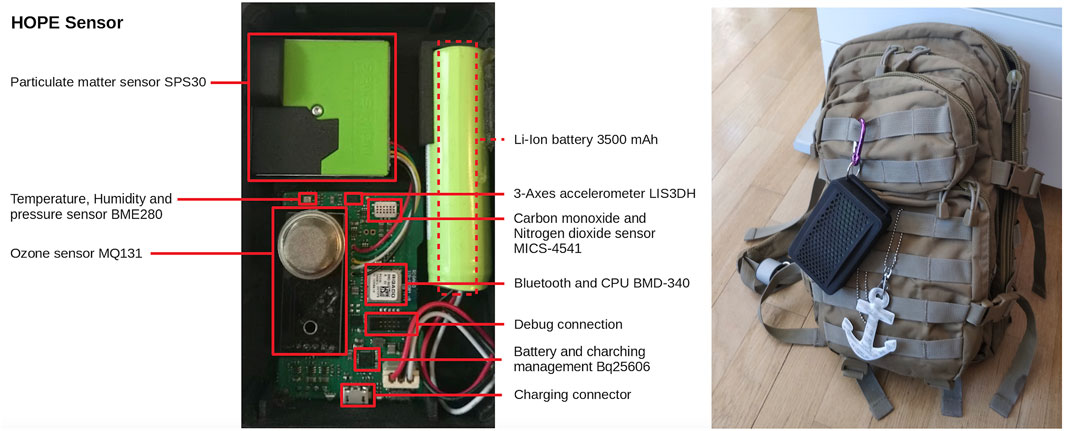
FIGURE 3. HOPE sensor unit developed for participatory sensing of air quality attached to a backpack.
2.4 Network Programmability
To manage the networks of low cost sensors, verify sensor data accuracy, deploy virtual sensors, and update sensors parameters, the MegaSense cloud uses network programmability software tools.
2.4.1 Low Cost Sensor Calibration
To ensure acceptable data accuracy of the HOPE sensor units during field operations, we developed a calibration procedure and calibration function for all the devices. Following manufacturing, four HOPE sensor units were calibrated for CO, NO2 and O3 at the University of Helsinki laboratory and PM2.5 in FMI laboratory in May 2019. Afterwards, four HOPE sensor units were co-located at HSY monitoring site in Mäkelänkatu reference station in Vallila for short-term field calibration. For long-term in-field calibration, an additional four HOPE devices were co-located against University of Helsinki Station for Measuring Ecosystem Atmosphere relations (SMEAR III) reference station between November 2019—February 2021, with several maintenance breaks in between. To develop the calibration function, we included two meteorological parameters Temp and RH as input variables to account for the effects of the ambient condition (Si et al., 2020). We applied a robust multiple linear regression to the four LCS as a whole to get the correction coefficients for all the four pollutant variables, i.e., NO2, CO, O3 and PM2.5:
where Cref and CLCS are concentration of the air pollutant of interest (in μg m−3) measured by the reference devices and the Hope sensor, respectively. β0 and the rest of the β values are the offset and the coefficients of the corresponding input variables, respectively (Table 2). The Pearson correlation coefficients (R) of the in-field calibration range from 0.13 to 0.54. The coefficients were affected by one HOPE sensor unit that performed poorly and the three other sensors were stable for 2 years of continuous measurement Due to the fair performance of calibration, the uncertainties of HOPE sensor measurements can be high, but the measurements are able to show the variability and relative difference when we make comparison in the later part of the paper. The HOPE device data conversion limits assumes an ambient pressure of 1 atm and a temperature of 25°C and units are reported in μg m−3.
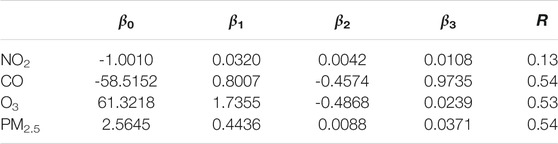
TABLE 2. Results showing the offsets and coefficients of the in-field calibration at SMEAR III. The Pearson correlation coefficients (R) of the in-field calibration is shown in the last column of the table.
2.4.2 Virtual Sensors for Black Carbon and Lung Deposited Surface Area
To maximize efficiency and functionality of the air quality monitoring network we implemented virtual sensors in the cloud utilising the Hope sensor unit measurements. We developed black carbon (BC) and lung deposited surface area (LDSA) virtual sensors to infer proxy estimations of their concentrations based on measured parameters. Our rationale was that low cost air quality monitoring typically measure PM2.5 and PM10 and neglect ultra fine particles (diameter of particles
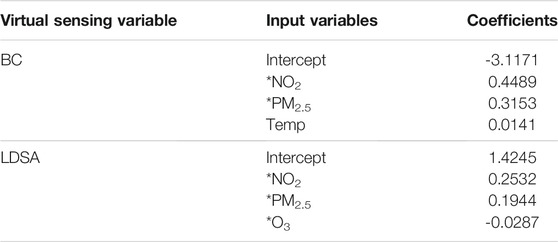
TABLE 3. Results showing the coefficients of the developed black carbon (BC, μg m−3) and lung deposited surface area (LDSA, μm2 cm−3) proxy using the reference measurements at Mäkelänkatu street canyon site. Asterisk (*) represents a natural logarithm of the input variable.
2.4.3 Virtual Sensor for Inhaled Dose Rate
To assess health outcomes of aerosol particle exposure, we developed a virtual sensor to estimate lung dose of submicron particles in the human respiratory tract and called it inhaled dosage rate (IDR). The IDR proxy is applied to the processed data to give users an coarse indicative measurements on the amount of aerosols deposited in the respiratory track during breathing. Since the HOPE LCS only measures PM2.5 (mass concentration) as an aerosol pollutants instead of number concentration with varying particle sizes, the IDR can be computed as below. (Hussein et al., 2019):
where IHR stands for the inhalation rate that depends on individual’s gender, age and the individual’s activity, and DF is the deposition fraction which illustrate how much particles deposited onto lung surfaces. Here, we make two assumptions for IHR and DF. First, we assume the HOPE device users are walking. Based on Holmes. (1994), IHR (in m3/hr) are 1.38 and 1.2 for male and female, respectively. Second, we make an assumption for the geometric mean diameter of ambient urban size distribution in Helsinki based on the size distribution data reported by Petäjä et al. (2021). DF for PM2.5 in this paper can then be assumed to have a range of 0.2–0.5 μg m−3, according to the size-dependent regional deposition factor curves by ICRP model (e.g., Hussein et al. (2013)).
2.5 Participatory Sensing Data Campaigns
Following the development of the cyber-physical system and the production of the HOPE sensor units, Forum Virium engaged a community of registered air quality activists across Helsinki (500 members) via social media. They announced the need for participatory sensing in three district and arranged the venues, including open spaces and libraries, for HOPE sensor unit handouts (Table 4). A total of 132 citizen volunteers took part in the data campaigns (27% of the air quality activist pool) and in total made 1,147,649 air quality measurements. The involvement of citizens to conduct co-design workshop was heavily impaired by the COVID-19 lockdown rules enforcing homeworking and limited contact between 2020–2021, as observed by other citizen science projects (Basile et al., 2021). Citizen workshops and feedback session were held online. The University of Helsinki managed the data operations. Prior to receiving a HOPE sensor unit, each citizen signed and kept a copy of privacy policy agreement outlining what personal data we were collecting (location and age group), how the data is collected (GPS), how we intend to use their information (scientific purposes), and whether we will disclose some or all of that information to any third parties (no). The participants were informed how to access their personal exposure data and their respective location vis-a-vis the pollutants from a personal web user page accessible with a unique password. Instructions for using for downloading the HOPE App and using the HOPE sensor unit were also made available as two YouTube videos. The participants were encouraged to carry the HOPE devices as they wanted to and make measurements in any environments.

TABLE 4. Participant age grouping and distribution in %, district campaign dates, the number of volunteers per district, and number of HOPE sensor device measurements.
To sustain and improve the participatory monitoring, we invited the same users to partake in subsequent data campaigns. However, most were new users. As common in citizen science projects, the motivation of participants to measure decreased after a few weeks (Sauermann and Franzoni, 2013). Accordingly, new motivation strategies implemented for each data campaign, including improving the look and feel of the personal exposure user web page, district gamification with an online leader board, and rewarding super users and active participates with electronic 5 €vouchers to local kiosks. To solicit feedback from the participants, feedback sessions were organized and online surveys created. Citizen volunteers response were varied: concerns about local outdoor air quality and pollution sources, concerns about their indoor air quality exposure. Some participants carried the devices when walking outside, others made measurements from their balconies or outside the window. Some were motivated by being able to contribute in making science.
3 Results With Discussion
To evaluate the results of the participatory sensing campaigns we query the MegaSense database and compare the data accuracy of Hope sensor units as a group against nearest official reference stations. We show examples of personal exposure profiles to air pollution in different micro environments. We demonstrate how Network programmability creates new insights into population exposure to air pollution.
3.1 Participatory Sensing Data Accuracy Against One Reference Station
To verify long-term HOPE sensor data accuracy, we compared the participants measurements to the nearest reference station for each district throughout the data campaigns in 2020. The mean distance between the HOPE sensor unit and reference station was 1–2 km. For Jätkäsaari campaign we compared the average of 22 sensors to HSY mobile monitoring station at Länsisatama. For Vallila campaign we compared the average of 24 sensors to SMEAR III station (a 31-m-high tower) at Kumpula. For Vallila, we compared the average of 24 sensors to HSY mobile monitoring station at Pirkkola. The results of the comparisons shows reference stations hourly PM2.5 concentrations were approximately 3 μg m−3 higher than HOPE sensors for the three districts (Figure 4). However, we can see different diurnal patterns and the PM2.5 values were in the same magnitude. The hourly PM2.5 concentrations in Pakila were 2 μg m−3 higher than Jätkäsaari and Vallila, perhaps reflecting residential wood burning. The average hourly PM2.5 concentrations in Vallila show diurnal variability. The spread of PM2.5 from HOPE sensors is higher during daytime probably because citizens carried the sensor units outdoors with all sorts of activities, for example walking dogs, transporting to work, etc. Activity to carry the sensor units was lower during nighttime, as most citizens left the sensors on indoors at home, which led to much lower PM2.5 compared to the outdoor reference station. The HOPE sensor data from Jätkäsaari did not show much variability.
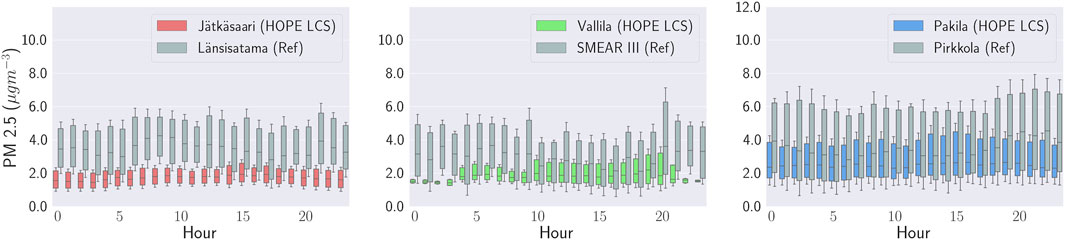
FIGURE 4. Hourly PM2.5 concentrations from HOPE sensors in comparison with that measured at reference stations in the districts of (A) Jätkäsaari (red bars), (B) Valilla (green bars) and (C) Pakila (blue bars), in the campaigns in 2020. The grey bars represent the hourly PM2.5 concentrations at the corresponding nearest reference stations.
3.2 Participatory Sensing Data Accuracy Against Two Reference Stations
To verify HOPE sensor data accuracy at a more granular level we compared the participants measurements to the two nearest reference stations for Christmas week in Pakila 2019. We compared the average of 36 HOPE sensors against HSY mobile monitoring station at Pirkkola (1 km distance) and SMEAR III at Kumpula (5 km distance) and the results show good correspondence (Figure 5). To explore the dataset further, we defined that HOPE sensor measurements were made indoors when the sensor temperature measurements was greater than 19°C. The dataset reveals an interesting patterns for the last week of 2019 in Pakila when outdoor temperature fell from 6°C to −11°C. The hourly PM2.5 concentrations peaked three times during the week: 1) December 24th, indoor PM2.5 rose early in the afternoon and in the evening, corresponding to traditional Christmas cooking and candles; 2) December 28th, a cold Saturday with temperature of −11°C, the average sensor measurements were in good correspondence with SMEAR III, inferring a large-scale background event; and 3) December 31st, corresponding with celebrations, indoor PM2.5 increased with cooking aerosols and outdoor PM2.5 increased due to firework particles. The HOPE sensor outdoor PM2.5 measurements were in general higher than the HSY reference stations, as the measurements were taken nearer to the emission sources.
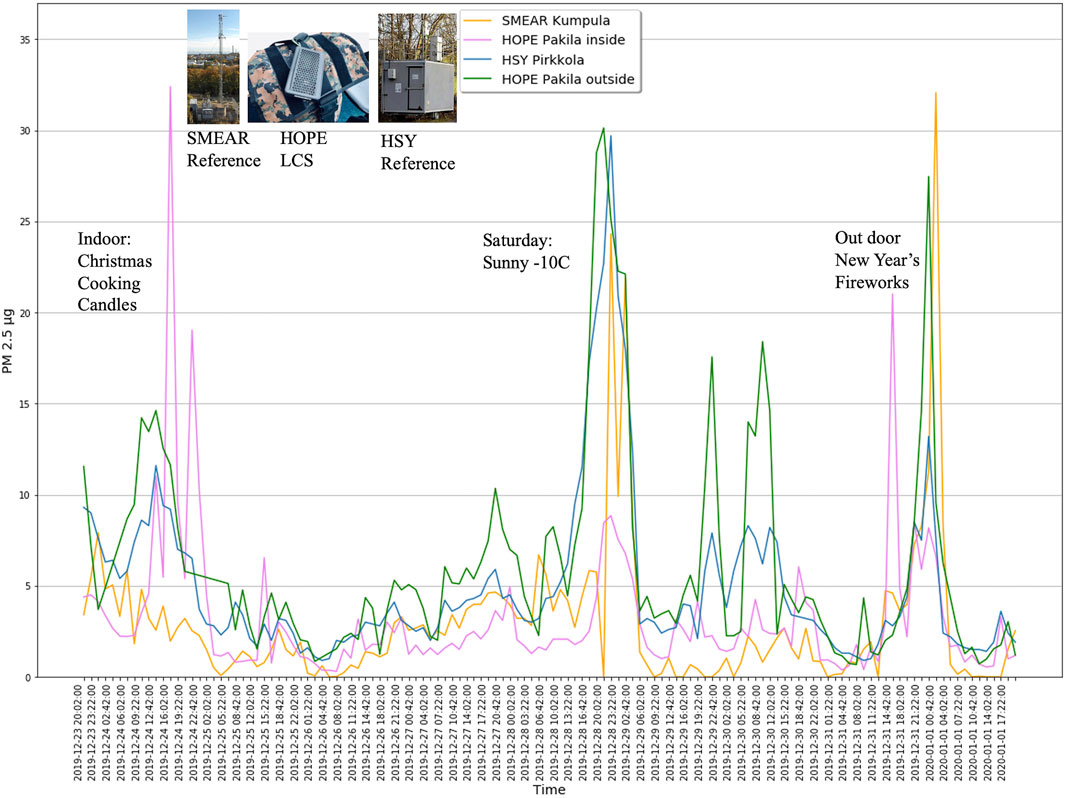
FIGURE 5. Hourly PM2.5 concentrations from HOPE sensors outdoors (green) and LCS indoors (pink) in comparison with that measured at reference stations in Pirkkola (blue) and SMEAR III (yellow) in Pakila Christmas week (2019).
3.3 Personal Exposure to Air Pollution
Utilizing the HOPE sensor calibrated data, participants viewed their personal exposure to air pollution. When queried, the MegaSense system created a time-activity profile against the pollutant concentration in μg m−3 and displayed as a graph. Using the smartphone GPS locations, the exposure app overlayed the time activity onto Open Street Map and the participant can see where the exposure event (peaks) occurred and when. An example of personal exposure to air pollution for New Year’s Eve (December 31, 2020) is shown in Figure 6. The personal exposure profile depicts minor fluctuations for PM2.5 NO2, O3 exposure in enclosed indoor environments, residential address and inside a car, and marked exposure fluctuations when walking outside. The HOPE sensor PM2.5 compared well with SMEAR III readings (not shown) but sensor NO2 and O3 were almost as twice the corresponding SMEAR III measurements. The personal exposure profile captured three elevated peaks during New Year’s Eve fireworks celebrations which occurred throughout Helsinki (Petäjä et al., 2021). Not only did PM2.5 peak late in the evening when the participant went for a walk, the was a general indoor air increase of PM2.5 starting from 17:00 onward showing the effects of ambient air pollution inside the residence.
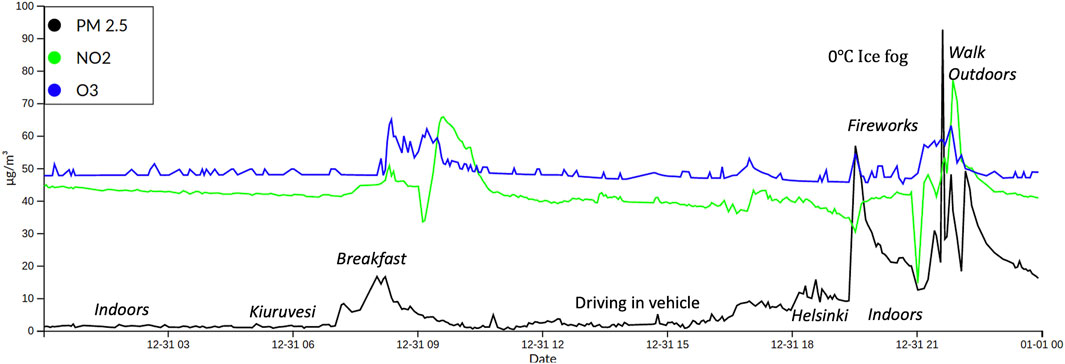
FIGURE 6. Hourly PM2.5, NO2. O2.5 concentrations measured by HOPE sensors unit (December 31, 2020). Time activity personal exposure profile for user travelling from Kiuruvesi to Helsinki and walking outdoor during firework displays.
3.4 Personal Exposure History to Air Pollution
The personal exposure history allowed participants to review their past time-activity profiles across the week and assess significant exposure events going back in time. The participant’s data is stored as processed data and is enriched by the latest AI algorithms meaning that system can produce new health-related information from the historical data. This is important for registered users wanting to correlate periodic illness such as previous asthma attacks (lung function and increased inflammation episodes) against short-exposure exposure in traffic and transit micro environments (Brokamp et al., 2019). An example of historical data, Figure 7 shows exposure profile for the first week in Helsinki (January 04, 2021–January 09, 2021) when outside temperatures dropped from −2 °C to −9°C. The weekly trend shows the short exposure periods in PM2.5 concentration exceeding the WHO limit values. The sensor was turned off or not charged during two afternoons indicating the importance of continuous measurements. The system superimposes the virtual sensor for IDR using the participant’s measurements. The top line based on male breathing rate the bottom line based on female breathing rate. The virtual sensors proxy concentration are affected when the sensor is off.
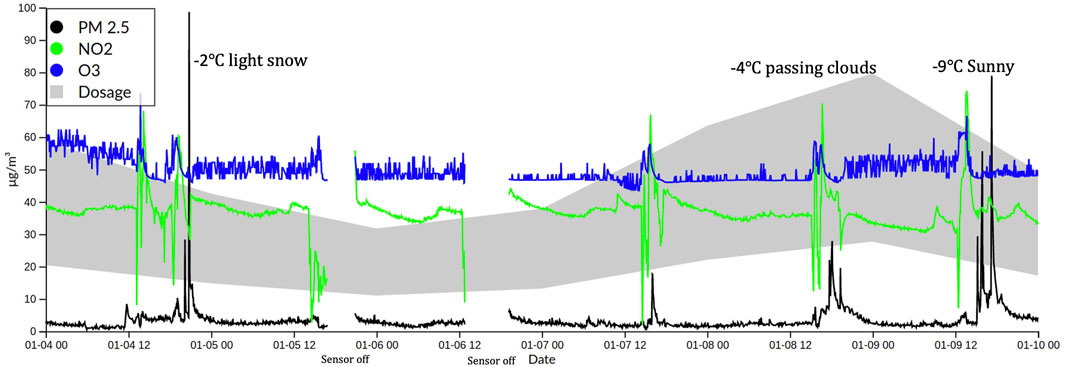
FIGURE 7. Hourly PM2.5, NO2. O2.5 concentrations measured by HOPE sensor unitincluding offline periods (January 04, 2021–10.01.2021). The grey envelope represents hourly inhaled dosage rate proxy. The top line of the grey area based on male breathing rate the bottom line based on female breathing rate.
3.5 Population Exposure to Air Pollution
The aggregation of personal exposure profiles give insights into population exposure to air pollution. Population exposure profiles of different districts leads to insights in the spatial and temporal characteristics of urban air quality. The data patterns that emerged from the participatory sensing campaigns support HOPE project objective to compare the three districts in terms of who are active participants, who are the most exposed participants and when is it best to intervene.
3.5.1 Participants Activity Behaviour
To determine who on were the most active in carrying the HOPE sensor unit we examined the average time-activity data across the participants age groups (Figure 8). In the MegaSense system, we associate the participant’s public profile with the HOPE sensor MAC address. To place the participants within the geographical boundaries of each district, we described the campaign areas and location information and the MegaSense system filtered all the data points (GPS locations of the participants measurements) using a defined GeoJSON polygon. Once we associated the HOPE sensors to their district, we estimated the distance carried by the participant using GPS information and the haversine formula. This performance indicator reveals the portability of HOPE sensors and gives insight to the users motivation to measure outdoor air quality throughout the week and per age group. The results show the total distance the participants carried the HOPE sensor throughout the data campaign per day was quite small (Figure 8). In Vallila, 24 residents carried the sensor unit an average of 0.68 km per day and there was little variability throughout the week. In Jätkäsaari, 22 residents carried the sensor unit an average of 0.80 km per day with a marked increase of distance every Friday’s. In Pakila, which is surrounded by parks, 9 residents, average distance was 2.23 km per day and greatest distance covered every Tuesday. In terms of motivations, it appears that age group (35–44) were the most active for making outdoor measurements in Jätkäsaari and age group (45–64) were most active. From the distance data, we can infer that many participants used the sensor unit for very short trips in their districts. The Pakila data was skewed by super users, a few active volunteers who travelled more than 5 km a day. Overall the data shows that many HOPE sensor measurements are made in the individuals houses reflecting that the participants spent most of their time indoors.
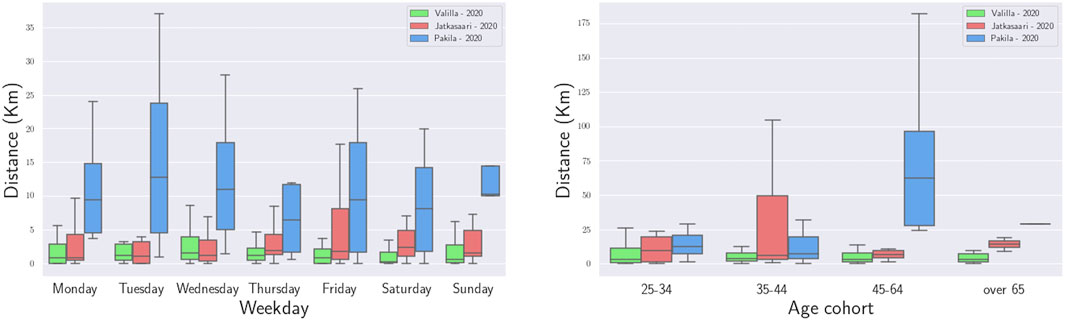
FIGURE 8. Total distance HOPE sensors units were carried for Valilla and Jätkäsaari citizens summer campaign and Pakila winter campaign against days of week and age cohort per district during data campaigns.
3.5.2 Participants Exposure Black Carbon and Lung Deposited Surface Area
To establish who are the most exposed between the three districts, we examined the BC and LDSA exposure (see Section 2.4.2) across the participants age groups (Figure 9). To verify the reliability of the BC proxy, we compared the virtual sensor results against typical BC concentrations in Helsinki as per Luoma et al. (2021): regional background areas 0.3 μg m−3, detached housing area 0.4–0.6 μg m−3, and traffic conditions ranging up to 0.6 between 1.4 μg m−3. We compared the LDSA proxy estimates against typical LDSA in Helsinki findings as per Kuula et al. (2020): regional background site 10 μm2 cm−3, detached housing area 12 μm2 cm−3, and traffic environment up to 22 μm2 cm−3. The virtual sensing results were surprisingly near to actual BC and LDSA measured values: Jätkäsaari represented typical traffic conditions in line with heavy port traffic and many construction vehicles. Vallila represented a typical regional urban background. Pakila represented a typical low-rise residential area with wood combustion emissions. Assessing the age group distribution, in Jätkäsaari, the youngest age group (24–34) were exposed to highest BC concentration and LDSA level even though they did not carry the sensor units very far, inferring, for example, that participants from this group could be living near busy roads and make very short outdoor trips during heavy traffic conditions. In Pakila, the age group (45–64) participant were exposed to lower LDSA level than the other age groups. Interestingly, this group was very active in carrying the HOPE LCS, and were probably outside their residence for longer than the other participants. Querying the MegaSense system database provides opportunities descriptive epidemiology and hypothesis generation.
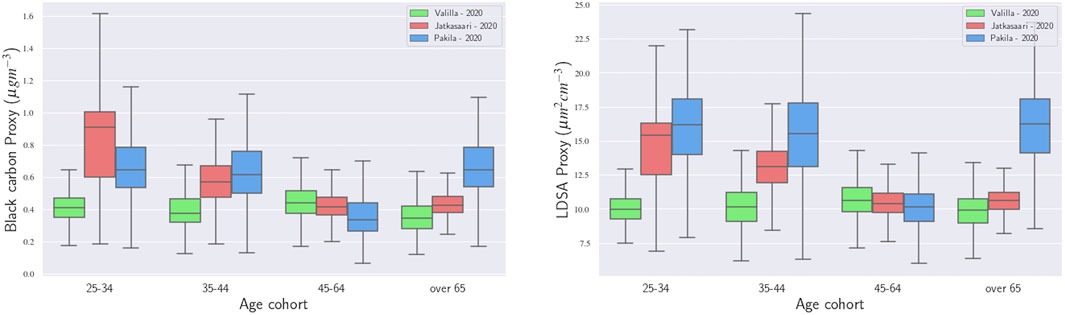
FIGURE 9. Hourly black carbon and lung deposited surface area (LDSA) proxy concentrations derived from HOPE sensors measurements compared to participants age groups for campaigns 2019–2020.
3.5.3 Planning Interventions
To ascertain when is it best to intervene and reduced air pollution in the three districts we examined the participants BC and LDSA proxy exposure for across the week days (Figure 10). This type of approach is useful for useful for city planners who have a mandate to improve air quality using a broad range of interventions that should lead to reductions in source emissions, followed by reduced ambient pollutant concentrations, reduced exposure/dose for the individual Burns et al. (2020). Taking this approach, the results revealed that Jätkäsaari had the highest BC and LDSA proxy levels throughout the week compared to the other districts with increased BC concentrations on Saturday and Wednesday (Figure 10). Pakila had highest LDSA on Sundays. Based on these findings, the city authorities could introduce traffic calming interventions for Jätkäsaari on Saturday and Wednesday leading to lower BC concentrations (Amato et al., 2010). The authorities could disseminate reminders to residents of Pakila to reduce wood burning on Sundays (Patel et al., 2018). These measures could be refined by allowing citizens to digitally vote on the magnitude of the intervention. We expected greater variability between week day and weekend, however show due to shift to COVID-19 related homeworking there are no clear pattern across the week apart from minor increases on Fridays and Wednesdays.
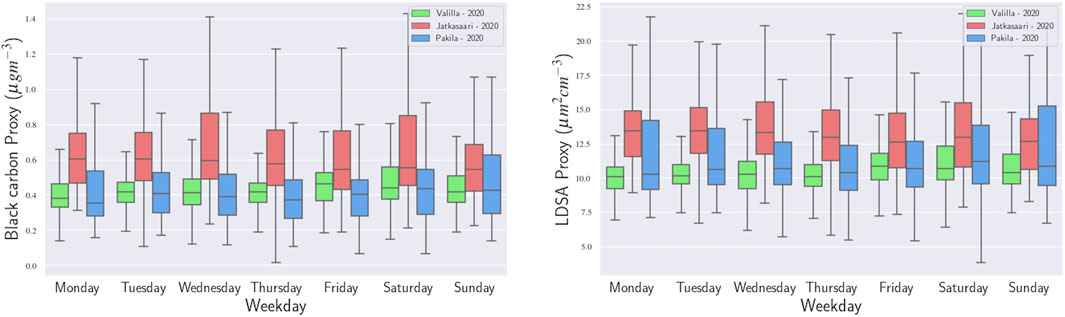
FIGURE 10. Hourly black carbon and lung deposited surface area proxy concentrations derived from HOPE sensors measurements compared to time of measurement across the week for campaigns 2019–2020.
4 Conclusion
We introduced a novel community-based monitoring system for air quality monitoring making full use of the portability of low cost sensors, and supporting next generation of low cost sensors as they evolve and improve in accuracy. For the first time, this research suggests that non regulatory air quality management and reduction of air pollution in urban environments is best served with a voluntary participatory sensing. Involving citizens in measuring the pollution on their own district can lead to the reduction of personal exposure to air pollution. At the same time, multiple stakeholders are guided in implementing public sector and scientific interventions to reduced air pollution at the district level. We piloted application of a cyber-physical system with distributed edge computation to synthesise city monitoring station’s measurements with low-cost sensors measurements and convert to more accurate processed data. We created innovative virtual sensors which assist citizens to understand their indoor and outdoor exposure into black carbon and lung deposited surface area proxy-based exposure and inhaled dosage. We allow citizens to see their personal exposure to multiple air pollutants in real-time and to download past measurements for historical analysis of their time-activity exposure patterns of the past 2 years, whilst protecting their privacy. The cyber-physical system creates district air quality profiles that informs multiple stakeholders on the feasibility of participatory sensing, low cost sensor performance, epidemiological modelling, and city-led intervention management.
There are many challenges that require further research. Regarding governance, community based monitoring requires a clear owner, and this may not be the local authority due to departmental crossovers. On the technical design, in the current MegaSense cyber-physical system, the cloud layer and edge layer are in the same infrastructure. However, the edge server will be tested in other cities in the future. The calibration and virtual sensors’ functions are developed in fixed outdoor environments and would benefit from evaluation on impact of the indoor environment. The indicative black carbon, lung deposited surface area and inhaled dosage proxies require validation against regulatory city monitoring. In terms of the participatory method of sensing, the observed ad-hoc pattern how citizens use the low cost sensors leads to data gaps. This highlights the need for continuous and long-term measurements, and the need to motivate participants towards more active lifestyles that would also lead to carrying the device for longer distances.
Data Availability Statement
The datasets presented in this study can be found in online repositories. The names of the repository/repositories and accession number(s) can be found below: https://megasense-server.cs.helsinki.fi.
Ethics Statement
The studies involving human participants were reviewed and approved by University of Helsinki Ethical Review Board, University of Helsinki. The patients/participants provided their written informed consent to participate in this study. Written informed consent was obtained from the individual(s) for the publication of any potentially identifiable images or data included in this article.
Author Contributions
All authors listed have made a substantial, direct, and intellectual contribution to the work and approved it for publication.
Funding
This work is supported by the European Union through the Urban Innovative Action Healthy Outdoor Premises for Everyone (project number UIA03-240) and Business Finland Project 6884/31/2018 MegaSense Smart City.
Conflict of Interest
Author VN was employed by the company Forum Virium.
The remaining authors declare that the research was conducted in the absence of any commercial or financial relationships that could be construed as a potential conflict of interest.
Publisher’s Note
All claims expressed in this article are solely those of the authors and do not necessarily represent those of their affiliated organizations, or those of the publisher, the editors and the reviewers. Any product that may be evaluated in this article, or claim that may be made by its manufacturer, is not guaranteed or endorsed by the publisher.
Acknowledgments
We acknowledge the contributions of Jarkko Niemi of Helsinki Region Environmental Services HSY providing access and data and the HSY reference stations.
References
Amato, F., Querol, X., Johansson, C., Nagl, C., and Alastuey, A. (2010). A Review on the Effectiveness of Street Sweeping, Washing and Dust Suppressants as Urban Pm Control Methods. Sci. total Environ. 408, 3070–3084. doi:10.1016/j.scitotenv.2010.04.025
Basile, M., Russo, L. F., Russo, V. G., Senese, A., and Bernardo, N. (2021). Birds Seen and Not Seen during the Covid-19 Pandemic: The Impact of Lockdown Measures on Citizen Science Bird Observations. Biol. Conservation 256, 109079. doi:10.1016/j.biocon.2021.109079
Bekkar, B., Pacheco, S., Basu, R., and DeNicola, N. (2020). Association of Air Pollution and Heat Exposure with Preterm Birth, Low Birth Weight, and Stillbirth in the US. JAMA Netw. Open 3, e208243. doi:10.1001/jamanetworkopen.2020.8243
Brokamp, C., Brandt, E. B., and Ryan, P. H. (2019). Assessing Exposure to Outdoor Air Pollution for Epidemiological Studies: Model-Based and Personal Sampling Strategies. J. Allergy Clin. Immunol. 143, 2002–2006. doi:10.1016/j.jaci.2019.04.019
Burns, J., Boogaard, H., Polus, S., Pfadenhauer, L. M., Rohwer, A. C., Van Erp, A. M., et al. (2020). Interventions to Reduce Ambient Air Pollution and Their Effects on Health: an Abridged cochrane Systematic Review. Environ. Int. 135, 105400. doi:10.1016/j.envint.2019.105400
Carton, L., and Ache, P. (2017). Citizen-sensor-networks to Confront Government Decision-Makers: Two Lessons from the netherlands. J. Environ. Manag. 196, 234–251. doi:10.1016/j.jenvman.2017.02.044
Carvalho, H. (2016). The Air We Breathe: Differentials in Global Air Quality Monitoring. Lancet Respir. Med. 4, 603–605. doi:10.1016/s2213-2600(16)30180-1
Castell, N., Dauge, F. R., Schneider, P., Vogt, M., Lerner, U., Fishbain, B., et al. (2017). Can Commercial Low-Cost Sensor Platforms Contribute to Air Quality Monitoring and Exposure Estimates? Environ. Int. 99, 293–302. doi:10.1016/j.envint.2016.12.007
Dias, D., and Tchepel, O. (2018). Spatial and Temporal Dynamics in Air Pollution Exposure Assessment. Int. J. Environ. Res. Public. Health. 15, 558. doi:10.3390/ijerph15030558
Fung, P. L., Zaidan, M. A., Sillanpää, S., Kousa, A., Niemi, J. V., Timonen, H., et al. (2020). Input-adaptive Proxy for Black Carbon as a Virtual Sensor. Sensors (Basel) 20, 182. doi:10.3390/s20010182
Fung, P. L., Zaidan, M. A., Niemi, J. V., Saukko, E., Timonen, H., Kousa, A., et al. (2021). Input-adaptive Linear Mixed-Effects Model for Estimating Alveolar Lung Deposited Surface Area (LDSA) Using Multipollutant Datasets. Atmos. Chem. Phys. Discuss., 1–33. doi:10.5194/acp-2021-427
GDPR (2018). General Data protection Regulation (GDPR). Available at: https://gdpr-info.eu/ (Accessed 10 12, 2021).
Holmes, J. (1994). “How Much Air Do We Breath?,” in Research Note 94–11 (CA, USA: California Environmental Protection Agency), 201–213.
Hussein, T., Löndahl, J., Paasonen, P., Koivisto, A. J., Petäjä, T., Hämeri, K., et al. (2013). Modeling Regional Deposited Dose of Submicron Aerosol Particles. Sci. total Environ. 458-460, 140–149. doi:10.1016/j.scitotenv.2013.04.022
Hussein, T., Saleh, S., dos Santos, V., Boor, B., Koivisto, A., and Löndahl, J. (2019). Regional Inhaled Deposited Dose of Urban Aerosols in an Eastern Mediterranean City. Atmosphere 10, 530. doi:10.3390/atmos10090530
Janssen, N. A. H., Hoek, G., Simic-Lawson, M., Fischer, P., Van Bree, L., Ten Brink, H., et al. (2011). Black Carbon as an Additional Indicator of the Adverse Health Effects of Airborne Particles Compared with PM10and PM2.5. Environ. Health Perspect. 119, 1691–1699. doi:10.1289/ehp.1003369
Jerrett, M., Donaire-Gonzalez, D., Popoola, O., Jones, R., Cohen, R. C., Almanza, E., et al. (2017). Validating Novel Air Pollution Sensors to Improve Exposure Estimates for Epidemiological Analyses and Citizen Science. Environ. Res. 158, 286–294. doi:10.1016/j.envres.2017.04.023
Kuo, C.-Y., Pan, R.-H., Chan, C.-K., Wu, C.-Y., Phan, D.-V., and Chan, C.-L. (2018). Application of a Time-Stratified Case-Crossover Design to Explore the Effects of Air Pollution and Season on Childhood Asthma Hospitalization in Cities of Differing Urban Patterns: Big Data Analytics of Government Open Data. Int. J. Environ. Res. Public Health 15, 647. doi:10.3390/ijerph15040647
Kuula, J., Kuuluvainen, H., Niemi, J. V., Saukko, E., Portin, H., Kousa, A., et al. (2020). Long-term Sensor Measurements of Lung Deposited Surface Area of Particulate Matter Emitted from Local Vehicular and Residential wood Combustion Sources. Aerosol Sci. Technol. 54, 190–202. doi:10.1080/02786826.2019.1668909
Landrigan, P. J., Fuller, R., Acosta, N. J. R., Adeyi, O., Arnold, R., Basu, N. N., et al. (2018). The Lancet Commission on Pollution and Health. Lancet 391, 462–512. doi:10.1016/S0140-6736(17)32345-0
Lin, Y., Dong, W., and Chen, Y. (2018). Calibrating Low-Cost Sensors by a Two-phase Learning Approach for Urban Air Quality Measurement. Proc. ACM Interact. Mob. Wearable Ubiquitous Technol. 2, 1–18. doi:10.1145/3191750
Luoma, K., Niemi, J. V., Aurela, M., Fung, P. L., Helin, A., Hussein, T., et al. (2021). Spatiotemporal Variation and Trends in Equivalent Black Carbon in the Helsinki Metropolitan Area in Finland. Atmos. Chem. Phys. 21, 1173–1189. doi:10.5194/acp-21-1173-2021
Mahajan, S., and Kumar, P. (2020). Evaluation of Low-Cost Sensors for Quantitative Personal Exposure Monitoring. Sustain. Cities Soc. 57, 102076. doi:10.1016/j.scs.2020.102076
Mahajan, S., Kumar, P., Pinto, J. A., Riccetti, A., Schaaf, K., Camprodon, G., et al. (2020). A Citizen Science Approach for Enhancing Public Understanding of Air Pollution. Sustain. Cities Soc. 52, 101800. doi:10.1016/j.scs.2019.101800
Mahajan, S., Luo, C.-H., Wu, D.-Y., and Chen, L.-J. (2021). From Do-it-yourself (Diy) to Do-it-together (Dit): Reflections on Designing a Citizen-Driven Air Quality Monitoring Framework in Taiwan. Sustain. Cities Soc. 66, 102628. doi:10.1016/j.scs.2020.102628
Motlagh, N. H., Lagerspetz, E., Nurmi, P., Li, X., Varjonen, S., Mineraud, J., et al. (2020). Toward Massive Scale Air Quality Monitoring. IEEE Commun. Mag. 58, 54–59. doi:10.1109/mcom.001.1900515
Nurminen, A., Malhi, A., Johansson, L., and Främling, K. (2020). “A Clean Air Journey Planner for Pedestrians Using High Resolution Near Real Time Air Quality Data,” in 2020 16th International Conference on Intelligent Environments (IE) (Madrid, Spain: IEEE), 44–51. doi:10.1109/ie49459.2020.9155068
Patel, S., Leavey, A., Sheshadri, A., Kumar, P., Kandikuppa, S., Tarsi, J., et al. (2018). Associations between Household Air Pollution and Reduced Lung Function in Women and Children in Rural Southern india. J. Appl. Toxicol. 38, 1405–1415. doi:10.1002/jat.3659
Petäjä, T., Ovaska, A., Fung, P. L., Poutanen, P., Yli-Ojanperä, J., Suikkola, J., et al. (2021). Added Value of Vaisala AQT530 Sensors as a Part of a Sensor Network for Comprehensive Air Quality Monitoring. Front. Environ. Sci. 9, 719567. doi:10.3389/fenvs.2021.719567
Peters, R., Ee, N., Peters, J., Booth, A., Mudway, I., and Anstey, K. J. (2019). Air Pollution and Dementia: a Systematic Review. J. Alzheimers Dis. 70, S145–S163. doi:10.3233/jad-180631
Pinder, R. W., Klopp, J. M., Kleiman, G., Hagler, G. S. W., Awe, Y., and Terry, S. (2019). Opportunities and Challenges for Filling the Air Quality Data gap in Low- and Middle-Income Countries. Atmos. Environ. 215, 116794. doi:10.1016/j.atmosenv.2019.06.032
Rebeiro-Hargrave, A., Motlagh, N. H., Varjonen, S., Lagerspetz, E., Nurmi, P., and Tarkoma, S. (2020). “Megasense: Cyber-Physical System for Real-Time Urban Air Quality Monitoring,” in 2020 15th IEEE Conference on Industrial Electronics and Applications (ICIEA) (Kristiansand, Norway: IEEE), 1–6. doi:10.1109/iciea48937.2020.9248143
Rivas, I., Basagaña, X., Cirach, M., López-Vicente, M., Suades-González, E., Garcia-Esteban, R., et al. (2019). Association between Early Life Exposure to Air Pollution and Working Memory and Attention. Environ. Health Perspect. 127, 057002. doi:10.1289/ehp3169
Sauermann, H., and Franzoni, C. (2013). Participation Dynamics in Crowd-Based Knowledge Production: The Scope and Sustainability of Interest-Based Motivation. SSRN Electron. J. doi:10.2139/ssrn.2360957
Sauermann, H., Vohland, K., Antoniou, V., Balázs, B., Göbel, C., Karatzas, K., et al. (2020). Citizen Science and Sustainability Transitions. Res. Pol. 49, 103978. doi:10.1016/j.respol.2020.103978
Si, M., Xiong, Y., Du, S., and Du, K. (2020). Evaluation and Calibration of a Low-Cost Particle Sensor in Ambient Conditions Using Machine-Learning Methods. Atmos. Meas. Tech. 13, 1693–1707. doi:10.5194/amt-13-1693-2020
Van Brussel, S., and Huyse, H. (2019). Citizen Science on Speed? Realising the Triple Objective of Scientific Rigour, Policy Influence and Deep Citizen Engagement in a Large-Scale Citizen Science Project on Ambient Air Quality in Antwerp. J. Environ. Plann. Manage. 62, 534–551. doi:10.1080/09640568.2018.1428183
Weissert, L. F., Alberti, K., Miskell, G., Pattinson, W., Salmond, J. A., Henshaw, G., et al. (2019). Low-cost Sensors and Microscale Land Use Regression: Data Fusion to Resolve Air Quality Variations with High Spatial and Temporal Resolution. Atmos. Environ. 213, 285–295. doi:10.1016/j.atmosenv.2019.06.019
Williams, D. E. (2019). Low Cost Sensor Networks: How Do We Know the Data Are Reliable? ACS Sens. 4, 2558–2565. doi:10.1021/acssensors.9b01455
Keywords: air pollution, low cost sensors, virtual sensors, personal exposure, sensor calibration, participatory sensing, community-based monitoring, cyber-physical system
Citation: Rebeiro-Hargrave A, Fung PL, Varjonen S, Huertas A, Sillanpää S, Luoma K, Hussein T, Petäjä T, Timonen H, Limo J, Nousiainen V and Tarkoma S (2021) City Wide Participatory Sensing of Air Quality. Front. Environ. Sci. 9:773778. doi: 10.3389/fenvs.2021.773778
Received: 10 September 2021; Accepted: 12 November 2021;
Published: 02 December 2021.
Edited by:
Marco Casazza, University of Naples Parthenope, ItalyReviewed by:
David Williams, University of Auckland, New ZealandTeddy Gunawan, International Islamic University Malaysia, Malaysia
Copyright © 2021 Rebeiro-Hargrave, Fung, Varjonen, Huertas, Sillanpää, Luoma, Hussein, Petäjä, Timonen, Limo, Nousiainen and Tarkoma. This is an open-access article distributed under the terms of the Creative Commons Attribution License (CC BY). The use, distribution or reproduction in other forums is permitted, provided the original author(s) and the copyright owner(s) are credited and that the original publication in this journal is cited, in accordance with accepted academic practice. No use, distribution or reproduction is permitted which does not comply with these terms.
*Correspondence: Andrew Rebeiro-Hargrave, YW5kcmV3LnJlYmVpcm8taGFyZ3JhdmVAaGVsc2lua2kuZmk=