 Zhenkai Yang1
 Zhichao Yin
 Zumian Xiao
- 1School of Economics and Management, Wuhan University, Wuhan, China
- 2School of Finance, Shandong University of Finance and Economics, Jinan, China
With the improvement of inclusive financial system, China’s economy has made significant development and growth. It worth in-depth investigation on environmental impact of financial inclusion, since growing GDP usually accompanied by more intensive carbon emission. This paper aims to reveal whether financial inclusion contributes to the carbon reduction in China using county-level dataset. A fixed-effect panel regression approach is adopted to examine the impact of financial inclusion on county-level regional carbon emissions. The estimation results imply that financial inclusion plays an important role in reducing carbon emissions. The mediation effect analysis reveals two channels through which financial inclusion imposes negative impact on the level of regional carbon emissions. One is to elevate the carbon sequestration capacity by increasing vegetation coverage, and the other is to improve the industrial structure through enhanced financial support. In addition to being a bridge between economic opportunity and output, financial inclusion can also act as an effective measure for addressing climate change.
Introduction
Global consensus has been reached that the emission of carbon dioxide and other greenhouse gases is the main cause of climate deterioration and its social and economic consequences. In addition, it can also cause significant harm to human health (Dong et al., 2021). In December 2015, 196 parties around the world entered into the “Paris Climate Change Agreement”. The goal of this agreement is to control the increase in global average temperature below 2°C. To achieve this goal, more effective policies are needed to control the growing carbon emissions (Cosmas et al., 2019).
This study examines the impact of financial inclusion on carbon emissions. We focus on issues in China as its carbon dioxide emissions account for a large proportion of the world. Financial inclusion has played an important role in China’s economic growth. Because of the fact that economic expansions usually come along with higher level of carbon emission, it is of great significance to study the impact of financial inclusion on carbon emissions. In addition, our research can shed light on similar situation that other developing countries may encounter with.
The Paris Climate Change Agreement emphasizes the important role of financial support for global climate governance. Recent studies support this notion. It is shown that the development of financial inclusion is an important factor affecting carbon emission of a country or region (Le et al., 2020). In theory, the development of financial inclusion may affect carbon emissions in opposite ways. On one hand, financial inclusion can lead to investment in technological innovation by broadening financing channels and reducing financing costs, which resulting in more energy-saving and environment friendly production (Tamazian et al., 2009). On the other hand, financial inclusion promotes economic growth, which further increases the demand for energy. An increase in energy demand usually means an increase in carbon emission (Sadorsky, 2010). The existing literatures have not yet reached a consistent conclusion about the impact of financial inclusion on carbon emissions, which is important and requires further research. At the same time, a considerate financial policy needs to be formulated by a country to achieve climate goals.
Comparing to alternative measures, improving the capacity of ecosystems to absorb carbon seems to be an appealing solution. However, either restoring land or afforestation require notable investments in labor, capital and other resources. The reality is that it is notoriously difficult to make the necessary investments in rural China. Another feasible approach, low carbon transition of industrial production, also requires considerable investment. Under such a background, financial inclusion can be adopted as an additional financing channel aiming at incentivizing low-carbon activities. Therefore, in combination with China’s institutional environment, it is of great significance to thoroughly examine the impact of financial inclusion on carbon emissions.
Figures 1, 2 depict the development of financial inclusion and carbon emissions of Chinese counties in 2016, respectively. The two indicators shown are highly heterogeneous in geographical distribution. No obvious correlation or causality relationships are observed. The investigation of the relationship between financial inclusion and carbon emissions relies on in-depth empirical analysis.
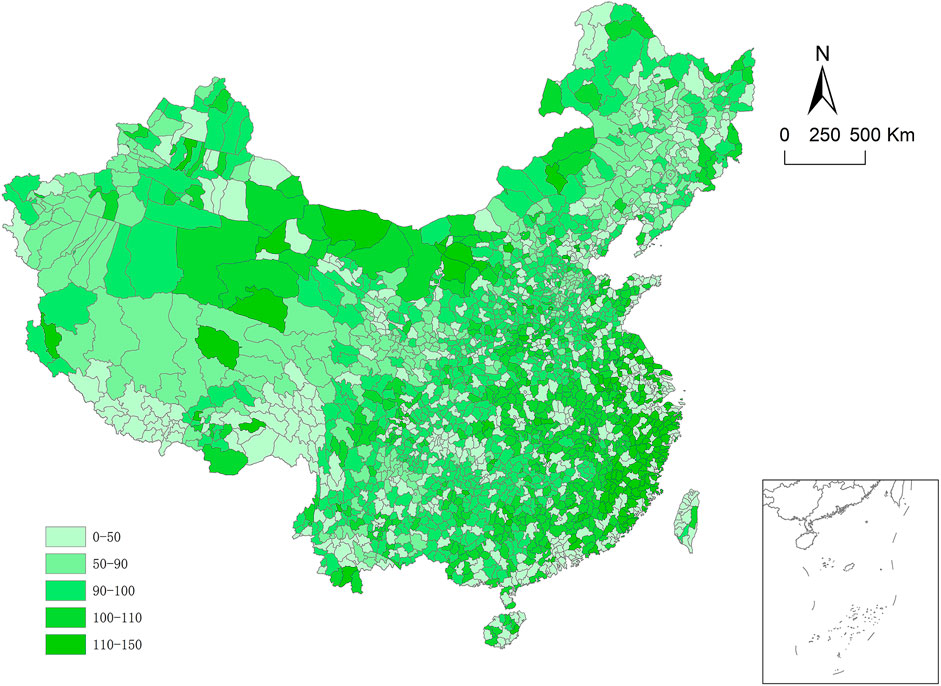
FIGURE 1. Financial inclusion index of Chinese counties in 2016. Data source: IDF, Available at https://en.idf.pku.edu.cn/index.htm.
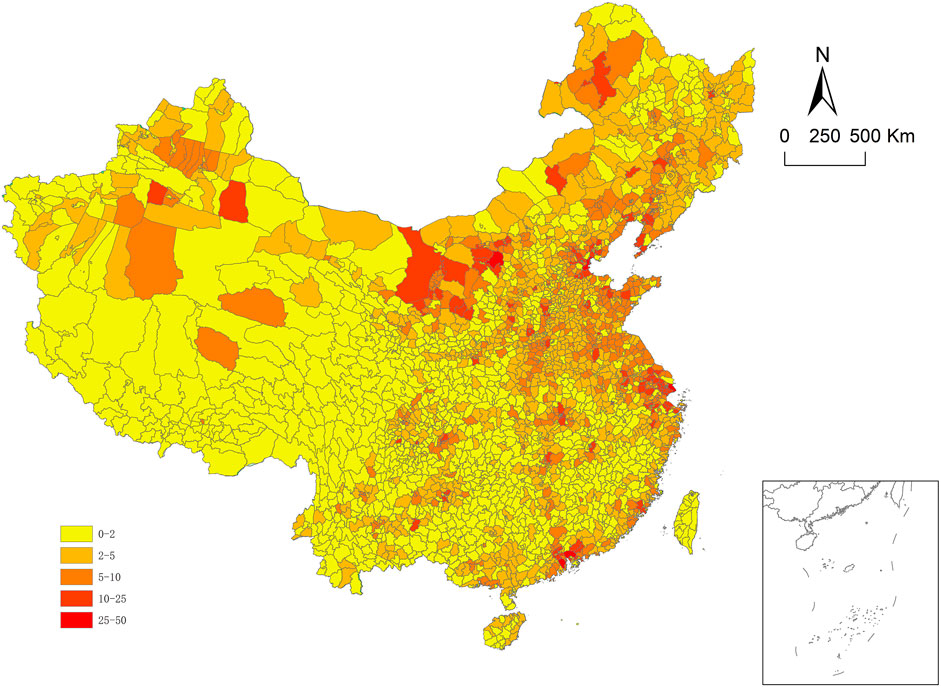
FIGURE 2. Carbon emissions of Chinese counties in 2016 (Million tons). Data source: Chen et al. (2020).
In recent years, China has been vigorously promoting the implementation of inclusive finance, which has greatly promoted economic development, especially in remote districts and counties. The continued involvement of businesses will be vital for unlocking opportunities to expand financial inclusion (World Bank, 2018). However, we should also pay attention to environmental quality while pursuing economic development. Dasgupta et al. (2001) noted that the capital market in developing countries may provide appropriate financial and reputation incentives for corporate pollution control, which may be an effective way of environmental governance. Thus, the research aims to explore the relationship between inclusive financial development and carbon emissions.
This paper evaluates the impact of the development of financial inclusion on carbon emissions based on panel data at county level. By providing more convenient and affordable access to finance, financial inclusion is able to elevate the efficiency and breadth of financial services. We adopt panel regression and mediation effect model and discover the carbon reduction effect of financial inclusion. Our findings are contrary to the relevant studies, such as Le et al. (2020) and Zaidi et al. (2021). They provide evidence that the development of financial inclusion is positively correlated with carbon emissions based on panel data from multiple countries. Compared with these studies, this paper suffers less from aggregation bias because of the county-level dataset, which is gathered from the basic administrative unit in China.
The marginal contributions of this paper to the literature are as follows: First, to the best of our knowledge, this paper is the first attempt to study the carbon reduction effect of financial inclusion in China at the county level. We use a dataset of greater data granularity compared to existing researches, which makes it possible to excavate deeper into the relationship between financial inclusion and carbon emission. Second, mediation effect model is introduced to unravel the mechanisms that how financial inclusion contributes to regional carbon reduction. The results help us to better understand why and how financial inclusion changes emission. Third, we decompose the financial inclusion index into three different dimensions, including the breadth of coverage, depth of use, and degree of digitization. By doing so, different aspects of financial inclusion development are taken into account. Thus, the impact of financial inclusion on carbon emission can be discussed more thoroughly. The empirical results shed light on the formation of China’s climate change policies.
The rest of this paper proceeds as follows. Second 2 is literature review. Second 3 presents the baseline model setting, methodologies, and variable selection. Second 4 discusses the empirical results and the mechanisms. Second 5 draws the conclusion and puts forward policy implications.
Literature Review
Since greenhouse gas emissions have triggered global climate problems, the academic community has conducted a great deal of research on the factors that influence carbon emissions. Existing literature shows that plenty factors significantly affect carbon emissions, such as urbanization, population size, income, energy consumption, GDP, financial development, and so on.
Wang W.-Z. et al. (2021) believe urbanization will affect carbon emissions through three paths that affect economic growth, energy efficiency, and consumption structure. Urbanization in OECD countries is conducive to reducing carbon dioxide emissions. Shafiei and Salim (2014) document that the impact of urbanization on carbon dioxide emissions is non-linear. When the level of urbanization in a country is low, it is usually accompanied by more serious environmental pollution; when the level of urbanization reaches a certain level, the degree of environmental pollution will decrease. Farhani (2015) examined the relationship between renewable energy consumption, economic growth and carbon dioxide emissions in 12 countries in Africa from 1975 to 2008. They find that renewable energy consumption played an important role in reducing carbon dioxide emissions. Li and Yuan (2014) argue that population size, income level and technological progress are the essential causes of the increase in global carbon emissions and climate warming. Saidi and Mbarek (2017) use a dataset from emerging market economies and find that financial development, income levels, trade openness, and urbanization are all driving factors of carbon dioxide emissions. Research from Malik et al. (2020) implies negative correlation between oil prices and carbon emissions. Rising oil prices reduce carbon emissions, and rising oil prices aggravate carbon emissions.
Except for the aforementioned factors, scholars also find that structural and technological factors could impose significant impact on carbon emission. Wang B. et al. (2021) point out that the allocation of industrial resources is the key factor affecting regional carbon emissions. Improving the efficiency of industrial resource allocation can significantly reduce carbon emissions. Khan and Yahong. (2021) believe that income inequality and population density play important role in changing the level of carbon emissions. Erdoğan et al. (2020) have studied the impact of innovation on sectoral carbon emissions based on data from 14 states of the G20 from 1991 to 2017. They find that innovation reduces carbon emissions in the industrial sector. However, innovation has no significant impact on carbon emissions in transportation, energy and other sectors.
Regarding the impact of financial development on carbon emissions, academic researchers have different views. On one hand, scholars have documented empirical evidence implying financial development leads to more carbon emissions. Sadorsky (2010) notes that financial development can make it easier for consumers to obtain credit, thereby stimulating consumers to purchase energy-consuming products such as cars, and increasing carbon emissions. Zhang (2011) adopts co-integration examination, Granger causality test, and variance decomposition methods to explore the impact of financial development on carbon emissions. The study suggests that China’s financial development is an important driving force for the increase in carbon emissions. And the size of financial intermediaries has the greatest impact on carbon emissions among other factors. Mahalik et al. (2016) believes that financial development makes it easier for companies to finance, and the expansion of production scale promotes carbon emissions.
On the other hand, there are also scholars argue that financial development can reduce carbon emissions. Tamazian et al. (2009) believe that financial development will increase R&D investment and improve resource utilization efficiency, resulting in reduced carbon emissions. Tamazian and Rao (2010) point out that there are certain prerequisites for financial development to improve environmental quality. Only under a well-functioning institutional framework can financial development help reducing carbon dioxide emissions, otherwise, it will lead to environmental degradation. Jalil and Feridun. (2011) use the autoregressive distributed lag (ARDL) method to examine the relationship between financial development and environmental pollution, and found that the coefficient of financial development was significantly negative, indicating that financial development reduced carbon emissions. Brunnschweiler (2010) uses panel data from 119 non-economic cooperation organizations from 1980 to 2006 and found that financial intermediaries represented by commercial banks can effectively increase the production of renewable energy, thereby reducing carbon emissions from traditional energy consumption.
The reason for the diametrically opposite conclusions, Nasreen and Anwar (2015) speculate, is that countries or regions are in different stages of economic development. In high-income countries or regions, financial development can help reducing carbon emissions, and in low- and middle-income countries or regions, financial development increases carbon emissions.
Previous literature has explored the impact of financial development on carbon emission (e.g., Brunnschweiler,2010). Our contribution to this growing literature is to focus on data with finer granularity and more dimentions, and to draw more explicit policy recommendations.
For the most relevant studies, Le et al. (2020) and Zaidi et al. (2021), positive correlation between the development of financial inclusion and carbon emissions has been observed. Using cross country panel data, these two studies argue that the improvement in financial inclusion leads to more intensive carbon emission. Compared with these studies, we construct a county-level dataset trying to minify the aggregation bias comes from the country-level macro data. And, the county-level dataset enables us to identify the mechanism and to perform in-depth analysis. In addition, we deeply analyze the impact of financial inclusion on carbon emission by decomposing the financial inclusion index into three different dimensions, including the breadth of coverage, depth of use, and degree of digitization.
Methodology and Data
Panel Regression Model
In terms of research methods, panel regression with time and individual fixed effect is introduced to estimate the impact of financial inclusion on carbon emission, which is consistent with the previous literatures. And the finer data granularity makes our estimates suffer much less from the aggregation bias. The baseline econometric model is as follow:
where, i and t denote county and year respectively.
Mediation Effect Model
This study evaluates the direct and indirect effects of financial inclusion on carbon emissions by estimating the mediation effect model. Figure 3 illustrates that the independent variable X can influence the dependent variable Y indirectly, through a mediator M. When there is no mediating effect, based on the coefficient estimation of independent variable X we can interpret the direct effect (c) of X on Y. And this is the only effect exists. When there is a mediator, the indirect effect (a-b) of X on Y through M (the mediator) should be considered, along with the direct effect (d). The mediation effect model is estimated using two-stage regression method.
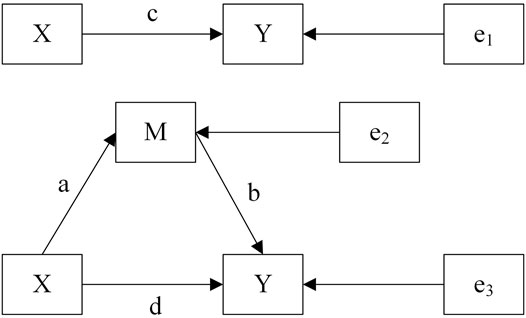
FIGURE 3. Illustration of mediation effect model.
Both carbon absorption and carbon dioxide production as channels through which financial inclusion could impose influence on carbon emission. Carbon sequestration of vegetation cover is the most important means of carbon absorption. And the industrial structure, industrial production value as a percent of gross regional product, determines the carbon intensity of regional production activities and decides carbon dioxide production. These two variables are good proxies for carbon absorbing and releasing. So, they are introduced as the mediators in our mechanism analysis.
1) In order to test the mediating effect of carbon sequestration, we adopt the following regression model:
2) In order to test the mediating effect of industrial structure, we adopt the following regression model:
By constructing these models, this study first examines the direct impact of financial inclusion on carbon reduction, and then we focus on the dual-channel chain carbon emission reduction effect of inclusive finance. The research framework of this study is shown in Figure 4.
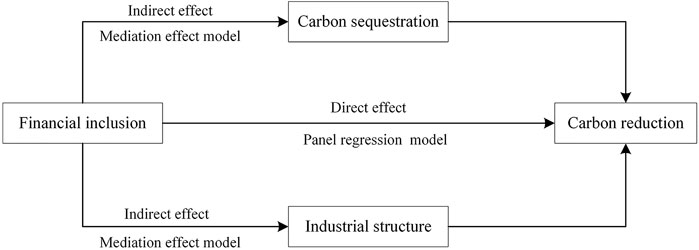
FIGURE 4. Financial inclusion and carbon reduction: analytical framework.
Data Description
We chose the largest possible time span. The financial inclusion index data is available from 2014 to 2020, and the county-level carbon emissions data is available from 1997 to 2016. Therefore, after merging the two databases, this paper uses environmental and economic data for the counties in China over the period of 2014–2016 for the empirical analysis. The data sources involved in the study are as follows: 1) Financial Inclusion Index is publicly available from the Institute of Digital Finance, Peking University (IDF)1. 2) Carbon emission and sequestration data for Chinese counties comes from Chen et al. (2020). 3) Control variables are gathered from “China Statistical Yearbook (County-Level)" published by National Bureau of Statistics of China. Table 1 reports the variable description and our data sources.
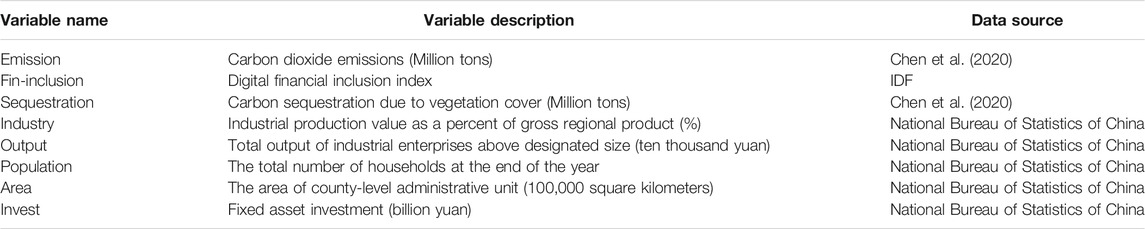
TABLE 1. Variable description and data source.
Empirical Results
Descriptive Statistics
After converting the dataset into a balanced panel, we have obtained 5,105 county-year observations. Descriptive statistics are reported in Table 2. The mean value of the financial inclusion index is 0.684, and the standard deviation is 0.212, indicating that there are significant differences in the development level of financial inclusion. The maximum of carbon emission is 25.71 and the average is 3.039, implying significant heterogeneity among regions.
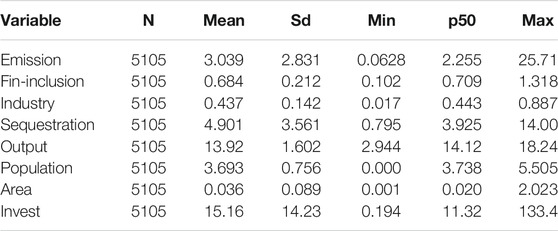
TABLE 2. Descriptive statistics.
Variable Correlation
Pearson test is performed to examine the correlation between variables. The results are shown in Table 3. The correlation coefficients are presented along with significance levels. If the absolute value of correlation above 0.8, it implies possible colinearity between the two variables. The correlation analysis of variables shows that the variables involved in the table do not have the problem of colinearity, indicating that the selection of variables is feasible.
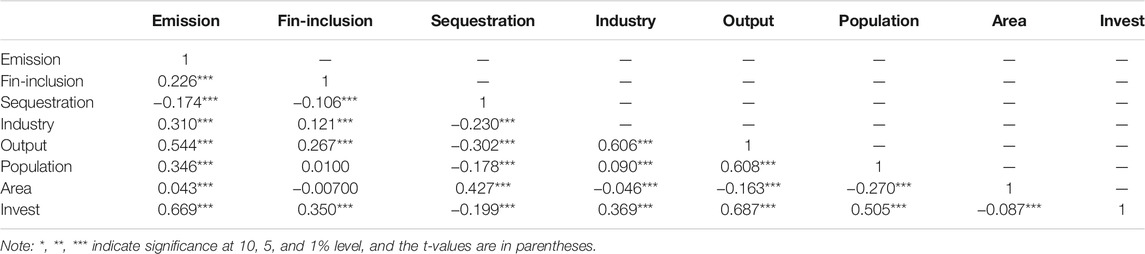
TABLE 3. Correlation coefficients.
Hausman Test
This study uses Hausman test to determine whether a fixed-effects model or a random-effects model should be adopted. The null hypothesis is that individual effects are not related to other independent variables. If the estimator obtained by OLS regression for the fixed-effect model is a consistent and efficient estimator of the true parameter, there will be no systematic difference between this estimator and a comparison estimator. The comparison estimator here refers to the estimator obtained by GLS regression for a random-effect model. If the null hypothesis is not true, the parameter estimates of the fixed-effect model are still consistent, while that of the random-effect model are not. Hausman test provides a statistical test quantity based on the difference of the parameter estimates of the two. Table 4 reports the Hausman test results. The p-value for the Chi-Sq statistic is 0.00. So, the null hypothesis should be rejected, implying a fixed-effect model should be used.
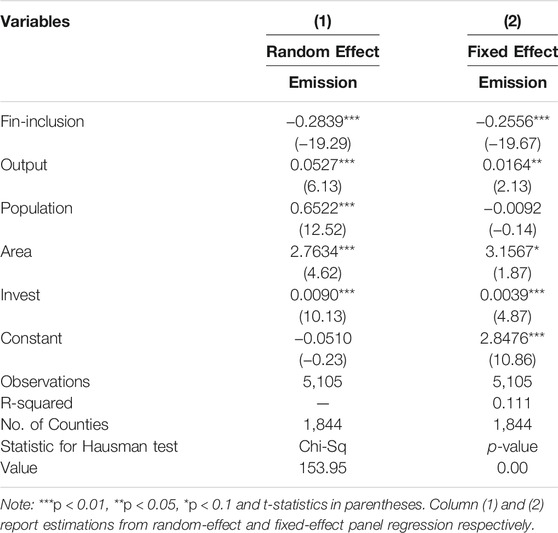
TABLE 4. Hausman test results.
Panel Regression Results
In order to investigate whether financial inclusion imposes significant impact on carbon emission, fixed-effect panel regression approach is adopted based on empirical model (1). Table 5 shows the estimates and statistics. The control variables are gradually added in columns (1) to (5). The coefficients of financial inclusion are all significantly negative and significant at the level of 1%, which indicates that the development of digital financial inclusion can effectively reduce carbon dioxide emissions. Aluko and Obalade (2020) have already pointed out that due to the low level of financial development of sub-Saharan Africa, the carbon dioxide emissions keep rising along with the booming energy consumption. Our findings are consistent with evidence provide by this study. It can be seen that the development of financial inclusion plays an important role in the process of carbon emission reduction.
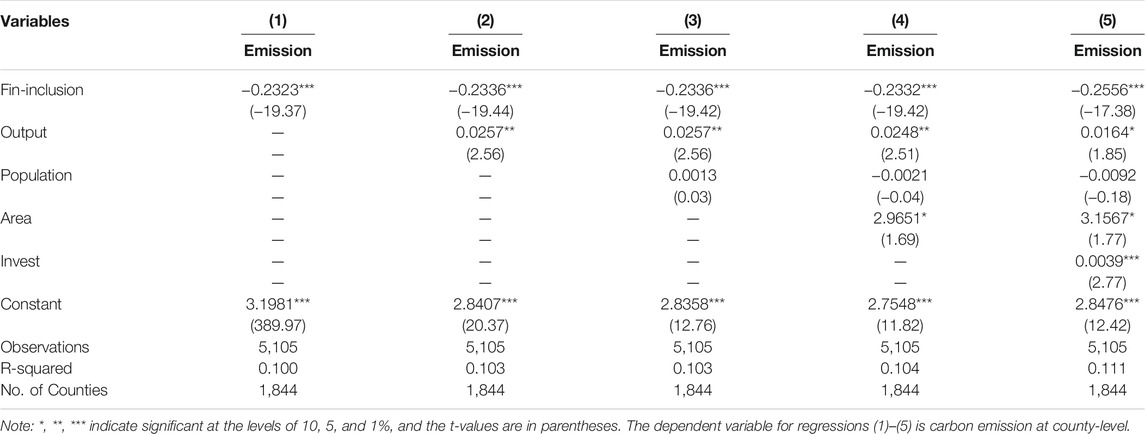
TABLE 5. Fixed-effect panel regression results.
The signs of the coefficients estimation of control variables are in line with expectations. In column (5), the coefficient of the county-level output value of industrial enterprises (Output) above designated size is significantly positive at the 10% level, indicating that the increase in regional output brings more carbon emissions. The coefficient of population is negative but not significant, which implies the scale of population is not necessarily a driving force of carbon reduction. Nevertheless, the area of counties (Area) is positively correlated with carbon emission, with a significance level of 10%. The coefficient of investment in fixed assets (Invest) is also significantly positive at the 1% level. Investment in fixed assets leads to a considerable increase in carbon emissions.
Mechanisms
Carbon Sequestration
We examine the mediation effects using a two-stage regression approach according to model (2)–(3). Estimation results are presented in Table 6. The estimated coefficient of digital financial inclusion in column (1) is 0.9675, which is significant at the 1% level, suggesting that the development of financial inclusion has significantly increased the amount of carbon sequestration from vegetation cover. The estimated coefficient of carbon sequestration in column (2) is significant negative, which indicates that financial inclusion can reduce carbon dioxide emissions by elevating the carbon sequestration from vegetation cover.
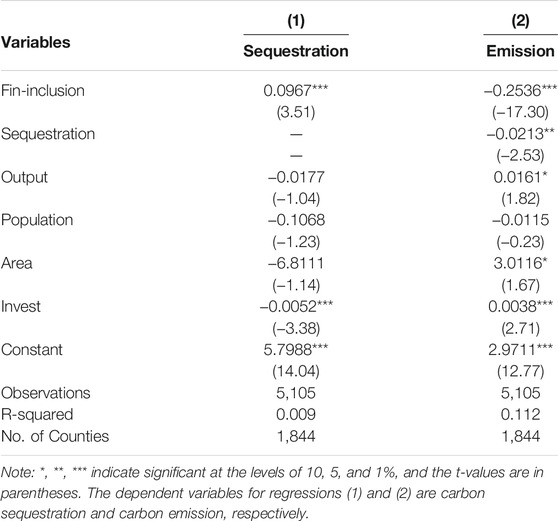
TABLE 6. Mediation effect estimation results: Carbon sequestration as mediator.
Financing constraints (such as limited financing channels and insufficient bank credit) have been identified as one of the biggest obstacles to the development of clean energy (Baulch et al., 2018). At the corporate level, the development of financial inclusion helps mitigating the financing constraints. Through such a channel, financial inclusion provides the companies opportunities to invest more in the research and development activities for energy-saving and environmentally friendly production technologies. Inclusive finance also makes clean energy more affordable for the consumers, which could arouse the motivation of households to choose more sustainable energy sources other than fossil fuels (IPA, 2017; Le et al., 2020). Substantial progress has been made in this regard in China’s land degraded areas, especially desert areas (Zhang et al., 2021). As an important terrestrial ecosystem, forests play a significant role in absorbing carbon emission and mitigating climate change. The development of financial inclusion can help increase vegetation coverage and improving carbon sequestration capacity.
Industrial Structure
In China, the concentration of carbon intensity industries is high. Compared to agriculture and service sector, the industrial production sector contributes much larger proportion of total carbon emission. In the wave of financial liberalization, digital financial inclusion, by providing diversified and professional wealth management, has effectively supplemented the insufficient and traditional financial system. It also improves the allocation efficiency of capital and labor. That’s because inclusive finance can create new investment opportunities and jobs by loosing the financial constraints of startups and small firms.
We use the variable of industrial structure as a mediator for another mediation effect model estimation. The model (4)–(5) is estimated, and the regression results are reported in Table 7. From column (1) of Table 7, we find that financial inclusion reduces the proportion of industrial output, which is positively correlated with carbon emissions. And column (2) shows that the financial inclusion impacts the level of emission through the channel of industrial structure variation. The literature documents that changes in the industrial structure can be driven by changes in consumer demand (Kongsamut et al., 2001) or the unbalanced development of technological progress in different sectors on the supply side (Acemoglu and Guerrieri, 2008). As a matter of fact, financial inclusion is able to affect both demand and supply side of the economy. That’s the reason why industrial structure can act as an effective mediator. Our results consistent with Mao. (2013), who argues that China’s development of a low-carbon economy relies heavily on financial technology innovation and industrial structure optimization.
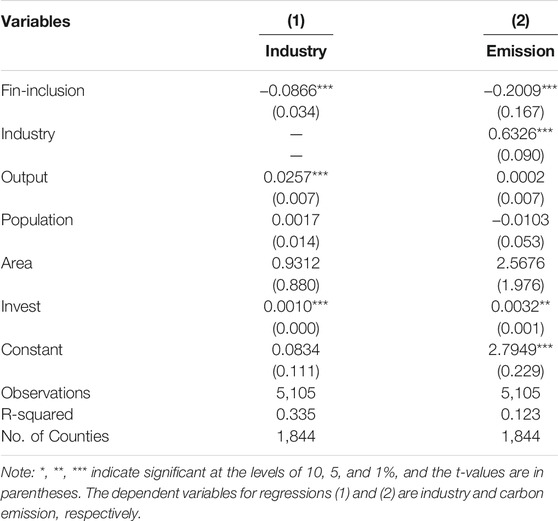
TABLE 7. Mediation effect estimation results: Industrial structure as mediator.
Heterogeneity
Geographic Heterogeneity
Significant heterogeneity exists in Chinese economy. According to the level of economic development in different regions, we divide the sample data into three groups, including eastern, central, and western region. Table 8 reports the impact of financial inclusion on carbon emissions in these three regions. Columns (1) to (3) contain coefficients estimates for the three regions respectively. The coefficients of financial inclusion in all columns imply that financial inclusion imposes significant inhibitory effect on carbon emissions across three regions. By comparing the absolute value of coefficients, we find that the carbon reduction effect of financial inclusion is strongest in the eastern region and weakest in the western region. The possible explanation is that the eastern region possesses the most developed financial system, which provides ideal infrastructure for the implementation of financial inclusion.
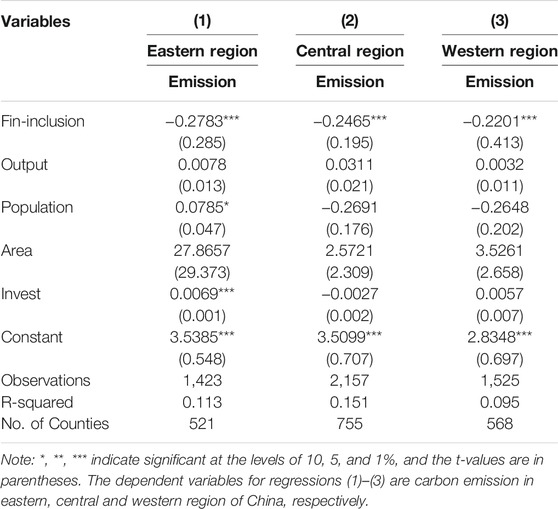
TABLE 8. Regional effects of financial inclusion on carbon emissions.
Decomposition of Financial Inclusion Index
Financial inclusion index is a composition of three sub-indicators: breadth of coverage, depth of use, and degree of digitization. The breadth of coverage reflects the coverage of inclusive finance services. The depth of use reflects the penetration of inclusive finance services in the financial field. And the degree of digitization reflects the degree that inclusive finance services are digitized. This study uses sub-indicators of the financial inclusion index to further examine the impact of various dimensions of financial inclusion on carbon emissions. Table 9 reports the regression results. Columns (1) to (3) investigate how the coverage, depth of use, and degree of digitization of financial inclusion would change regional carbon emission. The results show highly significant carbon reduction effect of all three sub-indicators, suggesting improvement in any of these three aspects could help reducing regional carbon emission.
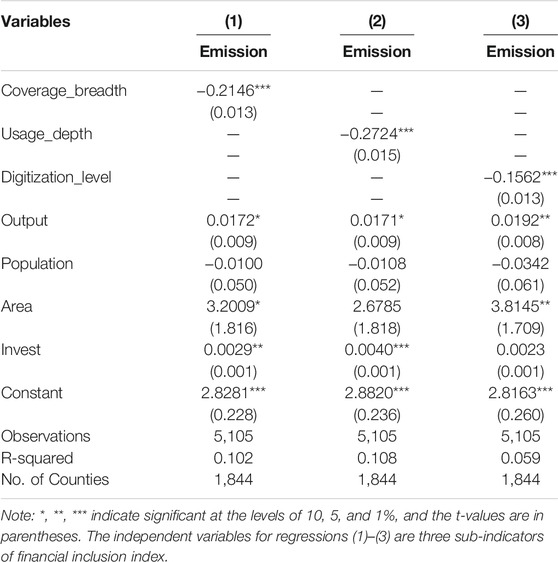
TABLE 9. Carbon reduction effect of sub-indicators on carbon emissions.
Conclusions and Policy Implications
This paper uses balanced panel data from 1,844 counties in China from 2014 to 2016 to investigate the relationship between the development of digital financial inclusion and carbon emissions. The study suggests that the development of digital financial inclusion can help reduce carbon dioxide emissions. The analysis of the mediation effect shows that digital financial inclusion mainly reduces carbon emissions by increasing the amount of carbon sequestration by vegetation cover and optimizing the industrial structure.
In China, the rural communities are commonly financially constrained. A large portion of them rely on agriculture. Afforestation and restoration activities may hamper their income growth and the way of living. As Wild et al. (2021) once pointed out that it is feasible to incentivize ecosystem management or restoration activities by introducing inclusive finance. Financial inclusion could provide the rural communities alternative working opportunities and financial support. It enables rural households to address the problems caused by restoration and afforestation, and even helps them to achieve more prosperous economic outcome.
The development of financial inclusion could improve industrial structure, which leads to lower level of carbon emission. Government should pay serious attention to the implementation of inclusive finance under the strategic goal of carbon neutrality. On one hand, it is necessary to strengthen the support of application financial inclusion for low-carbon industries and encourage the continuous flow of capital to finance the green industries. On the other hand, financial inclusion could smooth the adjustment path of economic industrial structure. Financial inclusion creates jobs and investment opportunities in agriculture and service industry, which help absorbing the unemployment caused by the exit of firms with high emission intensity.
Given the conclusions drawn above, we argue that the policy authorities and local institutions should fully promote the implementation of inclusive financial policy and give priority to providing financial support for low-carbon development. Further, we also stress that the construction of inclusive financial system in western regions should be strengthened. These revised policies may further assist country to improve environmental quality and meet its climate change targets. Limited by the availability of data, this paper only studies the impact of financial inclusion on carbon emissions. The future studies may aim to focus on the analysis of inclusive finance and environmental protection investment, energy consumption and green innovation to draw more explicit policy recommendations.
Data Availability Statement
The original contributions presented in the study are included in the article/Supplementary material, further inquiries can be directed to the corresponding author.
Author Contributions
ZYa: software, validation, resources, data curation, writing original draft. LY: writing—review and editing, and visualization. YL: conceptualization, methodology, formal analysis, investigation. ZYi: data curation, software, funding acquisition. ZX: writing—review and editing, supervision, project administration, and funding acquisition. All authors: contributed to the article and approved the submitted version.
Funding
We acknowledge the financial support from Shandong Provincial Natural Science Foundation (Grant Number: ZR2020QG032), Shandong Provincial Social Science Planning Office (Grant Numbers: 21DGLJ12; 21DJJJ02), Taishan Scholars Program of Shandong Province, China (Grant Numbers: ts201712059; tsqn201909135) and Youth Innovative Talent Technology Program of Shandong Province, China (Grant Number: 2019RWE004).
Conflict of Interest
The authors declare that the research was conducted in the absence of any commercial or financial relationships that could be construed as a potential conflict of interest.
Publisher’s Note
All claims expressed in this article are solely those of the authors and do not necessarily represent those of their affiliated organizations, or those of the publisher, the editors and the reviewers. Any product that may be evaluated in this article, or claim that may be made by its manufacturer, is not guaranteed or endorsed by the publisher.
Footnotes
1The official website for IDF is: https://en.idf.pku.edu.cn/index.htm.
References
Acemoglu, D., and Guerrieri, V. (2008). Capital Deepening and Nonbalanced Economic Growth. J. Polit. Economy 116 (3), 467–498. doi:10.1086/589523
Aluko, O. A., and Obalade, A. A. (2020). Financial Development and Environmental Quality in Sub-saharan Africa: Is There a Technology Effect? Sci. Total Environ. 747, 141515. doi:10.1016/j.scitotenv.2020.141515
Baulch, B., Duong Do, T., and Le, T.-H. (2018). Constraints to the Uptake of Solar home Systems in Ho Chi Minh City and Some Proposals for Improvement. Renew. Energ. 118, 245–256. doi:10.1016/j.renene.2017.10.106
Brunnschweiler, C. N. (2010). Finance for Renewable Energy: An Empirical Analysis of Developing and Transition Economies. Envir. Dev. Econ. 15 (3), 241–274. doi:10.1017/S1355770X1000001X
Chen, J., Gao, M., Cheng, S., Hou, W., and Shan, Y. (2020). County-level co2 emissions and sequestration in china during 1997-2017. Scientific Data 7 (1). doi:10.1038/s41597-020-00736-3
Cosmas, N. C., Chitedze, I., and Mourad, K. A. (2019). An Econometric Analysis of the Macroeconomic Determinants of Carbon Dioxide Emissions in Nigeria. Sci. Total Environ. 675, 313–324. doi:10.1016/j.scitotenv.2019.04.188
Dasgupta, S., Laplante, B., and Mamingi, N. (2001). Pollution and Capital Markets in Developing Countries. J. Environ. Econ. Manage. 42 (3), 310–335. doi:10.1006/jeem.2000.1161
Dong, H., Xue, M., Xiao, Y., and Liu, Y. (2021). Do carbon Emissions Impact the Health of Residents? Considering China's Industrialization and Urbanization. Sci. Total Environ. 758 (10120), 143688. doi:10.1016/j.scitotenv.2020.143688
Erdoğan, S., Yıldırım, S., Yıldırım, D. Ç., and Gedikli, A. (2020). The Effects of Innovation on Sectoral Carbon Emissions: Evidence from G20 Countries. J. Environ. Manage. 267, 110637. doi:10.1016/j.jenvman.2020.110637
Farhani, S. (2015). Renewable Energy Consumption, Economic Growth and CO2 Emissions: Evidence from Selected MENA Countries. Department of Research, Ipag Business School. Working Papers 2015-612.
IPA (2017). “Innovation for Poverty Action,” in Climate Change and Financial Inclusion (New Haven, Connecticut: Innovation for poverty action).
Jalil, A., and Feridun, M. (2011). The Impact of Growth, Energy and Financial Development on the Environment in China: A Cointegration Analysis. Energ. Econ. 33 (2), 284–291. doi:10.1016/j.eneco.2010.10.003
Khan, S., and Yahong, W. (2021). Symmetric and Asymmetric Impact of Poverty, Income Inequality, and Population on Carbon Emission in Pakistan: New Evidence from ARDL and NARDL Co-integration. Front. Environ. Sci. 9, 666362. doi:10.3389/fenvs.2021.666362
Kongsamut, P., Rebelo, S., and Xie, D. (2001). Beyond Balanced Growth. Rev. Econ. Stud. 68 (4), 869–882. doi:10.1111/1467-937X.00193
Le, T.-H., Le, H.-C., and Taghizadeh-Hesary, F. (2020). Does Financial Inclusion Impact CO2 Emissions? Evidence from Asia. Finance Res. Lett. 34, 101451. doi:10.1016/j.frl.2020.101451
Li, G., and Yuan, Y. (2014). Impact of Regional Development on Carbon Emission: Empirical Evidence across Countries. Chin. Geogr. Sci. 24 (5), 499–510. doi:10.1007/s11769-014-0710-5
Mahalik, M. K., Babu, M. S., Loganathan, N., and Shahbaz, M. (2017). Does Financial Development Intensify Energy Consumption in Saudi Arabia? Renew. Sustain. Energ. Rev. 75, 1022–1034. doi:10.1016/j.rser.2016.11.081
Malik, M. Y., Latif, K., Khan, Z., Butt, H. D., Hussain, M., and Nadeem, M. A. (2020). Symmetric and Asymmetric Impact of Oil price, FDI and Economic Growth on Carbon Emission in Pakistan: Evidence from ARDL and Non-linear ARDL Approach. Sci. Total Environ. 726, 138421. doi:10.1016/j.scitotenv.2020.138421
Mao, G., Dai, X., Wang, Y., Guo, J., Cheng, X., Fang, D., et al. (2013). Reducing Carbon Emissions in China: Industrial Structural Upgrade Based on System Dynamics. Energ. Strategy Rev. 2 (2), 199–204. doi:10.1016/j.esr.2013.07.004
Nasreen, S., and Anwar, S. (2015). The Impact of Economic and Financial Development on Environmental Degradation: An Empirical Assessment of EKC Hypothesis. Stud. Econ. Finance 32 (4), 485–502. doi:10.1108/sef-07-2013-0105
Sadorsky, P. (2010). The Impact of Financial Development on Energy Consumption in Emerging Economies. Energy Policy 38 (5), 2528–2535. doi:10.1016/j.enpol.2009.12.048
Saidi, K., and Mbarek, M. B. (2017). The Impact of Income, Trade, Urbanization, and Financial Development on CO2 Emissions in 19 Emerging Economies. Environ. Sci. Pollut. Res. 24 (14), 12748–12757. doi:10.1007/s11356-016-6303-3
Shafiei, S., and Salim, R. A. (2014). Non-renewable and Renewable Energy Consumption and CO2 Emissions in OECD Countries: A Comparative Analysis. Energy Policy 66, 547–556. doi:10.1016/j.enpol.2013.10.064
Tamazian, A., and Bhaskara Rao, B. (2010). Do economic, Financial and Institutional Developments Matter for Environmental Degradation? Evidence from Transitional Economies. Energ. Econ. 32 (1), 137–145. doi:10.1016/j.eneco.2009.04.004
Tamazian, A., Chousa, J. P., and Vadlamannati, K. C. (2009). Does Higher Economic and Financial Development lead to Environmental Degradation: Evidence from BRIC Countries. Energy Policy 37 (1), 246–253. doi:10.1016/j.enpol.2008.08.025
Wang, B., Yu, M., Zhu, Y., and Bao, P. (2021a). Unveiling the Driving Factors of Carbon Emissions from Industrial Resource Allocation in China: A Spatial Econometric Perspective. Energy Policy 158, 112557. doi:10.1016/j.enpol.2021.112557
Wang, W.-Z., Liu, L.-C., Liao, H., and Wei, Y.-M. (2021b). Impacts of Urbanization on Carbon Emissions: An Empirical Analysis from OECD Countries. Energy Policy 151, 112171. doi:10.1016/j.enpol.2021.112171
Wild, R., Egaru, M., Ellis-Jones, M., Bugembe, B., Mohamed, A., Ngigi, O., et al. (2021). Using Inclusive Finance to Significantly Scale Climate Change Adaptation. Berlin: Springer International Publishing, 2565–2590. doi:10.1007/978-3-030-45106-6_127
World Bank (2018). The Little Data Book on Financial Inclusion. Available at http://hdl.handle.net/10986/29654.
Zaidi, S. A. H., Hussain, M., and Uz Zaman, Q. (2021). Dynamic Linkages between Financial Inclusion and Carbon Emissions: Evidence from Selected OECD Countries. Resour. Environ. Sustainability 4, 100022. doi:10.1016/j.resenv.2021.100022
Zhang, Y.-J. (2011). The Impact of Financial Development on Carbon Emissions: An Empirical Analysis in China. Energy Policy 39 (4), 2197–2203. doi:10.1016/j.enpol.2011.02.026
Keywords: financial inclusion, carbon reduction, industrial structure, carbon emission, carbon sequestration
Citation: Yang Z, Yu L, Liu Y, Yin Z and Xiao Z (2022) Financial Inclusion and Carbon Reduction: Evidence From Chinese Counties. Front. Environ. Sci. 9:793221. doi: 10.3389/fenvs.2021.793221
Received: 11 October 2021; Accepted: 24 December 2021;
Published: 12 January 2022.
Edited by:
Yanfei Li, Hunan University of Technology and Business, ChinaCopyright © 2022 Yang, Yu, Liu, Yin and Xiao. This is an open-access article distributed under the terms of the Creative Commons Attribution License (CC BY). The use, distribution or reproduction in other forums is permitted, provided the original author(s) and the copyright owner(s) are credited and that the original publication in this journal is cited, in accordance with accepted academic practice. No use, distribution or reproduction is permitted which does not comply with these terms.
*Correspondence: Zumian Xiao, eGlhb3p1bWlhbkBzZHVmZS5lZHUuY24=