 Sarah E. Hale
 Baptiste Canivet2
 Ian J. Allan
- 1Geotechnics and Environment, Norwegian Geotechnical Institute (NGI), Oslo, Norway
- 2Norwegian Institute for Water Research (NIVA), Oslo, Norway
Per and polyfluoroalkyl substances (PFAS) are becoming more stringently regulated and as such, a more diverse suite of environmental monitoring methods is needed. In this work a polar organic chemical integrative sampler (POCIS) with a nylon membrane and a combination of Oasis WAX and Fluoroflash® sorbents was calibrated in the laboratory and deployed in the field. A static renewal system was used to determine sampling rates for 12 PFAS which ranged between 0.69 ± 0.27 to 5.68 ± 1.80 L/day. POCIS devices were deployed for 10 days in lake Tyrifjorden, Norway which is known to be contaminated by a closed down factory producing paper products, in order to track the evolution of the PFAS contamination in a river system draining into the lake. Th sampling campaign enabled the stretch of the river which was responsible for the emissions of PFAS to lake Tyrifjorden to be identified. Freely dissolved concentrations determined with the POCIS were lowest at the site considered to reflect a diffuse PFAS contamination and highest at the site located downstream the factory. Perfluorooctanesulfonic acid (PFOS), perfluorohexanoic acid (PFHxA) and perfluorooctane sulfonamidoacetic acid (EtFOSAA) dominated the concentration profile at this site. Emissions of PFAS to lake Tyrifjorden were estimated to be 3.96 g/day for the sum of the 12 investigated PFAS.
Introduction
Per and polyfluoroalkyl substances (PFAS) present an environmental risk owing to their known hazardous intrinsic substance properties and their extensive use pattern. Many PFAS have been demonstrated to be (very) persistent [(v) P], (very) bioaccumulative [(v) B], mobile (M) and certain PFAS are additionally toxic (T) (Ahrens, 2011; Ritscher et al., 2018; Cousins et al., 2020) and can therefore be considered as PBT, PMT, vPvB or vPvM substances (Arp et al., 2017; Brendel et al., 2018; Arp and Hale, 2019). PFAS have a broad application range being used in industrial processes and consumer products and are commonly found in, amongst others, aqueous film-forming foam (AFFF) used to fight fires, clothing and textiles, disposal paper products, personal care products, herbicides and pesticides (Glüge et al., 2020). Both point source releases (Ahrens et al., 2015; Langberg et al., 2021) and diffuse sources (Taniyasu et al., 2013) have resulted in PFAS being found at elevated concentrations in diverse media [soil, water, sediment, plants, ice, biota (Hale et al., 2017; Ghisi et al., 2019; Knutsen et al., 2019; Garnett et al., 2021)] and in pristine environments (Haukås et al., 2007; Skaar et al., 2019). Remediation methods for PFAS contaminated soil and water do not always result in full removal (Ross et al., 2018; Ateia et al., 2019), thus contamination becomes irreparable.
The European Chemicals Strategy for Sustainability Towards a Toxic Free Environment (EC. Chemicals, 2020) and the accompanying PFAS document (European Commission, 2020) released in 2020, aim to ensure that the use of PFAS is phased out in the EU over the coming years, unless it is proven essential for society. In 2020, the European Food Safety Authority set a tolerable weekly intake of 4.4 ng per kilogram of body weight for four PFAS [perfluorooctanoic acid (PFOA), perfluorooctane sulfonate (PFOS), perfluorononanoic acid (PFNA), perfluorohexane sulfonic acid (PFHxS)] (Schrenk et al., 2020). This value was derived based on human exposure to PFAS via the intake of food (especially fish), which is considered the main human uptake pathway. In order to protect human health and as PFAS becomes more stringently regulated, a more diverse suite of environmental monitoring methods will be needed (Kotthoff and Bücking, 2018). Methods that are able to detect a broader PFAS subset, as well as screen for low environmental concentrations, account for total organic fluorine and adsorbable organic fluorine and the presence of precursors will be needed (McDonough et al., 2019; Kärrman et al., 2021).
Currently, the most common monitoring method for PFAS in water relies on traditional grab sampling which, although being a simple method, suffers the disadvantages of providing only a snap shot concentration, requires large sample volumes and thus is time, energy and consumable intensive. Passive sampling is a tool that can be used in order to determine very low (down to the pg per L concentration level) aqueous concentrations which are the concentrations of pollutants which pose an actual risk (Huckins et al., 1993; Hawthorne et al., 2007). Passive samplers are particularly well suited to the identification of sources of contamination (Pistocchi et al., 2019). The polar organic chemical integrative sampler (POCIS) is specifically designed to sample polar organic contaminants (Alvarez et al., 2004; Harman et al., 2012) operating as an infinite sink for analytes during the linear uptake stage (Morin et al., 2012). Previous studies reporting passive sampling of PFAS have most commonly used the POCIS (Kaserzon et al., 2012; Fedorova et al., 2013; Kaserzon et al., 2013; Kaserzon et al., 2014; Li et al., 2016; Wang et al., 2017; Cao et al., 2018; Mijangos et al., 2018; Gobelius et al., 2019) with a few studies testing diffusive gradients in thin films (DGT) (Guan et al., 2018; Urík and Vrana, 2019; Wang et al., 2021), microporous polyethylene (Kaserzon et al., 2019) and low density polyethylene (Dixon-Anderson and Lohmann, 2018), many of which have recently been reviewed (Lai et al., 2019). The previous POCIS studies have all used polyethersulfone (PES) as the membrane material, despite previous studies noting diffusive limited uptake resulting in a lag phase in pollutant uptake to the sorbent owing to sorption to the PES (Silvani et al., 2017). Previous laboratory calibrations and field sampling have focused on a relatively limited PFAS subset and deployments have most often been in highly contaminated waters at waste water treatment plant or sewage treatment plants (Cerveny et al., 2018; Gobelius et al., 2019) in the vicinity of industrial emissions (Cerveny et al., 2016), or those polluted by the use of AFFF (Kaserzon et al., 2019).
This work reports a laboratory calibration and field deployment of a novel POCIS device consisting of a nylon membrane and a combination of Oasis WAX and FluoroFlash ® as the sorbent material. The POCIS was calibrated in the laboratory using a static renewal system to determine sampling rates for 12 PFAS over a 10 days period. Following this, it was deployed in the field at a site in Norway at six sites (lake Tyrifjorden) known to be contaminated by a closed down factory producing paper products, in order to track the evolution of the PFAS pollution in a river system draining in to the lake. This site has previously been reported to be contaminated by a diverse suite of PFAS, reflected in high sediment and biota concentrations, however water concentrations were reported to be relatively low (Slinde and Høisæter, 2018). This study is the first to use passive samplers to characterise PFAS emissions resulting from the production of paper products and in particular to quantify the PFOS precursors: perfluorooctane sulfonamide (FOSA), perfluorooctane sulfonamidoacetic acid (FOSAA), methyl perfluorooctane sulfonamido acetic acid (MeFOSAA) and ethyl perfluorooctane sulfonamido acetic acid (EtFOSAA) (Benskin et al., 2013; Langberg et al., 2020; Langberg et al., 2021). Including PFAS precursors in monitoring campaigns is vital in order to gain a more accurate estimate of environmental PFAS burdens.
Materials and Methods
Chemicals and Reagents
The 12 PFAS analysed were: three fluorotelomer sulfonic acids (4:2, 6:2 and 8:2 FTS), three perfluorinated carboxylic acids with perfluorocarbon chain length C5–C10 (PFPeA, PFHxA, PFDA), two perfluorinated sulphonic acids with perfluorocarbon chain length C6–C8 (PFHxS, PFOS), and the PFAS precursors perfluorooctanesulfonamide (FOSA) and perfluorooctanesulfonamidoamide acid, methyl and ethyl perfluorooctane sulfonamidoacetic acid (FOSAA, MeFOSAA, EtFOSAA). The PFAS were from Wellington Laboratories (Canada). All of these PFAS were used in the laboratory calibration experiment and were also screened for in the field samples. In addition to these 12 PFAS, six mass labelled internal standards were used: M2-6:2 FTS, M5-PFHxA, M3-PFHxS, M8-PFOS, M8-FOSA, and M6-PFDA. The PFAS were from Wellington Laboratories (Canada). Details of all PFAS and mass labelled PFAS can be found in the supplementary information Supplementary Table S1. All solvents (acetone, methanol and acetonitrile) used were LC grade.
POCIS Preparation
The POCIS passive samplers were constructed from nylon membranes (VWR, pore size 10 µm) and a mixture of Waters Oasis WAX and FluoroFlash® was used as the sorbent material (0.1049 ± 0.0008 g WAX and 0.1051 ± 0.0008 g of FluoroFlash®). With a 5.4 cm exposed membrane diameter, the effective surface area was 45.8 cm2. All metallic components (washers, bolts and screws) and nylon membranes were precleaned with or soaked in acetone (for 2–3 days) prior to use. The sorbents were soaked in methanol (with the methanol renewed twice) and dried at 60°C prior to constructing the POCIS. Assembled POCIS were stored at 4°C before use in the laboratory and field work detailed below.
Laboratory POCIS Calibration
POCIS calibration was performed to determine sampling rates (Rs) for the 12 PFAS. In previous studies, three main methods have been used in order to calibrate POCIS in water (Morin et al., 2012): 1) a static calibration (Li et al., 2010), 2) a static renewal calibration (Arditsoglou and Voutsa, 2008) and 3) a continuous flow calibration (Harman et al., 2008; Morin et al., 2013). In this study a static renewal calibration was carried out in a closed system using 2 L glass beakers and Milli-Q water that was spiked with a nominal concentration of 1 ng/L of each PFAS. The water in the beakers was mixed at 800 rpm and after 24 h the water was completely refreshed daily and the 12 PFAS were replenished by re-spiking. This process was repeated over the 10 days calibration period. The concentrations of PFAS in the water over the 10 days period are given in Supplementary Table S2.
At preselected times (1 day, 2, 4, 7 and 10 days), the POCIS were removed from the beaker and disassembled, extracted and analysed. Water samples (1 L) were taken at each water renewal time and analysed in order to measure the concentration of PFAS in the water at the start and end of each renewal event. Since the concentration in water decreased substantially for certain PFAS compounds, first order kinetics were assumed (Gobelius et al., 2019) in order to calculate the average water concentration the samplers were exposed to during the calibration period.
Case Study Site
POCIS were deployed in the river system draining into Lake Tyrifjorden (60.03° N, 10.17° E) which is located south of Oslo in Norway. The lake is a freshwater lake and is contaminated by PFAS originating from a closed down factory that produced paper products until 2013 (Slinde and Høisæter, 2018; Slinde et al., 2019; Langberg et al., 2020; Langberg et al., 2021). Concentrations in sediment and biota in the Randselva river, downstream the factory, and in the lake have been reported to be relatively high. For example, the mean ∑PFAS concentration of 29 PFAS in river sediments taken downstream the factory was reported to be 2,450 μg kg−1, and in lake sediments, mean concentrations ranged between 6.1 and 207 μg kg−1, depending on the area of the lake (Langberg et al., 2021). In a few sediment samples, the di-substituted phosphate ester of EtFOSE, SAmPAP diester, which is a PFOS precursor, was targeted and detected at concentrations in the thousands of μg kg−1 (Langberg et al., 2021). A deeper examination of sediment concentrations revealed that at least two different chemical products were used at the site during the manufacture of paper products: 1) a mixture of SAmPAP and preFOS, likely the 3M product called Scotchban; and 2) a mixture of FTS and/or their parent compounds, fluorotelomer mercaptoalkyl phosphate esters (FTMAP). The PFAS in the former chemical mixture have the potential to ultimately be transformed into PFOS, while the PFAS in the latter chemical mixture can ultimately be transformed into PFCA. In perch livers, the mean ∑PFAS concentrations of 22 PFAS were 667 μg kg−1 directly downstream the factory and between 181 and 458 μg kg−1 in the lake, depending on sampling area (Langberg et al., 2021). In contrast to these high sediment concentrations, water concentrations were reported to be low. PFOS was the only PFAS detected above the analytical limit of quantification in lake water (maximum 0.18 ng L−1), and the concentrations reported for the Randselva river, directly downstream the factory were between <0.1 and 1.5 ng L−1 (Langberg et al., 2020). The unusual relationship between concentrations in water, sediments and biota was attributed to the hydrophobicity of the PFAS used by the factory and their transformation into PFAA in sediments and/or biota (Langberg et al., 2020).
Field Deployment
POCIS were deployed on the May 25, 2018 and retrieved 10 days later on the June 4, 2018. The POCIS were preconditioned with 10 ml methanol in the field before being placed into deployment cages, attached to ropes and a buoy and deployed at 1–2 m below the water surface. POCIS were deployed at six sites (A1, A2, R1, R2, S1 and S2) in the river system upstream of lake Tyrifjorden, as shown in Figure 1. The river system consists of two rivers, Ådalselva and Randselva, meeting in the town of Hønefoss to form the Storelva river. Both rivers pass industrial and urban areas in the lower parts. The shutdown factory is located on the banks of the Randselva river (Figure 1). Site A1 was located at the source of the Ådalselva river; Site A2 was located at the exit of the Ådalselva river; Site R1 was located at the source of the Randselva river upstream to the factory; Site R2 was located at the exit of the Randselva river downstream to the factory; Site S1 was located downstream the meeting point of the two rivers that form the Storelva river; and Site S2 was located further downstream in the Storelva river before it enters lake Tyrifjorden. Upon retrieval of the POCIS, they were cleaned using distilled water and paper tissues and individually repacked into aluminium foil. They were transported back to the laboratory and stored at 4°C before clean-up and analysis.
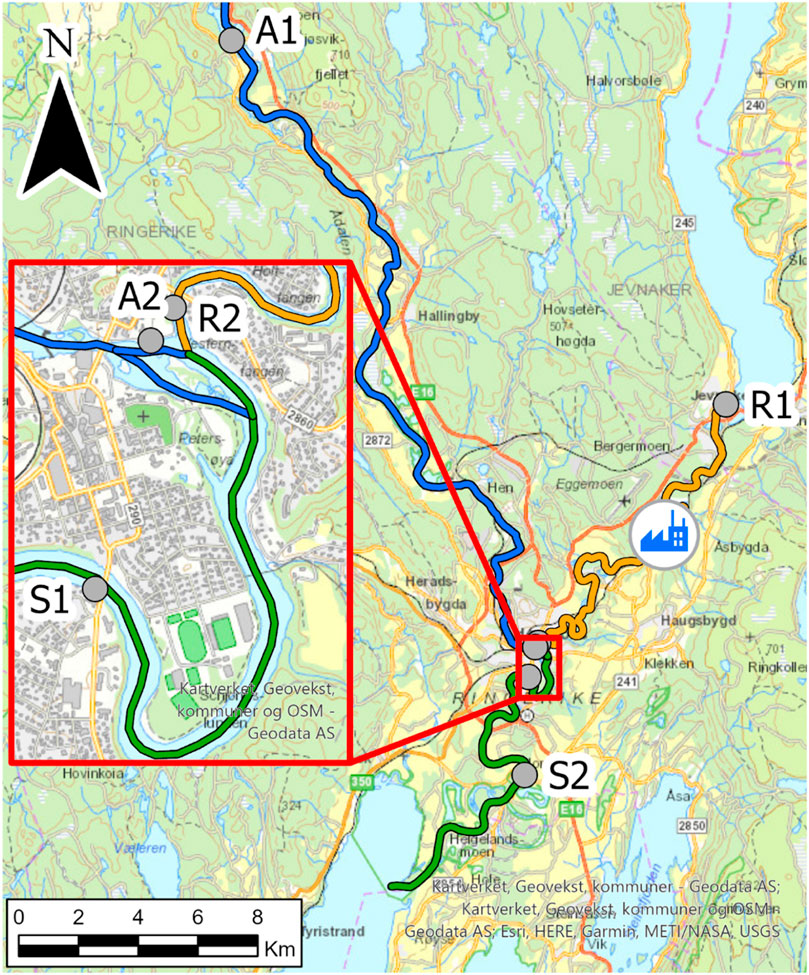
FIGURE 1. Sites where the POCIS were deployed in the river system upstream to lake Tyrifjorden. Site A1 is located at the source of the Ådalselva river (blue river course); Site A2 is located at the exit of the Ådalselva river; Site R1 is located at the source of the Randselva river (yellow river course); Site R2 located at the exit of the Randselva river; Site S1 is located downstream to where the two rivers, Ådalselva and Randselva, meet and form the river Storelva (green river course); and Site S2 is located in the Storelva river further downstream, before the entrance to lake Tyrifjorden. The location of the closed down paper factory on the banks of the Randselva river is shown with a blue icon.
Emissions of PFAS to Lake Tyrifjorden
In order to calculate the emission of PFAS from the pollution point source to Lake Tyrifjorden, the mass accumulated in the POCIS at sites R1 and site R2 were used according to the following equations:
Where mR2 and mR1 (g) is the mass accumulated in the POCIS from sites R2 and R1 respectively, QW (L/d) is the flow of Randselva river, RS (L/d) is the sampling rate and t (d) is the exposure time. The value of QW was used as the average over the 10 days deployment period based on data from relevant locations (Kistefoss/Strømsøa, from Noregs vassdrags-og energidirektorat database). Details can be found in Supplementary Figure S1.
Sample Preparation
The POCIS were disassembled in the laboratory and the wet sorbent was transferred, with help of ultrapure water, into an empty precleaned (using 10 ml methanol) 6 ml SPE cartridge (Sigma Aldrich) with a 20 μm glass fibre frit precleaned with methanol. The sorbent was dried using vacuum and the six mass-labelled internal standards were spiked (10 μL, 100 ng/ml) to all samples. SPE columns containing the sorbent were eluted with 4 ml of methanol followed by 4 ml of 2% ammonia in methanol under vacuum. The volume of the extract was reduced under a gentle stream of nitrogen and reconstituted with 600 μL of acetonitrile and 400 μL of ammonium acetate (5.2 mM in water) to a final volume of 1 ml. This solution was transferred into a polypropylene vial and stored at 4°C before liquid chromatography quadrupole time-of-flight mass spectrometry (LC qTOF-MS) analysis.
Sample Analysis
PFAS were analysed using LC qTOF-MS. An Acquity Ultra Performance HPLC system (Waters) was used to inject aliquots of 7 µL extract onto a Waters Acquity BEH C8 reversed phase column (100 × 2.1 mm, 1.8 µm particles). The target compounds were separated at a flow rate of 0.5 ml min-1,184 using acetonitrile (A) and 5.2 mM NH4OAc in water (B). The following binary gradient was applied: 0–1.5 min, 12% of A; 1.5–11 min, linear change to 99% of A; 11–13 min, 99% of A. The Acquity system was coupled to a Xevo G2-S Q-ToF-HRMS instrument (Waters) using negative ion electrospray ionization [ESI(-)). Mass spectra were registered in full scan mode (mass range m/z of 150–1,100]. The following optimized parameters were applied: Capillary voltage, 0.7 kV; desolvation temperature, 500°C; source temperature, 120°C; nitrogen desolvation gas flow, 800 L h−1. Quantitative analysis was performed employing extracted mass chromatograms from full scan recording using the m/z (typical mass tolerance of 0.03 µ) for the different analytes.
Quality Assurance and Quality Control
The extraction recovery of the sorbent (Oasis WAX and FluoroFlash®) used in the POCIS devices was investigated by spiking a known amount of each PFAS (50 μL, 20 ng/ml) and mass labelled PFAS (10 μL, 100 ng/ml) and applying the same extraction method as described above. The recovery of all PFAS was above 80% and individual recoveries are shown in Supplementary Table S3. Laboratory and field blank POCIS were used to assess possible contamination resulting from the preparation of the samplers and the field deployment. These samplers were exposed to air during laboratory work and field deployment and were treated in a similar way as real samples. Concentrations in the blank samples were low (<0.5 ng g-1) and consistent, indicating little contamination. During field sampling, equipment with Teflon surfaces was avoided. Clean nitrile gloves were used to manipulate samplers during field sampling and laboratory work to avoid cross contamination.
Results and Discussion
Laboratory POCIS Calibration
The uptake profiles of the 12 PFAS investigated in the 10 days calibration experiment are shown in Figure 2A for the three FTS, Figure 2B for the PFCA and PFSA and Figure 2C for the precursors and the accumulated masses are given in Supplementary Table S4. Overall the amount accumulated over the whole calibration period agrees within a factor 2 of the spiked amount (10 ng) for all PFAS except for one (FOSA). All investigated PFAS are in the linear accumulation phase during the 10 days calibration (R2 between 0.77 and 0.98), as has been observed in previous studies for POCIS (Kaserzon et al., 2013; Li et al., 2016; Wang et al., 2017; Cao et al., 2018; Gobelius et al., 2019).
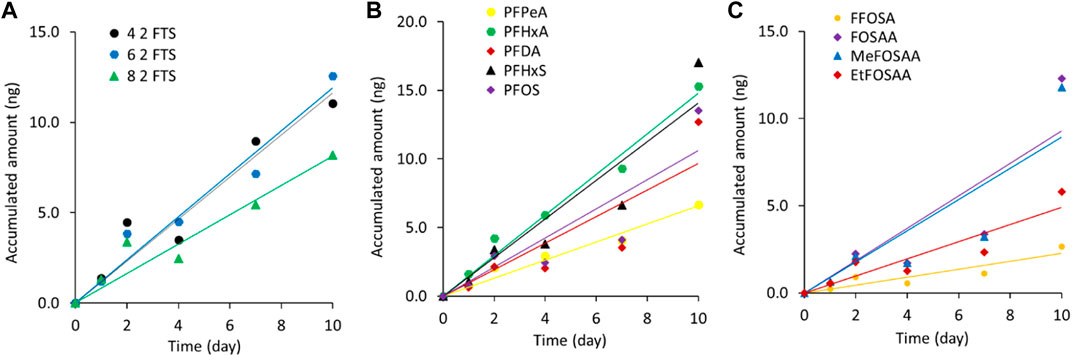
FIGURE 2. Uptake profiles of (A) the fluorotelomer sulfonic acids, (B) the perfluorinated carboxylic acids and perfluorinated sulphonic acids and (C) the precursors.
Sampling rates (RS L/day) derived from the linear uptake phase over the 10 days calibration are shown in Table 1 along with previously reported sampling rates for the 12 PFAS included in this work. This study is the first to report sampling rates for: 4:2 FTS, 8:2 FTS, FOSA, FOSAA, MeFOSAA and EtFOSAA. RS ranged from 0.69 ± 0.27 L/day for FOSA to 5.68 ± 1.80 L/day for PFHxS with no apparent correlation with number of carbon atoms. These RS values are higher than those reported for all previous studies using the following passive sampling devices: POCIS-WAX, POCIS-HLB, POCIS XAW, pesticide POCIS, POCIS-MIP, microporous PE-XAW, agarose-WAX o-DGT and polyacrylamide-WAX o-DGT (Kaserzon et al., 2012; Fedorova et al., 2013; Kaserzon et al., 2013; Kaserzon et al., 2014; Li et al., 2016; Wang et al., 2017; Cao et al., 2018; Gobelius et al., 2019; Kaserzon et al., 2019). The differences between the values reported here and in the previous studies can most likely be attributed to the larger pore size in the nylon membrane as compared to the PES used in all other POCIS, in addition to the different sorbent phase. In addition, differences in the method used to calibrate the POCIS can be the source of this difference where previous studies using the same passive sampling device also reported considerable differences in sampling rates. Of those using POCIS-WAX or POCIS-XAW (where the WAX and XAW are very similar in nature) Li et al. (2016), reported values of 0.0012–0.0028 L/day at a temperature of 20°C Gobelius et al. (2019), reported RS values between 0.003 and 0.10 L/day Cao et al. (2018), reported values of 0.13 and 0.14 L/day for PFOA and PFOS, Kaserzon et al., (2013), reported vales between 0.16 and 0.24 L/day at a flow rate of 0.34 m/s Kaserzon et al. (2012), reported values between 0.16 and 0.36 L/day and Mijangos et al. (2018), reported values between 0.14 and 0.49 L/day. These differences can most likely be attributed to the variation in calibration systems used, where both static renewal systems (as here) and flow through chambers were tested, each with corresponding different experimental variables. The POCIS used in this work consisted of a nylon membrane and a combination of Oasis WAX and Fluoroflash ® was used as the sorbent. Two previous studies have used a POCIS with nylon membranes (30 µm pore size) and quantified selected pesticides and pharmaceuticals (Belles et al., 2014) and 20 emerging organic compounds were determined, including PFBS, PFOA and PFOS (Mijangos et al., 2018). In the first study the sorbent used was Oasis HLB and in the second study the sorbent used was a mixture of Strata X-AW and Oasis HLB. The first study also compared nylon to PES and reported larger sampling rates and more rapid uptake in the first days of exposure for the nylon membrane. The authors attributed this to the larger pore size of nylon compared to PES, which in turn resulted in a decrease in mass transfer resistance (Belles et al., 2014). Further studies have shown that diffusion through PES membranes can be extremely slow and in some cases a lag phase and delayed uptake of pollutants is evident (Silvani et al., 2017; Endo and Matsuura, 2018). The second study reported sampling rates lower than those determined in this study, despite both using nylon membranes, likely reflecting the different calibration system used (continuous flow compared to static renewal) and the difference in sorbent. Of the previous studies using POCIS, the following sorbents have been investigated: hydrophilic-lipophilic balance (HLB), weak anion exchange (Oasis WAX and Strata XAW), dodecylimidazolium immobilised ionic liquids (ILL), bond-elute-plexa and a triphasic admixture of a hydroxylated polystyrene-divinylbenzene resin and a carbonaceous adsorbent (POCIS-pesticide configuration). FluoroFlash has been used as a solid phase extraction material in order to determine aqueous concentrations of PFHxA, PFOA, PFNA and PFDA (Xu et al., 2015).
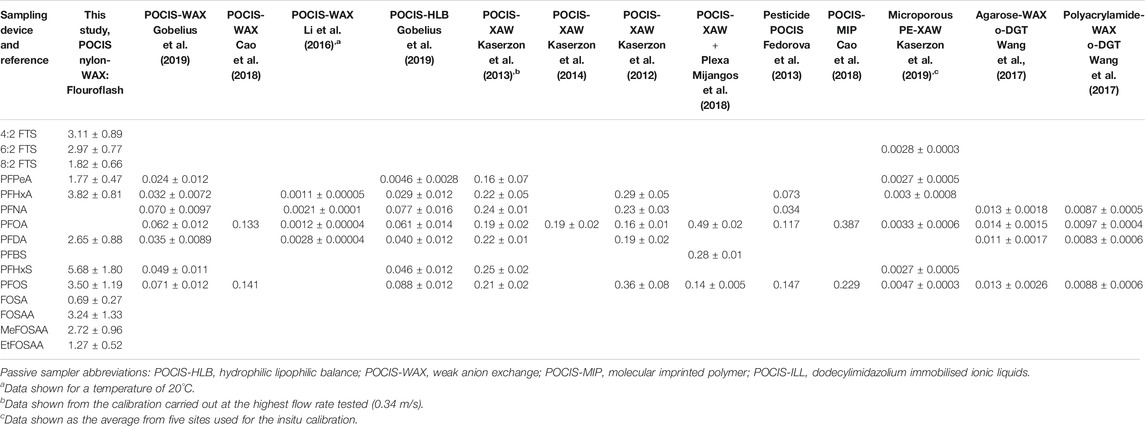
TABLE 1. Sampling rates [RS (L/day)] for the 12 PFAS used in this work. A comparison to literature values for other PFAS passive sampling devices is given.
Field Campaign
Occurrence and Concentration of PFAS in Lake Tyrifjorden
Passive samplers provide time integrated average dissolved concentrations and are able to detect very low water concentrations. This means that they are well suited for deployment at the lake Tyrifjorden site where previously PFAS precursors were below the analytical limit of detection in water samples (Langberg et al., 2020; Langberg et al., 2021). The POCIS were deployed to investigate their efficacy for accumulating PFAS indicative of a paper source as well as to investigate their suitability for being a monitoring method to track the emissions. Using the RS values established in the laboratory, water concentrations were calculated. It must be noted that laboratory derived RS values may not be completely representative of the field (Booij et al., 2017), as field RS values are influenced by environmental conditions such as water flow rate/turbulence, temperature, pH and dissolved organic matter (DOM) content (Harman et al., 2012; Kaserzon et al., 2013). Previous studies have shown that RS increased with increasing temperature and flow rate, DOM had little effect on RS and that RS increased as pH increased at lower pH (Lai et al., 2019). Given the pore size of the nylon membrane used here (30 µm), the sampler itself is very likely sensitive to turbulence, however this sensitivity is considered to be uniform across all sampling sites and was minimised as much as possible by the use of the deployment cage. One previous study (Fauvelle et al., 2017) discussed four approaches that can be used to deal with flow effects, and thus the effect of turbulence on this POCIS with a nylon membrane. The authors suggest 1) increasing membrane resistance which would in turn mean that laboratory calibrations would be more applicable for a wider range of flow conditions and thus field conditions, 2) accepting and quantifying the larger uncertainties associated with low flow conditions, 3) establishing empirical relationships between Rs and water velocity and 4) to explicitly take into consideration the mass transfer coefficient for the water boundary layer during laboratory lab calibrations and field exposures. The authors go on to acknowledge the challenges these methods bring as well as the fact that this may remove some of the inherent advantages of using passive samplers (low cost, easy to use).
All of the 12 PFAS analysed for were detected in samples from at least three of the six sampling sites. The concentrations are shown in Figure 3A for the three FTS, Figure 3B for the PFCA and PFSA and Figure 3C for the precursors and all individual values are given in Supplementary Figure S2 and Supplementary Table S5.
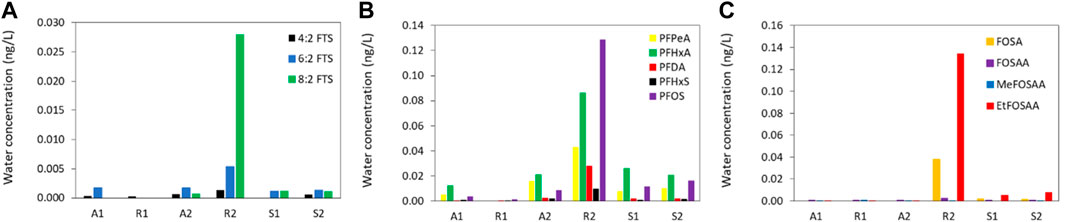
FIGURE 3. Water concentrations [ng (L) of (A)] the fluorotelomer sulfonic acids, (B) the perfluorinated carboxylic acids and perfluorinated sulphonic acids and (C) the precursors at the six sampling sites along the river system.
The POCIS were able to quantify very low concentrations of PFAS (detection limits between 0.0001–0.3 ng/L in water). Figure 3 and Supplementary Figure S2 show that the concentrations of all PFAS (except for MeFOSAA) were the lowest at site R1 (ΣPFAS12 of 0.003 ng/L) and the highest at site R2 (ΣPFAS12 0.51 ng/L). The lowest concentrations were generally detected at the sites located at the source of the two rivers (site A1 and site R1) which can be considered to reflect a diffuse PFAS contamination. Somewhat higher concentrations were detected at site A2, located at the exit of the river Ådalselva, especially for the short chained PFCA, PFPeA and PFHxA, although concentrations were still low (0.016 and 0.021 ng/L, respectively). The higher concentrations in the river are likely due to urban runoff and other various sources associated with the local urban area and industrial sites. The highest individual PFAS concentrations were detected at site R2 which is the location downstream to the factory known to be the main source of PFAS to the lake (Langberg et al., 2021). PFOS (0.13 ng/L), PFHxA (0.09 ng/L) and EtFOSAA (0.13 ng/L) dominated the concentration profile at this site and these PFAS were previously reported to be associated with the paper industry. This PFOS concentration agrees well with previously reported concentrations in grab samples of river water taken directly downstream the factory (Langberg et al., 2020). In addition to this, higher concentrations of PFPeA and PFHxA were detected at Site R2 compared to Site A2. Compared to Site R2, lower PFAS concentrations were detected at Site S1 and Site S2, reflecting a dilution of the PFAS pollution at the point where the two rivers meet.
The dilution is also clear from relative distribution of individual PFAS per site, shown in Figure 4. Two of the PFOS precursors associated with the paper industry, EtFOSAA and FOSA, constituted a significant percentage (more than 30%) of the PFAS distribution profile at Site R2, which is the site closest to the closed down factory, while Site A2 was dominated by the short chained PFPeA and PFHxA. The downstream sites, Site S2 and Site S1, showed a mix of site A2 and site R2 with distribution profiles showing both the short chained PFAS which dominated at site A2 and the PFOS precursors which we more dominate at site R2. However, relative percentages were lower compared to site A2 and site R2, respectively.
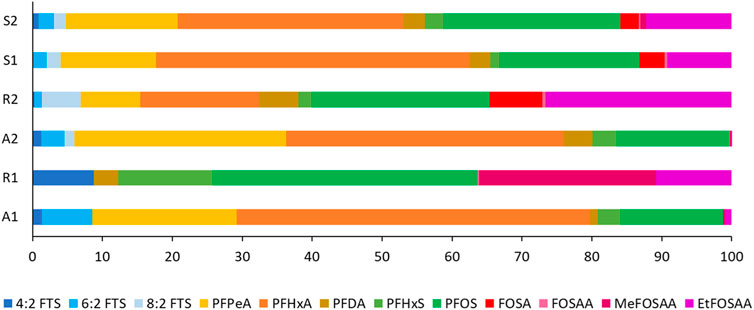
FIGURE 4. Relative distribution (shown as %) for each of the 12 investigated PFAS at the six sampling sites.
Previous studies at the site have shown that the dominate PFAS in biota affected by the emissions from the paper factory were EtFOSAA, FOSA, PFOS, and PFDA. In addition, long chained FTS (10:2 FTS and 12:2 FTS) not targeted in the present study, were reported to constitute significant proportions in the PFAS distribution profiles (Langberg et al., 2021). None of the dominant PFAS in biota, except for PFOS, could be quantified in the water phase in the previous study (Langberg et al., 2020). Despite this, the results presented here show that water concentrations of these substances were indeed elevated compared to areas not affected by such a point source. Interestingly, the concentrations of the larger, and thus more hydrophobic PFOS precursors detected in the water at site R2 were much closer to the concentration for PFOS compared to the previously reported concentrations in perch livers. Concentrations of PFOS precursors made up less than 10% of the detected PFAS while PFOS made up more than 50% in perch livers (Langberg et al., 2020). However, in the present study, while concentrations of the PFOS precursors made up 34% of total PFAS and concentrations of PFOS made up 25% of the total PFAS. The reason for this difference is likely biotransformation of PFOS precursors into PFOS in biota (Glaser et al., 2021) and uptake of PFAS via diet rather than from ambient water (Langberg et al., 2020). Bringing the results together, it appears that this POCIS can also be used for source tracking of the hydrophobic PFAS associated with the paper industry.
Emissions of PFAS to Lake Tyrifjorden
Figure 5 shows the emission of each PFAS to lake Tyrifjorden. The total PFAS emission was determined to be 3.96 g/day and this mass may even be an underestimation as the pore size of the nylon membrane may have resulted in the POCIS accumulating some dissolved organic carbon. The estimate is however in broad agreement with previously estimates of emissions to lake Tyrifjorden, which were based on extrapolations of concentrations in a sediment core (Langberg et al., 2021). Analysis of the sediment core showed that the majority of the PFAS is a result of historic emissions during the period of active production at the factory and that present-day emissions from legacy sources due to resuspension to the water column from the river sediments are low.
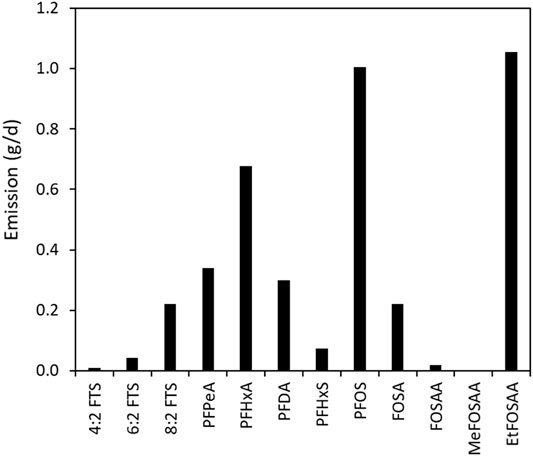
FIGURE 5. Emission (g/day) of PFAS determined using the POCIS deployed at site R2, to Lake Tyrifjorden.
Comparison With Previous Field Deployments
This study is the first in which a POCIS was used to determine PFAS concentrations at a site contaminated by the production of paper products. A direct comparison between absolute PFAS concentrations detected using different passive samplers and at sites contaminated by various sources is difficult. However, it is clear from the diverse nature of previous field passive sampler deployments, that these devices have a role to play in monitoring PFAS in water. Kaserzon et al. (2019), deployed PE passive samplers in groundwater wells in an area contaminated by the use of AFFF. The authors report a good correlation between concentrations detected by the passive samplers and traditional grab samples. The same author deployed POCIS-XAW in the Sydney harbour and detected concentrations of 30 ng/L for the sum of 11 PFAS (Kaserzon et al., 2012). The pesticide POCIS was deployed by Cerveny et al. (Cerveny et al., 2016), in water courses of the Elbe and Danube rivers, reporting a higher sensitivity of POCIS compared to fish (based on a higher frequency of detection). Total POCIS concentrations were shown to be strongly correlated with fish liver concentrations. In a follow up study the same device was deployed in the Zivny Stream in the Czech Republic alongside fish and macroinvertebrates (Cerveny et al., 2018). In this case, differences in concentrations and profiles were observed and the authors ascribed them to excretion and metabolic activity of living organisms. As discussed above, the same is likely the reason for the higher percentages of PFOS precursors in POCIS in the present study compared to previously reported PFAS distribution profiles in biota (Langberg et al., 2021). Gobelius et al. (2019), deployed POCIS-HLB and POCIS-WAX at various locations in a drinking water treatment plant. They found a good correlation between concentrations in both POCIS however concentrations were 2.3 times higher for the HLB. Wang et al. (2017), deployed a POCIS-ILL in the influent and effluent of a WWTP in Tianjin, China, reporting a good correlation between POCIS and grab sample concentrations. Li et al. (2016), deployed POCIS-WAX in the Meiliang Bay in China and reported concentrations of approximately 500 ng/L for 8 PFAS and a very good agreement between POCIS and grab samples. It is apparent that different types of POCIS sampler have a role to play in monitoring and that there is no standard accepted configuration.
Conclusion
In conclusion, the POCIS described here can be considered well suited for investigating the targeted hydrophobic PFAS associated with emissions from the paper industry. The combination of the low detection limits and the time integrated averaged concentration that the POCIS was able to determine made it possible to characterize PFAS in water that were previously not possible to quantify using traditional grab sampling. The use of POCIS for source tracking was demonstrated to be effective, even for these relatively hydrophobic PFAS and as these samplers are relatively cheap and easy to use, they should be considered as an additional tool for source tracking in future studies. The large sampling rate achieved by using the nylon membrane is advantageous, however future studies may be focused on devices with sampling rates that are less dependent on water turbulence.
Data Availability Statement
The original contributions presented in the study are included in the article/Supplementary Material, further inquiries can be directed to the corresponding author.
Author Contributions
SH wrote the manuscript. IA read and edited the manuscript and carried out field work. BC carried out the laboratory and field work and edited the manuscript. TR carried out the data analysis and edited the manuscript. HL edited the manuscript.
Funding
The authors acknowledge funding from the Norwegian Research Council under the Miljøforsk project “Reducing the impact of fluorinated compounds on the environment and human health” (NFR 268258).
Conflict of Interest
The authors declare that the research was conducted in the absence of any commercial or financial relationships that could be construed as a potential conflict of interest.
Publisher’s Note
All claims expressed in this article are solely those of the authors and do not necessarily represent those of their affiliated organizations, or those of the publisher, the editors and the reviewers. Any product that may be evaluated in this article, or claim that may be made by its manufacturer, is not guaranteed or endorsed by the publisher.
Supplementary Material
The Supplementary Material for this article can be found online at: https://www.frontiersin.org/articles/10.3389/fenvs.2021.796026/full#supplementary-material
References
Ahrens, L. (2011). Polyfluoroalkyl Compounds in the Aquatic Environment: a Review of Their Occurrence and Fate. J. Environ. Monit. 13 (1), 20–31. doi:10.1039/c0em00373e
Ahrens, L., Norström, K., Viktor, T., Cousins, A. P., and Josefsson, S. (2015). Stockholm Arlanda Airport as a Source of Per- and Polyfluoroalkyl Substances to Water, Sediment and Fish. Chemosphere 129, 33–38. doi:10.1016/j.chemosphere.2014.03.136
Alvarez, D. A., Petty, J. D., Huckins, J. N., Jones-Lepp, T. L., Getting, D. T., Goddard, J. P., et al. (2004). Development of a Passive, In Situ, Integrative Sampler for Hydrophilic Organic Contaminants in Aquatic Environments. Environ. Toxicol. Chem. 23 (7), 1640–1648. doi:10.1897/03-603
Arditsoglou, A., and Voutsa, D. (2008). Passive Sampling of Selected Endocrine Disrupting Compounds Using Polar Organic Chemical Integrative Samplers. Environ. Pollut. 156 (2), 316–324. doi:10.1016/j.envpol.2008.02.007
Arp, H. P. H., and Hale, S. (2019). REACH: Improvement of Guidance and Methods for the Identification and Assessment of PMT/vPvM Substances, 1–129.
Arp, H. P. H., Brown, T. N., Berger, U., and Hale, S. E. (2017). Ranking REACH Registered Neutral, Ionizable and Ionic Organic Chemicals Based on Their Aquatic Persistency and Mobility. Environ. Sci. Process. Impacts 19 (7), 939–955. doi:10.1039/c7em00158d
Ateia, M., Maroli, A., Tharayil, N., and Karanfil, T. (2019). The Overlooked Short- and Ultrashort-Chain Poly- and Perfluorinated Substances: A Review. Chemosphere 220, 866–882. doi:10.1016/j.chemosphere.2018.12.186
Belles, A., Pardon, P., and Budzinski, H. (2014). Development of an Adapted Version of Polar Organic Chemical Integrative Samplers (POCIS-Nylon). Anal. Bioanal. Chem. 406 (4), 1099–1110. doi:10.1007/s00216-013-7286-2
Benskin, J. P., Ikonomou, M. G., Gobas, F. A. P. C., Begley, T. H., Woudneh, M. B., and Cosgrove, J. R. (2013). Biodegradation of N-Ethyl Perfluorooctane Sulfonamido Ethanol (EtFOSE) and EtFOSE-Based Phosphate Diester (SAmPAP Diester) in marine Sediments. Environ. Sci. Technol. 47 (3), 1381–1389. doi:10.1021/es304336r
Booij, K., Maarsen, N. L., Theeuwen, M., and van Bommel, R. (2017). A Method to Account for the Effect of Hydrodynamics on Polar Organic Compound Uptake by Passive Samplers. Environ. Toxicol. Chem. 36 (6), 1517–1524. doi:10.1002/etc.3700
Brendel, S., Fetter, É., Staude, C., Vierke, L., and Biegel-Engler, A. (2018). Short-chain Perfluoroalkyl Acids: Environmental Concerns and a Regulatory Strategy under REACH. Environ. Sci. Eur. 30 (1). doi:10.1186/s12302-018-0134-4
Cao, F., Wang, L., Ren, X., Wu, F., Sun, H., and Lu, S. (2018). The Application of Molecularly Imprinted Polymers in Passive Sampling for Selective Sampling Perfluorooctanesulfonic Acid and Perfluorooctanoic Acid in Water Environment. Environ. Sci. Pollut. Res. 25 (33), 33309–33321. doi:10.1007/s11356-018-3302-6
Cerveny, D., Grabic, R., Fedorova, G., Grabicova, K., Turek, J., Kodes, V., et al. (2016). Perfluoroalkyl Substances in Aquatic Environment-Comparison of Fish and Passive Sampling Approaches. Environ. Res. 144, 92–98. doi:10.1016/j.envres.2015.11.010
Cerveny, D., Grabic, R., Fedorova, G., Grabicova, K., Turek, J., Zlabek, V., et al. (2018). Fate of Perfluoroalkyl Substances within a Small Stream Food Web Affected by Sewage Effluent. Water Res. 134, 226–233. doi:10.1016/j.watres.2018.01.066
Cousins, I. T., DeWitt, J. C., Glüge, J., Goldenman, G., Herzke, D., Lohmann, R., et al. (2020). The High Persistence of PFAS Is Sufficient for Their Management as a Chemical Class. Environ. Sci. Process. Impacts 22 (12), 2307–2312. doi:10.1039/d0em00355g
Dixon-Anderson, E., and Lohmann, R. (2018). Field-testing Polyethylene Passive Samplers for the Detection of Neutral Polyfluorinated Alkyl Substances in Air and Water. Environ. Toxicol. Chem. 37 (12), 3002–3010. doi:10.1002/etc.4264
Endo, S., and Matsuura, Y. (2018). Characterizing Sorption and Permeation Properties of Membrane Filters Used for Aquatic Integrative Passive Samplers. Environ. Sci. Technol. 52 (4), 2118–2125. doi:10.1021/acs.est.7b05144
European Commission (2020). Commission Staff Working Document, ‘Poly- and Perfluoroalkyl Substances (PFAS)’. SWD, 249. Available at: https://ec.europa.eu/environment/pdf/chemicals/202. Accessed December 1, 2020.
Fauvelle, V., Kaserzon, S. L., Montero, N., Lissalde, S., Allan, I. J., Mills, G., et al. (2017). Dealing with Flow Effects on the Uptake of Polar Compounds by Passive Samplers. Environ. Sci. Technol. 51 (5), 2536–2537. doi:10.1021/acs.est.7b00558
Fedorova, G., Golovko, O., Randak, T., and Grabic, R. (2013). Passive Sampling of Perfluorinated Acids and Sulfonates Using Polar Organic Chemical Integrative Samplers. Environ. Sci. Pollut. Res. 20 (3), 1344–1351. doi:10.1007/s11356-012-1003-0
Garnett, J., Halsall, C., Thomas, M., Crabeck, O., France, J., Joerss, H., et al. (2021). Investigating the Uptake and Fate of Poly- and Perfluoroalkylated Substances (PFAS) in Sea Ice Using an Experimental Sea Ice Chamber. Environ. Sci. Technol. 55 (14), 9601–9608. doi:10.1021/acs.est.1c01645
Ghisi, R., Vamerali, T., and Manzetti, S. (2019). Accumulation of Perfluorinated Alkyl Substances (PFAS) in Agricultural Plants: A Review. Environ. Res. 169, 326–341. doi:10.1016/j.envres.2018.10.023
Glaser, D., Lamoureux, E., Opdyke, D., LaRoe, S., Reidy, D., and Connolly, J. (2021). The Impact of Precursors on Aquatic Exposure Assessment for PFAS: Insights from Bioaccumulation Modeling. Integr. Environ. Assess. Manag. 17 (4), 705–715. doi:10.1002/ieam.4414
Glüge, J., Scheringer, M., Cousins, I. T., DeWitt, J. C., Goldenman, G., Herzke, D., et al. (2020). An Overview of the Uses of Per- and Polyfluoroalkyl Substances (PFAS). Environ. Sci. Process. Impacts 22 (12), 2345–2373. doi:10.1039/d0em00291g
Gobelius, L., Persson, C., Wiberg, K., and Ahrens, L. (2019). Calibration and Application of Passive Sampling for Per- and Polyfluoroalkyl Substances in a Drinking Water Treatment Plant. J. Hazard. Mater. 362, 230–237. doi:10.1016/j.jhazmat.2018.09.005
Guan, D.-X., Li, Y.-Q., Yu, N.-Y., Yu, G.-H., Wei, S., Zhang, H., et al. (2018). In Situ measurement of Perfluoroalkyl Substances in Aquatic Systems Using Diffusive Gradients in Thin-Films Technique. Water Res. 144, 162–171. doi:10.1016/j.watres.2018.07.031
Hale, S. E., Arp, H. P. H., Slinde, G. A., Wade, E. J., Bjørseth, K., Breedveld, G. D., et al. (2017). Sorbent Amendment as a Remediation Strategy to Reduce PFAS Mobility and Leaching in a Contaminated sandy Soil from a Norwegian Firefighting Training Facility. Chemosphere 171, 9–18. doi:10.1016/j.chemosphere.2016.12.057
Harman, C., Bøyum, O., Tollefsen, K. E., Thomas, K., and Grung, M. (2008). Uptake of Some Selected Aquatic Pollutants in Semipermeable Membrane Devices (SPMDs) and the Polar Organic Chemical Integrative Sampler (POCIS). J. Environ. Monit. 10 (2), 239–247. doi:10.1039/b714725b
Harman, C., Allan, I. J., and Vermeirssen, E. L. M. (2012). Calibration and Use of the Polar Organic Chemical Integrative Sampler-A Critical Review. Environ. Toxicol. Chem. 31 (12), 2724–2738. doi:10.1002/etc.2011
Haukås, M., Berger, U., Hop, H., Gulliksen, B., and Gabrielsen, G. W. (2007). Bioaccumulation of Per- and Polyfluorinated Alkyl Substances (PFAS) in Selected Species from the Barents Sea Food Web. Environ. Pollut. 148 (1), 360–371. doi:10.1016/j.envpol.2006.09.021
Hawthorne, S. B., Azzolina, N. A., Neuhauser, E. F., and Kreitinger, J. P. (2007). Predicting Bioavailability of Sediment Polycyclic Aromatic Hydrocarbons to Hyalella Azteca Using Equilibrium Partitioning, Supercritical Fluid Extraction, and Pore Water Concentrations. Environ. Sci. Technol. 41 (17), 6297–6304. doi:10.1021/es0702162
Huckins, J. N., Manuweera, G. K., Petty, J. D., Mackay, D., and Lebo, J. A. (1993). Lipid-Containing Semipermeable Membrane Devices for Monitoring Organic Contaminants in Water. Environ. Sci. Technol. 27 (12), 2489–2496. doi:10.1021/es00048a028
Kärrman, A., Yeung, L. W. Y., Spaan, K. M., Lange, F. T., Nguyen, M. A., Plassmann, M., et al. (2021). Can Determination of Extractable Organofluorine (EOF) Be Standardized? First Interlaboratory Comparisons of EOF and Fluorine Mass Balance in Sludge and Water Matrices. Environ. Sci. Process. Impacts 23 (10), 1458–1465. doi:10.1039/d1em00224d
Kaserzon, S. L., Hawker, D. W., Booij, K., O'Brien, D. S., Kennedy, K., Vermeirssen, E. L. M., et al. (2014). Passive Sampling of Perfluorinated Chemicals in Water: In-Ssitu Calibration. Environ. Pollut. 186, 98–103. doi:10.1016/j.envpol.2013.11.030
Kaserzon, S. L., Kennedy, K., Hawker, D. W., Thompson, J., Carter, S., Roach, A. C., et al. (2012). Development and Calibration of a Passive Sampler for Perfluorinated Alkyl Carboxylates and Sulfonates in Water. Environ. Sci. Technol. 46 (9), 4985–4993. doi:10.1021/es300593a
Kaserzon, S. L., Vermeirssen, E. L. M., Hawker, D. W., Kennedy, K., Bentley, C., Thompson, J., et al. (2013). Passive Sampling of Perfluorinated Chemicals in Water: Flow Rate Effects on Chemical Uptake. Environ. Pollut. 177, 58–63. doi:10.1016/j.envpol.2013.02.002
Kaserzon, S. L., Vijayasarathy, S., Bräunig, J., Mueller, L., Hawker, D. W., Thomas, K. V., et al. (2019). Calibration and Validation of a Novel Passive Sampling Device for the Time Integrative Monitoring of Per- and Polyfluoroalkyl Substances (PFASs) and Precursors in Contaminated Groundwater. J. Hazard. Mater. 366, 423–431. doi:10.1016/j.jhazmat.2018.12.010
Knutsen, H., Mæhlum, T., Haarstad, K., Slinde, G. A., and Arp, H. P. H. (2019). Leachate Emissions of Short- and Long-Chain Per- and Polyfluoralkyl Substances (PFASs) from Various Norwegian Landfills. Environ. Sci. Process. Impacts 21 (11), 1970–1979. doi:10.1039/c9em00170k
Kotthoff, M., and Bücking, M. (2018). Four Chemical Trends Will Shape the Next Decade’s Directions in Perfluoroalkyl and Polyfluoroalkyl Substances Research. Front. Chem. 6 (APR), 1–6. doi:10.3389/fchem.2018.00103
Lai, F. Y., Rauert, C., Gobelius, L., and Ahrens, L. (2019). A Critical Review on Passive Sampling in Air and Water for Per- and Polyfluoroalkyl Substances (PFASs). Trac - Trends Anal. Chem. 121, 115311. doi:10.1016/j.trac.2018.11.009
Langberg, H. A., Arp, H. P. H., Breedveld, G. D., Slinde, G. A., Høiseter, A., Grønning, H. M., et al. (2021). Paper Product Production Identified as the Main Source of Per- and Polyfluoroalkyl Substances (PFAS) in a Norwegian lake: Source and Historic Emission Tracking. Environ. Pollut. 273, 116259. doi:10.1016/j.envpol.2020.116259
Langberg, H. A., Breedveld, G. D., Slinde, G. A., Grønning, H. M., Høisæter, A., Jartun, M., et al. (2020). Fluorinated Precursor Compounds in Sediments as a Source of Perfluorinated Alkyl Acids (PFAA) to Biota. Environ. Sci. Technol. 54 (20), 13077–13089. doi:10.1021/acs.est.0c04587
Li, H., Helm, P. A., and Metcalfe, C. D. (2010). Sampling in the great lakes for Pharmaceuticals, Personal Care Products, and Endocrine-Disrupting Substances Using the Passive Polar Organic Chemical Integrative Sampler. Environ. Toxicol. Chem. 29 (4), 751–762. doi:10.1002/etc.104
Li, Y., Yang, C., Bao, Y., Ma, X., Lu, G., and Li, Y. (2016). Aquatic Passive Sampling of Perfluorinated Chemicals with Polar Organic Chemical Integrative Sampler and Environmental Factors Affecting Sampling Rate. Environ. Sci. Pollut. Res. 23 (16), 16096–16103. doi:10.1007/s11356-016-6791-1
McDonough, C. A., Guelfo, J. L., and Higgins, C. P. (2019). Measuring Total PFASs in Water: The Tradeoff between Selectivity and Inclusivity. Curr. Opin. Environ. Sci. Health 7, 13–18. doi:10.1016/j.coesh.2018.08.005
Mijangos, L., Ziarrusta, H., Prieto, A., Zugazua, O., Zuloaga, O., Olivares, M., et al. (2018). Evaluation of Polar Organic Chemical Integrative and Hollow Fibre Samplers for the Determination of a Wide Variety of Organic Polar Compounds in Seawater. Talanta 185, 469–476. doi:10.1016/j.talanta.2018.03.103
Morin, N., Camilleri, J., Cren-Olivé, C., Coquery, M., and Miège, C. (2013). Determination of Uptake Kinetics and Sampling Rates for 56 Organic Micropollutants Using “Pharmaceutical” POCIS. Talanta 109, 61–73. doi:10.1016/j.talanta.2013.01.058
Morin, N., Miège, C., Coquery, M., and Randon, J. (2012). Chemical Calibration, Performance, Validation and Applications of the Polar Organic Chemical Integrative Sampler (POCIS) in Aquatic Environments. Trac Trends Anal. Chem. 36, 144–175. doi:10.1016/j.trac.2012.01.007
Pistocchi, A., Dorati, C., Aloe, A., Ginebreda, A., and Marcé, R. (2019). River Pollution by Priority Chemical Substances under the Water Framework Directive: A Provisional Pan-European Assessment. Sci. Total Environ. 662, 434–445. doi:10.1016/j.scitotenv.2018.12.354
Ritscher, A., Wang, Z., Scheringer, M., Boucher, J. M., Ahrens, L., Berger, U., et al. (2018). Zürich Statement on Future Actions on Per- and Polyfluoroalkyl Substances (PFASs). Environ. Health Perspect. 126, 084502. doi:10.1289/EHP4158
Ross, I., McDonough, J., Miles, J., Storch, P., Thelakkat Kochunarayanan, P., Kalve, E., et al. (2018). A Review of Emerging Technologies for Remediation of PFASs. Remediation 28 (2), 101–126. doi:10.1002/rem.21553
Schrenk, D., Schrenk, D., Bignami, M., Bodin, L., Chipman, J. K., Del Mazo, J., et al. (2020). Risk to Human Health Related to the Presence of Perfluoroalkyl Substances in Food. EFSA J. 18 (9), e06223. doi:10.2903/j.efsa.2020.6223
Silvani, L., Riccardi, C., Eek, E., Papini, M. P., Morin, N. A. O., Cornelissen, G., et al. (2017). Monitoring Alkylphenols in Water Using the Polar Organic Chemical Integrative Sampler (POCIS): Determining Sampling Rates via the Extraction of PES Membranes and Oasis Beads. Chemosphere 184, 1362–1371. doi:10.1016/j.chemosphere.2017.06.083
Skaar, J. S., Ræder, E. M., Lyche, J. L., Ahrens, L., and Kallenborn, R. (2019). Elucidation of Contamination Sources for Poly- and Perfluoroalkyl Substances (PFASs) on Svalbard (Norwegian Arctic). Environ. Sci. Pollut. Res. 26 (8), 7356–7363. doi:10.1007/s11356-018-2162-4
Slinde, G. A., Grønning, H. M., Hale, S. E., Langberg, H. A., Jartun, M., Rundberget, J. T., et al. (2019). PFAS Tyrifjorden 2018 Environmental Monitoring of PFAS in Biotic and Abiotic Media.
Taniyasu, S., Yamashita, N., Moon, H.-B., Kwok, K. Y., Lam, P. K. S., Horii, Y., et al. (2013). Does Wet Precipitation Represent Local and Regional Atmospheric Transportation by Perfluorinated Alkyl Substances. Environ. Int. 55, 25–32. doi:10.1016/j.envint.2013.02.005
Urík, J., and Vrana, B. (2019). An Improved Design of a Passive Sampler for Polar Organic Compounds Based on Diffusion in Agarose Hydrogel. Environ. Sci. Pollut. Res. 26 (15), 15273–15284. doi:10.1007/s11356-019-04843-6
Wang, L., Gong, X., Wang, R., Gan, Z., Lu, Y., and Sun, H. (2017). Application of an Immobilized Ionic Liquid for the Passive Sampling of Perfluorinated Substances in Water. J. Chromatogr. A 1515, 45–53. doi:10.1016/j.chroma.2017.08.001
Wang, P., Challis, J. K., Luong, K. H., Vera, T. C., and Wong, C. S. (2021). Calibration of Organic-Diffusive Gradients in Thin Films (O-DGT) Passive Samplers for Perfluorinated Alkyl Acids in Water. Chemosphere 263, 128325. doi:10.1016/j.chemosphere.2020.128325
Keywords: polar organic chemical integrative sampler (POCIS), precursor, water, paper production, perfluorooctane sulfonamidoacetic acid (EtFOSAA)
Citation: Hale SE, Canivet B, Rundberget T, Langberg HA and Allan IJ (2021) Using Passive Samplers to Track per and Polyfluoroalkyl Substances (PFAS) Emissions From the Paper Industry: Laboratory Calibration and Field Verification. Front. Environ. Sci. 9:796026. doi: 10.3389/fenvs.2021.796026
Received: 15 October 2021; Accepted: 23 November 2021;
Published: 10 December 2021.
Edited by:
Weilan Zhang, University at Albany, United StatesReviewed by:
Pablo Antonio Lara-Martin, University of Cádiz, SpainJianhui Tang, Yantai Institute of Coastal Zone Research (CAS), China
Copyright © 2021 Hale, Canivet, Rundberget, Langberg and Allan. This is an open-access article distributed under the terms of the Creative Commons Attribution License (CC BY). The use, distribution or reproduction in other forums is permitted, provided the original author(s) and the copyright owner(s) are credited and that the original publication in this journal is cited, in accordance with accepted academic practice. No use, distribution or reproduction is permitted which does not comply with these terms.
*Correspondence: Sarah E. Hale, c2FyYWguaGFsZUBuZ2kubm8=