 Zizheng Liang1
 Md. Qamruzzaman2*
- 1Boston University Graduate School of Arts and Sciences, Boston, MA, United States
- 2School of Business and Economics, United International University, Dhaka, Bangladesh
The motivation of the study is to gauge the impact of economic policy uncertainty (EPU), knowledge spillover (KS), and climate change (CC) on green economy (GE) transition in BRIC nations for the period from 1991 to 2018. The study applied several unit root tests, including DF-GLS and Zivot–Andrew, for ascertaining the stationarity properties of variables. The long-run association between variables was detected by employing ARDL bound test, tBDM test, and Bayer and Hanck combined cointegration test. Furthermore, the asymmetric effects of EPU, KS, and CC on GE were examined by implementing nonlinear ARDL (NARDL), and finally, directional causal effects were evaluated with the Toda–Yamamoto causality test. In addition, the long-run coefficient’s robustness was assessed by applying fully modified OLS, dynamic OLS, and canonical cointegrating regression (CCR). ARDL bound testing confirms the long-run association in the empirical model for all countries with negative statistically significant effects from EPU and CC to the green economy and positive statistically significant impacts from KS to GE. On the other hand, asymmetric assessment established both long- and short-run asymmetry between EPU, KS, CC, and GE. Finally, directional causality establishes feedback hypothesis holds for EPU and GE in Brazil, India, China, KS, and GE in Brazil, Russia, and China. Thus, study findings established that EPU and KS might influence the transition to the green economy in BRIC nations. Thus, for policy formulation targeting green economic development, it is imperative to put extra effort into understanding the role of EPU and knowledge spillover in the economy.
Introduction
The idea of the green economy is an emerging paradigm at the heart of most developed countries economic and political agendas. Moreover, the concept of the green economy is directly related to climate change and energy efficiency that are environmental “problems” with clear political and social implications (Khor, 2011). Rapid industrial development has generated rising environmental pollution and deterioration of the ecosystem and natural resources. The black economy drives economics in the present decade; such an economy is focused on energy consumption without regard for the climate. Furthermore, the global economy and the growth of countries have undergone natural collapse and social differentiation. Therefore, the growth of the green economy emerged.
Energy is widely acknowledged as one of the most critical sources for economic growth and human development (Kumar and Sinha, 2014). Emerging markets are now chasing the goal of achieving fast economic development at all expense to the world. Economic growth must go hand in hand with developing a low-carbon society to avoid such harm and encourage sustainable development. Greater sustainability aims to ensure or engineer a high standard of life for all people by not exceeding the ecosystems’ potential. The Rio+20 summit aims to promote the goal of low-carbon, resource-efficient, and socially inclusive green economies around the world. A green economy relies heavily on renewable energies, which can be accomplished by encouraging investment that decreases greenhouse emissions and waste, improves electricity and water quality, and protects biodiversity and ecological resources from being lost across the planet.
The motivation of the study is to gauge the role of economic policy uncertainty, knowledge spillover, and climate change in economic transition that is eco-friendly ambiance commonly known as a green economy. The study has considered BRIC nations as a sample with several econometrical tools for evaluating long- and short-run associations and possible directional causalities in empirical investigation. We firmly believe that the findings from the study will open an avenue for green economy transition with the understanding of macro-fundamentals because aggregated economic performances induce the acceptability of green innovation incorporation. Furthermore, the effects of climate change have persistently created forces and challenges to accept conventional technological development. Rather, sustainable development has sought green innovation that is environmentally cost reduction and ecologically balanced with sustainability. Thus, promoting a green economy is imperative for sustainable development goals and ensuring ecologically balanced development.
The present study contributes to the existing literature in multifold. First, in literature focusing on the determinants of green economy transformation, several studies have already been executed by taking into consideration micro aspects (see Radu, 2016; Marco-Fondevila et al., 2018) and macro aspects (see Lin and Benjamin, 2017), and study findings expose a group of key factors which play a critical role in transition into the green economy. However, the role of economic policy uncertainty, knowledge spillover and environmental degradation in the green economy transition is yet to be unleashed in a single equation. To our best knowledge, this is the first-ever empirical study focusing on the nexus between economic policy uncertainty, environmental degradation, and green economy for the period spanning from 1991–2018 in BRIC nations.
Second, the study implements symmetric and asymmetric econometric tools to gauge their association in the long-run and short run. With symmetric assumption, the study applies autoregressive distributed lagged (ARDL) initiated by Pesaran and Smith (1995), further improvements performed by Pesaran et al. (2001), and asymmetric assumption implemented by following the nonlinear framework introduced by Shin et al. (2014). Study findings reveal a long-run association between GE, EPU, KS, and CC I, all considered BRIC countries. Referring to coefficients and association running from EPU and CC exposed negative and statistically significant to the green economy but positive statistically significant association documents for KS to GE. The results of nonlinear cointegration establish asymmetric effects running from EPU, KS, and CC to GE; moreover, the standard Wald test ascertains the asymmetric linage between EPU, KS, and CC to GE in the long run and short-run.
Third, the theoretical contribution of the present study describes a dynamic process of economic change aimed at creating new employment while simultaneously lowering environmental dangers over the long term (Frone and Simona, 2015). Green economy offers energy efficiency by implementing and integrating. However, a correlation has been found between nations with the high gross domestic product (GDP) per capita and the implementation of environmental conservation programs. The results also indicate that nations with lower living standards and countries without a high GDP per capita are not at the forefront of technological innovation (Mikhno et al., 2021). One of the problems in developing countries is the unwillingness of the state and businesses to change technologies and invest in environmental conservation. At the same time, development occurs through the use of ecosystem (extensive methods) that are designed for environmental degradation and the absence of strategic planning, which does not take into account the negative impact and cumulative effect, thereby robbing developing countries of resources (Frone and Simona, 2015).
The remaining structure of the paper, apart from the introduction in the Introduction section is as follows: the literature survey focusing target research force displays in the Literature review section, the variable definition and econometric tools explained in the Variable definition section. The Results and interpretations section deals with the empirical model estimation and interpretation of the outcome. Finally, findings and policy suggestions are reported in the Conclusion and policy implications section 5.
Literature review
Economic policy uncertainty and green economy
Under the mode of industry-driven growth, the energy industry is the cornerstone of economic development, and investment is a key factor in industry development. However, the global climate has been more dynamic and uncertain in recent years, and energy finances have become more sensitive to the consequences of the macroeconomic environment. As a result, it is important to investigate developments in the economic climate on energy spending. The green economy is the output from an energy-efficient economy, implying that the reliance on green energy reduces the cost of environmental degradation. The energy industry is critical for economic progress and persistently seeking continual investment. However, heavy reliance on conventional energy can cause environmental degradation by incurring additional costs to protect the ecosystem. Transformation to a green economy that is less reliant on fossil energy and increasing the integration of renewable energy in the production process motivates environmental cost reduction. For sustainable growth, energy enterprises must maintain energy supply stability, energy efficiency, and pollution mitigation. Therefore, they are essential drivers of economic transition and development (Ozorhon et al., 2018). Liu et al. (2020) performed a study to evaluate the impact of EPU on investment in green energy, i.e., renewable energy in China. The study exposes that EPU promotes investment in the renewable energy sector and inhibits channelizing investment in the traditional energy sector.
A study was performed by Jin et al. (2019) to gauge the impact of macro uncertainty on green economy development in different cities in China. Study findings reveal that macro uncertainty adversely induces the growth of green development in cities with a lower level of innovation. However, the study also observed a higher degree of innovation subsidies, macro uncertainty, and accelerated green development. In a study, Song et al. (2021) assessed the impact of outward FDI on green total factor productivity under economic policy uncertainty by considering firm’s level data. Study findings reveal a statistically significant positive effect from outward FDI to green total factor productivity. In contrast, economic policy uncertainty established a negative statistical significant association.
Reuter et al. (2012) argue that policy uncertainty about feed-in tariffs, expenditure incentives, tax benefits, portfolio criteria, and credential schemes is a major factor shaping renewable energy integration in economic activities from the viewpoint of policy influence. As a result, conventional energy market expenditure in green energy enterprises could be more vulnerable to economic policy uncertainty. Macroeconomic instability exacerbates the uncertainty of regional investment returns, creating a powerful inhibitory impact on fixed-asset investment and equipment reconstruction, potentially leading to a macroeconomic slowdown and even a severe recession. Some studies, however, have found that macroeconomic uncertainty may have an incentive effect on innovation. (Gu et al., 2018).
Knowledge spillover and green economy
According to classical theory, economic development depends on three factors: property, labor, and capital, with land being a fixed quantity and labor and capital being variables. According to traditional economic growth theory, economic development is based on a rise in labor and capital variables. Since it has raised the resource element (i.e., human capital) of the whole population, information spillover has long been recognized as a source of regional economic development. Arrow and red, (1962) first described the importance of knowledge spillovers in economic development, stating that awareness is non-excludable in the same way public resources are. As a result, technology spillover often happens when others learn a company’s R and D knowledge.
On the other hand, the initial invention cannot be compensated in any way (Yang et al., 2010). In the information age, knowledge spillovers will hasten the spread of knowledge and information. Information spillovers will help save money on shipping and conversion expenses, which is good for economic growth. Awareness spillovers will also lower the expense of absorbing new information and boost the capacity of the knowledge recipient to integrate and absorb it. Information spillovers are complicated and discrete, and they form a complex network that is inextricably linked to the outside world. The information recipient filters and chooses the absorbed knowledge accordingly when the contextual context alters. Knowledge spillover decreases innovation costs for other economic actors, such as uncertainties associated with the volatile nature of the innovation phase, while improving their respective capabilities and standards (Cooke, 2010). In a study, Zhao et al. (2019) postulate that knowledge spillover positively ignites the pace of economic transition to the green economy in the long run.
The prime sources of knowledge spillover in literature acknowledged by the inflows of direct foreign internment and the impact of FDI on the economy were extensively investigated, such as economic development (Sindze et al., 2021), energy consumption (Amoako and Insaidoo, 2021), renewable energy, financial development (Ibrahim and Acquah, 2021), and trade liberalization (Cantah et al., 2018). Furthermore, the role of FDI in achieving clean energy is also noticed in the literature (see Paramati et al., 2017; Dong et al., 2019).
Climate change and green economy
Climate change is emerging as an issue of progressive attention, and therefore awareness, in societies. In this work, the problem is addressed from a generational perspective in both developed and developing society and is carried out from the approaches of awareness, human action, and self-responsibility (Foncubierta-Rodríguez et al., 2021). Climate change is a threat to sustainable development, which can be defined as development, which meets the needs of the present without compromising the ability of future generations to meet their own needs (Loiseau et al., 2016). The emphasis on green economy transformation was in reaction to the increasing realization that the mode of economic development and aggregate consumption, which is dependent on the need for and likelihood of endless growth fueled by fossil fuels, was rapidly approaching those limits enforced by the reality that we continue to reside on a finite earth. This conflict—between the requirements of capital accumulation on the one side and the requirements of mutual human existence in comparatively secure eco-social environments–is now gradually manifesting in a wide range of crises, the most notable of which is the climate catastrophe. The interaction and interrelations between aggregate economic activities and ecological imbalance proposed green capitalization with a clear intention to address ecological aspects and sustainable development (Bekun et al., 2021a). Reduced accumulation and inefficient capital can be subsidized with new market opportunities, resulting in aggregate output augmentation; creative destruction is created (Schumpeter, 1942; Bekun et al., 2019).
During the first decade of the new millennium, a new economic rhetoric of the “transition” to a “low-carbon society” or “green economy” arose. Narratives on the need for innovative and progressive solutions to the environmental sustainability crisis have made their way into the mainstream from the political fringes (Steward, 2012). A more ecologically conscious way of accomplishment would need a macro-level understanding of paradigm changes with the micro-level understanding of network creativity (Green et al., 1999). Green growth proponents agree that climate change presents an unprecedented obstacle but remain optimistic that technical advancements, sectoral, and behavioral change, are ways to maximize productivity are available to help them cope. Several improvements are thought to be imminent, given the presence of a market-based carbon price, the use of renewable technology and activities, and the direct investment of alternative energies like solar and wind power. Furthermore, thriving green economy prospects requires green investment assistance through investment diversifications, risk sharing, predictable policy environment, and environmental policy based on international climate agreement (Ahmed, 2013; Parry et al., 2015).
A study performed by Alfredsson (2004) quantifies the impact of green use on climate change by considering household consumption data. The study established a negative association between green consumption and carbon emission in the environment, implying that CO2 emission can be controlled by encouraging green consumption among households. Further evidence is available in the study of Kupika et al. (2019) with household survey data. The study documented that the transaction to green economy accelerated through implementing climate change programs and projects in the economy. Reduction of CO2 emission with the assistance of managed consumption level significantly relies on energy and CO2 emission relationship at sectoral level in energy substitutions (Alfredsson, 2002; Meangbua et al., 2019; Bekun et al., 2021b). The concept of green economy adaptation accelerates technological advancement and diversification of energy applications, thus inducing society’s energy efficiency with lower carbon emissions. Furthermore, adopting such a “green” consumption pattern, in line with the overall “green” consumption scenarios, reduces energy requirements and CO2 emissions for the greened categories substantially (Räty and Carlsson-Kanyama, 2010).
Variables definition
The study utilizes the annual time series data spanning from 1991–2018. The research variables used for the study involve economic policy uncertainty (EPU), knowledge spillover (KS), climate change (CC), and green economy (GE), please see Table 1 for details.

TABLE 1. Variable notation and proxy.
Green economy
The green economy was first introduced by Pearce et al. in 1989 in response to the undervaluation of environmental and social costs in the current price system (Le Blanc, 2011). Since then, the concept has been broadened. A green economy has been defined by UNEP (2011a) as one that results in improved “well-being and social equity, while significantly reducing environmental risks and ecological scarcities.” A green economy can be defined as low-carbon, resource-efficient and socially inclusive (Loiseau et al., 2016). UNEP emphasizes the preservation of natural capital, which includes ecosystems and natural resources. In addition to or sometimes interchangeably with the green economy, green growth is often used. For a long time, “green growth” only applied to the growth of the eco-industry. However, the term is currently used to grow the entire economy (Jänicke, 2012). Green growth “is about fostering economic growth and development while ensuring that the natural assets continue to provide the resources and the environmental services on which our well-being relies. To achieve this, it must catalyze investment and innovation, which will underpin sustained growth and give rise to new economic opportunities.” Green growth is qualitative growth that is efficient in its use of natural resources, clean. It minimizes pollution and environmental damages and is resilient in that it explains natural hazards. All these definitions show that a green economy is an “umbrella” concept that encompasses different implications concerning growth and well-being, efficiency, and risk reduction in the use of natural resources. These potentially contradictory implications require clarification regarding the capability of a green economy implementation to support a transition toward sustainability.
Economic policy uncertainty
In recent literature, the role of economic policy uncertainty on macro fundamentals has been extensively assessed (see, for instance, Xu et al., 2021, Jia et al., 2021, Song et al., 2021). Study findings postulated that the importance of EPU considering the aggregated macro performance is immensely important due to both direct and indirect effects had been exposed. As a measure of EPU, literature extensively uses the uncertainty index familiarized by Baker et al. (2016). The EPU index is constructed by monthly data; therefore, combined with the actual situation of the sample data, we selected the simple average method to convert the monthly EPU data into annual data.
EUP is the index of economic policy uncertainty in m months. EPU is the annual data after the average value of economic policy uncertainty.
Knowledge spillover
Knowledge spillover effects on the aggregate economy depend on economic openness and national innovation (Jia et al., 2021), implying that countries with a higher degree of openness and national innovation output can have a higher degree of spillover effects. Economic openness and national innovation practices accelerate the domestic output by attracting foreign investors and channeling capital flows into the economy. FDI is used to measure the regional knowledge spillover effect, which other scholars have widely applied (see Perri and Peruffo, 2016; Zhao et al., 2019). When a firm’s information developed via R and D efforts is gained by others, this is known as knowledge spillover. On the other hand, Original invention cannot be compensated (Yang et al., 2010). Knowledge spillover minimizes the innovation costs of other economic entities, such as risks associated with the uncertainty of the innovation process, hence improving their abilities and standards (Cooke, 2010).
Environmental degradation
According to the environmental Kuznets curves (EKC) hypothesis, in the initial stage, environmental degradation helps improve income generation in society, but as time progresses, the cost of production substantial inbreeds; thus, income possibility decreases (Stern et al., 1996). At low levels of development, both the amount and severity of environmental degradation are constrained by the effects of subsistence economic activity on the resource base and the availability of biodegradable wastes. With the intensification of agriculture and other resource exploitation and the start of industrialization, the rates of resource depletion begin to outpace the rates of resource regeneration, and waste creation grows in quantity and toxicity. As a proxy for environmental degradation, several units have been considered in the literature, but the most reliable and widely used indicator has been established, commonly known as carbon dioxide emission to the environment (see Thornton et al., 2017; Balsalobre-Lorente et al., 2020; Shahbaz et al., 2021).
Considering the research as mentioned earlier variables, the following generalized empirical model is constructed for assessment:
After taking the natural log, Equation 1 can be represented in the following manner:
where GE denotes green economy, EPU for economic policy uncertainty, KS stands for knowledge spillover, and CC for climate change. Furthermore,
In recent period detecting the long-run association among variables, research has been extensively applying the newly introduced cointegration test commonly known as combine cointegration, familiarized by Bayer and Hanck (2013) over conventional cointegration tests, such as Engle and Granger (1987), Johansen (1991), and Banerjee et al. (1998). Bayer and Hanck (2013) produced a combined cointegration test based on several cointegration approaches. This approach provides joint statistics to test the null of no-cointegration for more comprehensive results. If the null is rejected, no alternative is accepted that supports the existence of cointegration. The proposed combined cointegration test achieved consistent and trustworthy cointegration findings by merging all non-cointegrating experiments. Due to numerous testing methods, this cointegration test gives accurate predictions while being computationally efficient. This indicates that the use of non-combining cointegration tests yields more reliable and efficient findings when compared with the use of individual t-tests or system-based tests, as previously stated. Following Bayer and Hanck (2013), the combination of the computed significance level (p-value) of the individual cointegration test in this article is in Fisher’s formula as follows:
The possible p-values of several individual cointegration tests to be extracted from Engle and Granger (1987), Johansen (1995), Peter and Boswijk (1994), and Banerjee et al. (1998), PEG, PJOH, PBO, and PBDM, respectively. To get evidence regarding the long-run association, the calculated F-stat has to grater that the critical value proposed by Bayer and Hanck (2013) is the rejection of the null hypothesis “no cointegration.”
The generalized ADRL model for assessing the nexus between economic policy uncertainty and knowledge spillover, environment degradation, and green economy is as follows:
where GE stands for the green economy, EPU denotes economic policy uncertainty, and KS explains knowledge spillover, CC for climate change, and X* specify the list of control variables in the equation,
To implement the ARDL model, the ordinary least square (OLS) method is used to estimate Equation 8, and then cointegration between the variables can be established in three different ways, first, using the F-test of Pesaran et al. (2001) with the null hypothesis of no-cointegration (
Nonlinear autoregressive distributed lagged
To gauge the asymmetric effect of EPU, KS, and CC on the green economy, the study employed nonlinear ARDL proposed by Shin et al. (2014) and considered the following asymmetric long-run regression.
where
Since a new concept was proposed in estimating both long and short run, a growing number of empirical studies are extensively applied in their respective studies (see, for example, Ali et al., 2018; Qamruzzaman and Jianguo, 2018a; Qamruzzaman and Jianguo, 2018b; Qamruzzaman and Jianguo, 2018c). The positive and negative shocks in EPU are represented in the equation by
Shin et al. (2014) show that the linear model 1) can be transformed into nonlinear ARDL by incorporating decomposition of target variable in the equation, displayed in the following manner:
Equation 6 can be rewritten in the following manner,
where
Toda–Yamamoto causality test
To establish directional causality between financial innovation, money supply, interest rate, remittance and stock price, we applied the non-causality test proposed by Toda and Yamamoto (1995). Because traditional casualty tests are based on F-statistics in a regression context to determine whether some parameters in the model jointly zero (a stable VAR model) are not valid with variables are integrated. To overcome existing limitations in the traditional causality test, Toda and Yamamoto (1995) proposed a causality test utilizing the Modified Wald test to restrict a VAR(k). The Toda and Yamamoto (1995) causality test is based on the idea of Vector autoregressive at level (P=K + Dmax) with correct VAR order K and d extra lag, where d represents the maximum order of integration of time series.
Results and interpretations
Variables order integration in empirical investigation plays an important role in selecting the appropriate model. In the study, conventional unit root tests, including ADF test (Dickey and Fuller, 1979), PP test (Phillips and Perron, 1988), GL-ADF test, and KPSS test (Kwiatkowski et al., 1992), and the results are displayed in Table 2 Study findings that expose variables are integrated in mixed order, i.e., a few variables are stationary at level estimation I (0), and a few variables become stationary after the first difference I (1), but neither variables expose stationary after second difference I (2). The properties of mixed order integration are appropriate for applying autoregressive distributed lagged (Pesaran et al., 2001; Qamruzzaman et al., 2020).
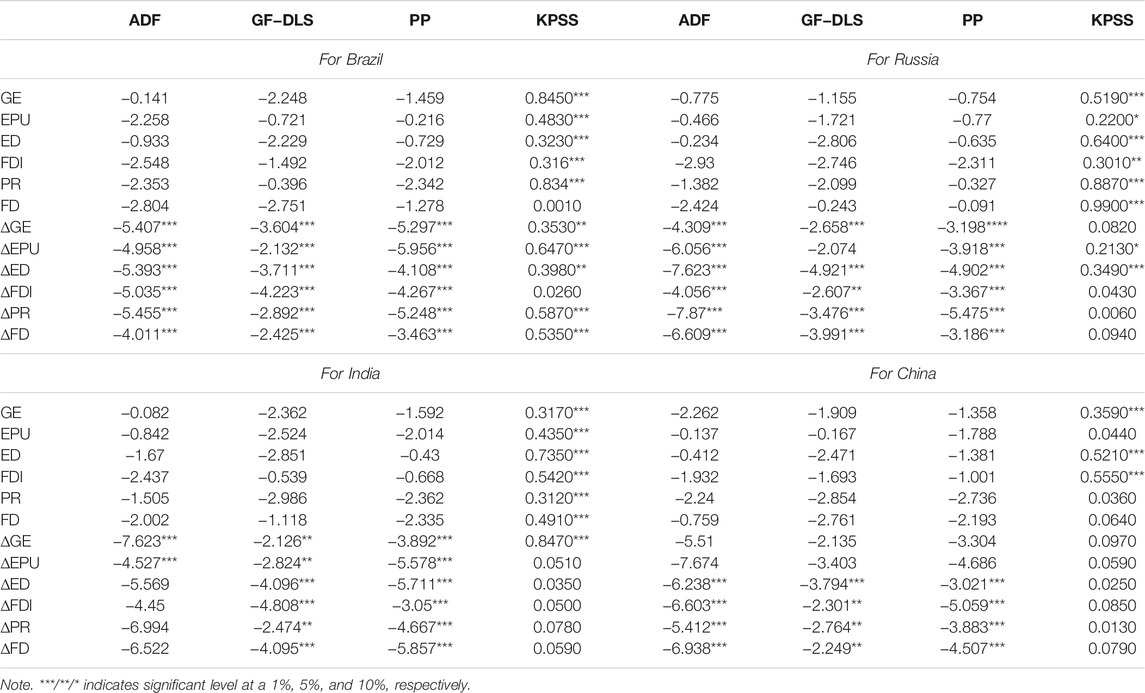
TABLE 2. Results of Unit root test.
Furthermore, the study performed a unit root test with structural Barak following Zivot and Andrews, (2002), and the results are shown in Table 3. After the first difference, the associated p-value of T-stat confirms that the variables are stationary, which is applicable for all estimations of the four countries.
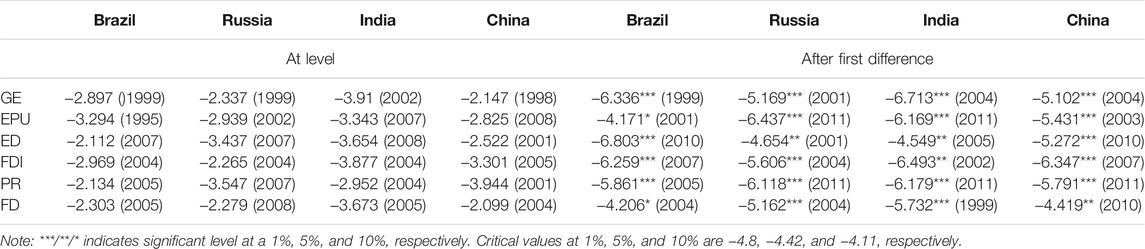
TABLE 3. Result of Zivot Andrew Structural Break Unit Root Test.
Suitable and efficient empirical model estimation refers to selecting appropriate optimal lag. The study performs the lag length criteria test under the VAR environment and considers AIC as the benchmark criteria for lag length determination criteria. According to AIC test statistics, the optimal lag for Brazil, Russia, and India is 2, and for China is 1 (see, Table 4).
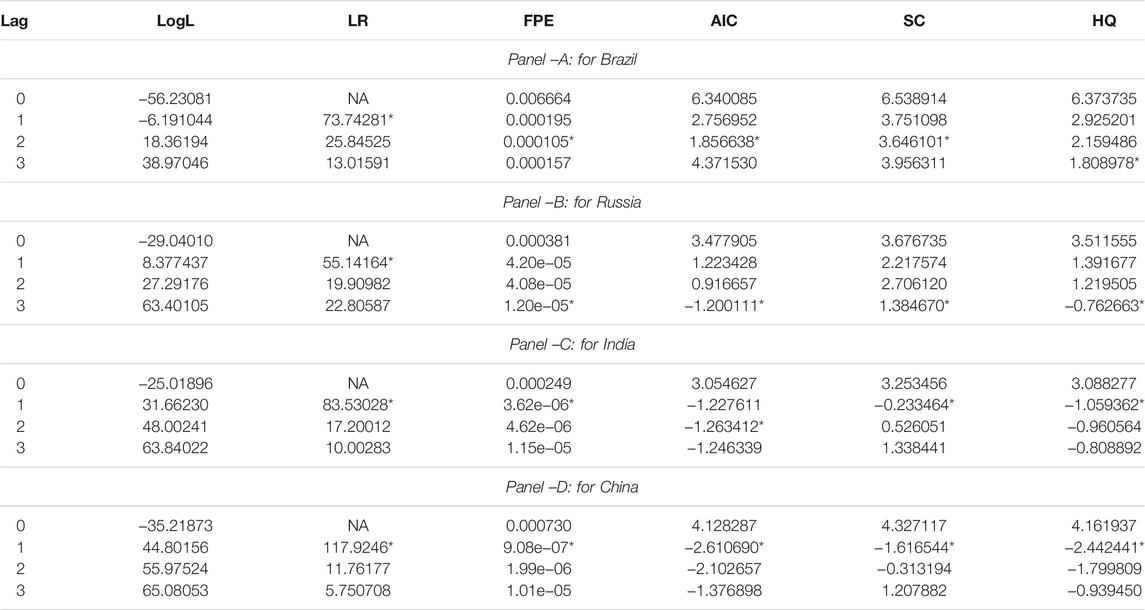
TABLE 4. Optimal lag length determination.
Following, taking appropriate lag, the study evaluates the long-run association between GE, EPU, KS, and ED by implementing the Bayer and Hanck (2013) combined cointegration tests such as EG-JOH EG-JOH-BO-BDM tests. The Fisher’s test statistics are displayed in Table 5. Study findings document that several tests statistics are statistically significant at a 1% level, indicating the long-run cointegrated equation, especially when the green economy is treated as a dependent variable in the equation.
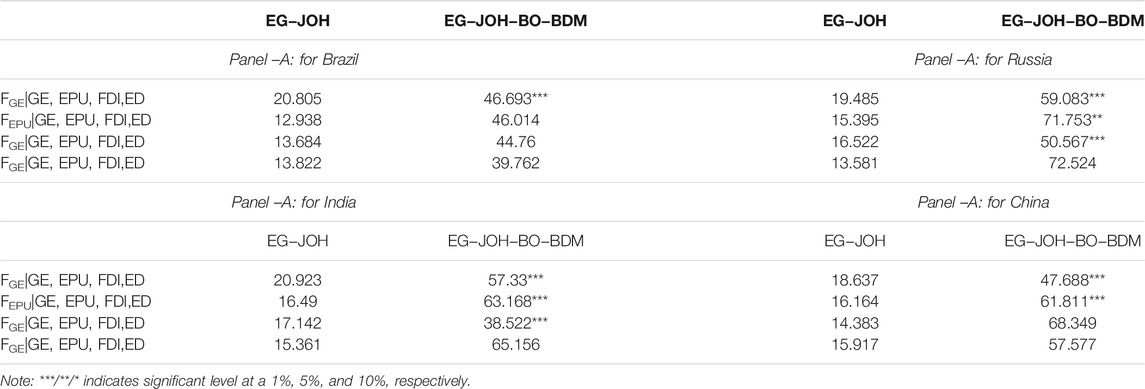
TABLE 5. Results of Bayer and Hanck combined cointegration test.
In the next, the study moves to gauge both long-run and short-run elasticity running from economic policy uncertainty (EPU), spillover effects, climate change to a green economy by perfuming autoregressive distributed lagged (ARDL) proposed by Pesaran et al. (2001). The model estimation results are displayed in Table 6, including panel–A reports results of cointegration, long-run coefficients display in Panel–B, short-run coefficients report in Panel-C, and residual diagnostic test available in Panel-D, The long-run association between economic policy uncertainty, knowledge spillover, environmental degradation, and green economy is displayed in panel A of Table 6. The modified F-test (FPSS) test statistics, advanced by Pesaran et al. (2001). Second, a standard Wald-test (WPSS), which is the above joint null hypothesis, and third, a t-test (tBDM) proposed by Banerjee et al. (1998). Fpass, Wpass, and tBDM ascertain the rejection of the null hypothesis at a 1% level of significance, indicating the presence of co-movement among the research variables in the long run. This conclusion is convincingly true for all four countries concerned. Once the long-run association is established, the study proceeds to evaluate the magnitudes of independent variables on the green economy both in the long-run and short-run.
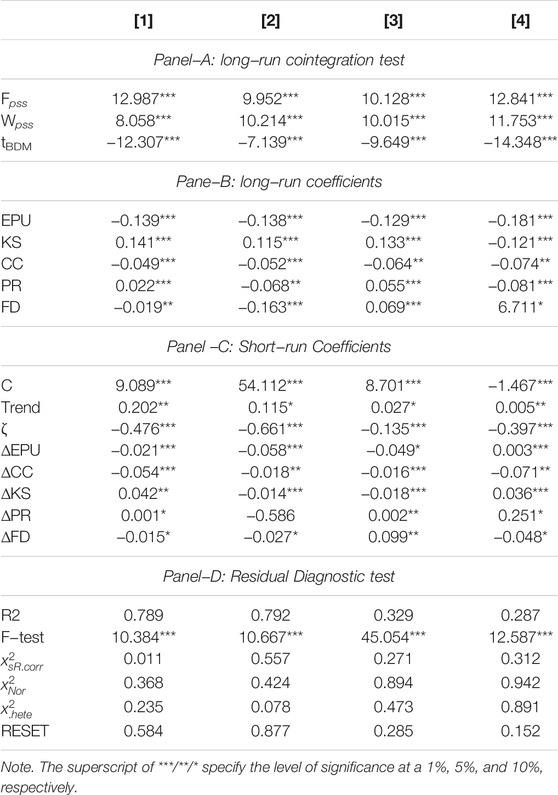
TABLE 6. Results of autoregressive distributed lagged.
Long-run coefficients report in panel-B of Table 6. For economic policy impacts on the green economy, it is apparent that adverse statistically significant effects run from EPU to GE in all four countries estimation. More precisely, a 10% increase of EPU can adversely cause in transforming the green economy by 1.39% in Brazil, 1.38% in Russia, 1.29% in India, and 1.81% in China. According to the elasticity study findings due to EPU, the Chinese economy will experience a higher degree of disadvantageous position for transforming the green economy than other pair countries. Study findings suggest that it is inevitable to confirm stability in economic behavior by subsidizing the critical factors, thus resulting in a study, Liu et al. (2020) advocate that economic instability in terms of policy concern can reduce the possibility for productive investment in the economy that guides the achievement of a renewable resource-based economy. Furthermore, the concentration of ownership may enhance the inhibiting impact of economic policy instability on investment by renewable energy companies. However, it is not important for conventional energy companies.
The impact of knowledge spillover exposes a positive statistically significant association with the measures of green economy, that is for Brazil (a coefficient of 0.141), for Russia (a coefficient of 0.115), for India (a coefficient of 0.133), and China (a coefficient of 0.121). Study findings suggest that knowledge spillover measured by inflows of FDI plays a pivotal role in achieving a green economy. Unambiguously, a 10% growth in FDI inflows can augment the speed of green economy transformation by 1.41% in Brazil, 1.15% in Russia, 1.33% in India, and 1.21% in China. Study findings suggest that favorable fiscal and monetary policies focusing on FDI inflows can immensely move a green economy at ease. Study findings are in line with those of Kumar and Sinha (2014), Asongu and Odhiambo (2020), Sun and Wang (2015), and Zhao et al. (2019). Asongu and Odhiambo (2020) assert that better methods and end-use energy management can accomplish a green economy and expand the adoption of renewable energy sources. Therefore, encouraging greater expenditure on renewable energies and energy conservation is essential in creating more efficient economic growth.
The coefficient of climate change establishes a negative statistically significant impact flowing toward green economy transition in Brazil (a coefficient of −0.049), in Russia (a coefficient of −0.052), in India (a coefficient of −0.064), and China (a coefficient of 0.074). Study findings suggest that the growth of green economy transformation can dwindle due to environmental degradation with carbon emission in the ecosystem, resulting from the application of fossil energy rather than environmental adaptive energy (Weisser, 2007). Tavakoli and Motlagh (2012) postulate that sustainability in a green economy relies on applying natural resources efficiently and prevents the present state of environmental depreciation. Using renewable energies and low carbon technologies come as a major subdivision of the green economy (Gordon et al., 2008).
Results of short-run coefficients are displayed in Table 6 of Panel-C. The coefficients of error correction term exhibit negative statistical significance at a 1% level, indicating that the presence of long-run convergence due to prior period shocks in variables with a speed of 47.6% in model 1, 66.1% in model 2, 13.5% in model 3, and 39.7% in model 4, respectively. Considering the short-run magnitudes of EPU and climate change (CO2) to the transformation of the green economy, the study documents negative statistically significant tie expect in China for EPU effects on the green economy. Nonetheless, the elasticity of EPU and CO2 is negligible in terms of potential impacts. In contrast, the impact of FDI inflows in the economy reveals a positive statistically significant association with GE transformation in BRIC nations. In regard to control variables impacts on GE transformation, it is apparent from coefficients that mixed effects are running, implying that with the varies of state of the economy, the elasticity of financial development, remittances, and economic growth on GE transformation cause differently that is positive for some countries and negative for the others.
Empirical models pass through several diagnostic tests for ensuring internal consistency and efficiency in estimation. Results of residual diagnostic test reports are shown in Panel-D of Table 6. The p-value of associated test statistics confirms that the empirical model is free from serial correlation. Furthermore, the residuals are normally distributed, with no issue of heteroskedasticity, and the RESET test validated the internal stability of model construction.
The results of asymmetric estimation displayed in Table 7 consist of long-run asymmetric cointegration reports in Panel-A, the long-run coefficient in Panel-B, the short-run coefficient in Panel-C, and the residual diagnostic test in Panel-D. Furthermore, the long-run asymmetric association has been ascertained by implementing Fpass following Pesaran et al. (2001) bound testing approach, Wpass with the joint Wald test, and followed by tBDM. Study findings reveal that all the test statistics are statistically significant at a 1% significance level. Therefore, the finding suggests that the impacts from EPU, KS, and CC may vary over the conventional facts in the long run. Hence, the investigation of asymmetric impacts of EPU, KS, and CC on green economy transformation has an underlying intention and produces some important facts for all sample countries. Panel–D of Table 7 displays the test statistics from the standard Wald test for both long-run and short-run asymmetric effects from economic policy uncertainty, knowledge spillover, and climate change on the green economy. Study findings document the asymmetry association between green economy and target variables. Findings suggest that the green economy process has experienced non-conventional effects from EPU, KS, and CC.
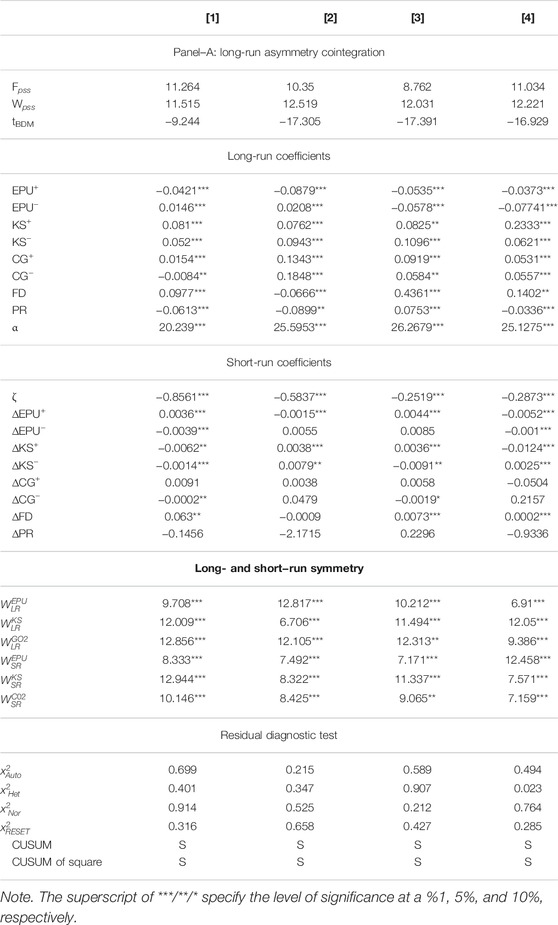
TABLE 7. Results of an asymmetric investigation.
The asymmetric coefficients that are positive and negative shocks in economic policy uncertainty, knowledge spillover, and environmental degradation on the green economy are displayed in Panel—B of Table 7 for asymmetric effects of EPU on the green economy, the study reveals positive shocks, negative, and statistically significant link with green economy transformation for Brazil (a coefficient of −0.042), for Russia (a coefficient of -0.0879), for India (a coefficient of −0.0535), and China (a coefficient of −0.0373). These findings suggest that a 10% augmentation of EPU in BRIC nations can produce a disadvantageous state in the economy and block the green economy transformation by 0.42% in Brazil, by 0.897% in Russia, 0.535% in India, and by 0.373% in China. In comparison, the negative shocks in EPU exposed mixed association with a green economy that is the positive statistical significant tie established in Brazil (a coefficient of 0.0146) and Russia (a coefficient of 0.0208). Moreover, a negative statistically significant linkage reveals in India (a coefficient of −0.078) and China (a coefficient of −0.0741). Therefore, results of asymmetry shocks in EPU on GE have been suggested that GE movements can be accelerated with the reduction of interaction effects of EPU in the economy of China and India.
Furthermore, controlling measures for lessening the effects of EPU in Brazil and Russia shall not favor augmenting the state of GE transformation since asymmetric shocks are positively interconnected with GE movements. For the short-run, the asymmetric effects of EPU on GE reveals both statistically significant and insignificant association. More precisely, positive shocks in EPU established a positive and statistically significant connection with GE in Brazil (a coefficient of 0.0036) and India (a coefficient of 0.0044). In contrast, a negative and statistically significant linkage was disclosed for Russia (a coefficient of −0.0015) and China (a coefficient of −0.0052). Moreover, negative shocks in EPU unveiled negative and statistically significant running in GE transformation in Brazil (a coefficient of −0.0039) and China (a coefficient of −0.001).
The asymmetric effects of knowledge-spillover on green economy. For the long run (see Panel-B). The study disclosed that positive innovation in KS is positive and statistically connected with GE in all sample countries. More particularly, a 10% positive change in inflows of FDI can result in the acceleration of the GE transition process by 0.81% in Brazil, by 0.762% in Russia, by 0.825% in India, and by 2.33% in China. On the other hand, a negative shock in KS can cause adversely in the process of GE, indicating that negative shocks of KS found a positive and statistically significant tie with GE. In particular, a 10% negative variation can block the transaction speed to GE by 0.52% in Brazil, by 0.943% in Russia, by 1.095% in India, and by 0.261% in China. Study findings suggest the pivotal role of FDI inflows in the economy for achieving the goal of GE, implying that inflows of FDI support technological advancement, knowledge sharing for the advanced production processes, and efficient industrialization.
Moreover, environmental efficiency is one output from FDI presence in the economy. Therefore, the cost of environmental protection shall be reduced. For the short-run, the positive shocks in KS exposed positive and statistically significant with GE progress in Russia (a coefficient of 0.0038) and in India (a coefficient of 0.0036), whereas negative and statistically significant tie divulged for Brazil (a coefficient of −0.0062) and China (a coefficient of −0.0124).
Furthermore, referring to negative shocks in KS, the study exposes positive and statistically significant ties with GE economy transition activities in Russia (a coefficient of 0.0079) and China (a coefficient of 0.0025). In contrast, a negative and statistically significant connection was disclosed for Brazil (a coefficient of −0.0014) and India (a coefficient of −0.0091). Aldieri et al. (2020) postulated that FDI inflows allow transformation and transfer of technological advancement and knowledge development; eventually, knowledge diffusion establishes energy application and consumption efficiency. Asongu and Odhiambo (2020) advocated that FDI plays a crucial role in the effective management of carbon emissions, transforming into a green economy.
Panel B exhibits the long-run asymmetric effects of climate change on the green economy. Study documents positive shocks in climate changes can result in an adverse impact on green economy development in Brazil (a coefficient of 0.0154), in Russia (a coefficient of 0.1343), in India (a coefficient of 0.0919), and in China (a coefficient of 0.0531), implying that the positive statistically significant tie between positive shocks in climate change and green economy. At the same time, the negative shocks in climate change exposed a positive connection to GE transformation in Brazil (a coefficient of -0.0084), in Russia (a coefficient of 0.1848), in India (a coefficient of 0.0584), and in China (a coefficient of 0.0557). Furthermore, the asymmetric assessment of climate change on the green economy depicts in Panel–C in the short run. The study reveals the statistically insignificant association between an asymmetric shock in climate change and the green economy expect negative shocks in CG for Brazil (a coefficient of −0.0002) and India (a coefficient of −0.0019). Thus, the study established a direct connection between climate change and green economy transformation, indicating that initiatives favoring lessening environmental degradation due to excessive carbon emission are critically important for achieving a green economy.
Refers to control variable’s effects on the green economy. In the long run, the study documents that financial development positively injects forces in the economy for transforming green economy except for Russia. On the other hand, personal remittances inflows adversely caused and dragged down the green economy transformation process except in India. For the short-run, control variables impacts are statistically insignificant in most cases with the negligible magnitude of variables coefficients.
The following section assesses directional association in the empirical model by following the non-causality framework familiarized by Toda and Yamamoto (1995). Table 8 depicts the results of the causality test. The study unveils several causalities between green economy, economic policy uncertainty, knowledge spillover, and climate change in all target countries. The study concentrated on the target casual effects of the green economy and selected independent variables in the model.
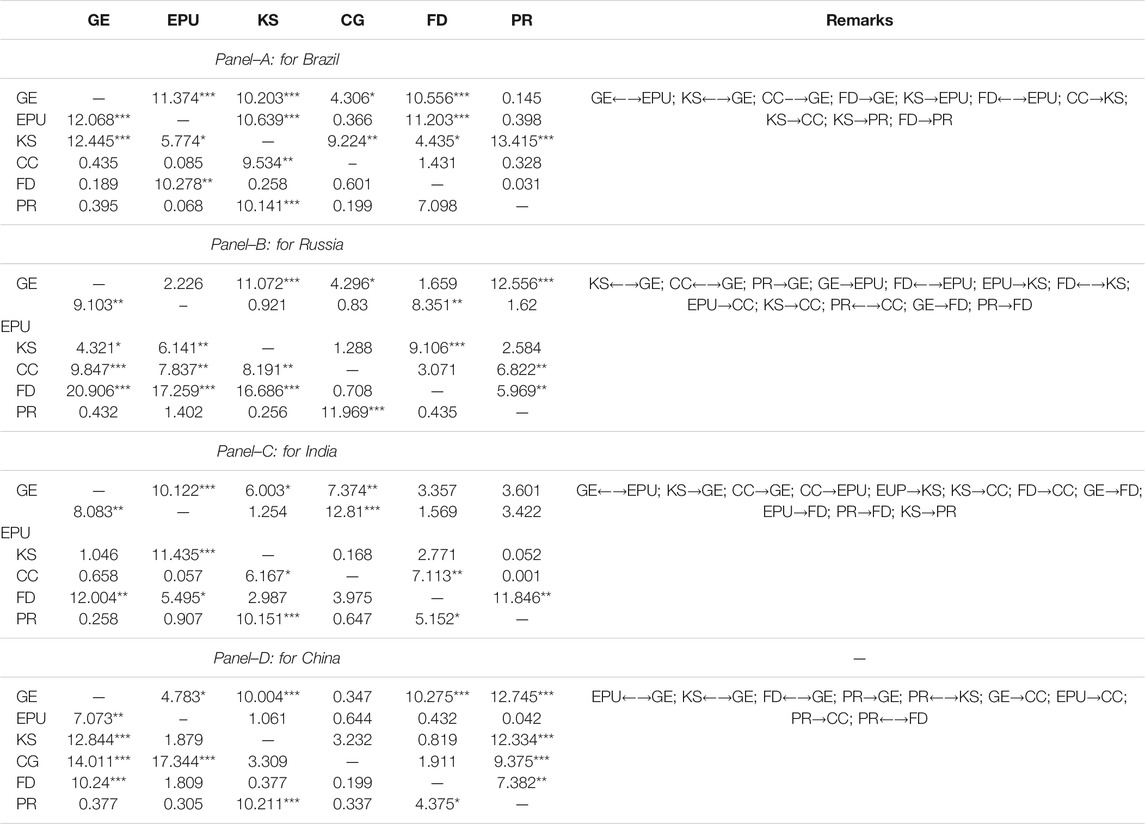
TABLE 8. Results of Toda−Yamamoto causality test (dmax = 2).
Refers to feedback hypothesis that is bidirectional causality, study documents causal effects running between green economy and economic policy uncertainty (GE←→EPU), which is available in Brazil, India, and Russia, knowledge spillover, and green economy (KS←→GE) available in Brazil, Russia, and China, and climate change and green economy (CC←→GE) offered in Russia. Furthermore, the study documents unidirectional causal effects from climate change to the green economy (CC→GE) available in Brazil and India.
Robustness test
The study performed another single equation by following the proposed dynamic framework by Alcántara and Padilla (2009), commonly known as dynamic OLS, for checking the long-run estimation with ARDL. DOLS application benefits are that estimation can handle mixed order of variable integration and eliminate the sample size based, i.e., small sample size. The results of robustness estimation are displayed in Table 9. It is obvious from the estimation that the sign and statistical significance are in line with long-run estimation using ARDL.

TABLE 9. Results of robustness with dynamic ordinary least square (OLS).
Conclusion and policy implications
Over the past 2 decades, the idea of a green economy has emerged with the clear intention of socio-economic development through a sustainable ecosystem, reducing the present state of environmental degradation by lowering carbon emission and poverty eradication from the economy (Ciocoiu, 2011; Barbier, 2016). The green economy is designed to reduce carbon emissions and pollution at the operational level and improve energy and resource usage (Lavrinenko et al., 2019). The motivation of the study is to assess the effects of economic policy uncertainty (EPU), knowledge spillover (KS), and climate change (CC) on the green economy in BRIC nations for the period from 1991 to 2018. To gauge the associations between green economy and target variables study performed several econometrics tools, including ARDL bound testing following Pesaran et al. (2001), nonlinear ARDL following Shin et al. (2014), and directional causal effects detected through implementing the non-granger causality framework offered by Toda and Yamamoto (1995).
Empirical model estimation with symmetry association (see Table 6), study findings document negative statistically significant effects from EPU to the green economy. The verdict is available in all four countries, in line with Song et al. (2021). Study findings suggest that green economy transformation requires stability state of macro activities because volatility adversely caused the ineffective implementation of transitional activities. Barbier (2011) advocated that a green economy demands energy efficiency and clean technology integration for mitigating ecological imbalance and ensuring sustainable environmental development. Nexus between knowledge spillover and the green economy exposed a positive statistically significant association in all sample countries. It is in line with Kumar and Sinha (2014). The study finding suggests that inflows of FDI in the economy might be advantageous through technological advancement and knowledge sharing are the outcome. Additionally, the possible causal effects that are inductive to the green economy due to FDI can happen with the excessive conventional energy consumption for industrialization. Fostering energy-efficient investment and clean technology development is the key to a green economy, but the contribution from FDI still yet to be comprehensively assessed (Asongu and Odhiambo, 2021).
On the other hand, the impact of climate change on the green economy reveals negative and statistically significant. Study findings suggest that the growth of green economy transformation can dwindle due to environmental degradation with carbon emission in the ecosystem, resulting from the application of fossil energy rather than environmental adaptive energy (Weisser, 2007; Poberezhskaya and Bychkova, 2021). Tavakoli and Motlagh (2012) postulate that sustainability in a green economy relies on applying natural resources efficiently and prevents the present state of environmental depreciation. Therefore, using renewable energies and low carbon technologies come as a major subdivision of the green economy (Gordon et al., 2008).
Moreover, The asymmetric model investigation with the standard Wald test confirms the asymmetric association between green economy, economic policy uncertainty, knowledge spillover, and climate change in the long-run and short-run (see Table 7). Study findings suggest that progressive measures for accelerating the present state of green economy transformation in BRIC nations have to be initiated and implemented by considering the behavioral dynamics of EPU, KS, and CC. Economic policy uncertainty that is instability and volatility in aggregate economy persistently provoke to initiate conservative action, thus decreasing the possibility and prospects to achieve sustainable development with green economy transformation. (Mikhno et al., 2021). In addition, a society that makes better use of its energy and resources and reorganizes industrial processes to cut down on waste is a key to implementing long-term sustainable economic growth in all domains. Green economic growth also demands implementing structural changes in manufacturing processes and the kind and quantity of resources utilized and implementing alternative methods and resources (Frone and Constantinescu, 2014). Technological advancement and innovation can positively affect the green economy and intensify with FDIs optimization in the economy. Therefore, innovation and technological know-how shall be considered as a channel for socio-economic welfare and a driver for sustainable development (Eaton, 2013).
Based on empirical findings aligned with existing literature, the study offers policy suggestions for fostering a green economy in BRIC nations. First, efficiency, either in the form of energy or resource allocation in the economy is immensely important for sustainable development with the concept of green transition (Ringel et al., 2016; Matraeva et al., 2019). Second, energy efficiency intensifies economic activities. The interaction effects of environment and energy efficiency augment the effects of a green economy on industries and the perspective effects on business. Third, especially in the short run, energy efficiency successfully managed the adverse effects on the green economy due to excessive fossil fuel consumption.
Second, fostering a green economy has persistently required adaptation and diffusion of innovation, indicating that innovation allows knowledge sharing and technological development to reduce environmental costs. Moreover, the proliferation of new ideas, together with a commitment to progress, is responsible for the emergence of novel scientific theories with non-rival and non-excludable societal benefits. Therefore, gaining the benefits from innovation for achieving a green economy, it is pertinent to offer incentives to the community. Furthermore, environmental policies that incorporate environmental resources and future resource scarcity into the industry and consumer decision-making and innovation policies that either directly provide innovation or provide incentives for industry to do so can help promote innovation for the transition to a green economy.
Third, institutional efficiency, technological integration for operational efficiency can also play a crucial role in achieving a green economy. Tshangela (2014) postulated that institutional capacity enhancement with technology could support the process of green economy transition and significant investment in technological research, development, and implementation with the main goal of increasing resource use efficiency, reducing waste and pollution, and developing alternate alternatives for products and services, the eventual output is to go for green economy transition. Institutional capacity relates to the ability of the local government to oversee all planned technology adoption, implementation, and usage. It refers not only to technical operating and maintenance capacity but also to concerns about delivering sustainable services. It is critical to include and increase institutional capacity considerations into policy procedures such as EIA regulations to facilitate the transition to a green economy via environmental technology assessment.
In conclusion, the idea of a green economy is yet to be extensively established in literature with a common proxy measure; the use of other indicators might produce diverse output and other country integration in empirical estimation. However, the transaction process to green economy demands a close eye on every key macro fundament behavior so that the measures and actions can be initiated and their impact on green transition fully capitalized.
Empirical studies shall not be out of certain limitations, such as proxy measures for research variables, econometrical tool implementation, and data coverage. On this ground of present study, the extended version can be revealed with selection of proxy measures of green economy with green technological integration. In case of independent variables, the role of institutional quality and good governance could possibly be another choice in assessing the nexus in empirical estimation.
Data Availability Statement
The original contributions presented in the study are included in the article/Supplementary Material. Further inquiries can be directed to the corresponding author. Furthermore, we are thankful to the editorial assistant team for their continuous support during the publication process.
Author Contributions
ZL handled the Introduction, methodology, and first draft preparation. MQ contributed to the Introduction, methodology, empirical model estimation, and final preparation. All authors contributed to the article and approved the submitted version.
Funding
The study has received financial support from the Institutions of advanced Researched (IAR) under project financing—IAR/2021/PUB/008.
Conflict of Interest
The authors declare that the research was conducted in the absence of any commercial or financial relationships that could be construed as a potential conflict of interest.
Publisher’s Note
All claims expressed in this article are solely those of the authors and do not necessarily represent those of their affiliated organizations, or those of the publisher, the editors, and the reviewers. Any product that may be evaluated in this article, or claim that may be made by its manufacturer, is not guaranteed or endorsed by the publisher.
Acknowledgments
We would like to express our sincere heartfelt gratitude to the editor and the two esteemed reviewers for their constructive suggestion and recommendations.
Supplementary Material
The Supplementary Material for this article can be found online at: https://www.frontiersin.org/articles/10.3389/fenvs.2021.807424/full#supplementary-material
References
Ahmed, N. (2013). Linking Prawn and Shrimp Farming towards a green Economy in Bangladesh: Confronting Climate Change. Ocean Coastal Manag. 75, 33–42. doi:10.1016/j.ocecoaman.2013.01.002
Alcántara, V., and Padilla, E. (2009). Input-output Subsystems and Pollution: An Application to the Service Sector and CO2 Emissions in Spain. Ecol. Econ. 68, 905–914. doi:10.1016/j.ecolecon.2008.07.010
Aldieri, L., Barra, C., and Ruggiero, N. (2020). Innovative Performance Effects of Institutional Quality: an Empirical Investigation from the Triad. Appl. Econ., 1–13. doi:10.1080/00036846.2020.1764483
Alfredsson, E. C. (2004). "Green" Consumption-No Solution for Climate Change. Energy 29, 513–524. doi:10.1016/j.energy.2003.10.013
Alfredsson, E. (2002). Green Consumption Energy Use and Carbon Dioxide Emission. DiVA, Umeå: Doctoral thesis, monograph, Kulturgeografi. Available at: http://urn.kb.se/resolve?urn=urn:nbn:se:umu:diva-80.
Ali, U., Shan, W., Wang, J.-J., and Amin, A. (2018). Outward Foreign Direct Investment and Economic Growth in China: Evidence from Asymmetric ARDL Approach. J. Business Econ. Manag. 19, 706–721. doi:10.3846/jbem.2018.6263
Amoako, S., and Insaidoo, M. (2021). Symmetric Impact of FDI on Energy Consumption: Evidence from Ghana. Energy 223, 120005. doi:10.1016/j.energy.2021.120005
Arrow, K. J. (1962) Economic Welfare and the Allocation of Resource for Inventions, in The Rate and Direction of Inventive Activity: Economic and Social Factors. R. R. Nelson, Princeton: Princeton University.
Asongu, S., and Odhiambo, N. M. (2020). Trade and FDI Thresholds of CO2 Emissions for a Green Economy in Sub-saharan Africa. Int. J. Energ. Sector Manag. doi:10.1108/ijesm-06-2020-0006
Asongu, S., and Odhiambo, N. M. (2021). Trade and FDI Thresholds of CO2 Emissions for a Green Economy in Sub-saharan Africa. Ijesm 15, 227–245. doi:10.1108/ijesm-06-2020-0006
Baker, S. R., Bloom, N., and Davis, S. J. (2016). Measuring Economic Policy Uncertainty*. Q. J. Econ. 131, 1593–1636. doi:10.1093/qje/qjw024
Balsalobre-Lorente, D., Driha, O. M., Shahbaz, M., and Sinha, A. (2020). The Effects of Tourism and Globalization over Environmental Degradation in Developed Countries. Environ. Sci. Pollut. Res. 27, 7130–7144. doi:10.1007/s11356-019-07372-4
Banerjee, A., Dolado, J., and Mestre, R. (1998). Error-correction Mechanism Tests for Cointegration in a Single-Equation Framework. J. time Ser. Anal. 19, 267–283. doi:10.1111/1467-9892.00091
Barbier, E. B. (2016). Building the Green Economy. Can. Public Pol. 42, S1–S9. doi:10.3138/cpp.2015-017
Barbier, E. (2011). The Policy Challenges for green Economy and Sustainable Economic Development. Nat. Resour. Forum 35, 233–245. doi:10.1111/j.1477-8947.2011.01397.x
Bayer, C., and Hanck, C. (2013). Combining Non-cointegration Tests. J. time Ser. Anal. 34, 83–95. doi:10.1111/j.1467-9892.2012.00814.x
Bekun, F. V., Adedoyin, F. F., and Lorente, D. B. (2021a). Designing Policy Framework for Sustainable Development in Next-5 Largest Economies amidst Energy Consumption and Key Macroeconomic Indicators. Environ. Sci. Pollut. Res. doi:10.1007/s11356-021-16820-z
Bekun, F. V., Alola, A. A., and Gyamfi, B. A. (2021b). The Environmental Aspects of Conventional and Clean Energy Policy in Sub-saharan Africa: Is N-Shaped Hypothesis Valid? Environ. Sci. Pollut. Res., 1–14.
Bekun, F. V., Emir, F., and Sarkodie, S. A. (2019). Another Look at the Relationship between Energy Consumption, Carbon Dioxide Emissions, and Economic Growth in South Africa. Sci. Total Environ. 655, 759–765. doi:10.1016/j.scitotenv.2018.11.271
Cantah, G. W., Brafu-Insaidoo, G. W., Wiafe, E. A., and Adams, A. (2018). FDI and Trade Policy Openness in Sub-saharan Africa. East. Econ. J. 44, 97–116. doi:10.1057/eej.2016.9
Ciocoiu, C. N. (2011). Integrating Digital Economy and Green Economy Opportunities for Sustainable Development. Theor. Empirical Researches Urban Manag. 6, 33–43.
Cooke, P. (2010). Regional Innovation Systems: Development Opportunities from the 'green Turn'. Tech. Anal. Strateg. Manag. 22, 831–844. doi:10.1080/09537325.2010.511156
Dickey, D. A., and Fuller, W. A. (1979). Distribution of the Estimators for Autoregressive Time Series with a Unit Root. J. Am. Stat. Assoc. 74, 427–431. doi:10.1080/01621459.1979.10482531
Dong, Y., Shao, S., and Zhang, Y. (2019). Does FDI Have Energy-Saving Spillover Effect in China? A Perspective of Energy-Biased Technical Change. J. Clean. Prod. 234, 436–450. doi:10.1016/j.jclepro.2019.06.133
Eaton, D. (2013). Technology and Innovation for a Green Economy. Rev. Euro Comp. Int. Env L. 22, 62–67. doi:10.1111/reel.12020
Engle, R. F., and Granger, C. W. J. (1987). Co-integration and Error Correction: Representation, Estimation, and Testing. Econometrica 55, 251–276. doi:10.2307/1913236
Foncubierta-Rodríguez, M.-J., Ravina-Ripoll, R., and López-Sánchez, J. A. (2021). Generational Portrait of Spanish Society in the Face of Climate Change. A Question to Consider for the Green Economy under the Well-Being Approach. Energies 14, 807. doi:10.3390/en14040807
Frone, D. F., and Simona, F. (2015). Resource-efficiency Objectives and Issues for a green Economy. Scientific Papers Series Management. Econ. Eng. Agric. Rural Dev. 15.
Frone, S., and Constantinescu, A. (2014). Impact of Technological Innovation on the Pillars of Sustainable Development. Calitatea 15, 69.
Gordon, K., Hays, J., and Walsh, J. (2008). Green-collar Jobs in America’s Cities: Building Pathways Out of Poverty and Careers in the Clean Energy Economy. Washington DC: Apollo Alliance & Green for All.
Green, K., Hull, R., McMeekin, A., and Walsh, V. (1999). The Construction of the Techno-Economic: Networks vs. Paradigms. Res. Pol. 28, 777–792. doi:10.1016/s0048-7333(99)00021-9
Gu, X., Chen, Y., and Pan, S. (2018). Economic Policy Uncertainty and Innovation: Evidence from Listed Companies in China. Econ. Res. J. 2, 109–123.
Ibrahim, M., and Acquah, A. M. (2021). Re-examining the Causal Relationships Among FDI, Economic Growth and Financial Sector Development in Africa. Int. Rev. Appl. Econ. 35, 45–63. doi:10.1080/02692171.2020.1822299
Jänicke, M. (2012). "Green Growth": From a Growing Eco-Industry to Economic Sustainability. Energy Policy 48, 13–21. doi:10.1016/j.enpol.2012.04.045
Jia, Z., Mehta, A. M., Qamruzzaman, M., and Ali, M. (2021). Economic Policy Uncertainty and Financial Innovation: Is There Any Affiliation? Front. Psychol. 12, 631834. doi:10.3389/fpsyg.2021.631834
Jin, P., Peng, C., and Song, M. (2019). Macroeconomic Uncertainty, High-Level Innovation, and Urban green Development Performance in China. China Econ. Rev. 55, 1–18. doi:10.1016/j.chieco.2019.02.008
Johansen, S. (1991). Estimation and Hypothesis Testing of Cointegration Vectors in Gaussian Vector Autoregressive Models. Econometrica 59, 1551–1580. doi:10.2307/2938278
Johansen, S. (1995). Likelihood-Based Inference in Cointegrated Vector Autoregressive Models. Oxford: Oxford University Press.
Khor, M. (2011). Risks and Uses of the green Economy Concept in the Context of Sustainable Development, Poverty and Equity. Geneva: South Centre.
Kumar, N. V., and Sinha, N. (2014). Transition towards a green Economy: Role of FDI. Ijtg 7, 288–306. doi:10.1504/ijtg.2014.066619
Kupika, O. L., Gandiwa, E., and Nhamo, G. (2019). Green Economy Initiatives in the Face of Climate Change: Experiences from the Middle Zambezi Biosphere Reserve, Zimbabwe. Environ. Dev. Sustain. 21, 2507–2533. doi:10.1007/s10668-018-0146-7
Kwiatkowski, D., Phillips, P. C. B., Schmidt, P., and Shin, Y. (1992). Testing the Null Hypothesis of Stationarity against the Alternative of a Unit Root. J. Econom. 54, 159–178. doi:10.1016/0304-4076(92)90104-y
Lavrinenko, O., Ignatjeva, S., Ohotina, A., Rybalkin, O., and Lazdans, D. (2019). The Role of green Economy in Sustainable Development (Case Study: the EU States). Jesi 6, 1113–1126. doi:10.9770/jesi.2019.6.3(4)
Le Blanc, D. (2011). Special Issue on green Economy and Sustainable Development. Nat. Resour. Forum 35, 151–154. doi:10.1111/j.1477-8947.2011.01398.x
Lin, B., and Benjamin, N. I. (2017). Green Development Determinants in China: A Non-radial Quantile Outlook. J. Clean. Prod. 162, 764–775. doi:10.1016/j.jclepro.2017.06.062
Liu, R., He, L., Liang, X., Yang, X., and Xia, Y. (2020). Is There Any Difference in the Impact of Economic Policy Uncertainty on the Investment of Traditional and Renewable Energy Enterprises? - A Comparative Study Based on Regulatory Effects. J. Clean. Prod. 255, 120102. doi:10.1016/j.jclepro.2020.120102
Loiseau, E., Saikku, L., Antikainen, R., Droste, N., Hansjürgens, B., Pitkänen, K., et al. (2016). Green Economy and Related Concepts: An Overview. J. Clean. Prod. 139, 361–371. doi:10.1016/j.jclepro.2016.08.024
Marco‐Fondevila, M., Moneva Abadía, J. M., and Scarpellini, S. (2018). CSR and green Economy: Determinants and Correlation of Firms’ Sustainable Development. Corporate Soc. Responsibility Environ. Manag. 25, 756–771.
Matraeva, L., Solodukha, P., Erokhin, S., and Babenko, M. (2019). Improvement of Russian Energy Efficiency Strategy within the Framework of "green Economy" Concept (Based on the Analysis of Experience of Foreign Countries). Energy Policy 125, 478–486. doi:10.1016/j.enpol.2018.10.049
Meangbua, O., Dhakal, S., and Kuwornu, J. K. M. (2019). Factors Influencing Energy Requirements and CO2 Emissions of Households in Thailand: A Panel Data Analysis. Energy Policy 129, 521–531. doi:10.1016/j.enpol.2019.02.050
Mikhno, I., Koval, V., Shvets, G., Garmatiuk, O., and Tamošiūnienė, R. (2021). Green Economy in Sustainable Development and Improvement of Resource Efficiency. Cebr 10, 99–113. doi:10.18267/j.cebr.252
Ozorhon, B., Batmaz, A., and Caglayan, S. (2018). Generating a Framework to Facilitate Decision Making in Renewable Energy Investments. Renew. Sust. Energ. Rev. 95, 217–226. doi:10.1016/j.rser.2018.07.035
Paramati, S. R., Apergis, N., and Ummalla, M. (2017). Financing Clean Energy Projects through Domestic and Foreign Capital: The Role of Political Cooperation Among the EU, the G20 and OECD Countries. Energ. Econ. 61, 62–71. doi:10.1016/j.eneco.2016.11.001
Parry, I., Veung, C., and Heine, D. (2015). How Much Carbon Pricing Is in Countries’ Own Interests? the Critical Role of Co-benefits. Clim. Change Econ. 06 (04), 1550019. doi:10.1142/s2010007815500190
Perri, A., and Peruffo, E. (2016). Knowledge Spillovers from FDI: a Critical Review from the International Business Perspective. Int. J. Manag. Rev. 18, 3–27. doi:10.1111/ijmr.12054
Pesaran, M. H., Shin, Y., and Smith, R. J. (2001). Bounds Testing Approaches to the Analysis of Level Relationships. J. Appl. Econ. 16, 289–326. doi:10.1002/jae.616
Pesaran, M. H., and Smith, R. (1995). Estimating Long-Run Relationships from Dynamic Heterogeneous Panels. J. Econom. 68, 79–113. doi:10.1016/0304-4076(94)01644-f
Peter Boswijk, H. (1994). Testing for an Unstable Root in Conditional and Structural Error Correction Models. J. Econom. 63, 37–60. doi:10.1016/0304-4076(93)01560-9
Phillips, P. C. B., and Perron, P. (1988). Testing for a Unit Root in Time Series Regression. Biometrika 75, 335–346. doi:10.1093/biomet/75.2.335
Poberezhskaya, M., and Bychkova, A. (2021). Kazakhstan's Climate Change Policy: Reflecting National Strength, green Economy Aspirations and International Agenda. Post-communist economies, 1–22. doi:10.1080/14631377.2021.1943916
Qamruzzaman, M., and Jianguo, W. (2018a). Does Foreign Direct Investment, Financial Innovation, and Trade Openness Coexist in the Development Process: Evidence from Selected Asian and African Countries? Br. J. Econ. Finance Manag. Sci. 16, 73–94.
Qamruzzaman, M., Jianguo, W., and Jahan, S. (2020). Financial Innovation, Human Capital Development, and Economic Growth of Selected South Asian Countries: An Application of ARDL Approach. Int. J. Finance Econ.
Qamruzzaman, M., Jianguo, W., and Jianguo, W. (2018b). Investigation of the Asymmetric Relationship between Financial Innovation, Banking Sector Development, and Economic Growth. Quantitative Finance Econ. 2, 952–980. doi:10.3934/qfe.2018.4.952
Qamruzzaman, M., and Jianguo, W. (2018c). Nexus between Financial Innovation and Economic Growth in South Asia: Evidence from ARDL and Nonlinear ARDL Approaches. Financ. Innov. 4, 20. doi:10.1186/s40854-018-0103-3
Radu, L.-D. (2016). Determinants of Green ICT Adoption in Organizations: A Theoretical Perspective. Sustainability 8, 731. doi:10.3390/su8080731
Räty, R., and Carlsson-Kanyama, A. (2010). Energy Consumption by Gender in Some European Countries. Energy Policy 38, 646–649. doi:10.1016/j.enpol.2009.08.010
Reuter, W. H., Szolgayová, J., Fuss, S., and Obersteiner, M. (2012). Renewable Energy Investment: Policy and Market Impacts. Appl. Energ. 97, 249–254. doi:10.1016/j.apenergy.2012.01.021
Ringel, M., Schlomann, B., Krail, M., and Rohde, C. (2016). Towards a green Economy in Germany? the Role of Energy Efficiency Policies. Appl. Energ. 179, 1293–1303. doi:10.1016/j.apenergy.2016.03.063
Shahbaz, M., Sharma, R., Sinha, A., and Jiao, Z. (2021). Analyzing Nonlinear Impact of Economic Growth Drivers on CO2 Emissions: Designing an SDG Framework for India. Energy Policy 148, 111965. doi:10.1016/j.enpol.2020.111965
Sharif, A., Godil, D. I., Xu, B., Sinha, A., Rehman Khan, S. A., and Jermsittiparsert, K. (2020). Revisiting the Role of Tourism and Globalization in Environmental Degradation in China: Fresh Insights from the Quantile ARDL Approach. J. Clean. Prod. 272, 122906. doi:10.1016/j.jclepro.2020.122906
Shin, Y., Yu, B., and Greenwood-Nimmo, M. (2014). “Modelling Asymmetric Cointegration and Dynamic Multipliers in a Nonlinear ARDL Framework,” in Festschrift in Honor of Peter Schmidt (Springer), 281–314. doi:10.1007/978-1-4899-8008-3_9
Sindze, P., Nantharath, P., and Kang, E. (2021). FDI and Economic Growth in the Central African Economic and Monetary Community (CEMAC) Countries: An Analysis of Seven Economic Indicators. Int. J. Financial Res. 12.
Song, Y., Hao, F., Hao, X., and Gozgor, G. (2021). Economic Policy Uncertainty, Outward Foreign Direct Investments, and Green Total Factor Productivity: Evidence from Firm-Level Data in China. Sustainability 13, 2339. doi:10.3390/su13042339
Stern, D. I., Common, M. S., and Barbier, E. B. (1996). Economic Growth and Environmental Degradation: The Environmental Kuznets Curve and Sustainable Development. World Dev. 24, 1151–1160. doi:10.1016/0305-750x(96)00032-0
Steward, F. (2012). Transformative Innovation Policy to Meet the challenge of Climate Change: Sociotechnical Networks Aligned with Consumption and End-Use as New Transition Arenas for a Low-Carbon Society or green Economy. Tech. Anal. Strateg. Manag. 24, 331–343. doi:10.1080/09537325.2012.663959
Sun, W. B., and Wang, Z. Y. (2014). Game Analysis of Environmental Regulation Performance of FDI Competition under Green Economy Perspective. Advanced Materials Research 1073–1076, 2669–2674. doi:10.4028/www.scientific.net/amr.1073-1076.2669
Tavakoli, A., and Motlagh, M. S-P. (2012). Energy, Economy and Environment, 3Es Tool for Green Economy. In 2012 Second Iranian Conference on Renewable Energy and Distributed Generation. IEEE, 153–157.
Thornton, P. E., Calvin, K., Jones, A. D., Di Vittorio, A. V., Bond-Lamberty, B., Chini, L., et al. (2017). Biospheric Feedback Effects in a Synchronously Coupled Model of Human and Earth Systems. Nat. Clim Change 7, 496–500. doi:10.1038/nclimate3310
Toda, H. Y., and Yamamoto, T. (1995). Statistical Inference in Vector Autoregressions with Possibly Integrated Processes. J. Econom. 66, 225–250. doi:10.1016/0304-4076(94)01616-8
Tshangela, M. (2014). Environmental Technology Assessment for Enhanced green Economy Transition in South Africa. Int. J. Afr. Renaissance Stud. - Multi-, Inter- Transdisciplinarity 9, 213–226. doi:10.1080/18186874.2014.987964
Weisser, D. (2007). A Guide to Life-Cycle Greenhouse Gas (GHG) Emissions from Electric Supply Technologies. Energy 32, 1543–1559. doi:10.1016/j.energy.2007.01.008
Xu, S., Qamruzzaman, M., and Adow, A. H. (2021). Is Financial Innovation Bestowed or a Curse for Economic Sustainably: the Mediating Role of Economic Policy Uncertainty. Sustainability 13, 2391. doi:10.3390/su13042391
Yang, H., Phelps, C., and Steensma, H. K. (2010). Learning from what Others Have Learned from You: The Effects of Knowledge Spillovers on Originating Firms. Amj 53, 371–389. doi:10.5465/amj.2010.49389018
Zhao, S., Jiang, Y., and Wang, S. (2019). Innovation Stages, Knowledge Spillover, and green Economy Development: Moderating Role of Absorptive Capacity and Environmental Regulation. Environ. Sci. Pollut. Res. 26, 25312–25325. doi:10.1007/s11356-019-05777-9
Keywords: green economy, economic policy uncertainty, knowledge spillover, climate change, NARDL, BRIC
Citation: Liang Z and Qamruzzaman M (2022) An Asymmetric Investigation of the Nexus Between Economic Policy Uncertainty, Knowledge Spillover, Climate Change, and Green Economy: Evidence From BRIC Nations. Front. Environ. Sci. 9:807424. doi: 10.3389/fenvs.2021.807424
Received: 02 November 2021; Accepted: 13 December 2021;
Published: 08 February 2022.
Edited by:
Faik Bilgili, Erciyes University, TurkeyReviewed by:
Ojonugwa Usman Eastern Mediterranean University, TurkeyFestus Victor Bekun, Gelişim Üniversitesi, Turkey
Copyright © 2022 Liang and Qamruzzaman. This is an open-access article distributed under the terms of the Creative Commons Attribution License (CC BY). The use, distribution or reproduction in other forums is permitted, provided the original author(s) and the copyright owner(s) are credited and that the original publication in this journal is cited, in accordance with accepted academic practice. No use, distribution or reproduction is permitted which does not comply with these terms.
*Correspondence: Md. Qamruzzaman, emFtYW5fd3V0MTZAeWFob28uY29t