 Love Kumar1*
 Ifrah Kamil2
 Muhammad Ahmad2
 Sohail Ali Naqvi2
 Matthew J. Deitch1Arjmand Qayyum Amjad2Avinash Kumar3Sarosh Basheer2Masood Arshad2Claudio Sassanelli4
- 1IFAS West Florida Research and Education Center, University of Florida, Milton, FL, United States
- 2Freshwater Programme, WWF-Pakistan, WWF-Pakistan Office, Ali Institute of Education, Lahore, Pakistan
- 3Florida Atlantic University, Boca Raton, FL, United States
- 4Department of Mechanics, Mathematics and Management, Politecnico di Bari, Bari, Italy
The choice of cleaner production practices within the supply chain can improve the textile industry’s environmental, financial, and operational advantages. The objective of this study is to evaluate smart environmental management practices (SEMPs) for minimizing the pollution load (energy waste, water consumption, wastewater generation, and chemical waste) within the supply chain in five textile production units of Lahore, Faisalabad (Punjab), and Karachi (Sindh) in Pakistan and to assist and get comprehensive knowledge on resource saving through cleaner production techniques. A multi-criteria decision-making method was used to identify the possibilities and use for cleaner production and SEMPs. A total of 36 SEMPs have been recorded with three benchmarking levels based on investment and business priority: i) low/no-cost high return, ii) high-cost high return, and iii) medium-cost medium return. After an initial assessment, SEMPs were implemented and post-assessments were conducted after gap of months. It was found that about 1.3 million m3 of water was saved which constituted up 21% of the total water consumption. Moreover, 34,600 tons of chemicals and 1,441,500 kWh energy were also saved. This resource saving also helped industries save 0.792 million USD. Using the SEMPs proposed in this article, the annual GHG emission was significantly reduced for industries where the potential varied from 200 to 8,500 tons of CO2 for different industries.
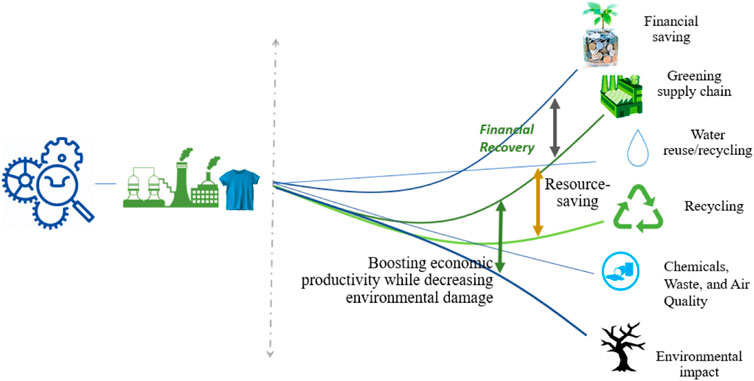
Graphical Abstract
1 Introduction
Greenhouse gases cause climate change (Peters et al., 2015; Nimkar, 2018) to get worse over time. Carbon dioxide (CO2), methane (CH4), nitrous oxide (N2O), hydrofluorocarbons (HFCs), perfluorocarbons (PFCs), sulfur hexafluoride (SF6), and water vapor are all pollutants that can be found in the air (Wadanambi et al., 2020). As was already said, greenhouse gasses are a naturally occurring phenomenon. However, things people do, such as industrialization, cause global warming and changes in local temperature, moisture, wind velocity, rainfall, soil humidity, and rising sea level (Hasanbeigi et al., 2012; Reddy et al., 2014; Wadanambi et al., 2020). Higher living standards of human beings (Behera et al., 2021) and the increase in population worldwide have commenced to increase the use of textile products and production in recent times (Gbolarumi et al., 2021). Textiles stand next to food amongst the strong desires of human beings (Madhav et al., 2018). In today’s world, industrialization is rapidly increasing to meet the demand and luxury (Sikander et al., 2021). In order to grow large businesses to niche ones, industries are handling intense competition to expand production, demand acquisition, and greater wealth generation while retaining narrowed profit commission (Behera et al., 2021; Lyu et al., 2021). The production units have traditionally pursued linear business strategies (Bonciu, 2014; Ghisellini et al., 2016; Michelini et al., 2017). They procure their materials from the natural ecosystem by extraction and mining to produce goods and components (Kirchherr et al., 2017; Camilleri, 2020; D’adamo and Sassanelli, 2022). Ultimately, the product reaches the customers. They use the product and threw it away when it’s not worthy anymore. (Ghisellini et al., 2016; Camilleri, 2019; Hao et al., 2020). Very regularly, the production industries’, as well as the users’ garbage, is thrown in landfills or burnt (Kirchherr et al., 2017; Luttenberger, 2020). These unsustainable methods are significant unjustifiable changes in our natural ecosystem and biospheres, with catastrophic values for human life (Bell et al., 2018; Leipold and Petit-Boix, 2018). Fashion and textile manufacturers are at the front world’s polluting sectors, such that all the state of the fashion and textile production chain risks our resources and environment (Niinimäki et al., 2020). Attentions about pollution due to industrial production are not different. In the late 1960s, several international environmental departments recognized the issue of increasingly adverse impacts of industrial production on the quality of the physical environment (Galarraga Gallastegui, 2002; Hayat et al., 2020). The fashion industry has experienced many critiques over its poor consideration of social and environmental matters (Sikander et al., 2021), putting the non-financial expenses of fashion on the global public agenda in recent years (Colasante and D’Adamo, 2021). The ecological impacts of textile production are extensive and important. For example, although there is a series of assessments, the industry contributes 8%–10% of global CO2 emissions yearly. Textile manufacturing is also a more water user, holding for ∼20% of industrial water pollution from textile processing and dyeing. (Niinimäki et al., 2020; Uddin, 2021).
Textile and garment supply chains are one of the most complicated but less-discussed supply chains due to complex, long chains and interdependencies of different stakeholders (Taddei et al., 2022). Vast product category, low earnings edge, short product life period, seasonal market variability, absence of product uniformity, high energy usage, and environmental matters are some of the subjects that form the textile and garments production complex (Shen and Li, 2019). Industrialization in most of the developed countries began with textile manufacturers as the entrance block was low and labor-intensive. The business could create a large number of job openings (OECD Publishing, 2005; Tsai et al., 2020). In recent times, the production of primary textile products has moved to southeast Asian countries like India, China, Pakistan, Bangladesh, Sri Lanka, Cambodia, Vietnam, and the Philippines, mainly due to the low price of the goods and availability of labor with low rates. Pakistan is listed as the fourth biggest cotton generator (Frederick and Daly, 2019; Ahmad et al., 2020). Pakistan’s textile production represents a principal part of the industrial division and is acknowledged as the backbone of the country’s economy. In Asian countries, Pakistan is the 8th biggest exporter of textile goods. Including an 8.5% GDP share in the national economy, textile industries employ 46% of the total workforce (Ahmed, 2008). Pakistan has 3rd largest spinning potential in Asia; it adds 5% to the global spinning capacity. This textile industry has a remarkable influence on the development and growth of Pakistan’s economy (Memon, 2016; Ahmad et al., 2020). Water, chemical, and energy are largely used by textile for textile production (Mughees and Al-Ahmad, 2015; Parisi et al., 2015). Its production process yields to soil, noise, water, and environmental pollution (Xu et al., 2018). The main waste of these resources (Sassanelli et al., 2019; Vinante et al., 2021) and mass inputs continues from wet processing (preparation, dyeing, and finishing) (Parisi et al., 2015; Armstrong, et al., 2020). The everyday water usage of a normal-sized textile manufacturing industry having a fabric product of approximately 8,000 kg/day is around 1600 m3 (Kant, 2011). The printing section uses 8%, and 16% of this water is utilized in dyeing. Particular water use for dyeing is at least 40 L/kg of fabric depending on the nature of dye applied, on normal (Parisi et al., 2015). Dyeing adds 15%–20% of the cumulative wastewater discharge. Water is more needed for rinsing the dyed and printed material and fabric, to obtain washing swiftness and light settings, and for washing the printing machines to eliminate loose color paste from print sheets, printing covers, and dyeing containers (Parisi et al., 2015; Xu et al., 2018).
The process flow chart of the textile supply chain is presented in Figure 1.
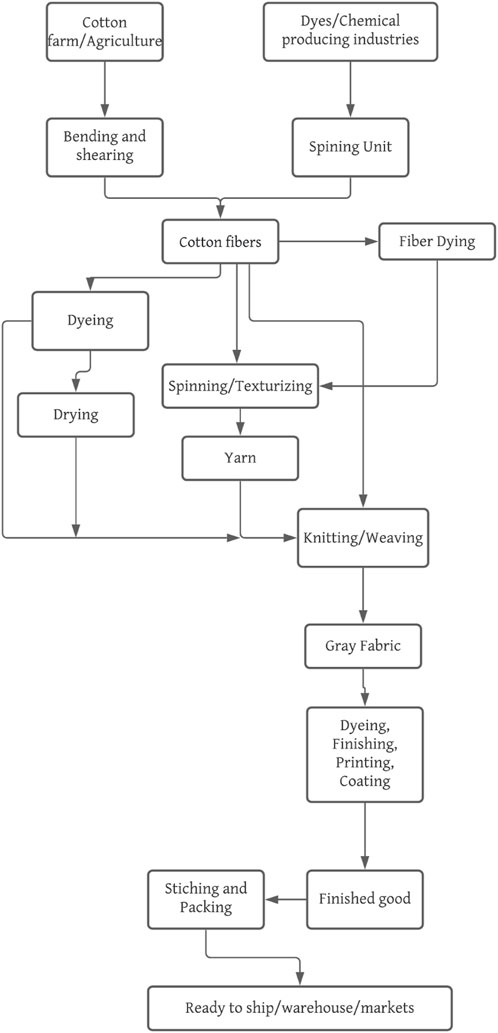
FIGURE 1. Process flow chart of textile supply chain.
Today, most textile brands and retailers are working on the choices open to promoting green production processes in their products’ supply chain (Kar et al., 2012). Furthermore, there has been a recent development of international business governance to include rules for minimizing negative effects on society and the environment caused by international businesses and trade clusters. Self-regulation, business instruments, and flexible legal standards are only a few examples of the new alternative regulatory frameworks used to oversee businesses (Tang et al., 2022). Choices initiated at the initial phase significantly change the later decisions that are to be performed next step of the supply chain (Kar et al., 2012). Cutting the quantity of resources composition within the supply chain using sustainable techniques, renewable resources (Irfan et al., 2022), and the use of the circular economy concept (Acerbi et al., 2021) are major concerns for textile industries (Ozturk et al., 2016). Over the last couple of years, industrial units in Asia and Pakistan has developed and applied multiple resource-saving techniques and cleaner production method in their supply chain (Alkaya and Demirer, 2014; Bevilacqua et al., 2014) aim to control pollution (Sivaramakrishnan, 2011), demonstrated that regional government’s regulatory considerations positively impact the contribution of resources to economic development (Ji et al., 2014; Tang et al., 2022). Environmental rules and regulations of Pakistan do not have critical drivers of sustainable production initiatives (Khan and Qianli, 2017). Demand from international brands and communities that are buyers of Pakistani textile products is the key reason for enterprises to invest in cleaner production opportunities. In addition, cost reductions due to resource-saving are also a motivating part of decision-making (Ortolano et al., 2014). The research presented here intends to help in the standardization and integration of SEMPs techniques identification and decision-making in textile production units. Furthermore, the specific aim of this study is to optimize and gather cleaner production and resource-saving possibilities in the supply chain of textile industrial clusters to guide and help textile industries towards cleaner and sustainable resource management practices. Moreover, this research fills a critical gap in the prioritization of SEMPs/in-house improvements and the construction of decision-making procedures for cleaner production. Decision-makers in the industries will benefit greatly from the new assessment criteria outlined in this study, such as the use of CP with payback. Based on the authors’ knowledge, this study is one of the few to use a systematic method and establish new parameters by employing a payback time for the use of CP in water, chemical, and energy for internal development.
2 Materials and methods
In Pakistan, textile factories were walked through as part of an assessment of their energy, water, and chemical use. The detailed assessment was carried out to check how much water and chemicals were used, how much energy was used, how energy was supplied, and what kinds of equipment were used (Habib et al., 2016). The methodology for this study used the cleaner production evaluation methods suggested by the United Nations Environmental Programme (UNEP) and United Nations Industrial Development Organization (UNIDO), which consists of the steps of partnering, preparation, pre-auditing, detailed auditing, generation of potentials options, feasibility studies, and evaluation as presented in Figure 2 (Lemire, 1977; UNIDO/UNEP, 2008). Initially, we contacted higher authorities of 17 textile industries and shared mobilization forms for their willingness in this assessment study. Through this form, we asked industries to share the details of their processes and consent to pre- and post-assessment. After getting consent from 05 industrial units, the textile units were visited, examined, and detailed process flow charts were prepared before the comprehensive audit. A similar method was used by different studies (Habib et al., 2016; Ozturk et al., 2020; Vinante et al., 2021). During this visit, the input and output were determined for each section, and data collection points were identified for pre and post-audits (Kocabas et al., 2009). Environmental assessment of textile units was carried out under the umbrella of the International Labour and Environmental Standards Application in Pakistan’s SMEs (ILES) project, and WWF-Pakistan implemented it with the support of the European Union (EU) and International Labour Organization (ILO).
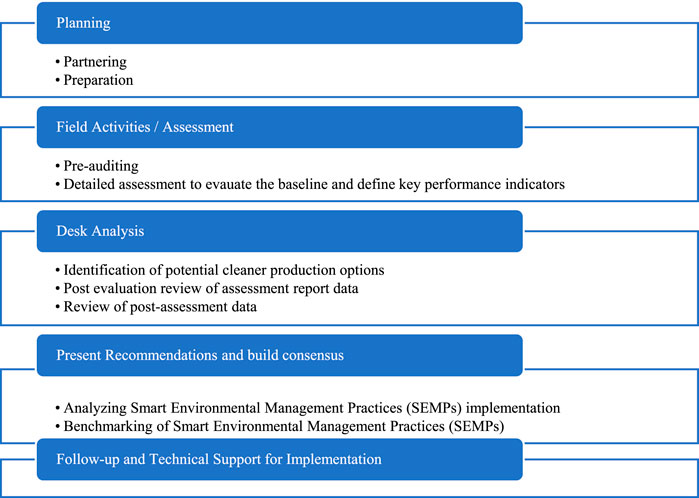
FIGURE 2. Analysis process flow diagram.
The following sections show the assessment processes, i.e., partnering, type of industrial units, preparation, detailed assessment to assess the baseline, identification of potentials CP options, and lastly, benchmarking of SEMPs.
2.1 Partnering
The textile enterprises’ resource efficiency journey starts with a commitment to signing a mobilization document. This begins the process of environmental assessment of the enterprises. The method finds its source in the UNEP Framework for Environmental Audit Methodology.
2.2 Type of industrial units
A condition for a successful outcome of any supply chain environmental sustainability benchmarks is the compliance of the enterprise’s employees (Oelze, 2017). Researchers consistently write the responsibility of the head leadership (Day and Lichtenstein, 2006) but also their involvement and detailed help as being beneficial (Alvarez et al., 2010). As it was a volunteer effort the industries were chosen on the basis of the senior management’s willingness to participate in the project. There were 17 textile industries which were contacted and the primary survey form distributed. We have received responses from 09 industrial units. Out of 09, the 05 different textile processing enterprises were chosen for this study. Two were involved in woven fabric processing, one was involved in knitted fabric processing, one was involved in denim fabric, and the last one was involved in towel weaving and processing. The details of participating industries are presented in Table 1.

TABLE 1. Participating industries and the nature of their operations.
2.3 Preparation
This section includes studying the industries and their processes. For this purpose, the flow diagram showing the analysis process is presented in Figure 2.
A pre-auditing form was generated to get more specific data about the industrial unit based on the review.
2.4 Pre-assessment
This section of the audit includes the selection of the necessary step of the assessment team members (can be two to 4 people, including a team manager), scoping of the proposed audit, collection of background information, and answering possible questions raised by industrial representatives.
2.5 Detailed assessment to assess the baseline and define key performance indicators
This section is the first comprehensive assessment performed at the enterprise. The visit involves classifying specific environmental matters; energy usage, water use, wastewater production, solid waste and air emissions, production inefficiencies; resource utilization, and utility consumption. Quantitative evaluations were carried out using multi-criteria decision-making techniques to evaluate the key performance indicators. It includes a visit of the floor, meeting with workers, checking the performance of machines, collection of primary data, and evaluation of secondary data. Multi-criteria decision-making is an effective method that can be used to find eco-friendly solutions (Aydiner et al., 2016; Ozturk et al., 2016). Multi-criteria decision methods can help in the selection of SEMPs (Cikankowitz and Laforest, 2013; Ozturk et al., 2016). Customized recommendations called “smart environmental management practices (SEMPs)” for compliance with energy conservation, water stewardship, safe use, and management of hazardous chemicals and pollution mitigation based on the performance analysis are then prepared for the enterprise. This includes calculations for resource efficiency and economic/financial viability in terms of money savings. Detailed audits were conducted for a comprehensive examination of the supply chain. The equipment used in the detailed audit is presented in Table 2.
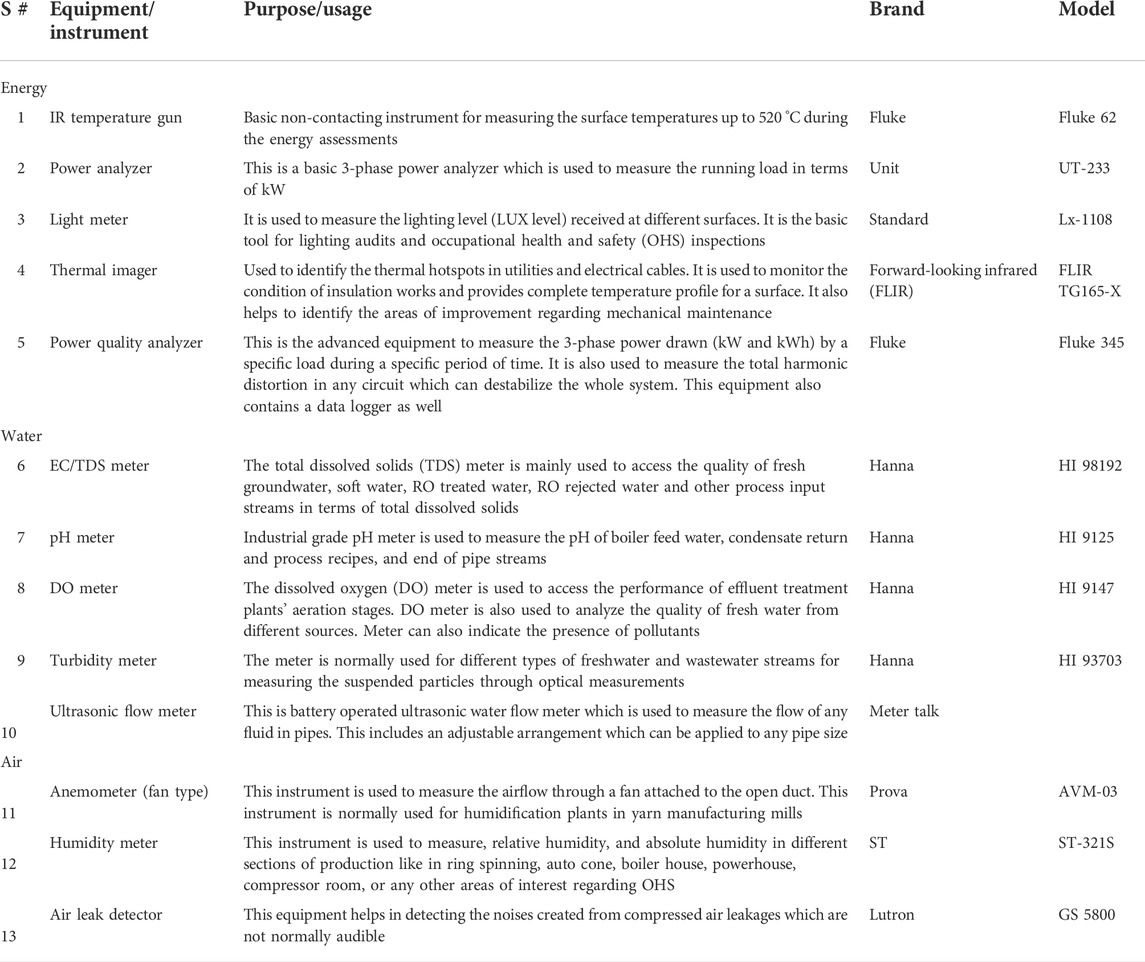
TABLE 2. Equipment used in a detailed analysis of textile industries.
2.6 Identification of potential cleaner production options
This phase of the study involved exploring potential cleaner production techniques (CP) and smart environmental management practices (SEMPs) implemented based on the detailed assessment and recommendation by the assessment team. Multi-dimensional investigation tools assisted in the phase of relative SEMPs/CP. The recommendations were presented and discussed. Moreover, calculations were performed for water productivity status and wastewater polluting load situation for all 05 units.
2.7 Post assessment, reviewing, and analyzing the implementation of smart environmental management practices
Post assessment was carried out once the enterprise indicated that the implementation of suggested CP and SEMPs intervention was considered in the supply chain. The team visits the site and carries out a detailed examination of the interventions and associated data. As a result of this, post-audit activities were to get reports prepared. This includes information on but is not limited to investments in Pakistani rupees for implementation of SEMPs, thermal savings, financial saving in Pakistani rupees, payback period, emission reduction, the result of the financial analysis in terms of payback period, net present value (NPV) and internal rate of return (IRR) of the implemented SEMPs.
2.8 Benchmarking of smart environmental management practices
The benchmark factory’s maintenance performance is based on the best efficiency (highest value) among the other factories being evaluated. It is necessary to have a full understanding of the existing level of water, energy, chemical, and raw material consumption, and its actual conditions in order to implement a practical management plan (Ozturk et al., 2016; Luttenberger, 2020), and benchmarking can provide recommendations for developing energy efficiency improvements (Mahamud et al., 2017). The benchmark of the factory may then be linked to any plant under assessment to see whether there is a difference in process performance (Sankar and Raman, 2020). There are three levels of analysis in this methodology: criterion (maintenance practices), unit criteria (maintenance and management area), and overall efficiency (factory level). Each level offers analysis and development options. A sensitivity study based on the change in criteria weights can help decision-makers determine the effect of a requirement weight on the system performance (Gbolarumi et al., 2021). In the last phase, water management and pollution problems were listed. Their potential SEMPs solutions were identified and described, along with the investments required for implementation, and their payback times, and benchmarked on the basis of calculated financial analysis. The SEMPs were split into three levels based on investment and business priority: i) low/no cost high return, ii) high-cost high return, and iii) medium cost medium return. A total of 05 textile industries participated in the study and were presented with all three scenarios. Benchmarks are an important part of managing resources because they help people make decisions about where to make changes (Menghi et al., 2019). They are a useful way to get past “paradigm blindness,” which is the idea that the way we’ve always done something is the smartest method to do it (Roy et al., 2020). Clean production practices are the most important way to make sure production is sustainable and has less of an effect on the environment (Leipold and Petit-Boix, 2018).
3 Results
Because of the climate catastrophe, waste management and sustainability challenges in the textile and apparel industries have gained great traction in recent years (Acerbi et al., 2022). In this context, first investigated waste management and sustainability challenges in the production of the five textile value chains. Then, smart environmental management practices SEMPs were developed and recommended to the industry for adoption, and finally, benchmarking of SEMPs application was performed using energy and environmental assessments.
3.1 Smart environmental management practices for water
3.1.1 Pre-assessment
The study into the characteristics of water usage was carried out for each of the five selected industries, with findings from both the before and post studies. In the industry, the most water usage part was the dyeing, finishing stages, tank washing, and other housekeeping operations, residential water consumption, steam production, and renewal of the ion exchange resins (Bevilacqua et al., 2014; Ozturk et al., 2016). In fact, many research findings have shown that the washing and/or rinsing stages at the end of every phase of production use more water than the other steps (Alkaya and Demirer, 2014; Hussain and Wahab, 2018). It was observed that the volume of water consumed by the factory varied depending upon the product and the dyeing recipe. According to the data presented in Table 3, the particular water consumptions in the studied industries utilization are as follows:
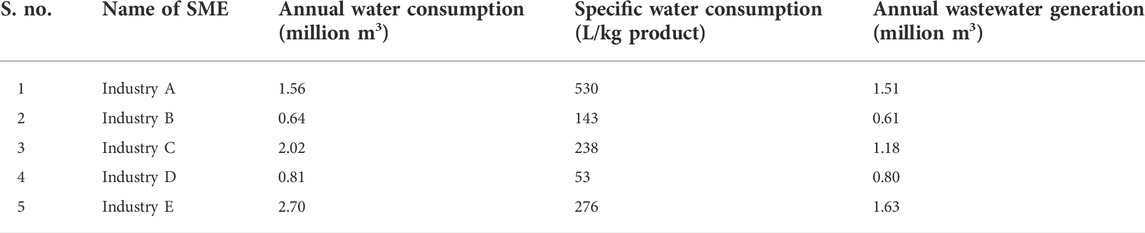
TABLE 3. Water consumption in studied industries.
After the initial assessment of the possible suitable SEMPs for the water usage in the industrial supply chain over the study period was performed at the start of the study. Detail auditing is explained in detail to show that audit results can be trusted because the brand companies or factories do not control them or have any say in them (Lindholm et al., 2016). A variety of SEMPs choices seemed to be relevant to the site. However, the relevance of each SEMPs option was examined with industrial management in order for them to be implemented at the plant size. As a result, the SEMPs measures presented in Table 4 were chosen, and industries were given time to implement them in the supply chain. According to the literature, the best available techniques can reduce energy and water use by up to 65–70 percent (Gönlügür, 2019).
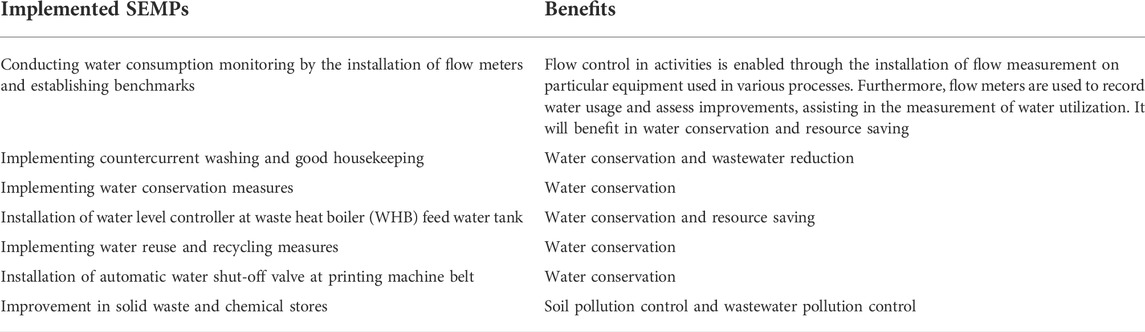
TABLE 4. Smart environmental management practices (SEMPs) and their benefits for water.
3.1.2 Post-assessment
Excessive water consumption was observed inside the manufacturing processes during the initial examination of the selected enterprises, a massive and complicated procedure (Ozturk et al., 2016; Guha, 2018). Prior to the project, the companies’ annual average water use ranged from 0.64 million m3 to 2.70 million m3/year, with wastewater discharge ranging from 60 % to 98%. The post-assessment of industries was carried out after eight months for comparison reasons. The implementation of SEMPs resulted in a water savings of around 21% as presented in Table 5; Figure 3.

TABLE 5. Volume fraction of water and chemical conservation (%) by industries.
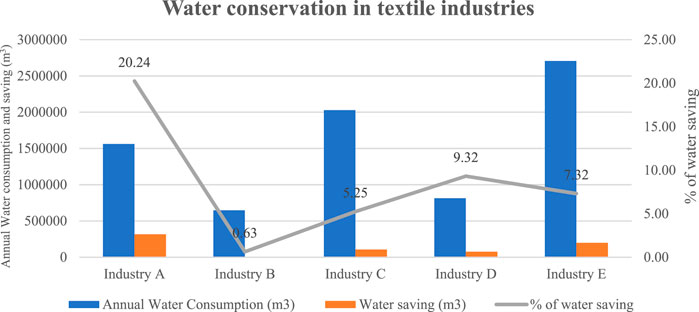
FIGURE 3. Comparison of volume fraction of water conservation (%) in textile industries.
3.2 Smart environmental management practices for energy consumption
3.2.1 Pre-assessment
Energy is crucial in all industrial operations since it is one of the most important resources used throughout production methods. Energy is required to power equipment, heat processing baths, and areas, as well as to power lighting, cooling, and temperature regulation systems, among other things. LPG, natural gas, electricity, steam, furnace oil, and coal are the most common energy sources used in most enterprises. The total average specific energy consumption was calculated as 2 kWh/unit of kg in woven fabric processing (pretreatment, dyeing, printing, and finishing), whereas in the denim industry it was 19.64 kWh/unit of kg. Specific annual electrical energy consumptions and specific consumptions in industries are given in Table 6. According to integrated pollution prevention and control the specific thermal energy and electrical consumptions in the yarn production business are normally 0.9 kWh–6.5 kWh/kg product (IPPC, 2003).
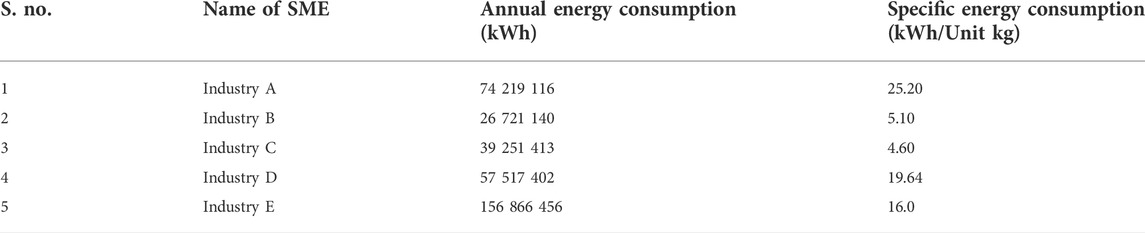
TABLE 6. Energy consumption by industries.
Together with the factory administration, we reviewed and analyzed the application of these options at the factory level.
3.2.2 Post-assessment
Almost every department of the factory, from the assembly line to the cleaning staff, relies on electrical power. The estimated yearly power consumption for the building is 45849496 kWh. Around 7.5% of the industrial unit’s total power consumption is wasted in the transformers. It is more than conventional manufacturing processes that needed electricity. The steam boiler department offers the thermal energy needed by the operations (Ozturk et al., 2020). Factories were given a time of eight months for the implementation of SEMPs. Following the assessment, an attempt has also been made to conduct a comprehensive energy balance study in order to determine the consequences of the SEMPs alternatives implemented in certain processes, as previously described. The overall energy usage (electrical energy + thermal energy) was measured using the major industrial operations and preparation equipment. When compared to the conventional method of producing power and heat separately, the system saves 15%–40% of the energy, as presented in Table 7; Figure 4.
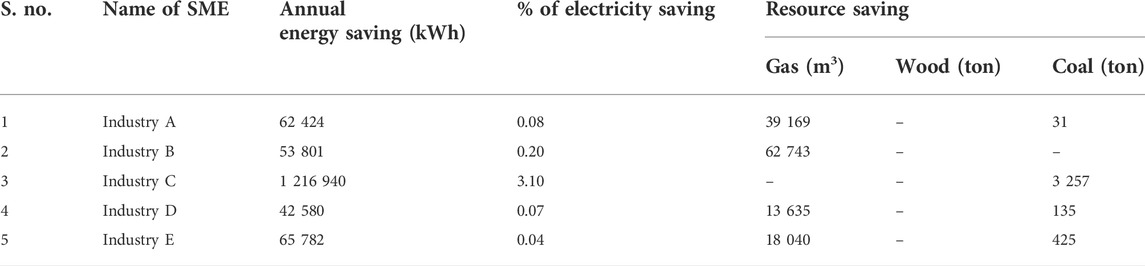
TABLE 7. Volume fraction of energy conservation (%) by textile industries.
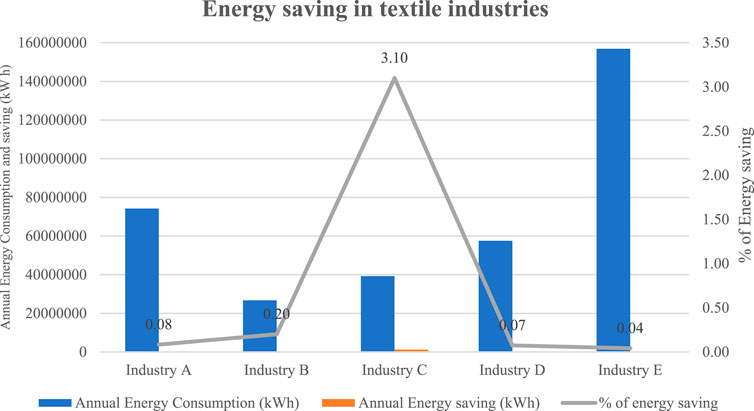
FIGURE 4. Comparison of volume fraction of energy conservation (%) in textile industries.
3.3 Financial analysis and benchmarking of the implemented smart environmental management practices
Water and energy usage in the textile sector has been a source of concern for the market as stated throughout this research. SEMPs recommendations were designed based on industrial assessment and willingness on key themes such as common applications, applications for diverse textile manufacturing processes, waste applications, end-of-pipe approaches, recovery/reuse, greenhouse gases emission, and so on. Implementing energy management within the organization is one of the best ways to cut down on energy use and the costs that come with it. Energy and environment audit methods have been the subject of research about energy and water management (Shen, et al., 2012), energy efficiency benchmarking, assessment of energy and environment audit programs (Fleiter et al., 2012), enhancement of systems or processes through statistical modeling, creation and assessment of energy end-use industrial strategy programs and measures, and evaluation of energy and environmental auditing procedures (Saygin et al., 2011). The list of SEMPs was then studied in depth among each textile industry management for its practical relevance and techno economics. After this stage, the SEMPs list was updated and validated, making this the last phase. Using the final SEMPs interventions, which are shown in Table 8, can result in significant cost savings and economic gains. Based on the projected capital and operational expenses connected with the execution of chosen SEMPs solutions and the estimated potential profits to be obtained by such implementations, the financial advantages and payback period were determined as shown in Table 9.
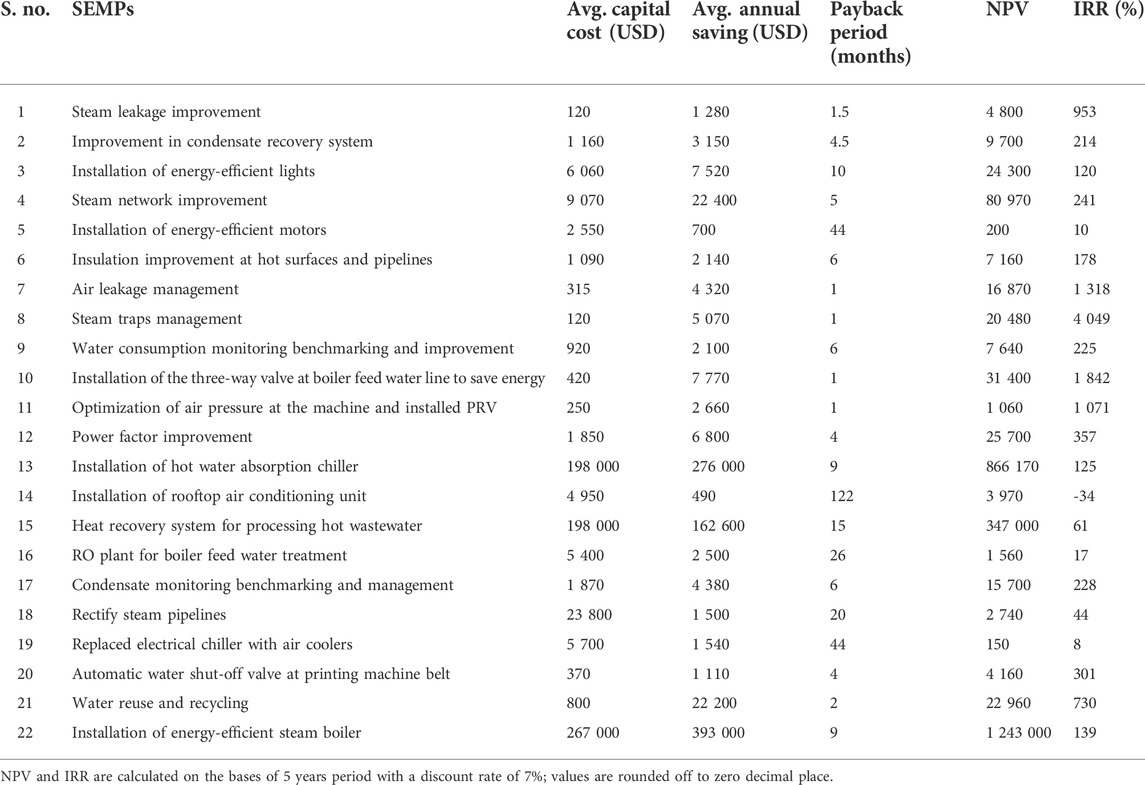
TABLE 8. Financial analysis of the implemented smart environmental management practices (SEMPs).
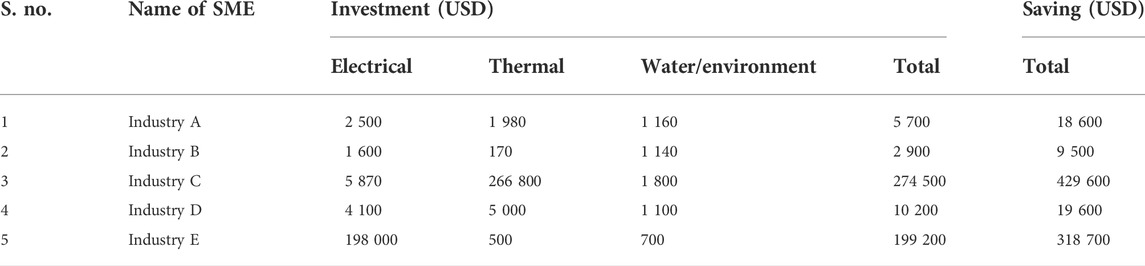
TABLE 9. Total financial investments and savings from implementation of smart environmental management practices (SEMPs).
About 66% of SMEs’ investments were in electrical energy, compared to 34% in thermal energy and less than 1% in water and the environment. The result of the financial analysis in terms of payback period, net present value (NPV), and internal rate of return (IRR) of the implemented SEMPs are given in Table 8.
Steam consumption may be lowered by as much as 5%–10% by optimizing steam use, preventing steam leaks, and insulating steam pipelines. This means that if all SEMPs recommendations are implemented, the overall energy usage in the industry might be reduced by up to 60%. Good waste management strategies may reduce the amount of pollution and waste generated by 8%–15%. The SEMPs that have been implemented are compared to one another for benchmarking on the basis of the financial analysis indicated above, the degree of effort put forth, and the environmental advantages associated with these SEMPs. The benchmarking of SEMPs is presented in Table 11.
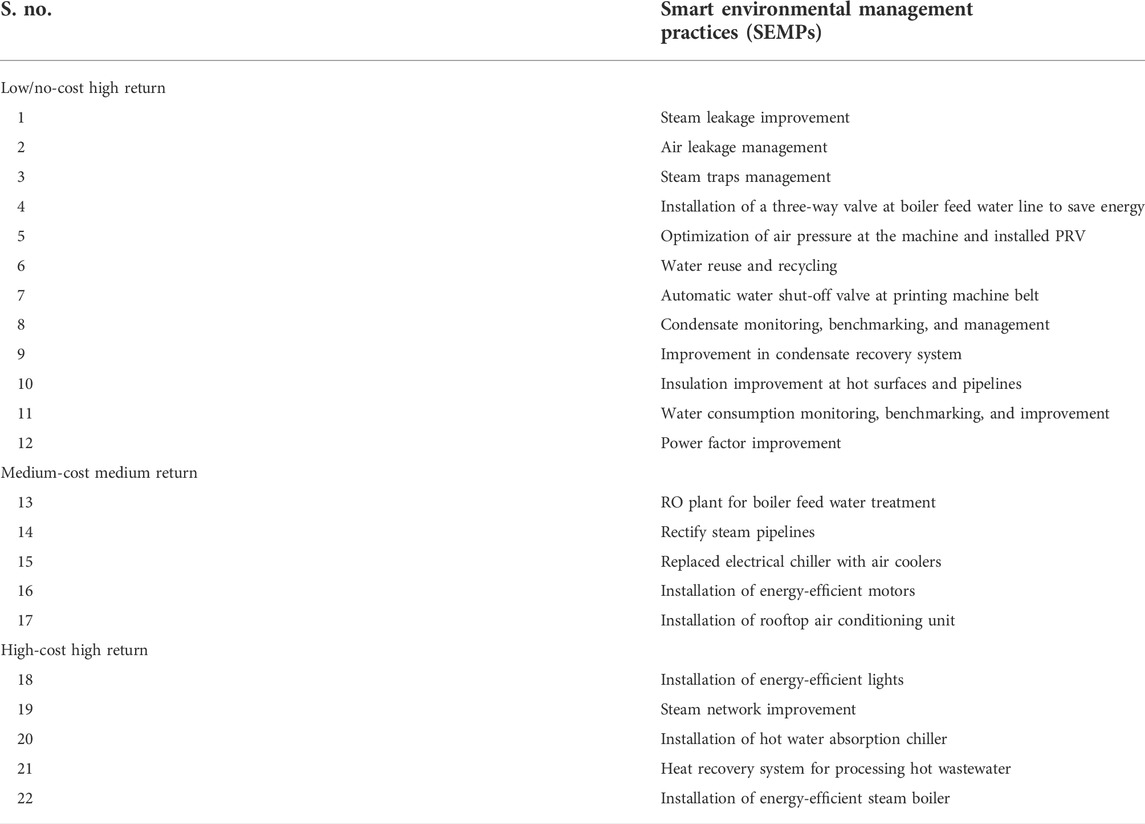
TABLE 10. Benchmarking of smart environmental management practices (SEMPs).
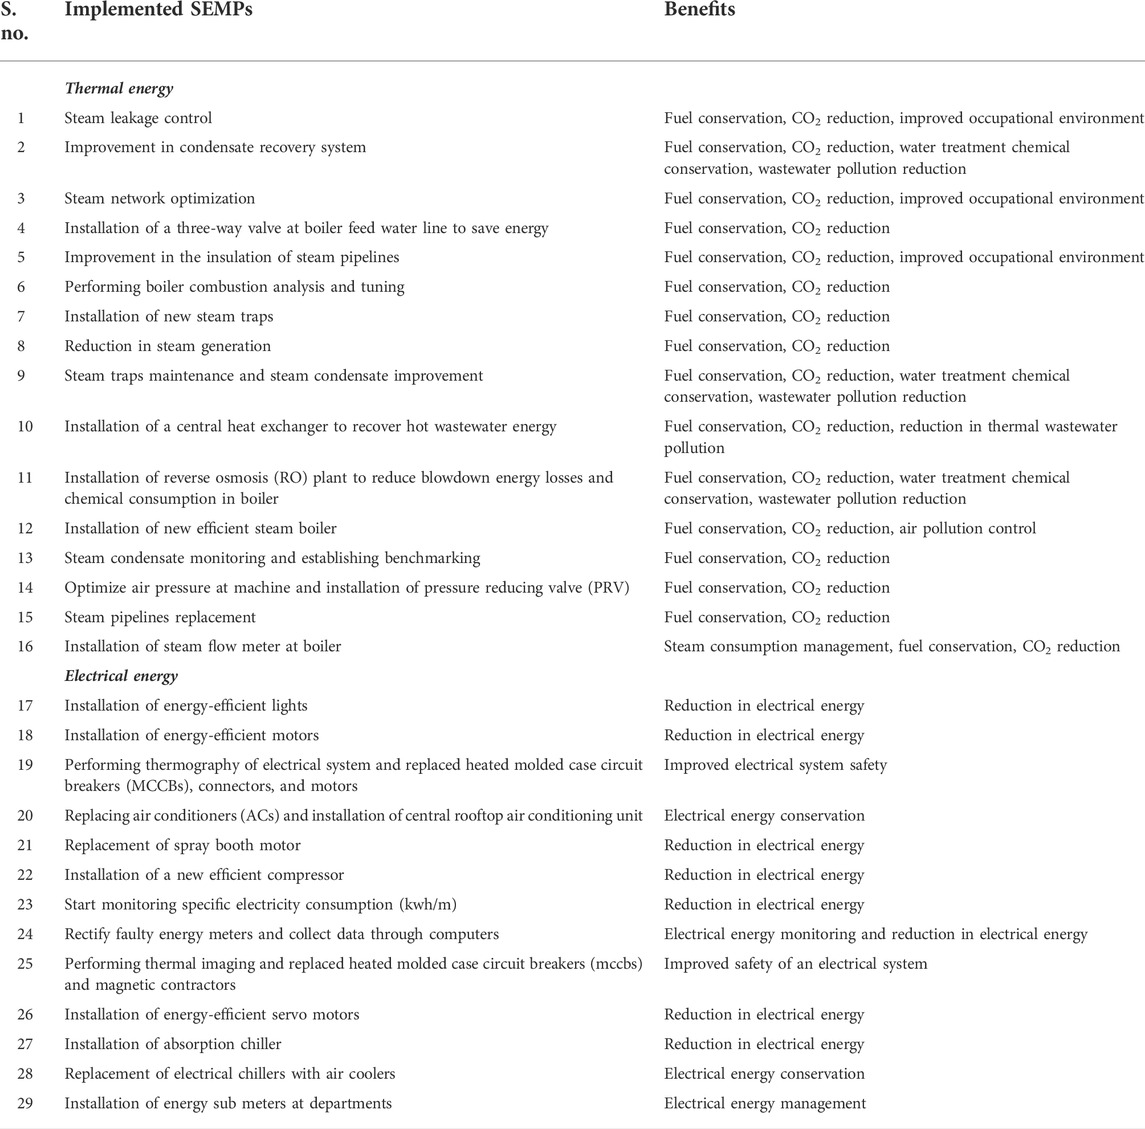
TABLE 11. Smart environmental management practices (SEMPs) and their benefits for energy.
4 Discussion
4.1 Smart environmental management practices for water consumption
The volume of waste water disposed of and the chemical load it receives is the major environmental issue in the textile industries, and textile is extremely water demanding (Kim et al., 2022). Efforts have been made to minimize water consumption within the manufacturing processes and, where possible, to reuse them. This is because the textile supply chain accounts for a huge variety of processing stages that require high volumes of water and chemicals. Since there are now strict environmental laws regarding disposal, textile dyers and finishers are looking at the possibility of recovering water from the wastewater using cleaner production techniques and new technologies (Hussain and Wahab, 2018). The primary sources of water use were dyeing and finishing procedures, as well as steam generation. In dyeing and printing operations, the average water consumption accounted for 84% of total water consumption, whereas the rest of the 14% of total water consumption was contributed by steam generation. A study by Bes-Pia also found similar quantities of water being used by the processes (Bes-Piá et al., 2010). The volume of water required for housekeeping and domestic purposes was quite low, accounting for less than 10% of the overall usage. Furthermore, wastewater resulting from dyeing and finishing procedures accounted for 82% of the total effluent released into the sewage system. That effluent carries most of the chemicals used in industry to the water bodies and soil. Overall, it takes 1.6 × 10⁶ Ld−1 of water to make 8,000 kg of fabric (Behera et al., 2021). Textile processing and production need to take a few steps that don’t cost much money but are important from the point of view of conserving water. Water utilization sensors should be built into new technologies so that water can be used more efficiently. There are a lot of ways to reuse and recycle wastewater, but doing so could result in the value of the fabric being made, so steps will need to be taken to reduce that risk (Sivaramakrishnan, 2011; Daylan et al., 2013). Industries were given time to implement SEMPs. This process contributes to the decrease of environmental damage caused by chemicals. The implementation of SEMPs resulted in water savings of around 21%. Weil et al., 2010 share that when comparing software-based scheduling to manual scheduling, we found that the former resulted in a 20%–30% decrease in water usage and a 10%–15% decrease in the production cycle (Jiang et al., 2010). Moreover, the range of particular water consumption varies by facility type. In other studies, the dyeing and finishing industries had the greatest variety (73 m3/ton–167 m3/ton of product), followed by integrated, printing, and man-made material. When compared to other types of mills, man-made fiber, weaving, and printing mills have comparatively low specific consumption of water (Visvanathan et al., 1999). The textile industry should prioritize the technological and product-centric aspects of green design in order to make the shift to a green economy. It is also crucial to provide technological and policy approaches, as well as build strategies for collaboration throughout institutions (including government agencies, enterprises, and communities). Partnerships and strategic initiatives in the apparel industry are crucial to facilitating, guiding, and empowering enterprises, organizations, and stakeholders to make substantial changes toward a sustainable environment (Ikram, 2022).
4.2 Smart environmental management practices for energy
It is commonly accepted that human work caused economic expansion through the factor of production (Khan et al., 2022). However, balancing limitless demands with limited resources has resulted in various environmental challenges, such as climate change, carbon dioxide, air pollution, and acid rain, which affect all living things on Earth (Ikram et al., 2020; Ikram et al., 2021). Therefore, the move to a sustainable economy involves the improvement of green growth through in-house improvement using cleaner production methods, that should be adopted by developing countries which are also vulnerable to various environmental challenges, such as Pakistan, which is ranked fifth vulnerable country in the world (Ikram et al., 2021). The energy usage was found to be varied due to varying production patterns and water utilization. The dyeing and finishing machines used a lot of thermal energy, whereas the spinning units used a lot of power. Hong, et al. (2010) discuss in their study that the primary electrical energy consumption equipment includes dynamic facilities, air compressors, spinning frames, and refrigerators, which account for 57.0 percent, 17.0 percent, 5.4 percent, and 1.0 percent of total energy usage, respectively (Hong et al., 2010). The energy consumption of the studied textile industries was a little high. The industry's energy usage can be further decreased by the use of SEMPs given in Table 11, for energy optimization and reduction. Energy management is seen as an important aspect of improving any company’s energy utilization (Apeaning and Thollander, 2013; Schulze et al., 2016). The primary sources of energy supplying the selected factory are found to be natural gas, which is transformed into electricity and steam by a cogeneration unit, and electricity by the mill’s initial phase of the mass and energy analysis which is performed on the electricity generated. The second problem that has been raised is the allocation of the energy resources that have been used in the factory process. The usage of electricity in units varies based on numerous parameters, including the type of product (fiber, yarn, cloth, and fabric), equipment, and ultimate product condition, among others. According to Palamutcu (2010) and Ozturk et al. (2015), the usual specific consumption of energy for thermal and electrical mechanisms in textile manufacturing ranges from 0.1 kWh/kg to 7.3 kWh/kg of product to 11 MJ/kg–80 MJ/kg of product respectively (Palamutcu, 2010; Ozturk et al., 2015). For the wet processing system, there are numerous energy-saving solutions (Hasanbeigi et al., 2012). Furthermore, cogeneration has been shown to dramatically cut Emissions of CO2. Cogeneration has a very high initial investment cost; however, the pay-back period is 3–5 years, depending on the cost of fuel and power at the time of installation. Furthermore, the research highlighted the importance of inter-organizational areas such as energy management in companies. Given the current state of organizational structures, the supply chain strategy can also help industries with effective energy conservation (Kalenoja et al., 2011; Marchi et al., 2018). Ates et al. combined energy monitoring with energy efficiency, and techniques that reduce CO2 emissions (Ranta et al., 2018). Monjurul Hasan et al. (2019) defined energy monitoring as the incorporation of energy variables such as energy measurement and monitoring, data recording of energy-related data, and material flow monitoring and control via a network. The top management should be the one to start and assist a company-wide energy culture. They should also encourage active communication about energy issues both inside and outside the company. The power culture also includes things like the involvement of top management in the process of making energy-related decisions (Blass et al., 2014), Individual and group rewards and compensations, and lastly, training and education about energy are essential to have a susatianble energy management system (Stawicki et al., 2010).
4.3 Greenhouse gas emission
The textile sector consumes a lot of power, fuels, and water, which results in a lot of greenhouse gas emissions (GHGs) and polluted effluent (Yan et al., 2016). In terms of energy usage, the textile industry’s fraction of total energy use in any given nation is determined by the structure of that country’s textile sector. Electricity, for example, is the dominating source of energy for yarn spinning, and fuels are the primary source of energy for textile industrial processing (Ozturk, 2005). In addition to consuming a big quantity of energy, textile manufacturing consumes a lot of water, particularly during wet material processing, and generates a significant volume of polluted effluent. The carbon footprint for the production of textile materials takes into account both the direct GHG emissions from each step of the process and the indirect greenhouse gases GHG emissions from the materials, energy, and other things used in the process (Yan et al., 2016). We use the following formula to calculate the GHG emission:
where ICFn measures the carbon footprint of the production process n,
Conserving water and reducing water contamination will also be part of the industry’s effort to make its manufacturing processes more eco-friendly, especially in water-stressed regions of the world. In this study, we found rising energy efficiency, water efficiency, and pollution-reduction strategies within the supply chain can all contribute to reducing GHG emissions. With the installation of SEMPs, it was reported that certain industries reduced their GHG emissions by 14,064 tons, as presented in (Table 12).
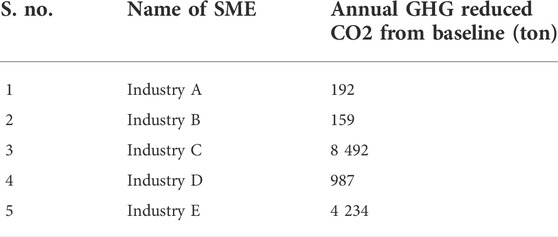
TABLE 12. Total greenhouse gas (GHG) emission reductions.
5 Conclusion
The use of water and energy efficiently is strongly associated with the creation of a sustainable system for industry. This study assessed five selected textile industries from Lahore, Faisalabad, and Karachi under the project of International Labour and Environmental Standards application in Pakistan’s SMEs (ILES). From pre-assessment exercises, it was noticed that pretreatments, dyeing, finishing, and utilities (steam generation and powerhouse) were the main water users. The average water consumption in dyeing and printing was 84%, while steam generation was 14%. Housekeeping and domestic usage accounted for less than 10% of total usage. Moreover, dyeing and finishing wastewater accounted for 82 percent of the total effluent discharged. The effluent carries most industrial chemicals to water bodies and soil. In terms of energy usage, it varied due to production patterns and water usage. The spinning units used more electrical power than the dyeing and finishing machines. In woven fabric processing (pretreatment, dyeing, printing, and finishing), the average specific energy consumption was 25 kWh/kg, while in denim processing it was 19.64 kWh/kg. Annual electrical energy consumption and industrial consumption: during this study, 36 water and energy-related smart environmental management practices were identified and recommended to industries. Industries were given time to implement suggested SEMPs interventions. Steam consumption may be lowered by as much as 5%–10% by optimizing steam use, preventing steam leaks, and insulating steam pipelines. This means that if all SEMPs recommendations are implemented, the overall energy usage in the industry might be reduced by up to 60%. Good waste management strategies may reduce the amount of pollution and waste generated by 8%–15% by effective waste management approaches and the reuse of textile wastes, particularly for the development of additional textile products. Overall, our findings proved that the proposed SEMPs interventions might produce considerable reductions in consumption, resource savings, and emissions reductions. In order to properly concentrate on the development of new technologies, it is also crucial to identify the most polluting stages of textile processing with the aid of the life cycle assessment technique. Future research can be conducted by coupling life cycle assessment of a textile supply chain with the implementation of SEMPs for making sustainable textile products.
Data availability statement
The original contributions presented in the study are included in the article/Supplementary Material; further inquiries can be directed to the corresponding author.
Author contributions
LK: conceptualization, writing original draft, formal analysis, and editing, supervision, and project administration; IK: methodology design and editing; MA: data collection; SN: editing; MD: writing, review, and editing; AQ: review, suggestion, and project administration; AK: resource validation, review, and editing; SB: data editing and writing; MA: supervision and project administration; and CS: review, suggestion, and editing.
Acknowledgments
The publication of this project study was supported by the project “International Labor and Environmental Standards (ILES) Application in Pakistan’s SMEs,” which is also funded by the European Union. The research findings, recommendations, and conclusions drawn from this publication are also a part of ILES project activities and are being implemented in the textile sector in Pakistan. This publication has been produced with the assistance of the European Union ILO and WWF-Pakistan. The contents of this publication are the sole responsibility of the authors and can in no way be taken to reflect the views of WWF-Pakistan or the European Union. We, the authors, would like to acknowledge the industries that participated in this study and the Cleaner Production Institute for their input during this study. The authors also extend their gratitude to organizations that helped throughout this study.
Conflict of interest
The authors declare that the research was conducted in the absence of any commercial or financial relationships that could be construed as a potential conflict of interest.
Publisher’s note
All claims expressed in this article are solely those of the authors and do not necessarily represent those of their affiliated organizations, or those of the publisher, the editors, and the reviewers. Any product that may be evaluated in this article, or claim that may be made by its manufacturer, is not guaranteed or endorsed by the publisher.
References
Acerbi, F., Sassanelli, C., and Taisch, M. (2022). A conceptual data model promoting data-driven circular manufacturing. Operations Manag. Res., 1–20. doi:10.1007/S12063-022-00271-X/TABLES/9
Acerbi, F., Sassanelli, C., Terzi, S., and Taisch, M. (2021). A systematic literature review on data and information required for circular manufacturing strategies adoption. Sustainability 13, 2047. doi:10.3390/su13042047
Ahmad, Y. S., Hamid, A., Saif, S., and Mehmood, A. (2020). Assessment of health and safety risks in a textile industry. J. Nat. Appl. Sci. Pak. 2 (1), 350–369.
Ahmed, Y. (2008). Textile industry of Pakistan. Horizon Securities. Available at: admin.umt.edu.pk.org/Media/Site/STD/FileManager/OsamaArticle/january/jan23/research.pdf (Accessed May 30, 2022).
Alkaya, E., and Demirer, G. N. (2014). Sustainable textile production: A case study from a woven fabric manufacturing mill in Turkey. J. Clean. Prod. 65, 595–603. doi:10.1016/J.JCLEPRO.2013.07.008
Alvarez, G., Pilbeam, C., and Wilding, R. (2010). Nestlé Nespresso AAA sustainable quality program: An investigation into the governance dynamics in a multi-stakeholder supply chain network. Supply Chain Manag. an Int. J. 15 (2), 165–182. doi:10.1108/13598541011028769
Apeaning, R. W., and Thollander, P. (2013). Barriers to and driving forces for industrial energy efficiency improvements in african industries – A case study of Ghana’s largest industrial area. J. Clean. Prod. 53, 204–213. doi:10.1016/J.JCLEPRO.2013.04.003
Armstrong, K. O., Garcia, S., and Nimbalkar, S. (2020). Opportunities for using the industrial assessment center database for industrial water use analysis. Available at: www.osti.gov.
Aydiner, C., Sen, U., Koseoglu-Imer, D. Y., and Can Dogan, E. (2016). Hierarchical prioritization of innovative treatment systems for sustainable dairy wastewater management. J. Clean. Prod. 112, 4605–4617. doi:10.1016/J.JCLEPRO.2015.08.107
Behera, M., Nayak, J., Banerjee, S., Chakrabortty, S., and Tripathy, S. K. (2021). A review on the treatment of textile industry waste effluents towards the development of efficient mitigation strategy: An integrated system design approach. J. Environ. Chem. Eng. 9 (4), 105277. doi:10.1016/j.jece.2021.105277
Bell, J., Paula, L., Dodd, T., Nemeth, S., Nanou, C., Mega, V., et al. (2018). EU ambition to build the world’s leading bioeconomy—uncertain times demand innovative and sustainable solutions. New Biotechnol. 40, 25–30. doi:10.1016/j.nbt.2017.06.010
Bes-Piá, A., Cuartas-Uribe, B., Mendoza-Roca, J. A., and Alcaina-Miranda, M. (2010). Study of the behaviour of different NF membranes for the reclamation of a secondary textile effluent in rinsing processes. J. Hazard. Mater. 178 (1–3), 341–348. doi:10.1016/J.JHAZMAT.2010.01.085
Bevilacqua, M., Ciarapica, F. E., Mazzuto, G., and Paciarotti, C. (2014). Environmental analysis of a cotton yarn supply Chain. J. Clean. Prod. 82, 154–165. doi:10.1016/j.jclepro.2014.06.082
Blass, V., Corbett, C. J., Delmas, M. A., and Muthulingam, S. (2014). Top management and the adoption of energy efficiency practices: Evidence from small and medium-sized manufacturing firms in the US. Energy 65, 560–571. doi:10.1016/J.ENERGY.2013.11.030
Bonciu, F. (2014). The European Economy; from a linear to a circular economy. Romanian J. Eur. Aff. 14 (4), 78–91. doi:10.1016/j.resconrec.2017.10.019
Camilleri, M. A. (2020). European environment policy for the circular economy: Implications for business and industry stakeholders. Sustain. Dev. 28 (6), 1804–1812. doi:10.1002/sd.2113
Camilleri, M. A. (2019). The circular economy’s closed loop and product service systems for sustainable development: A review and appraisal. Sustain. Dev. 27 (3), 530–536. doi:10.1002/sd.1909
Cikankowitz, A., and Laforest, V. (2013). Using BAT performance as an evaluation method of techniques. J. Clean. Prod. 42, 141–158. doi:10.1016/J.JCLEPRO.2012.10.005
Colasante, A., and D’Adamo, I. (2021). The circular economy and bioeconomy in the fashion sector: Emergence of a “sustainability bias”. J. Clean. Prod. 329, 129774. doi:10.1016/J.JCLEPRO.2021.129774
D’adamo, I., and Sassanelli, C. (2022). Biomethane community: A research agenda towards sustainability. Sustain. Switz. 14 (4735), 4735. doi:10.3390/SU14084735
Day, M., and Lichtenstein, S. (2006). Strategic supply management: The relationship between supply management practices, strategic orientation and their impact on organisational performance. J. Purch. Supply Manag. 12 (6), 313–321. doi:10.1016/J.PURSUP.2007.01.005
Daylan, B., Ciliz, N., and Mammodov, A. (2013). Hazardous process chemical and water consumption reduction through cleaner production application for a zinc electroplating industry in Istanbul. Resour. Conservation Recycl. 81, 1–7. doi:10.1016/j.resconrec.2013.09.002
Fleiter, T., Gruber, E., Eichhammer, W., and Worrell, E. (2012). The German energy audit program for firms-a cost-effective way to improve energy efficiency?’. Energy Effic. 5 (4), 447–469. doi:10.1007/s12053-012-9157-7
Frederick, S., and Daly, J. (2019). Pakistan in the apparel global value chain. Duke Global Value Chains Center, Duke University, World Bank, 199.
Galarraga Gallastegui, I. (2002). The use of eco-labels: A review of the literature. Eur. Env. 12 (6), 316–331. doi:10.1002/eet.304
Gbolarumi, F. T., Wong, K. Y., and Olohunde, S. T. (2021). Sustainability assessment in the textile and apparel industry: A review of recent studies. IOP Conf. Ser. Mat. Sci. Eng. 1051 (1), 012099. doi:10.1088/1757-899x/1051/1/012099
Ghisellini, P., Cialani, C., and Ulgiati, S. (2016). A review on circular economy: The expected transition to a balanced interplay of environmental and economic systems. J. Clean. Prod. 114, 11–32. doi:10.1016/j.jclepro.2015.09.007
Gönlügür, M. E. (2019). “Sustainable production methods in textile industry,” in Textile industry and environment. London, United Kingdom: IntechOpen. doi:10.5772/INTECHOPEN.84316
Guha, A. K. (2018). A review on cleaner production in textiles. Int. J. Text. Sci. 7 (4), 90–93. doi:10.5923/j.textile.20180704.02
Habib, M. A., Hasanuzzaman, M., Hosenuzzaman, M., Salman, A., and Mehadi, M. R. (2016). Energy consumption, energy saving and emission reduction of a garment industrial building in Bangladesh. Energy 112, 91–100. doi:10.1016/J.ENERGY.2016.06.062
Hao, Y., Wang, Y., Wu, Q., Sun, S., Wang, W., and Cui, M. (2020). What affects residents’ participation in the circular economy for sustainable development? Evidence from China. Sustain. Dev. 28 (5), 1251–1268. doi:10.1002/sd.2074
Hasan, A. S. M. M., Rokonuzzaman, M., Tuhin, R. A., Salimullah, S. M., Ullah, M., Sakib, H., et al. (2019). TDrivers and barriers to industrial energy efficiency in textile industries of Bangladesh. Energies 12 (9), 1775. doi:10.3390/en12091775
Hasanbeigi, A., Hasanabadi, A., and Abdorrazaghi, M. (2012). Comparison analysis of energy intensity for five major sub-sectors of the Textile Industry in Iran. J. Clean. Prod. 23 (1), 186–194. doi:10.1016/J.JCLEPRO.2011.10.037
Hayat, N., Hussain, A., and Lohano, H. D. (2020). Eco-labeling and sustainability: A case of textile industry in Pakistan. J. Clean. Prod. 252, 119807. doi:10.1016/j.jclepro.2019.119807
Hong, G. B., Su, T. L., Lee, J. D., Hsu, T. C., and Chen, H. W. (2010). Energy conservation potential in Taiwanese textile industry. Energy Policy 38 (11), 7048–7053. doi:10.1016/J.ENPOL.2010.07.024
Hussain, T., and Wahab, A. (2018). A critical review of the current water conservation practices in textile wet processing. J. Clean. Prod. 198, 806–819. doi:10.1016/J.JCLEPRO.2018.07.051
Ikram, M., Ferasso, M., Sroufe, R., and Zhang, Q. (2021). Assessing green technology indicators for cleaner production and sustainable investments in a developing country context. J. Clean. Prod. 322, 129090. doi:10.1016/J.JCLEPRO.2021.129090
Ikram, M. (2022). Transition toward green economy: Technological Innovation’s role in the fashion industry. Curr. Opin. Green Sustain. Chem. 37, 100657. doi:10.1016/J.COGSC.2022.100657
Ikram, M., Zhang, Q., Sroufe, R., and Shah, S. Z. A. (2020). Towards a sustainable environment: The nexus between ISO 14001, renewable energy consumption, access to electricity, agriculture and CO2 emissions in SAARC countries. Sustain. Prod. Consum. 22, 218–230. doi:10.1016/J.SPC.2020.03.011
IPPC (2003). Reference document on best available techniques in the large volume organic chemical industry february 2003, 1. Integrated Pollution Prevention and Control IPPC, 267–289.
Irfan, M., Elavarasan, R. M., Ahmad, M., Mohsin, M., Dagar, V., and Hao, Y. (2022). Prioritizing and overcoming biomass energy barriers: Application of AHP and G-TOPSIS approaches. Technol. Forecast. Soc. Change 177, 121524. doi:10.1016/J.TECHFORE.2022.121524
Ji, K., Magnus, J. R., and Wang, W. (2014). Natural resources, institutional quality, and economic growth in China. Environ. Resour. Econ. (Dordr). 57 (3), 323–343. doi:10.1007/s10640-013-9673-8
Jiang, W., Yuan, Z., Bi, J., and Sun, L. (2010). Conserving water by optimizing production schedules in the dyeing industry. J. Clean. Prod. 18 (16–17), 1696–1702. doi:10.1016/J.JCLEPRO.2010.07.004
Kalenoja, H., Kallionpää, E., and Rantala, J. (2011). Indicators of energy efficiency of supply chains. Int. J. Logist. Res. Appl. 14 (2), 77–95. doi:10.1080/13675567.2010.551111
Kant, R. (2011). Textile dyeing industry an environmental hazard. Nat. Sci. 4, 22–26. doi:10.4236/ns.2012.41004
Kar, A. A., Keane, S. E., and Greer, L. (2012). Best practices for textile mills to save money and reduce pollution, Bangladesh: A practical guide for responsible sourcing. Dhaka: Natural Resources Defense Council (NRDC), 1–27. Available at: https://www.nrdc.org/file/2936/download?token=11LNQ3Ua.
Khan, I., Zakari, A., Zhang, J., Dagar, V., and Singh, S. (2022). A study of trilemma energy balance, clean energy transitions, and economic expansion in the midst of environmental sustainability: New insights from three trilemma leadership. Energy 248, 123619. doi:10.1016/J.ENERGY.2022.123619
Khan, S. A. R., and Qianli, D. (2017). Impact of green supply chain management practices on firms’ performance: An empirical study from the perspective of Pakistan. Environ. Sci. Pollut. Res. 24 (20), 16829–16844. doi:10.1007/S11356-017-9172-5
Kim, G., Kang, P. G., Kim, E., and Seo, K. (2022). Application of best available techniques to remove air and water pollutants from textile dyeing and finishing in South Korea. Sustain. Switz. 14 (4), 2209. doi:10.3390/su14042209
Kirchherr, J., Reike, D., and Hekkert, M. (2017). Conceptualizing the circular economy: An analysis of 114 definitions. Resour. Conservation Recycl. 127, 221–232. doi:10.1016/j.resconrec.2017.09.005
Kocabas, A. M., Yukseler, H., Dilek, F. B., and Yetis, U. (2009). Adoption of European Union’s IPPC Directive to a textile mill: Analysis of water and energy consumption. J. Environ. Manag. 91 (1), 102–113. doi:10.1016/J.JENVMAN.2009.07.012
Leipold, S., and Petit-Boix, A. (2018). The circular economy and the bio-based sector - perspectives of European and German stakeholders. J. Clean. Prod. 201, 1125–1137. doi:10.1016/j.jclepro.2018.08.019
Lemire, J. ‐M. (1977). Program design guidelines. Can. Public Admin. 20 (4), 666–678. doi:10.1111/j.1754-7121.1977.tb01742.x
Lindholm, H., Egels-Zandén, N., and Rudén, C. (2016). Do code of conduct audits improve chemical safety in garment factories? Lessons on corporate social responsibility in the supply chain from fair wear foundation. Int. J. Occup. Environ. Health 22 (4), 283–291. doi:10.1080/10773525.2016.1227036
Luttenberger, L. R. (2020). Waste management challenges in transition to circular economy – case of Croatia. J. Clean. Prod. 256, 120495. doi:10.1016/j.jclepro.2020.120495
Lyu, Y., Liu, Y., Guo, Y., Tian, J., and Chen, L. (2021). Managing water sustainability in textile industry through adaptive multiple stakeholder collaboration. Water Res. 205, 117655. doi:10.1016/j.watres.2021.117655
Madhav, S., Ahamad, A., Singh, P., and Mishra, P. K. (2018). A review of textile industry: Wet processing, environmental impacts, and effluent treatment methods. Environ. Qual. Manag. 27 (3), 31–41. doi:10.1002/tqem.21538
Mahamud, R., Li, W., and Kara, S. (2017). Energy characterisation and benchmarking of factories. CIRP Ann. 66 (1), 457–460. doi:10.1016/J.CIRP.2017.04.010
Marchi, B., Zanoni, S., Ferretti, I., and Zavanella, L. (2018). Stimulating investments in energy efficiency through supply chain integration. Energies 11 (4), 858. doi:10.3390/EN11040858
Memon, N. A. (2016). Pakistan Spinning industry rank 3rd in the field of global yarn production. Pak. Text. J. 65 (2), 50–51.
Menghi, R., Papetti, A., Germani, M., and Marconi, M. (2019). Energy efficiency of manufacturing systems: A review of energy assessment methods and tools. J. Clean. Prod. 240, 118276. doi:10.1016/J.JCLEPRO.2019.118276
Michelini, G., Moraes, R. N., Cunha, R. N., Costa, J. M., and Ometto, A. R. (2017). From linear to circular economy: PSS conducting the transition. Procedia CIRP 64, 2–6. doi:10.1016/j.procir.2017.03.012
Mughees, W., and Al-Ahmad, M. (2015). Application of water pinch technology in minimization of water consumption at a refinery. Comput. Chem. Eng. 73, 34–42. doi:10.1016/j.compchemeng.2014.11.004
Niinimäki, K., Peters, G., Dahlbo, H., Perry, P., Rissanen, T., and Gwilt, A. (2020). The environmental price of fast fashion. Nat. Rev. Earth Environ. 1 (4), 189–200. doi:10.1038/s43017-020-0039-9
Nimkar, U. (2018). Sustainable chemistry: A solution to the textile industry in a developing world. Curr. Opin. Green Sustain. Chem. 9, 13–17. doi:10.1016/J.COGSC.2017.11.002
OECD Publishing (2005). The fourth industrial revolution and the future of work : Implications for asian development cooperation. NSejong-si, Korea: The Asia Foundation.
Oelze, N. (2017). Sustainable supply chain management implementation-enablers and barriers in the textile industry. Sustain. Switz. 9 (8), 1435. doi:10.3390/su9081435
Ortolano, L., Sanchez-Triana, E., Afzal, J., Ali, C. L., and Rebellon, S. A. (2014). Cleaner production in Pakistan’s leather and textile sectors. J. Clean. Prod. 68, 121–129. doi:10.1016/j.jclepro.2014.01.015
Ozturk, E., Cinperi, N. C., and Kitis, M. (2020). Improving energy efficiency using the most appropriate techniques in an integrated woolen textile facility. J. Clean. Prod. 254, 120145. doi:10.1016/J.JCLEPRO.2020.120145
Ozturk, E., Karaboyaci, M., Yetis, U., Yigit, N. O., and Kitis, M. (2015). Evaluation of Integrated Pollution Prevention Control in a textile fiber production and dyeing mill. J. Clean. Prod. 88, 116–124. doi:10.1016/J.JCLEPRO.2014.04.064
Ozturk, E., Koseoglu, H., Karaboyaci, M., Yigit, N. O., Yetis, U., and Kitis, M. (2016). Minimization of water and chemical use in a cotton/polyester fabric dyeing textile mill. J. Clean. Prod. 130, 92–102. doi:10.1016/j.jclepro.2016.01.080
Ozturk, H. K. (2005). Energy usage and cost in textile industry: A case study for Turkey. Energy 30 (13), 2424–2446. doi:10.1016/J.ENERGY.2004.11.014
Palamutcu, S. (2010). Electric energy consumption in the cotton textile processing stages. Energy 35 (7), 2945–2952. doi:10.1016/J.ENERGY.2010.03.029
Parisi, M. L., Fatarella, E., Spinelli, D., Pogni, R., and Basosi, R. (2015). Environmental impact assessment of an eco-efficient production for coloured textiles. J. Clean. Prod. 108, 514–524. doi:10.1016/j.jclepro.2015.06.032
Peters, G., Svanström, M., Roos, S., Sandin, G., and Zamani, B. (2015). “Carbon footprints in the textile industry,” in Handbook of life cycle assessment (LCA) of textiles and clothing (Woodhead Publishing). doi:10.1016/B978-0-08-100169-1.00001-0
Ranta, V., Aarikka-Stenroos, L., Ritala, P., and Makinen, S. J. (2018). Exploring institutional drivers and barriers of the circular economy: A cross-regional comparison of China, the US, and europe. Resour. Conservation Recycl. 135, 70–82. doi:10.1016/J.RESCONREC.2017.08.017
Reddy, N., Chen, L., Zhang, Y., and Yang, Y. (2014). Reducing environmental pollution of the textile industry using keratin as alternative sizing agent to poly(vinyl alcohol). J. Clean. Prod. 65, 561–567. doi:10.1016/J.JCLEPRO.2013.09.046
Roy, M., Sen, P., and Pal, P. (2020). An integrated green management model to improve environmental performance of textile industry towards sustainability. J. Clean. Prod. 271, 122656. doi:10.1016/J.JCLEPRO.2020.122656
Sankar, B. S., and Raman, S. (2020). A novel approach for the formulation of Modified Water Quality Index and its application for groundwater quality appraisal and grading. Hum. Ecol. Risk Assess. an Int. J. 26 (10), 2812–2823. doi:10.1080/10807039.2019.1688638
Sassanelli, C., Rosa, P., Rocca, R., and Terzi, S. (2019). Circular economy performance assessment methods: A systematic literature review. J. Clean. Prod. 229, 440–453. doi:10.1016/J.JCLEPRO.2019.05.019
Saygin, D., Worrell, E., Patel, M., and Gielen, D. (2011). Benchmarking the energy use of energy-intensive industries in industrialized and in developing countries. Energy 36 (11), 6661–6673. doi:10.1016/J.ENERGY.2011.08.025
Schulze, M., Nehler, H., Ottosson, M., and Thollander, P. (2016). Energy management in industry – A systematic review of previous findings and an integrative conceptual framework. J. Clean. Prod. 112, 3692–3708. doi:10.1016/J.JCLEPRO.2015.06.060
Shen, B., and Li, Q. (2019). Green technology adoption in textile supply chains with environmental taxes: Production, pricing, and competition. IFAC-PapersOnLine 52 (13), 379–384. doi:10.1016/j.ifacol.2019.11.153
Shen, B., Price, L., and Lu, H. (2012). Energy audit practices in China: National and local experiences and issues. Energy Policy 46, 346–358. doi:10.1016/J.ENPOL.2012.03.069
Sikander, M., Kumar, L., Naqvi, S. A., Arshad, M., and Jabeen, S. (2021). Sustainable practices for reduction of environmental footprint in tanneries of Pakistan. Case Stud. Chem. Environ. Eng. 4, 100161. doi:10.1016/j.cscee.2021.100161
Sivaramakrishnan, C. N. (2011). Water conservation in textile processing. Colourage 58 (9), 50–52. doi:10.1016/b978-0-08-102633-5.00008-7
Stawicki, B., Lozo, B., and Lajić, B. (2010). Energy management guidelines in pulp and paper production. Cellul. Chem. Technol. 44 (10), 521–529. Available at: https://www.cellulosechemtechnol.ro/pdf/CCT10(2010)/p.521-529.pdf (Accessed May 30, 2022).
Taddei, E., Sassanelli, C., Rosa, P., and Terzi, S. (2022). Circular supply chains in the era of industry 4.0: A systematic literature review. Comput. Industrial Eng. 170, 108268. doi:10.1016/J.CIE.2022.108268
Tang, C., Irfan, M., Razzaq, A., and Dagar, V. (2022). Natural resources and financial development: Role of business regulations in testing the resource-curse hypothesis in ASEAN countries. Resour. Policy 76, 102612. doi:10.1016/J.RESOURPOL.2022.102612
Tsai, H. T., Ho, T. H., and Wang, C. N. (2020). “Productivity evaluation of Asia textile industry,” in IEEE International Conference on Industrial Engineering and Engineering Management. Piscataway, NJ, United States: IEEE, 620–624. doi:10.1109/IEEM45057.2020.9309933
Uddin, F. (2021). Environmental hazard in textile dyeing wastewater from local textile industry. Cellulose 4, 10715–10739. doi:10.1007/s10570-021-04228-4
UNIDO/UNEP (2008). Cleaner production Programme. Austria : United Nations Industrial Development Organization, 236.
Vinante, C., Sacco, P., Orzes, G., and Borgianni, Y. (2021). Circular economy metrics: Literature review and company-level classification framework. J. Clean. Prod. 288 (125090), 125090. doi:10.1016/j.jclepro.2020.125090
Visvanathan, C., Kumar, S., Priambodo, A., and Vigneswaran, A. S. (1999). Energy and environmental indicators in the Thai textile. Hong Kong, China: Sustainable Energy and Environmental Technologies. Available at: https://www.researchgate.net/publication/228600891 (Accessed: May 30, 2022). doi:10.1142/9789812791924_0094
Wadanambi, R. T., Wandana, L. S., Chathumini, K. K. G. L., Dassanayake, N. P., Preethika, D. D. P., and Arachchige, U. S. P. R. (2020). The effects of industrialization on climate change. J. Res. Technol. Eng. 1, 86.
Xu, C. K., Cheng, H., and Liao, Z. J. (2018). Towards sustainable growth in the textile industry: A case study of environmental policy in China. Pol. J. Environ. Stud. 27 (5), 2325–2336. doi:10.15244/pjoes/79720
Keywords: sustainable development, textile, cleaner production (CP), SEMPs, SMEs
Citation: Kumar L, Kamil I, Ahmad M, Naqvi SA, Deitch MJ, Amjad AQ, Kumar A, Basheer S, Arshad M and Sassanelli C (2022) In-house resource efficiency improvements supplementing the end of pipe treatments in textile SMEs under a circular economy fashion. Front. Environ. Sci. 10:1002319. doi: 10.3389/fenvs.2022.1002319
Received: 25 July 2022; Accepted: 15 August 2022;
Published: 16 September 2022.
Edited by:
Muhammad Ikram, Al Akhawayn University, MoroccoReviewed by:
Abdul Qayyum, University of Sargodha, PakistanBarkha Vaish, Institute of Environment and Sustainable Development, Banaras Hindu University, India
Nabila Abid, Università degli Studi G. d’Annunzio Chieti e Pescara, Italy
Copyright © 2022 Kumar, Kamil, Ahmad, Naqvi, Deitch, Amjad, Kumar, Basheer, Arshad and Sassanelli. This is an open-access article distributed under the terms of the Creative Commons Attribution License (CC BY). The use, distribution or reproduction in other forums is permitted, provided the original author(s) and the copyright owner(s) are credited and that the original publication in this journal is cited, in accordance with accepted academic practice. No use, distribution or reproduction is permitted which does not comply with these terms.
*Correspondence: Love Kumar, bG92ZWt1bWFyQHVmbC5lZHU=