 Narongsak Sukma
 Adisorn Leelasantitham
- Technology of Information System Management Division, Faculty of Engineering, Mahidol University, Nakhonpathom, Thailand
Businesses must do more than safeguard their financial interests to survive in today’s market. Sustainability, or long-term viability, requires consideration of society, the environment, and the global community. However, community-based businesses cannot use some of the current components of the sustainable business framework because they were created for large corporations. Both quantitative and qualitative approaches are used in this study. First, quantitative methods were used to develop a conceptual model for the organization’s current needs using the PPT, the TOE, and an Expectation Confirmation Theory (ECT). A simple random sampling method was used to gather the data, with a sample size of 14 villages. Using a five-point Likert scale, the researcher gathered data from 2,584 households and collected 627 valid responses. After that, descriptive statistics were used to describe the data (frequency distributions, percentages, averages, medians, and standard deviations), and PLS-SEM was used to investigate the interactions between variables and launch the conceptual model using partial least squares (PLS) path modeling. First and foremost, qualitative through Interactive Qualitative Analysis (IQA). There are two ways to create a congested SID and an uncluttered SID: the Affinity Relationship Table (ART), the mapping of the Inter-Relationship Diagram (IRD), and the system influence diagram. According to the study, sustainable community water supply businesses are the primary driver. The conceptual framework presented in this paper is consistent with the results of the combination of quantitative and qualitative methods and the current constraints placed on community water supply businesses to thrive.
1 Introduction
The United Nations has established 17 Sustainable Development Goals (SDGs) to resolve global issues such as poverty, inequality, climate change, and peace. By 2030, these objectives call for efforts to eradicate poverty, protect the environment, and provide universal peace and prosperity (Sachs et al., 2022). The sustainable development objectives provide specific rules and targets that all nations must adhere to in order to meet their development aspirations. We should make wise decisions to better future generations’ lives. Sustainable development goals, or “sustainable development objectives,” are balanced advancements in the three pillars of sustainability: social, economic, and environmental. The study by (Sinha et al., 2021) has shed more light on 17 sustainability objectives in all, which may be classified into five categories: Social (people), economic (prosperity), environmental (planet), peace and institutions (peace), and development partnerships (Partnership). These SDGs take into account the environment, society and good governance. Examines how the actions of each firm or organization may have a beneficial effect on the economy, society, and environment. This is the world’s long-term sustainability from the perspective of business (Edeigba and Arasanmi, 2022). provides a detailed analysis of the “triple bottom line.” Business is more than profit; we must consider people, profit, and the environment. Profitability is a must. Our world is still viable. Therefore, if we see a pattern here and begin prioritizing sustainability, we can justify it in the long term by looking back on our organization and the work we are now performing. Therefore, the triple bottom line applies to people, profit, and the environment (Lee et al., 2020). This is readily apparent when you work with us. Will the riches he earns enable him to fend for himself? What can we do to ensure the happiness of our citizens? Numerous firms may believe raising employee compensation will reduce the organization’s revenue. However, we may need to consider the long-term implications. If only he could take care of himself properly. Additionally, society as a whole will improve.
Also, technology management and sustainability are processes before using technology to grow the business. We saw the inherent difficulty in getting things done. In their widely acclaimed work (El Baz et al., 2022) discuss everything is accelerated by technology. It may be enhanced with the use of technology. We must begin to integrate technology to expand the company. We recognize the true nature of the issue while attempting to resolve it. Because if anyone comprehends this section, we may avoid the need for technology to capture it. Initially, attempt to resolve the issue manually. And then, we will look at how we might combine technology to help it expand even further. Trust is a necessary component of a stable organization. Of course, “profit” is necessary for an organization’s ability to operate. However, the profit motive is such that a company would use whatever means necessary to implement it. In the past, we may have been familiar with the tendency to spend money on corporate social responsibility (CSR) operations to boost an organization’s elegant image (Dimitropoulos, 2022). However, as technology advances, civilization has shrunk. If any group causes personal problems, it might instantly become global news. It will eventually affect the organization’s image (Alkaraan et al., 2022).
Further, the SDGs and Thailand, published by (Sachs et al., 2022), have shed more light on sustainable development and Thailand (see Figure 1). The Sustainable Development Report 2022 published the SDG Index rating report in June 2022, in which 163 nations were ranked. Thailand was subsequently ranked 44th in the world. Thailand achieved an overall average score of 74.1. However, there is a slight decline from 2021 (Sachs et al., 2021), when Thailand obtained an evaluation score of 74.2. However, due to COVID-19, global poverty and unemployment rates have increased. Similarly, numerous nations are ranked poorly. However, Thailand still faces substantial obstacles to reaching the following targets (red status): SDG 2: “zero hunger”, SDG 3 stands for “good health and well-being”, while SDG 14 stands for “Life below water”. SDG 15 stands for “Life on Land,” and SDG 16 stands for “Peace, Justice, and Strong Institutions.”
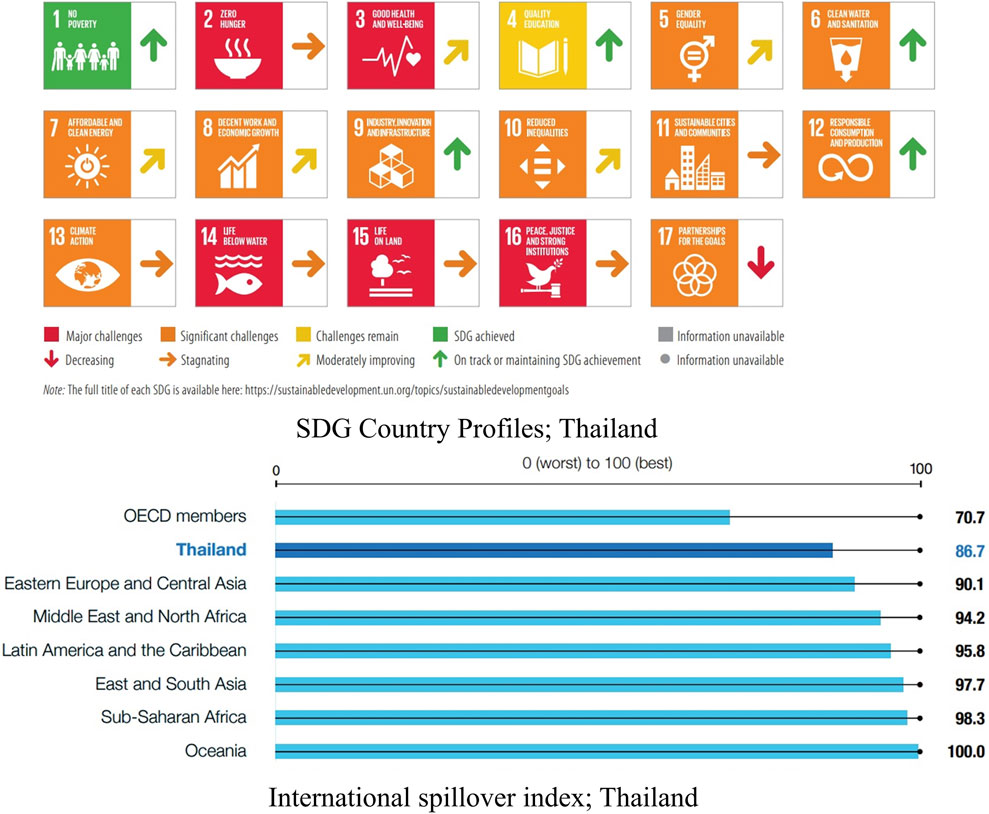
FIGURE 1. SDG Country Profiles and International spillover index; Thailand, sourced (Sachs et al., 2022).
In addition, many individuals demanded the “sincerity” of the corporate sector’s activities. We are primarily concerned with business and social and environmental growth. This procedure is intended to satisfy all parties. Because if a company is not concerned with society or the environment, it will also lose public support. Running a company has several difficulties. As a result, organizations must continually adapt and improve in order to survive and expand stably and sustainably. Thus, the work of both (Lichtenthaler, 2022) and (Chillakuri and Vanka, 2022) focused on developing an organization toward sustainability is a “critical concern” that every firm must consider and address. Depending on the organization’s context, this factor may be accomplished in various ways. Furthermore, no previous sustainable business framework has examined a sustainable commercial strategy for water supply. Also, just a handful of original research studies present conceptual models in the community water supply that have significant outcomes (Sukma and Leelasantitham, 2022a; Sukma and Leelasantitham, 2022b; Sukma and Leelasantitham, 2022c; Sukma and Leelasantitham, 2022d). There are attempts to discover the relationship between governance, social networks, transparency, stakeholders, value creation, value proposition, and value capture in the community water supply that must be developed from the conceptual model to the conceptual framework level to complete the investigation. Moreover, Consistency over the long run is what sustainability means in business practice. Every organization that aspires to become sustainable must have a long-term vision that creates the foundation for its development. A solid foundation is required for sustainable growth. There is a long-term plan that not only promotes the organization’s growth and advancement but also incorporates concern for society and the environment. Organizations that must plan for long-term growth should consider several crucial criteria.
Besides, firms seeking long-term sustainability may not perceive a clear long-term corporate picture if these elements are ignored. It may also lead to company failure, which is the objective of this study. Consequently, the following research question is posed:
RQ1: What factors should be considered in sustainable organizations’ sustainable community water supply business framework?
RQ2: How can the Sustainable Community Water Supply Business Framework be supported to organize for sustainability success?
We sifted through previously published research and our study’s theoretical or framework foundation to find the proper solution based on the research question. Following this, the proposed Quantitative and Qualitative research is described. We experimented with validating the validity of both the quantitative by variance-based structural equation modeling (SEM) utilizing the partial least squares (PLS) path modeling method and the qualitative with IQA qualitative study by analyzing and making decisions based on the results. Finally, we look at how the results of our study contribute to a conceptual framework and how we can learn more about how local businesses and entrepreneurs operate as sustainable community businesses.
2 Theoretical background
2.1 Original research and initiative conceptual models in community water supply
This study explores, for the first time (Sukma and Leelasantitham, 2022b), which results are consistent, and examines the people’s participation through online forms and utilizing current technology to serve the people. It is a model that improves coordination and efficiency in the community. Furthermore (Sukma and Leelasantitham, 2022c), continue to investigate when the water user community will expand the capacity and satisfy expectations for services in the public sector via the e-government model. The public is more impressed with government services. In addition, the framework encourages transparent and verifiable work at each stage. Their groundbreaking paper leads to constructing a sustainable business model that considers the essential aspects that will impact the local economy and encourage participation. These results suggest that each business model for community water delivery has advantages and disadvantages within each group.
However, it is indisputable that running a successful corporate organization requires implementing concrete transparency methods and rules to earn respect and trust of all parties involved and, most importantly, the people receiving the online service (Sukma and Leelasantitham, 2022d). In general, the results (Sukma and Leelasantitham, 2022a) contribute to our understanding that participation in the community’s water supply has been found to overcome ethical concerns through technology, governance, and transparency available in modern social networks. All of the earlier research is still present in conceptual model-level research studies. To facilitate the transfer of theory to practice, this study has integrated all relevant research and offered it as a conceptual framework. There must be a set of essential guidelines for those interested in learning how to use it more simply.
2.2 Expectation confirmation theory (ECT)
(Oliver, 1980) established the ECT theory to investigate post-purchase behaviors such as repeat purchases, complaints, and service marketing. It is often used in market research to assert that customers will form expectations before purchasing a product and will develop knowledge of the product’s actual effectiveness after usage. If the expectation is fulfilled, the condition is satisfied. If an expectation is not met, it will remain unfilled. ECT theory is often utilized to extract meaning and create predictions. As shown by (Anderson and Sullivan, 1993), consumers are satisfied and want to buy again. Repeat purchase intent is determined by past satisfaction. Consumer satisfaction is considered critical to establishing and maintaining long-term customer loyalty. This idea was very predictable (Oliver, 1993). Shows that individuals repurchase a variety of different goods and services. These include the purchase of a multi-cycle automobile, acquiring a video camera, and managing the restaurant for future usage by customers (Swan and Trawick, 1981).
Furthermore, it refers to expectations as a factor in customer satisfaction choices because service expectations determine how long customers will consider a product or service before repurchasing it (Bhattacherjee, 2001a). ECT outlines a product’s or service’s repurchase expectation and its confirmation or denial depending on the product’s or service’s performance, which may affect customer satisfaction (Islam, 2014).
2.3 People, process, technology, and TOE framework
The PPT framework is entirely based on how the three components interact. The people do the jobs. The work is made more effective through the use of processes. The study by (Sunmola and Javahernia, 2021) has shed more light on the PPT framework. Implementing any process innovation is pointless if people, processes, technologies, and usage contexts are ignored or undervalued. It not only assists humans in completing their work but also in automating operations. Therefore, companies can attain organizational efficiency by balancing the three and improving the linkages between people, processes, and technology (Soja and Soja, 2017). Consider the structure as if it were a table with three legs; this is a practical approach to thinking about it. The table’s stability as a whole will be compromised if even one of the legs is slightly altered in length. In the same vein, as technology advances will need to adapt people and processes to make room for the new tools.
Also, many companies, for example, try to solve their problems by implementing cutting-edge technology and sophisticated tools. However, the effectiveness of technology is directly proportional to the procedures that use it and the people who manage it. The actions of an organization’s personnel are likely to be very ineffective if the organization does not create robust processes (Awa and Ojiabo, 2016). provides a detailed analysis of the T-O-E framework, which will also discard a significant portion of the value created through technology. If employees cannot use technology appropriately, the business will not derive any value from its investment in technological advancement. If the new technology is not successfully integrated into the procedures, the results will be the same.
On the other hand, if the company is too preoccupied with the process, it can end up with a solid strategy on paper. However, it will not have the appropriate personnel or the necessary technology to put it into action. Therefore, companies must establish the optimal balance between these three essential components to be successful.
2.4 The sustainable business framework
To enable businesses to operate following the principles of sustainable development. Studying and comprehending the organizational context is a standard part of any business procedure (Altieri, 2004). Similar to (Awan et al., 2022) report on Businesses must first and foremost comprehend the organization’s context, or “identity,” which can be studied and analyzed using the vision, mission, and corporate culture value chain; business strategy; business risks and opportunities; and the industry’s direction and trend (Bocken et al., 2019). These principles will help the organization to understand its context. This report results in stakeholder analysis and sustainability issues that businesses should prioritize and effectively manage to assist the business in achieving robust long-term growth (Reinhardt et al., 2020). In addition to analyzing the organizational context, companies should also identify stakeholders and analyze the relationship between the company and its stakeholders along the business value chain. Throughout the value chain, the business should be able to identify which stakeholder groups are involved. Each stakeholder group, both direct and indirect, can be prioritized. Then, analyze the issues that affect both stakeholders and businesses because a business should be able to assess both the positive and negative impacts that stakeholders have on the business and the impact the business has on stakeholders (Evans et al., 2017). Demonstrate the business relationship with its stakeholders. Who was responsible, and who was affected? What are the positive or negative repercussions, and what areas are addressed? Businesses should implement measures to increase their positive impact and decrease their negative impact. Maintaining competitiveness and cultivating the potential for long-term business growth will enable businesses to address impact issues, such as crucial sustainability issues, and prioritize each issue (López-Concepción et al., 2022). In addition, companies should establish written policies and objectives for corporate sustainability and communicate them to stakeholders.
2.5 Risk management and sustainable development goals
Sustainable development goals (SDGs) require a comprehensive understanding of risk management. Each SDG goal and pathway can have unintended and unplanned adverse side effects. Considering these limitations (Vagin et al., 2022), manage to provide. Suppose goals are not managed collectively and holistically. In that case, potential adverse effects include increased material and energy consumption due to the more efficient reflection effect, more technology, loss of biodiversity, and chemical risks associated with more efficient technology. These unintended effects will have far-reaching socioeconomic implications that cannot be evaluated without proper risk management for each potential error, i.e., damage, leaks, waste, or unfavorable events. Also, Prevent the work from achieving its objectives and goals or risk, which is the uncertainty that arises and impacts the achievement of the desired objectives and goals (Ullah et al., 2021). The absolute risk associated with the SDGs is the failure to achieve them or the lack of progress in their direction then. Goal tracking is difficult in itself, and poor metrics. Then can exacerbate the difficulty. This task will degrade performance or even causes the target tracking to fail. Even precise and efficient tracking will be ineffective if it does not contribute to business decisions and actions. However, the risk of not achieving the SDG can be mitigated through proper risk management through the board of management process that minimizes the probability of a risk event occurring to an acceptable level (Adams, 2017). As part of the management’s need to focus on implementing the policies, they must be carefully put into action and reported on right away to achieve the SDGs (Abhayawansa et al., 2021).
3 Research methodology
This study combines quantitative and qualitative methods using a mixed research methodology. First, quantitative research with an information questionnaire was gathered, then data analysis with SEM, Secondary, qualitative research, and then data analysis by IQA process. Figure 2 shows the flow diagrams of the research methodology processes as follows.
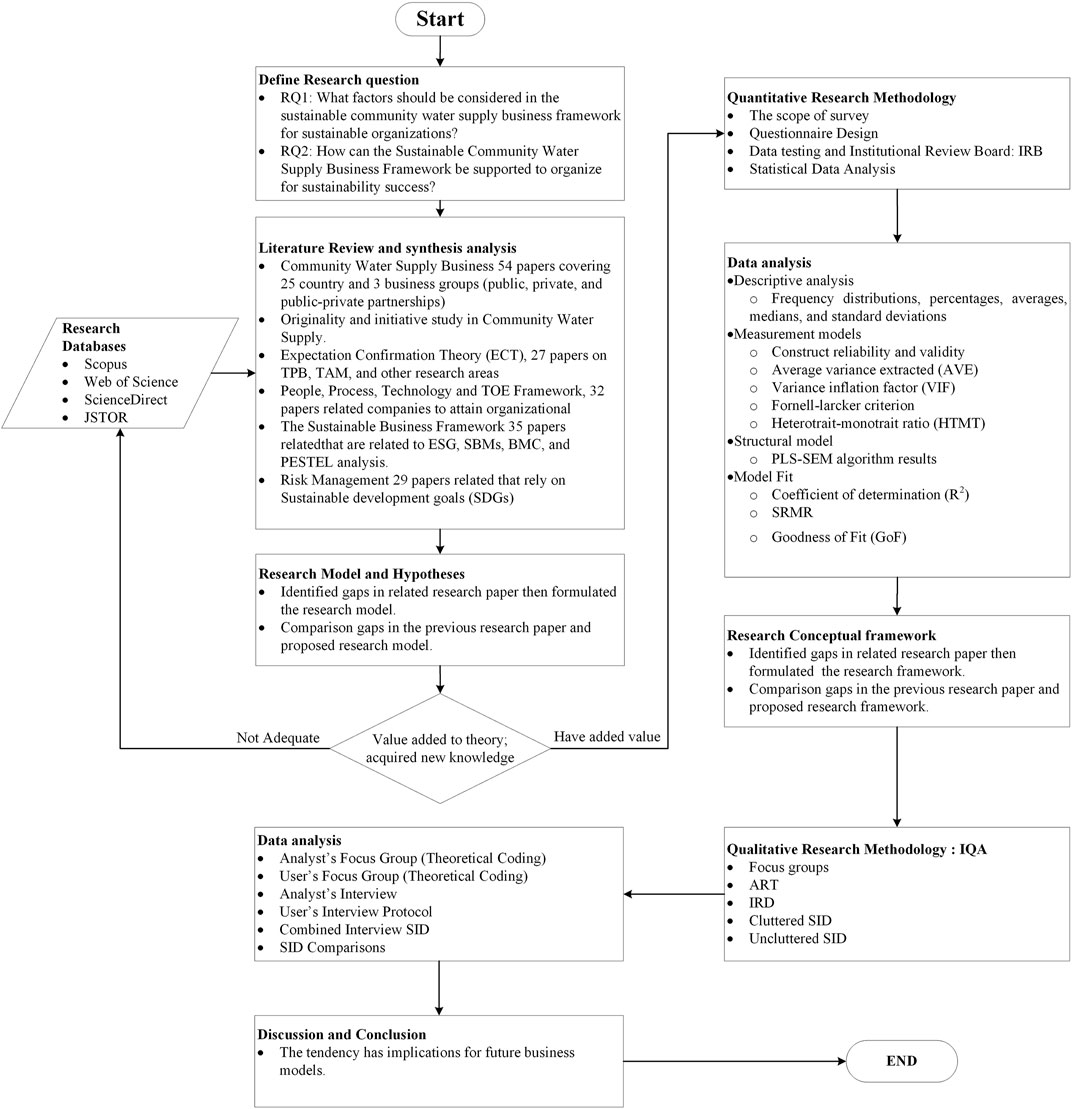
FIGURE 2. Flowcharts of quantitative and qualitative research methodology processes.
3.1 The scope of survey
By 2021, 80% of Nakhon Phanom’s population will rely on the community water supply. In addition, the research found that the Provincial Waterworks does not supply the water utilized for domestic purposes in the Phanom district. This study used simple random sampling (14 villages, 2,584 households). All participants had lived in the study area for at least a year. Each household consumes water from the community water supply system (100%).
3.2 Questionnaire design
The questionnaire had 24 questions, each drawn from the relevance and reworked into eight constructs afterward. These instructions were delivered to each household individually. The questionnaire instructions explain that participants should be returned to a return box placed in an easily accessible spot, such as the multipurpose building used by the town. Using the Taro Yamane formula allowed the determination of the appropriate number of samples to be collected. It took into account 2,584 residential locations in addition to the acceptable margin of error, e =.05. According to specific estimations, the number of respondents that should have been included in the sample should have been 347, which is the amount that was necessary to gather data for this study, we collected sufficient data to move on to the next level thanks to the incredible participation of the communities. The researcher received 627 responses, 180 percent of the required number. Also, This data provided the researchers with enough data to evaluate the model and the research hypothesis. There is support for the hypotheses produced for the research model in the form of quantitative evidence.
3.3 Statistical data analysis
The questionnaire responses were imported and cleaned in preparation for the subsequent structural equation modeling (SEM) study. SmartPLS 3.3.0 software will perform partial least squares structural equation modeling (PLS-SEM) (Ringle, 2015), containing the measurement model, the fit to the structural model, and the model. Descriptive and inferential statistical analyses will be studied and discussed in the last phase of the investigation. This stage follows the previous step of collecting, processing, and analyzing questionnaire data. The data will then be easier to understand and more detailed. To verify the reliability and validity of the research model and questionnaire, we analyzed some of the most acquired miniature square data sets with SmartPLS. This approach was chosen for this investigation specifically because it is an element-based statistical tool for the development of causal models and has the potential to be applied to the current study topics. By comparing measurement data and structural models in a single phase of analysis, PLS is a method for modeling structural equations that saves time and effort (Tenenhaus et al., 2005). PLS is also known as the method of partial least squares. We chose PLS over covariance-based SEM approaches such as LISREL because it requires a lower sample size and indicator distribution and yield more accurate estimates (Hair et al., 2014; Hair et al., 2019; Hair Jr et al., 2021). A two-stage iterative data analysis approach is utilized to explore reliability and validity. In the procedure’s initial phase, the measurement model’s reliability and validity are examined. The structural model is then evaluated to determine whether it can represent a hypothetical connection as precisely as possible.
4 Quantitative research model and hypotheses
As previously mentioned, every organization that wishes to become sustainable must have a long-term vision that serves as the basis for its growth. For sustained expansion, a firm foundation is essential. There is a long-term strategy that not only encourages the growth and development of the business but also integrates consideration for society and the environment. Companies planning for long-term growth should evaluate several essential criteria and analyze which variables the sustainable community water supply business framework for sustainable organizations should consider. Then, the study model created to analyze a sustainable community business model through the lens of PPE, TOE, and ECT comprises eight components (People, Processes, Technology, Environment, Perceived Usefulness, Expectations, Satisfaction, and Continued Intention). This study will evaluate 13 hypotheses from a literature review as indicated in the research question. See Figure 3.
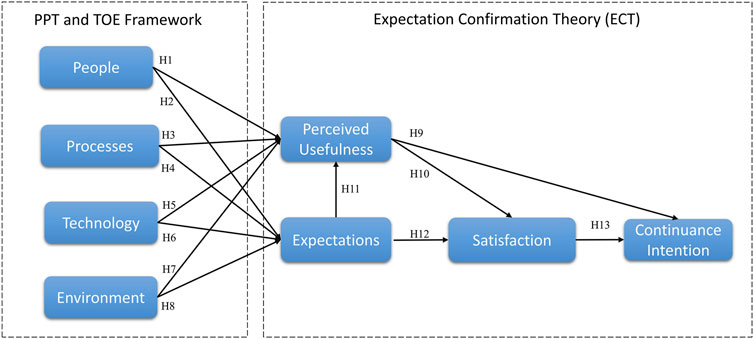
FIGURE 3. The Quantitative research model.
4.1 People, process, technology
People context elements may be formulated from any vantage point, such as experience, contingency, knowledge-based, and leadership. All elements mentioned above may be described in terms of human behavior, which is associated with IT project success, IT System Quality, and Organizational Performance. Consequently, In their carefully designed study (Bhatt, 2001), found it is essential to consider people. The process context factors, such as IT leverage ability and knowledge-sharing, business process redesign and improvement, training and education, project planning, and information flow management, were derived from absorptive capacity theory, organizational information processing theory, and resource dependency theory. All of the aspects mentioned above may be described in business processes, which are connected to the IT project’s success, the IT system’s quality, and the organization’s performance. Using resource-based perspective theory and diffusion of innovation theory, the technological context elements, including IT infrastructure and facilities, functionality and compatibility, data analysis and conversion, and efficient legacy enterprise systems, were constructed. All the characteristics mentioned above can be understood in terms of the technological context related to IT project Success, IT systems, and Organization Performance. Therefore, analyzing the third problem’s technical aspects that contradict the initial idea is necessary. The associated theory may be summarized as follows.
• H1-H6. People, Process, and Technology positively influences Perceived Usefulness and Expectations.
4.2 Organization and environment
The organizational context factors were derived from the Technology-organization-environment (TOE) framework, which comprises an environmental component (Awa et al., 2015), a technology element, and organizational elements in terms of management readiness for change, cultural readiness, organizational culture, clear vision, goal, and objective, organizational resources, and managing cultural change. All of the elements mentioned above may be understood in the context of the organization, which is connected to the success of the IT project, the quality of the IT system, and the organization’s effectiveness. Also, external environmental context aspects are significant yet outside the organization’s control. Using stakeholder theory, these were constructed concerning IT consultant experience and strength, consultant selection and relationship, similar partner priorities, collaborative partner support, partner trust, partner culture similarity, competitive pressure, regulatory pressure, trust of vendor process mode, trust of consultant process mode characteristics, and consultant business and technical knowledge (Bosch-Rekveldt et al., 2011). This is evident from the summary theory part of the literature review. The external environment is relevant to the IT project’s success, the IT system’s quality, and the organization’s performance. Consequently, evaluating the fifth problem’s external environmental aspects that contradict the initial idea is essential. The associated theory may be summarized as follows.
• H7, H8. Environment positively influences Perceived Usefulness and Expectations.
4.3 Perceived usefulness and expectations
It is a component of ECT and has been utilized in various research initiatives, such as those addressing online commerce and the online web’s future (Hong et al., 2017). As part of Chang et al.’s examination of the user’s continuing intention toward the on-line portal, she extended her experimental design by including playfulness (ECT). Elements such as fun, contentment, perceived utility, and customer satisfaction on users’ intent to revisit a website. Another study (Li and Liu, 2014) indicated that ECT is predominantly distributed among patients by word of mouth. The results indicated that the perceived usefulness and enjoyment of the product positively influenced the user’s desire to continue using the product in the future. The perceived utility is a crucial component of the expectation conformity hypothesis. According to (Legris et al., 2003), perceived usefulness is a stable variable when examining user behavior at both the initial and post-adoption stages. In a prior study, confirmation of expectations has been shown to significantly impact people’s views of the utility and enjoyment of products. Thus, we have the following hypotheses.
• H9, H10. Perceived Usefulness has positive influences on Satisfaction and Continuance Intention.
• H11, H12. Expectations have positive influences on Satisfaction and Continuance Intention.
4.4 Satisfaction and continuance intention
Satisfaction is an emotional consumer state that impacts a customer’s motivation linked with a particular service. A pleasant E-Participation experience increases the willingness of community water consumers to use E-Services, resulting in their long-term utilization. Consumers of community water will continue to use the E-Service if they are satisfied with it after using it before and developing a high level of confidence in it (Rahi and Ghani, 2019). According to (Bhattacherjee, 2001b), people who are satisfied with an information system are more likely to continue using it. Customer satisfaction increases the likelihood that their intrinsic interest in the service will drive them and its relevance, avoiding feelings of shame and self-worth, and by compliance with regulations and avoiding penalties. Also, activities that pique the client’s attention, such as novelty, challenge, or aesthetic importance, are referred to as “continuance intentions.” There is evidence to suggest that internal control has had a favorable influence on future objectives and conduct (Wu and Chen, 2017). Extrinsic motivation dynamics must first be understood if novel motivating behaviors are to be discovered. Extrinsic motivation is derived from something outside of oneself, such as a requirement or reward. Consumers driven by something other than themselves are more likely to continue utilizing the services. As a result, we have the following hypotheses.
H13. Satisfaction positively influences Continuation Intention.
5 Result of quantitative research
5.1 Descriptive analysis
Table 1 shows the demographic characteristics of 627 community water consumers, revealing that 42.9% of participants were male, while 57.1 percent were female. Sixty percent of the respondents were between the ages of 30 and 50. Regarding education level, roughly two-thirds of the participants had a bachelor’s degree or less. When it comes to community water consumption, nearly 61% of participants have been using community water for at least 15 years. There was a statistically adequate distribution of gender and age among each group to assess the situation in this study, which included data from people who had lived in places that had used community water since birth. There is a significant relationship between the variables that influence the research objective.
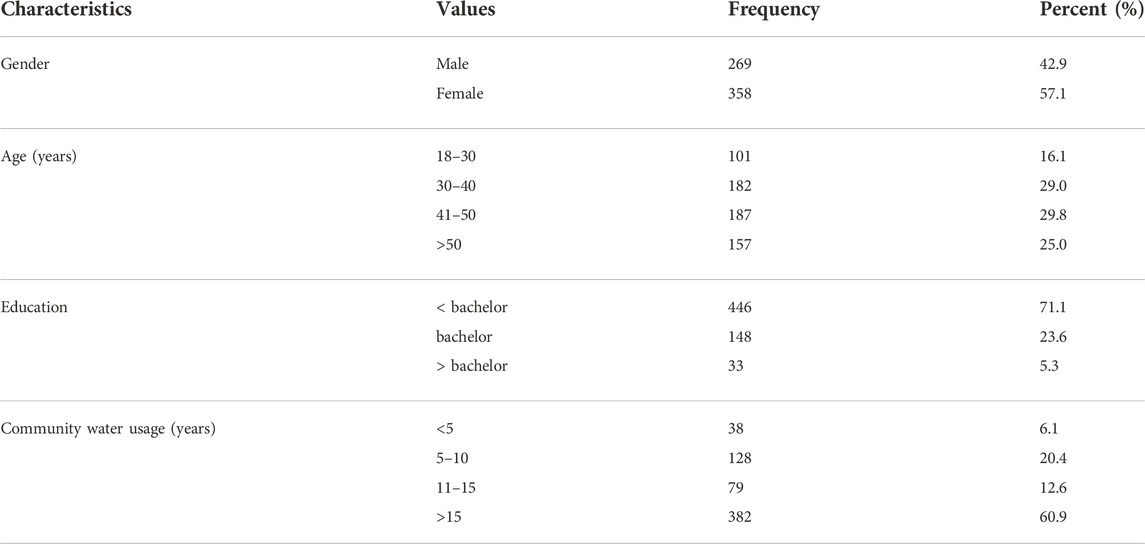
TABLE 1. Demographic data of primary testing respondents, Total (N = 627).
5.2 The measurement models
First, Cronbach’s Alpha scores for the suggested study model ranged from 0.778 to 0.820, above the acceptable threshold of 0.7 (Hair et al., 2014; Hair et al., 2019; Hair Jr et al., 2021). The model’s internal consistency testing results were used to determine composite reliability (CR), which was 0.870–0.893, over the 0.70 criterion. Additionally, all constructs with extracted average variance (AVE) have convergent validity greater than 0.50, and the model output produced AVE values between 0.691 and 0.737. Table 2 provides details. Table 3 gives information on the validity and reliability of answer items, including median, mean, standard deviation, loading, and variance inflation factor (VIF). Twenty-four open-ended questions in the two segments comprise general and model-specific questions that show each Cronbach’s alpha is above 0.7. Furthermore, the mean, standard deviation is 3.829–4.155. Table 3 shows that factor loading values from 0.783 to 0.881 are more than 0.70. Outside VIF scores range from 1.523 to 2.163, with a criterion of less than 5. All predictive factors with an association coefficient below 5 are valid. In this study, no predictor variable was multicollinear. Second, the model’s discriminant validity was also evaluated (Fornell and Larcker, 1981). Each diagonal value in a construct must be at least 0.70 more than the column total. That is, the Fornell-Larcker criterion of continuity intention (CI) value is 0.838 as a higher square root of AVE than the other components (0.691–0.737). Table 4 summarizes Fornell-Larcker’s findings. As a criterion for assessing latent variable associations, discriminant validity testing is widely used. The Fornell-Larcker criterion and cross-loading analysis are used to show discriminant validity. Table 4 demonstrates another technique for using the multitrait-multimethod matrix. In addition, we offer an alternative strategy based on the multi-trait multi-method matrix, sometimes referred to as the “Heterotrait-Monotrait ratio (HTMT)” in Table 4. The term “HTMT” refers to the sum of all indicators’ cross-variable correlations. As proposed by (Henseler et al., 2015), a value of less than 0.85 should be established for HTMTAll requirements to be met based on Tables 2–4, proving discriminant validity.
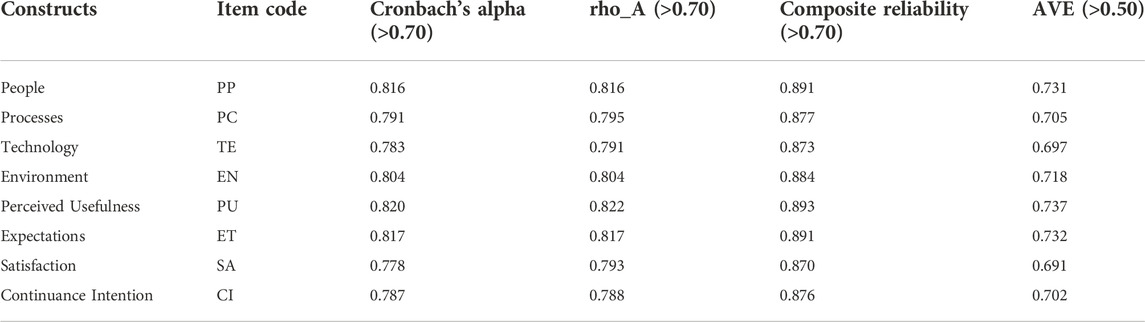
TABLE 2. Establish the reliability and validity.
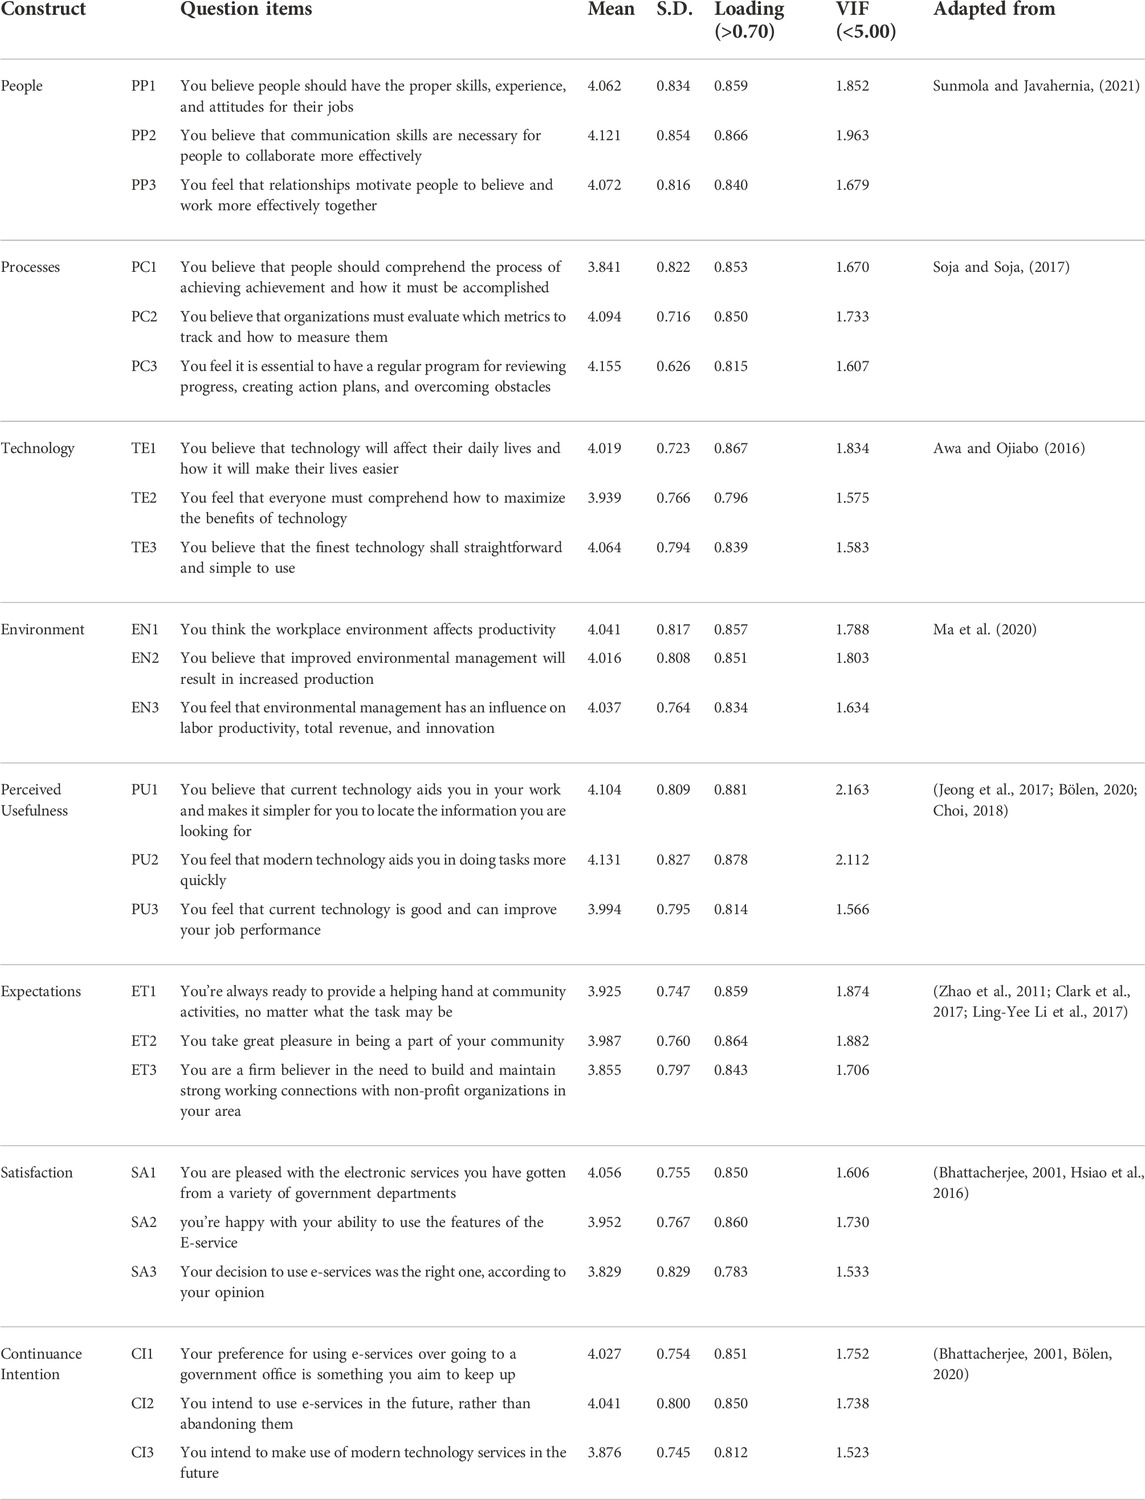
TABLE 3. The reliability and validity of the results.
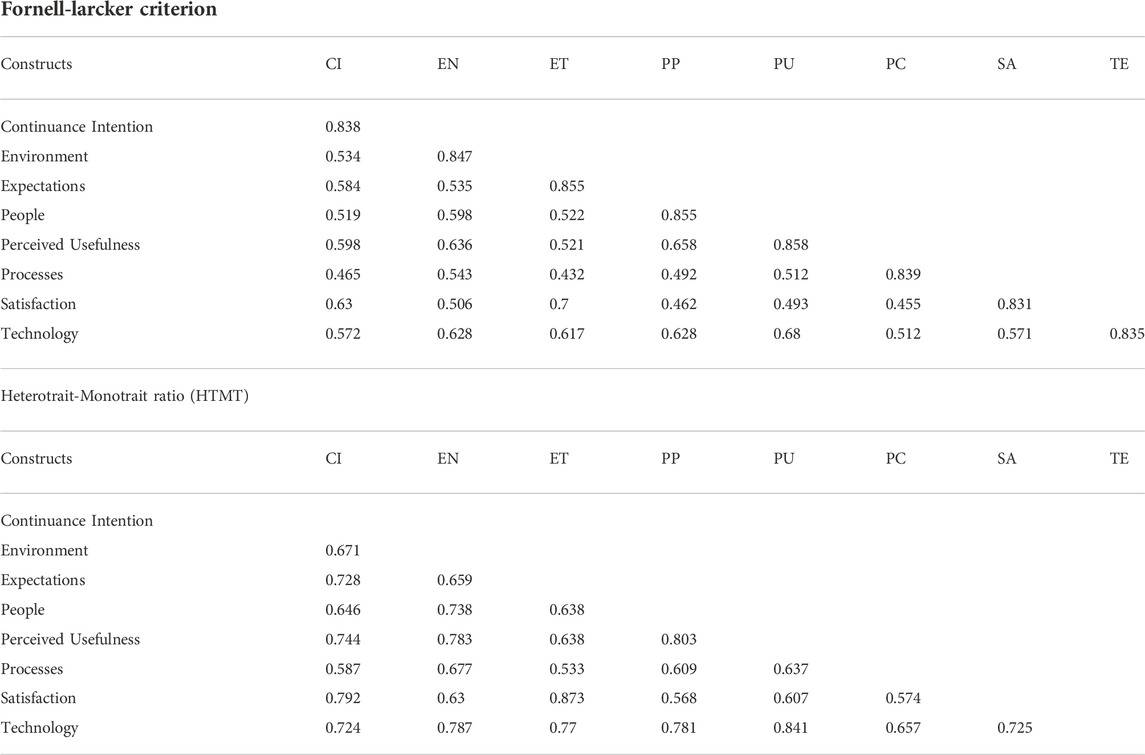
TABLE 4. Fornell-Larcker criterion and Heterotrait-Monotrait ratio (HTMT).
5.3 Structural model
After receiving satisfactory findings from the previous assessment, we used SmartPLS 3.3.0 to perform hypothesis testing and goodness-of-fit analyses (GoF). The theories behind the proposed research paradigm were explored in the preceding part. As indicated by (Hair et al., 2019) we resampled 5,000 samples using the bootstrapping method with a significance threshold of 0.05 for the path coefficient, the t-value, and the p-value. The following are the acceptance requirements for the path coefficient (β) (>0.10), the t-value (>1.96), and the p-value (<0.05): As a consequence, the data show that H4 and H11 have been rejected, but H1, H2, H3, H5, H6, H7, H8, H9, H10, H12, and H13 have been accepted. Figure 4 illustrates the output with an indication of the hypothesis testing from the SmartPLS program. Table 6 provides a summary of the results. We obtained a goodness-of-fit (GOF) score of 0.603, indicating a high degree of model fit.
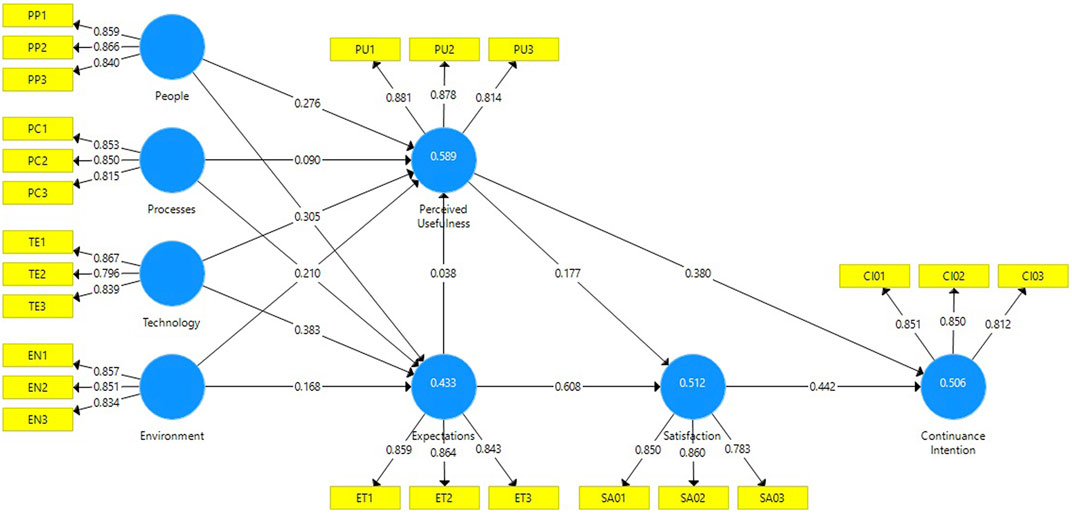
FIGURE 4. PLS algorithm results.
5.4 Model fit
As mentioned in earlier sections, the results of each suggested model building have been given. As seen in Figure 4, this section examines the results of the SmartPLS structural model, employing data from all suggested model structures. Table 5 displays the findings of the SmartPLS structural model analysis. In a quantitative research model, the model fit consists of three elements: First, the coefficient of determination (R2) is undesirable when it is less than 0.19, bad between 0.19 and 0.33, reasonable between 0.33 and 0.67, and outstanding when it is greater than 0.67. All variables had a moderate effect: continuance intention = 0.506, expectations = 0.433, perceived usefulness = 0.589, and satisfaction = 0.512. Second, the term “standardized root” refers to the square residual (SRMR), which must be less than 0.080 in order to be considered normalized (Hair Jr et al., 2021). This yields a satisfactory result of 0.056 for the computation. The goodness of Fit (GoF) is the degree to which a model matches its data. As shown in (Eq. 1), it may be categorized as low (less than 0.10), small (between 0.10 and 0.25), moderate (0.25–0.36), or large (more than 0.36). Depending on the outcome, this results in a high GoF level of 0.603. Using the following Eq. 1, the outcome of GoF may be calculated.
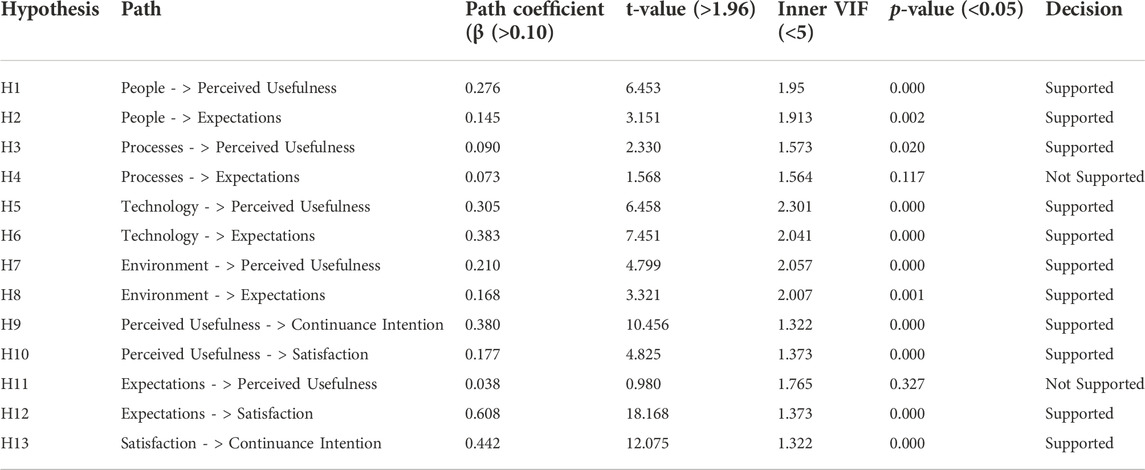
TABLE 5. Results of the structural model.
6 Discussion of quantitative research results
The quantitative research results in Table 1 and Figure 1 indicate that all hypotheses (H1, H2, H3, H5, H6, H7, H8, H9, H10, H12, and H13) are accepted to be significant and to contribute to sustainable action organizations. However, two hypotheses, H4 and H11, have been rejected and require additional research and analysis. This part is where qualitative research should be carried out to offer sustainable operational procedures that propose a framework for sustainable business framework for the provision of community water because Businesses are reliant on inputs (inputs), processes (processes), and performance (performance) (outputs). The organization is responsible for incorporating the demands of all parties into the operational process and carrying out various tasks. Because managing a corporation involves overcoming several obstacles that present both dangers and possibilities (Fielding and Hornsey, 2016). Businesses must continuously evolve and adapt to survive and expand steadily and sustainably. Therefore, the organization’s growth toward sustainability is an “important topic” that every firm must incorporate and actively push, which may be done in various ways based on the organizational situation (Di Fabio, 2017). This result is based on the significance of business to economic expansion. There is an excellent corporate governance and risk management structure. In addition to working with social and environmental responsibility as part of routine business procedures, a context study of business connections, stakeholders, and associated concerns should be conducted to identify the most critical issues of corporate sustainability (materiality). Determine business sustainability policies (policy) to encourage sustainability implementation. Ultimately, organizations require a system to collect and store sustainability performance data that can be used to monitor and develop operational outcomes, as well as to disclose operating results and interact with stakeholders. The following section will describe a qualitative research process to initiate a sustainable business framework for community water supply businesses, which requires ongoing qualitative research to determine the causes and provide solutions that organizations can implement to a conceptual framework to organize for sustainability success.
6.1 A sustainable business framework for community water supply businesses
This section study takes a direct approach to develop a framework model based on sustainable development goals (SDG), a sustainable business model, and a value generation process that incorporates risk and governance within that framework model. By presenting an interactive qualitative analysis, this is the first conceptual framework for sustainable business innovation in community water management. This study is interested in two primary areas of study when it comes to the Sustainable Development Goals (SDGs): First of all, sustainably accessible safe drinking water and sanitation, as well as sustainable cities and communities, ensure that cities and human settlements are safe for all residents, adaptable to change, and develop sustainably. Second, proposing an appropriate foundation for a sustainable community business framework is a novel tactic to attract community water supply businesses. By the way, neither research examined all the essential components in a single workplace, nor did it look at social features, transparency, or stakeholders associated with local innovation ecosystems via an end-to-end business model. Additionally, no studies have been conducted on the link between internal management and the development of a framework for sustainable community business that meets consumer expectations for goods and services. This study tried to fill in gaps in the current community business framework by focusing on the sustainability management paradigm.
Therefore, based on the relevant literature review and previously published research, including related sustainable business frameworks, the researcher determined that several gaps still need to be addressed and have been compiled and formulated in greater detail, respectively. The researcher also presented a conceptual framework influenced by conceptual initiative models in community water supply (Sukma and Leelasantitham, 2022a; Sukma and Leelasantitham, 2022b; Sukma and Leelasantitham, 2022c; Sukma and Leelasantitham, 2022d), as shown in Figure 5 and Table 6.
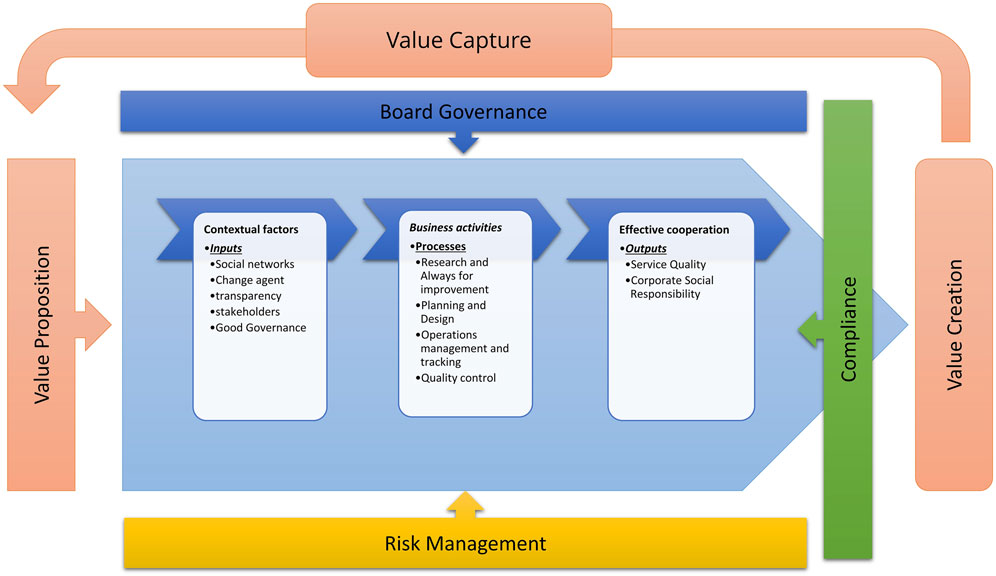
FIGURE 5. Proposed framework: A Sustainable Business Framework for Community Water Supply Businesses.
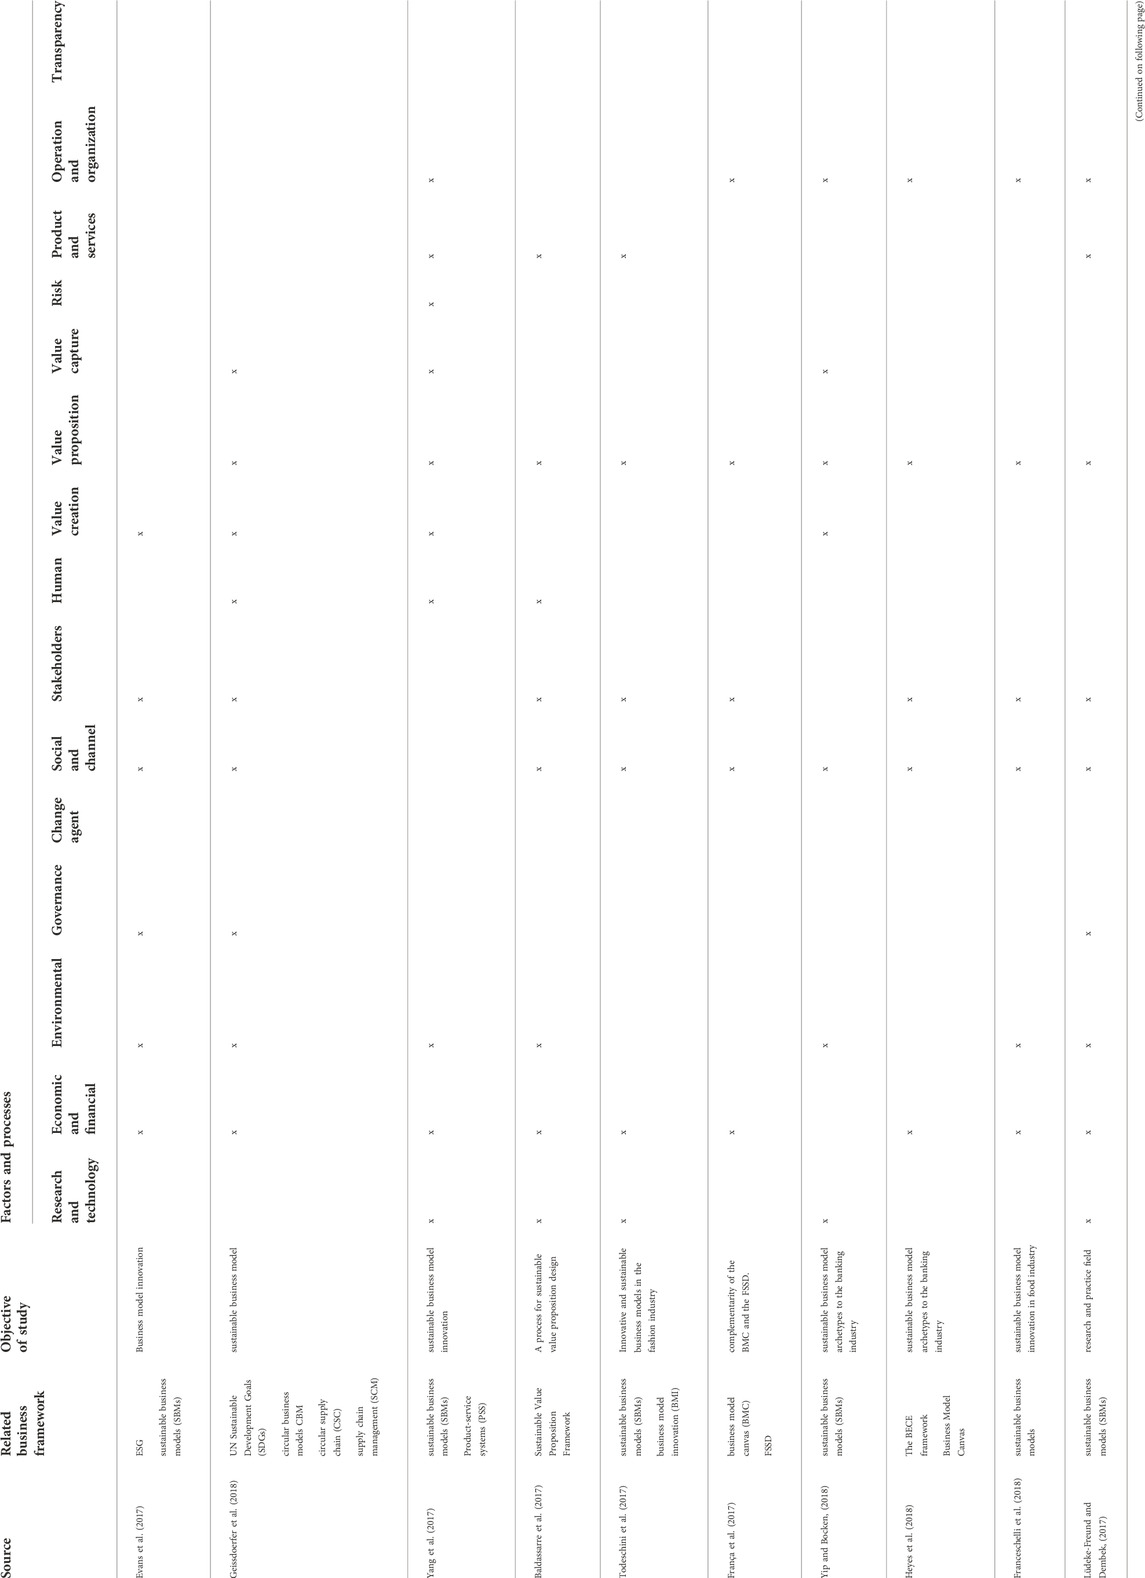
TABLE 6. A review of the literature for comparison and formulation.
7 Qualitative research methodology
This research is qualitative, meaning that it analyzes the interactions between events and their surroundings in order to collect data from a multidimensional standpoint. This qualitative study examines all observation areas and evaluates the data using cause analysis skills. The researchers considered that the qualitative study design presents a transparent, verifiable, rigorous data collection and analysis procedure. Consequently, interactive qualitative analysis (IQA) was used for this study as the method incorporates collection procedures (Northcutt and McCoy, 2004). IQA is another established method for achieving credible qualitative research output. It collects a wide range of information yet is a method that can be described in detail.
Additionally, this technique supports numerous information sources, including participants in in-depth interviews, theories, and procedures, which considerably improves reliability and validity (Davis, 2019). The researchers anticipate that using a range of methodologies in this research will help eliminate these flaws, lessen internal bias, and be more suitable than other methods that rely solely on interviews and the researcher’s judgments. Interactive Qualitative Analysis (IQA) is a systematic, rigorous framework that can be audited at each step, which is crucial for qualitative data analysis as determined by the researchers. The IQA approach will demonstrate that the distinction between IQA and conventional qualitative analysis is that the researcher’s role is limited to advocating for the participant’s ability to attend activities with minimal inconvenience.
On the contrary, people originated, questioned, evaluated, and interpreted their knowledge without external motivation. In contrast, in this IQA technique, the researcher functions solely as a data collector since he or she does not lead or provide direction on every aspect of every topic. This research has demonstrated that it is an efficient method that yields dependable results and can also be validated scientifically. In addition, the IQA technique ensures that the researcher has minimal influence on the information provided by the participants, as the approach to the research process takes into account the causal connections between ideas (affinities) and leads to the steps that produce a System Influence Diagram (SID), a graphical representation of phenomena and affinities. Participants are permitted to identify subjects (affinities) based on their consensus members’ debates and shared experiences. The researchers then employ individual semi-structured interviews to clarify their content further, obtaining a comprehensive description of each similar statement that may be reduced to affinities based on the consensus of all participants.
7.1 Interactive qualitative analysis process flow
The term “Interactive Qualitative Analysis” (IQA) refers to both a tool and a procedure that is used in qualitative research design (Northcutt and McCoy, 2004). The technique helps to generate a more profound knowledge of phenomena through guided group conversations that can be explained scientifically. IQA is a method for conducting qualitative research that examines cause-and-effect links based on how well they make sense. In addition, the method of gathering data through interactive qualitative analysis (IQA) did an excellent job of exploring the significance of each topic that the group of participants brought up during their conversation, as shown in Figure 2. Flowcharts of quantitative and qualitative research methodology processes.
Firstly, creating a broad topic-based discussion group is the first step in the IQA process. In this group, participants are free to independently come up with answers to questions and debate them to find a rational, structured relationship that can help explain the origins of each concept group by comparing the rational components of each other. This process helps to find a solution to the problem at hand. Second, it was used to structure the relationship between the building factors as a system of linking influence diagrams (SIDs), which mapped out the relationship and clearly showed the link between the components to the researchers. This flow was done using the information obtained from the first step. Which of these has the most significant influence, and which has the least? Next, an interactive qualitative analysis (IQA) technique is used to define each organization’s relevance and help identify the significant challenges that have arisen due to the primary and secondary drivers. It is also helpful to know the primary drivers influencing the overall picture. It is possible to see that all of the secondary drivers are affected by the same thing and are heading in the same general direction. Third, this phase is to construct and describe the results from the developed correlation diagram (IRD) data. These data reveal the frequency of the relationships in each factor group, how much they impact each other, the direction of each factor, and how they influence each other With the help of diagrams. They know exactly how each part fits into the whole and how it works. Then The fourth step is to apply the Pareto principle (Sanders, 1987), which states that 80% of the results are caused by a variable that accounts for only 20% or that 80% of a minimal force can be achieved by 20% of the force, a principle that is also referred to as the 80/20 rule. It is known as the law of the essential few. This finding is significant, and its repercussions can be felt throughout the system. It emphasizes the peak variance and focuses on the number of frequency peaks, which in turn causes the relative distribution defined by the power law.
At the end of the IQA process, there will be a final discussion in which drivers (causes) and outcomes (effects) can be identified and discussed in more depth.
7.2 Focus groups
(Vaportzis et al., 2017) Provides a detailed analysis of a group discussion that has been arranged. In this study, beginning with 50 participants, researchers used a simple random sample procedure based on sampling ratios from 14 villages to conduct this study. At least three community water consumers are sampled in each village to participate in the IQA process, and each village must furnish at least one representative. IQA suggests a sample size between 12 and 20 (Northcutt and McCoy, 2004), and 19 individuals volunteered to participate in this study. During the subsequent 3-h session, participants were assisted in remaining focused on their communal water supply experience with visualization and relaxation techniques.
Following the warm-up exercise, participants were sent to the sharing intervention in the meeting room, where they could concentrate only on memories of community water supply utilization. The goal was to recall every detail, such as where they were used and how they were consumed every day. Individuals who ingested water were encouraged to engage in a variety of activities prior to engaging in the visualization process in order to record their subsequent thoughts and ideas. On each card, participants were told to write a word or phrase that accurately described their daily water usage. It was clear from the outset that participants did not need to worry about the appropriateness of their comments since the researcher was just interested in their honest opinions.
Additionally, participants were told that their actions would not have repercussions. There was no controversy or discussion at the time. Participants were expected to work in silence to avoid being influenced by their peers or the study group until all thoughts and ideas were put on paper. The researcher ordered the participants to put their completed cards on the wall. Each card was read aloud, and everyone in the room validated each card. The last step was inductive coding, during which participants were instructed to sort the cards into similar-meaning groups that communicated comparable thoughts and ideas. The researcher will give names to categories according to the word or phrase that best expresses each grouping of meanings, or “affinities.” This process of renaming and altering is known as “axial coding.” After all of the above steps were completed, everyone could take a break.
During relaxation time (30 min), the researcher developed an affinity relationship table (ART), which was given to the user of the community water supply when they returned to the meeting room. In addition, researchers will write and document the interaction between two affinities. As a result, community water users were forced to contemplate what brought them together. This process may be accomplished in one of three ways:
○ If A is related to and influences B, write it instead with A → B
○ If B is related to and influences A, write it instead with A ← B
○ If A is not related to and does not influence B, write it instead with X
7.3 Affinity relationship table
The Affinity Connection Table (ART) acquired from focus groups displays the relationship between affinity pairings as shown in Table 7 Affinity Frequency and Table 8 Affinity Optimal Relationship (See supplementary file), the number of frequencies of each relationship pair, and the cumulative frequencies to be utilized in the following phase to build an Inter-Relationship Diagram (IRD) (Northcutt and McCoy, 2004).
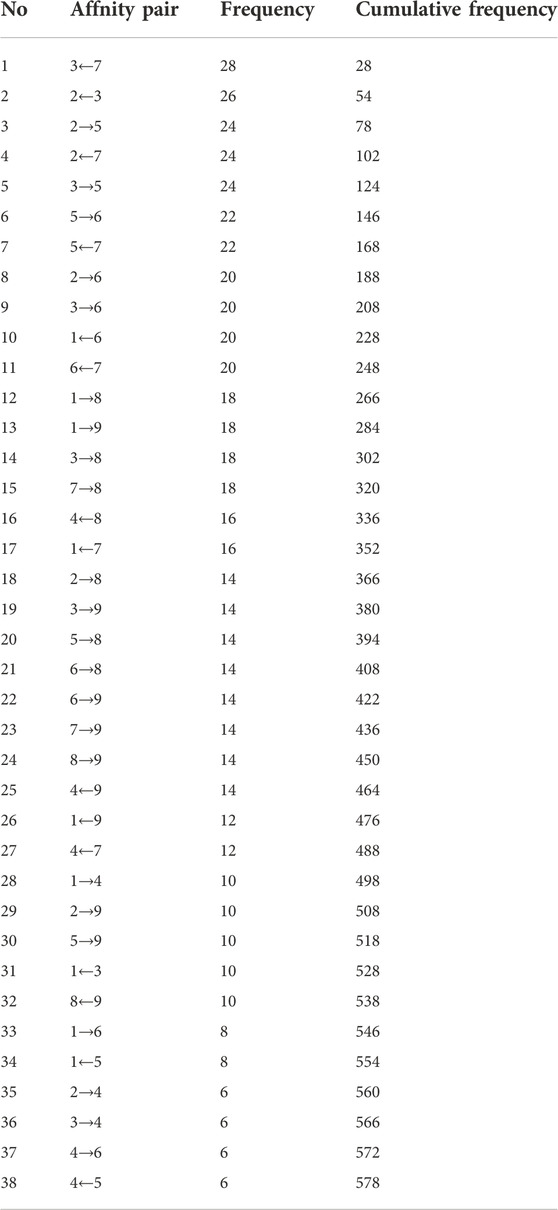
TABLE 7. Affinity frequency
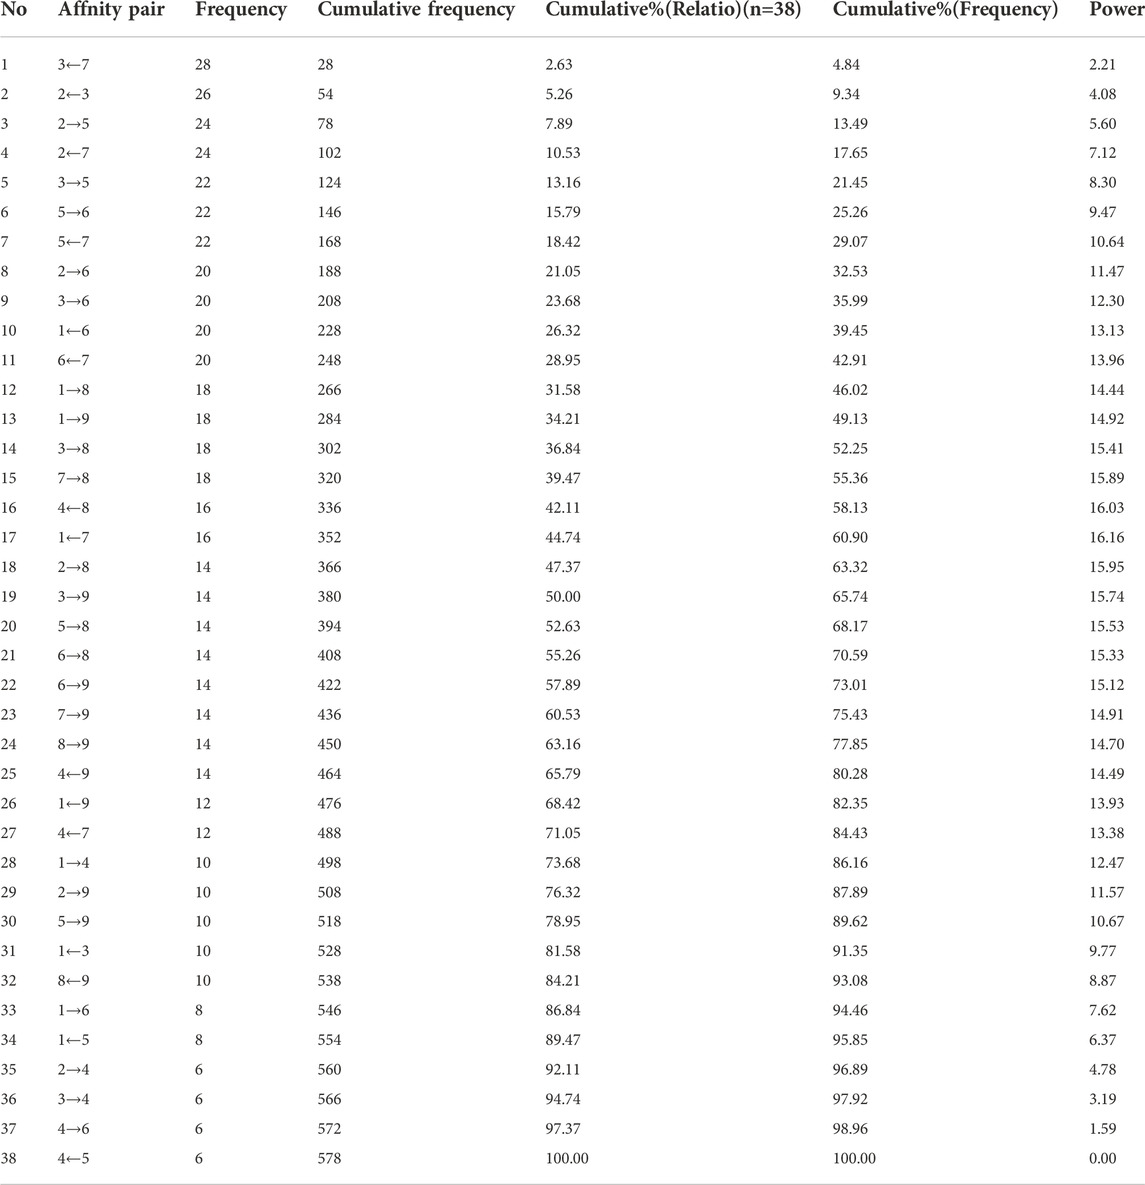
TABLE 8. Affinity optimal relationship.
7.4 Mapping the Inter-Relationship Diagram
This level of analysis requires the creation of an Inter-Relationship Diagram (IRD) that depicts the ideal number of connections (Northcutt and McCoy, 2004). When evaluating the causal link between the differences, the driver can decide whether they are drivers or outcomes, where the driver “causes” the outcome. However, the outcome does not affect the driver. These connections are shown by arrows in the IRD table, with the direction of the arrow indicating the direction of influence. A directional arrow may only point to the left or the top.
Moreover, each link is documented twice (Through rows and columns). If the arrow points up, it is referred to as “out,” whereas if it points to the left, it is referred to as “in.” These inputs and outputs are tallied for each row and recorded in the appropriate column. The left arrow indicates “outs” (effect), As shown in Table 9.
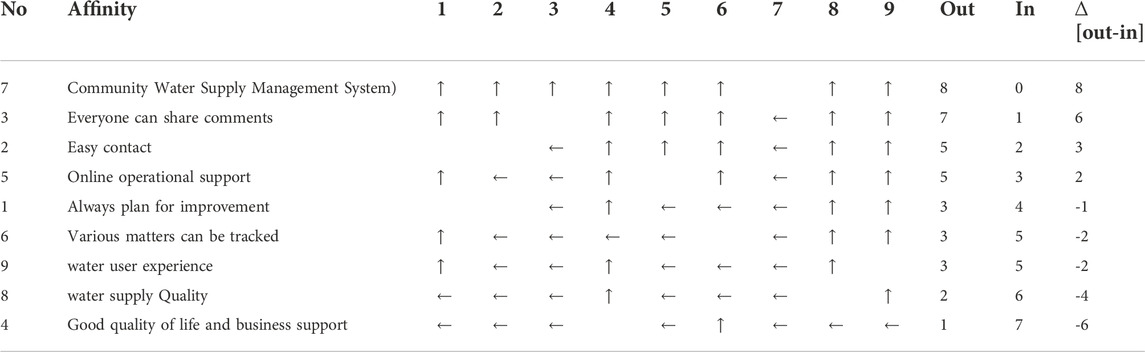
TABLE 9. Determining drivers and outcomes.
Besides, the initial phase of putting the focus groups through the IQA process consists of quiet brainstorming, axial/theoretical coding, and interviews with analysts and participants regarding the data (Affinity Name and Determinant). As seen in Table 10, the affinities created to lead to SIDs presenting composite mind maps that are a combination of those of analysts and users. In the SID, all drivers are shown on the left, and all results are shown on the right.
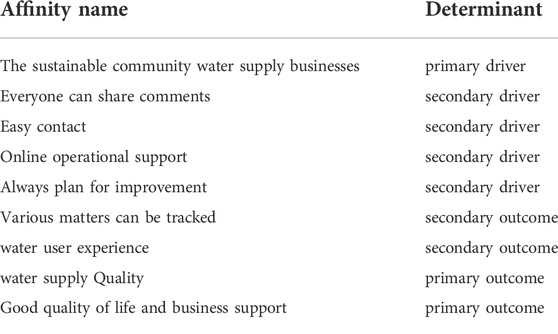
TABLE 10. Affinity name and determinant.
7.5 System influence diagram
The Affinity Optimal Relationship Table was utilized to arrange all matched relationship values according to the number of votes or cumulative frequency of the participants. Based on what the authors said about the Pareto principle (Sanders, 1987), it is believed that 80% of the correlations between affinity pairs are believed to be representative of constructing a cluttered system influence diagram (SID), as depicted in Figures 6, 7. The Cluttered SID considers redundant links, such as the fact that everyone can share comments, easy contact, online, operational support, and always plan for improvement. Furthermore, the final uncluttered SID is depicted in Figure 6. The delta values derived from the relationship relationships in the table are ordered from highest to lowest. This process indicates that linked links are extracted as drivers and outcomes. A good association is generally regarded as a driver (Northcutt and McCoy, 2004). determined that the results are positive and negative values. Whether a group is the primary or secondary group driver depends on whether the positive delta is strong or weak and is generally significant. Other relevance and values are categorized by primary or secondary outcomes based on whether they have more extensive or lower negative values. These interactions are influenced by the drivers and serve as all-outcome influencers. However, we have considered all positive correlations to be the cause and all other correlations to be the effect. Other interest groups have been organized in the manner described previously. Based on the relationship descriptions and sparse SIDs provided by the participants, the final uncluttered SID shows all of the primary and secondary drivers and consequences. It was discovered that the primary drivers were the sustainable community water supply businesses. The secondary drivers were that everyone could share opinions, easily access operational help online, and always strive for improvement. Two secondary outcomes were the ability to track various issues and improved water user satisfaction. In the end, the primary outcomes were the quality of the water supply and “good quality of life and business support.”
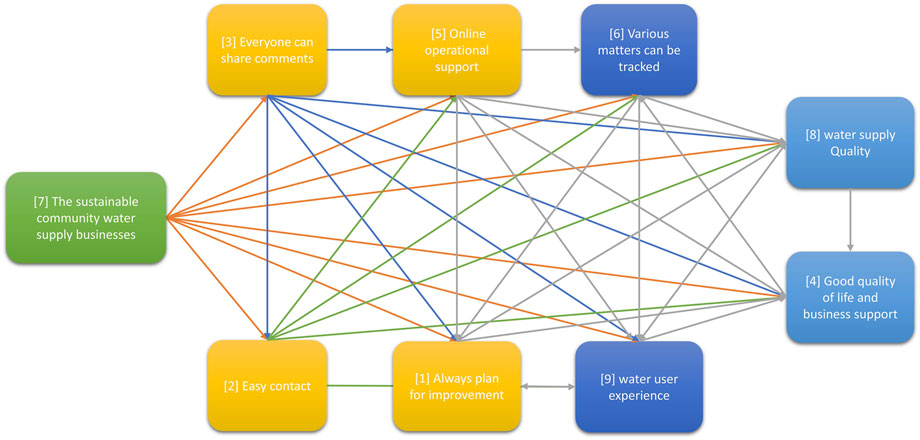
FIGURE 6. Cluttered system influence diagram.
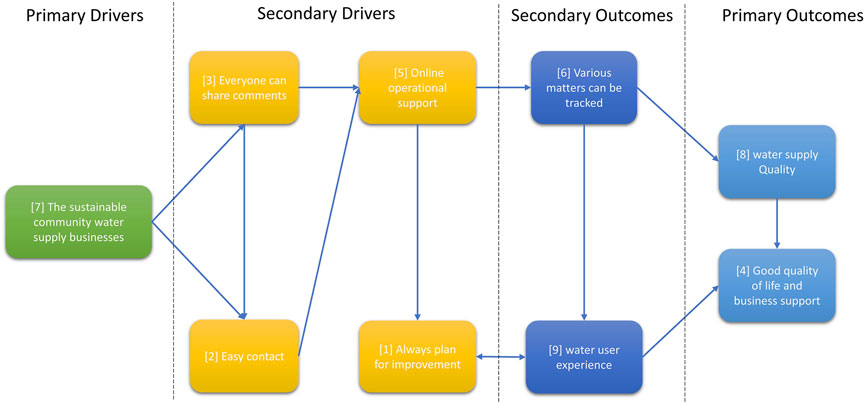
FIGURE 7. Uncluttered system influence diagram.
8 Discussion
This section describes the contrast between the proposed conceptual framework and past research, as well as the theoretical, practical, and policy implications based on scientific findings.
8.1 Analyzed results
Interactive qualitative analysis (IQA) is a research design that develops a comprehensive understanding of a phenomenon through group conversations and guided debates. According to the structure of semantics, the relationship between cause and effect is investigated by comparing and contrasting elements from polarized structures. The Interactive Qualitative Analysis (IQA) data collection method investigates how semantics might be understood. The System Influence Diagram (SID) association develops a linkage and demonstrates the link between the primary influencers. This study tries to demonstrate that the conceptual framework offered in this study is consistent in various ways. IQA discovered that it is evident that affinity names as primary drivers stem from a community need for “sustainable community water supply businesses,” which prompted the research question, “What factors should community water supply businesses have for sustainable business operations?” The percentage of cumulative (frequency) and power indicators have been shown to correlate with [7].
The sustainable community water supply business with the two criteria mentioned above is present. The sustainable community water supply business will require four supplementary drivers: [3] Everyone can share comments or the ability for everyone to contribute their opinions; and [2] Easy contact or simple communication. Two more supporting elements are required: [5] online support or operational assistance; and [1] always plan for continuous improvement or expansion. Given these points, this section has a high degree of coherence with the conceptual framework of social networks and stakeholders. For example, they are essential contextual elements that handle inputs; corporate activities, and processes that must be performed, such as research and continuous improvement; and operations management and tracking, among others. The most significant conclusion of this study was the primary outcome, which was determined by analyzing the IQA data and using an analysis method. Scientific analysis has demonstrated conclusively that the IQA approach will produce the essential outcomes of water supply quality, high quality of life, and business assistance. This process is further evidence to support the conceptual framework proposed in this paper, which explains practical cooperation in output, service quality, and corporate social responsibility. It also illustrates the relationship of the conceptual framework, which is pertinent and supports the suitability of the entire process by merging the risk management and sustainable development goals (SDG) with the associated Sustainable Business framework. To investigate and offer an SDG framework for sustainable community business as a model for any community business that, in the present day, must consider sustainable business practices. In addition, it means that any business in a community must consider environmental and social sustainability as a crucial part of how it does sustainable business.
8.2 Comparison between a proposed conceptual framework and prior work
This paper proposes a novel Sustainable Business Framework for Community Water Supply Companies suitable for local community businesses. It also presents specific research on community water supply companies, which have never been the subject of a comprehensive study. Additionally, this conceptual framework combines all the necessary factors and processes to combine with the innovation of the traditional business model or sustainable business model (Todeschini et al., 2017; Yang et al., 2017; Franceschelli et al., 2018; Yip and Bocken, 2018), that is, transparency, technology, agent of change, risk, product and service management, and organizational management, in a single framework. Therefore, this framework aligns with the actual community requirements using quantitative and qualitative research methodologies. This conceptual framework upholds the Sustainable Development Goals (SDGs) of the United Nations through experimenting with business models, and sustainable business models (SBMs) have a goal to study along with (Morioka et al., 2017; Geissdoerfer et al., 2018; Abhayawansa et al., 2021). The result of this article provides a new perspective by focusing intently on community business. Because microenterprises represent the most significant business segment in developing nations, they differ from industrialized nations, which concentrate on more significant business segments. Thus, this conceptual framework captures the triple keys of business: value creation, value capture, and value proposition study (Baldassarre et al., 2017; Weissbrod and Bocken, 2017; Abhayawansa et al., 2021), but this article proposes a method that maintains all three throughout the process cycle and Risk Governance and Control that similar to (Adams, 2017; Lüdeke-Freund, 2020; Abhayawansa et al., 2021; Ullah et al., 2021; Vagin et al., 2022) in order to create a sustainable organization. Given these points, this study concludes with a new conceptual framework incorporating four original research papers based on the original conceptual model (Sukma and Leelasantitham, 2022a; Sukma and Leelasantitham, 2022b; Sukma and Leelasantitham, 2022c; Sukma and Leelasantitham, 2022d). They are conducting research based on the community water supply industry, which enhances this conceptual framework. In summary, this Sustainable Business Framework for Community Water Supply Businesses presents how a business can do and improve customer satisfaction. While developing long-term partnerships with others and minimizing the environmental impact, two other elements, practical corporate governance in the firm and the promotion of social responsibility awareness, reinforce these factors.
8.3 Theoretical implications
This study combines two frameworks (the PPT framework and TOE framework) and Expectation Confirmation Theory (ECT) to develop a conceptual model and a conceptual framework that meets current needs without causing problems in the future. It is a development that must be connected and related by considering the three elements, economic, society, and environment.
This research takes on a new significance by stressing the practical meaning of people (PP) instead of merely the workforce. Organizations must select essential individuals with the appropriate skills, experience, and disposition for the task. In addition, people-to-people (PP) communication is essential to an organization’s success while integrating new procedures or technologies. However, people’s (PP) relationships with stakeholders and obtaining their buy-in are crucial for establishing traction and persuading people to believe in and adopt the solution. Using the Sustainable Business Framework for Community Water Supply as a basis, this article investigates and describes the essential idea of the process (PC). Businesses demonstrate how they can increase customer happiness while fostering long-term partnerships. Then go to sustainable organizations.
Moreover, technology (TE) has highlighted social networks as a modern technological use case that improves people’s daily patience. The technology-organization-environment framework, also known as the TOE framework (Soja and Soja, 2017), explains technology adoption in organizations and describes how technology influences the adoption and implementation of technological innovations. Because business activities that adhere to sustainable development principles do not raise the organization’s burden, in addition to helping employees, the organization must also consider the working environment to foster the long-term growth of a business that is compatible with a sustainable society.
Additionally, businesses must strike a balance between people (PP), processes (PC), technology (TE), and the environment (EN). This finding is a crucial element of the PPT structure. In addition, understanding how they interact can help firms enhance operational efficiency and resource use, which are prerequisites to achieving sustainability. Our study revised and preserved the original Expectation Confirmation Theory (ECT) (Oliver, 1993). It attempts to predict the short-term interest rates that people (PP), processes (PC), technology (TE), and the environment (EN) will have in perceived usefulness (PU), expectations (ET), satisfaction (SA), and continuity intention (CI) in the future, based on a long-term plan that not only promotes the organization’s growth and advancement but also incorporates concern for society and the environment. To achieve sustainable growth, organizations must examine several essential characteristics. In addition, companies seeking long-term sustainability may not perceive a clear long-term company image if these factors are overlooked.
In summary, this study is an excellent example of combining quantitative and qualitative research with advanced and complex research procedures. Structural equation modeling (SEM) employs the partial least squares (PLS) path modeling approach to estimate conceptual models with data by employing PLS-SEM and sum score regression methods that begin with creating a conceptual model. When researchers discovered that H3 and H11 had been rejected from the process (PC), which affected expectations (ET) and perceived usefulness (PU), respectively, researchers continued their research with qualitative research, followed by double research with a conceptual framework via Interactive Qualitative Analysis (IQA) (Northcutt and McCoy, 2004). IQA is a qualitative research technique that generates a greater understanding of phenomena through guided group discussions that may be scientifically explained to discover the truth about occurrences and the current environment. It explores the interaction between events and the surrounding environment to acquire insight into the big picture from several dimensions or viewpoints. This research resulted in more credible findings when presenting the Sustainable Business Framework for Community Water Supply Businesses through a sequential and recognized scientific method.
8.4 Practical implications
This study examined and incorporated sustainability indicators following the United Nations Sustainable Development Goals (UN SDGs) and the Corporate Strategic Plan, which specifies the direction of sustainable business operations towards a community business (Sachs et al., 2022). It works sustainably with community engagement and develops a framework for defining maps that may be expanded for economic, social, and environmental planning. Operating a business presents numerous obstacles. Therefore, businesses must continuously adapt and evolve to survive and grow gradually and sustainably. Consequently, the organization’s development towards sustainability is an “essential topic” that every firm must integrate and push in a manner that varies depending on the organizational setting. The underlying idea of this issue is the importance of business to economic expansion. There is an excellent system of corporate governance and risk management. In addition to functioning with social and environmental responsibility as an integral aspect of corporate operations, which can be separated by the group as follows:
First, Practices of Corporate Governance. This study has contributed to the development of an emphasis on business expansion. It proposes taking risk management into account when developing a new business ecosystem (Abhayawansa et al., 2021). It is advised to adhere to the principles of good corporate governance, such as promoting and pushing for an anti-corruption culture. Good corporate governance across the enterprise It is also suggested that the policy on business care and anticorruption policy in the Employee Handbook and Supplier Code of Conduct and Guidelines organize activities to promote knowledge and understanding of governance and corporate governance as defined by (Woods and Narlikar, 2001), such as public relations, training, and corporate governance self-assessment. It was developing a plan or framework for sustainable business development. A company should prepare a long-term sustainability action plan or road map to determine how it will address critical corporate sustainability concerns. Under the framework of sustainable development, this should be consistent with our company’s policies and objectives for sustainability. The formulation of a sustainability action plan depends on the program’s objectives. However, businesses are typically determined by fundamental considerations such as compliance with the sustainability framework and business sustainability objectives (DaSilva and Trkman, 2014). In establishing sustainability plans, addressing the most crucial sustainability concerns generates advantages or demonstrable changes in the company’s value. Businesses must establish time limits, operational norms, and transparent indicators. This paper can demonstrate performance in terms of both output and outcome, allowing individuals responsible for implementing sustainability action plans to have a clear framework and determine the value they offer to the business.
Second, Commitment to Sustainable and Long-Term Stakeholders: This study has aided in developing strategies and plans based on consideration of all stakeholders, including customers, communities, and partners’ control (Hein et al., 2017). Business expansion initiatives should be designed as inclusive endeavors and consider the opinions of all stakeholders. The store and grow the business’s use of technology to improve the ease of shopping and service customers, as well as address corporate governance, environmental, and social concerns in the procurement screening process. Incorporate technology into the screening, hiring, and bidding processes while considering risk management (Vagin et al., 2022). This research identifies the organizational environment so that community enterprises can drive sustainable development by integrating it into standard business procedures. Businesses must first and foremost comprehend the organization’s context or “identity,” which they can learn from the corporation’s goal, mission, corporate culture, value chain, and business strategy. Threats and opportunities in business, as well as the industry’s direction and trend, will aid the organization in fully understanding its context (Ullah et al., 2021). This finding results in stakeholder analysis and sustainability challenges organizations should prioritize and manage effectively. To assist the company in achieving robust long-term growth. Identification and evaluation of constituents. The business should be able to assess both the sound and adverse effects that stakeholders have on the business and the business has on the stakeholders. Besides, Demonstrate the business relationship with its stakeholders. Who was responsible, and who was affected? What are the positive or negative repercussions, and what areas are addressed? Companies should take measures to maximize their good influence and decrease their negative impact. To preserve competitiveness and cultivate the potential for long-term corporate expansion.
Lastly, when corporations emphasize sustainability concerns, businesses can choose the proper management approach for each issue by analyzing the critical corporate sustainability concerns (Bocken et al., 2019). Sustainability concerns are crucial to determine the organization’s direction, strategies, and business development guidelines in accordance with the context and stakeholder expectations. This paper will result in sustainable growth. However, as the organizational or stakeholder context evolves, the sustainability concerns faced by firms may vary or move in priority. Therefore, organizations should regularly analyze and evaluate significant sustainability concerns to ensure that they are consistent and relevant to the ever-changing business environment.
8.5 Policy implications
This research consists of qualitative and quantitative components. The purpose is to synthesize policy implications, thereby facilitating the organization’s push toward business sustainability. Additionally, policies and goals at the organizational level must originate from the board of directors or top management to demonstrate to stakeholders that the firm has a set of guiding principles, vision, mission, and objectives for conducting business. This research finding helps foster the understanding and participation of stakeholders, particularly employees within the business, to align their thoughts and activities with the organization’s sustainability policies and objectives. As a result of this research, the following findings can be used at the policy level:
First, this study promotes sustainable financial and company management practices that benefit society and the environment. Significantly, this research demonstrates that community-based firms must consider socially responsible business practices and should boost their attention to delivering added value for their users. The ESG Framework applies to all corporate levels and should adopt Responsible Finance concepts encompassing Green Finance and Sustainable Financial Management. This policy will make it easier to design and develop services and products and manage the organization’s financial and investment resources to benefit customers, society, and the environment as much as possible
Secondly, policies should balance social and environmental values. This study has demonstrated the importance of creating social and environmental value. It is a framework for development that adheres to the concepts of the Environment, Social, and Governance Framework (ESG Framework) and the Sustainable Business Framework. Sustainability requires comprehensive social and environmental management. In addition to enterprise-wide risk management (ERM), every firm must construct a responsible structure and formulate policies to develop socially and ecologically conscious operational processes and services. The promotion system Monitor and reports on measurable success. The structures and systems outlined in this document must be consistent and fully compliant with established international standards, including labor practices. Human Rights Management makes it easier for people to get involved, help their communities grow, and understand how social and environmental risks affect the present and future health of society and the environment.
Lastly, the Sustainable Business Development Policy for Good Corporate Governance This study demonstrates that effective corporate governance is essential. It is one of the three guiding concepts of the ESG Framework and its approach to corporate development toward sustainability on a local and global scale. For a firm to continue to expand over time, it must be built on the health of the economic, social, and environmental sectors. The long-term path of the business must be determined by the organization’s effective corporate governance and the top executives, who must accept and adopt the firm’s balanced development goals—creating an environment to foster a company culture centered on sustainable development. Determination of products, services, and operational procedures that consider economic, social, and environmental benefits, including improving participation tracking systems. Evaluate the results and write a report on them to ensure that the business is in line with both local and international frameworks for sustainable business.
To conclude, the analysis of the policy implications for each stakeholder and the approach for sustainability management is shown in Table 11 below.
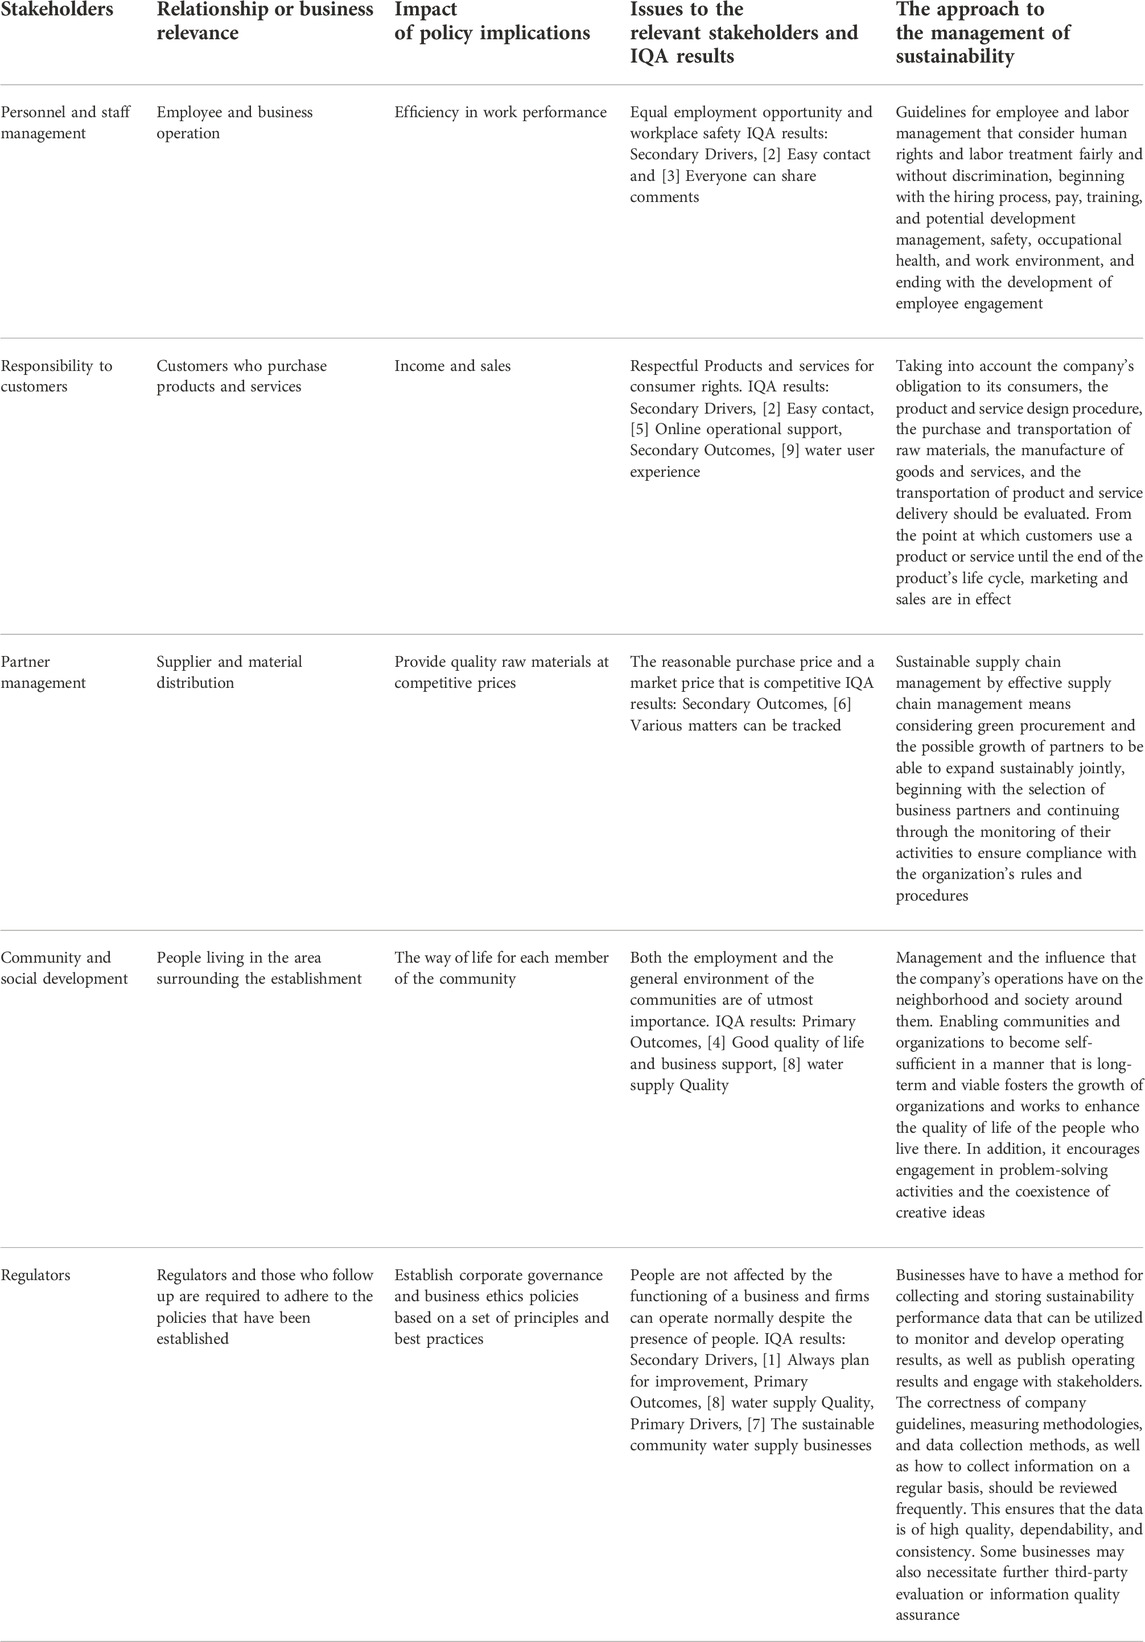
TABLE 11. The policy implications analysis correlates with the IQA results.
9 Limitations and further directions
This study examines the SDG framework for sustainable community business by employing IQA in a community water supply business. During the COVID-19 epidemic, most of this study was conducted remotely by volunteers from each town. Therefore, researchers cannot independently inspect the study site to conduct the entire research procedure. Future research may include an application for evaluation using real-world conditions and comparing before and after using the applicable testing instruments based on this conceptual framework. Also, this study employs a simple random sample technique and focuses on a small group of participants who know community water provision. Therefore, additional research is required to broaden the scope of future studies by recruiting participants from other places or surveying a more significant sample of urban water consumers to provide more reliable results.
Additionally, the research area for future studies should be as expansive as possible, which can be achieved by conducting quantitative and qualitative research in various study zones. In addition, the IQA technique utilized in this investigation was selected based on the study’s objectives and the findings of relevant literature reviews. The following experimental instruments must be created and tested for accuracy to transform this study into a relevant guideline.
10 Conclusion
This research begins by emphasizing the practical importance of the PPT and TOE frameworks. Organizations must hire individuals with the necessary skills, experience, and disposition. Communication is essential to the success of an organization when integrating new procedures or technologies. Relationships with stakeholders and gaining support are essential to gaining traction and convincing people to adopt the proposed solution. This article describes the Sustainable Business Framework for the Community Water Supply Framework for Businesses to improve customer satisfaction and foster long-term relationships. In terms of technology, social networks are an application of contemporary technology that improves daily patience, similar to (Işık, 2013; Isik et al., 2021). Also, The Technology-Organization-Environment (TOE) framework explains how technological, organizational, and environmental contexts influence technology adoption in organizations. Because sustainable business practices do not burden the company, along with helping employees, the organization must also consider the working environment to be sustainable in the long run.
Further, To realize the aim of sustainable development, each organization must endeavor to improve its capability and long-term operations through sustainable development policies. Sustainable value chain management is the management of the consequences of the environment. It promotes natural protection by forming policies and strategies at the organizational level, such as sustainable human resource development as the primary driving factor. Also, the company should be able to manage and control the risks associated with the business, given that the environment is constantly changing. It allows for the possibility of an unclear circumstance. However, circumstances are ever-changing. Their widely acclaimed work (Işık et al., 2020) discuss making the emergence of uncertain conditions feasible. Consequently, which risk management and risk control approach should be selected and which appropriate risk management and control activities should be implemented, assuming that the selected approach and organized activities are capable of managing risks to the extent that the risk level does not impact business operations. It will stay so until the level of risk can be decreased to the point where it has no impact on business operations.
Besides, Two more strategies should be added, like encouraging strong corporate governance, building a culture of responsible business practices, and promoting and supporting sustainable development as part of the organization’s activities. In addition, this study contributed to the conceptual framework influenced by conceptual models in the community water supply to formulate customer, community, and partner strategies and plans. Businesses that are expanding should be inclusive. From the perspective of all stakeholders, in addition to addressing corporate governance, environmental, and social concerns in procurement screening, the store and businesses will use technology to improve shopping and customer service. Utilize technology to manage risk management, screening, hiring, and bidding. This study identifies the organizational environment necessary for community-based businesses to incorporate sustainable development into their business practices. The “identity” of a business can be deduced from its objective, mission, corporate culture, value chain, and business strategy. Threats, opportunities, and the direction and trends of the industry will help the organization understand its context. Organizations are required to prioritize and manage stakeholder analysis and sustainability issues. To assist the company’s long-term expansion and constituent evaluation, a company must be able to evaluate its stakeholders’ positive and negative effects. Display the company’s stakeholder relationships. Companies should maximize their positive impact, minimize their negative impact, preserve competitiveness, and foster sustainable growth. Companies can choose the appropriate management approach when prioritizing sustainability by analyzing critical corporate sustainability concerns. Lastly, Organizations should regularly look at their main sustainability concerns to ensure they are consistent and crucial in the ever-changing business world.
Data availability statement
The data analyzed in this study cannot be shared publicly because of the Personal Data Protection Act and is managed by the Institutional Review Board of Mahidol University, which authorized the questionnaire and assigned it the approval number COE No. MUCIRB 2021/249.2709 only.
Ethics statement
The researcher describes the conditions for data collection and destruction in the questionnaire document, of which participants were informed and consented. Then all participants answering the questionnaire will be invited to participate completely voluntarily. Free from direct and indirect coercion, pressure, motivation, use of language, and speech that honors the participants. Non-infringement of research participants’ rights and being cautious of negative consequences. Furthermore, all consent documentation was provided via questionnaires, and all questions included in the research protocol were revised and approved by the Mahidol University central Institutional Review Board (MU-IRB). In addition, participants worked independently while adhering to strict research protocols. This study was classified as low-risk and exempt from the Mahidol University central Institutional Review Board because it did not record information that could readily identify the subject (direct or indirect/linked). Mahidol University central Institutional Review Board, COE No. MU-CIRB 2021/249.2709.
Author contributions
NS and AL: Conceived and designed the experiments; Performed the experiments; Analyzed and interpreted the data; Contributed reagents, materials, analysis tools, or data; Wrote the paper.
Acknowledgments
The authors would like to express their gratitude to Mr. Surin Taweeaugsornphun, who contributed to the dissemination of community problems, which led to this academic research publication.
Conflict of interest
The authors declare that the research was conducted in the absence of any commercial or financial relationships that could be construed as a potential conflict of interest.
Publisher’s note
All claims expressed in this article are solely those of the authors and do not necessarily represent those of their affiliated organizations, or those of the publisher, the editors and the reviewers. Any product that may be evaluated in this article, or claim that may be made by its manufacturer, is not guaranteed or endorsed by the publisher.
References
Abhayawansa, S., Adams, C. A., and Neesham, C. (2021). Accountability and governance in pursuit of sustainable development goals: Conceptualising how governments create value. Account. Auditing Account. J. 34, 923–945. doi:10.1108/aaaj-07-2020-4667
Adams, C. A. (2017). Conceptualising the contemporary corporate value creation process. Account. Auditing Account. J. 30, 906–931. doi:10.1108/aaaj-04-2016-2529
Alkaraan, F., Albitar, K., Hussainey, K., and Venkatesh, V. G. (2022). Corporate transformation toward Industry 4.0 and financial performance: The influence of environmental, social, and governance (ESG). Technol. Forecast. Soc. Change 175, 121423. doi:10.1016/j.techfore.2021.121423
Altieri, M. A. (2004). Linking ecologists and traditional farmers in the search for sustainable agriculture. Front. Ecol. Environ. 2, 35–42. doi:10.1890/1540-9295(2004)002[0035:leatfi]2.0.co;2
Anderson, E. W., and Sullivan, M. W. (1993). The antecedents and consequences of customer satisfaction for firms. Mark. Sci. 12, 125–143. doi:10.1287/mksc.12.2.125
Awa, H. O., and Ojiabo, O. U. (2016). A model of adoption determinants of ERP within T-O-E framework. Inf. Technol. People 29, 901–930. doi:10.1108/itp-03-2015-0068
Awa, H. O., Ojiabo, O. U., and Emecheta, B. C. (2015). Integrating TAM, TPB and TOE frameworks and expanding their characteristic constructs for e-commerce adoption by SMEs. J. Sci. Technol. Policy Manag. 6, 76–94. doi:10.1108/jstpm-04-2014-0012
Awan, U., Sroufe, R., and Bozan, K. (2022). Designing value chains for industry 4.0 and a circular economy: A review of the literature. Sustainability 14, 7084. doi:10.3390/su14127084
Baldassarre, B., Calabretta, G., Bocken, N. M. P., and Jaskiewicz, T. (2017). Bridging sustainable business model innovation and user-driven innovation: A process for sustainable value proposition design. J. Clean. Prod. 147, 175–186. doi:10.1016/j.jclepro.2017.01.081
Bhatt, G. D. (2001). Knowledge management in organizations: Examining the interaction between technologies, techniques, and people. J. Knowl. Manag. 5, 68–75. doi:10.1108/13673270110384419
Bhattacherjee, A. (2001a). An empirical analysis of the antecedents of electronic commerce service continuance. Decis. support Syst. 32, 201–214. doi:10.1016/s0167-9236(01)00111-7
Bhattacherjee, A. (2001b). Understanding information systems continuance: An expectation-confirmation model. MIS Q. 25, 351–370. doi:10.2307/3250921
Bocken, N., Boons, F., and Baldassarre, B. (2019). Sustainable business model experimentation by understanding ecologies of business models. J. Clean. Prod. 208, 1498–1512. doi:10.1016/j.jclepro.2018.10.159
Bosch-Rekveldt, M., Jongkind, Y., Mooi, H., Bakker, H., and Verbraeck, A. (2011). Grasping project complexity in large engineering projects: The TOE (Technical, Organizational and Environmental) framework. Int. J. Proj. Manag. 29, 728–739. doi:10.1016/j.ijproman.2010.07.008
Chillakuri, B., and Vanka, S. (2022). Understanding the effects of perceived organizational support and high-performance work systems on health harm through sustainable HRM lens: A moderated mediated examination. Empl. Relat. 44, 629–649. doi:10.1108/er-01-2019-0046
Curtis, S. K., and Mont, O. (2020). Sharing economy business models for sustainability. J. Clean. Prod. 266, 121519. doi:10.1016/j.jclepro.2020.121519
Dasilva, C. M., and Trkman, P. (2014). Business model: What it is and what it is not. Long. range Plan. 47, 379–389. doi:10.1016/j.lrp.2013.08.004
Davis, J. S. (2019). Iqa: Qualitative research to discover how and why students learn from economic games. Int. Rev. Econ. Educ. 31, 100160. doi:10.1016/j.iree.2019.100160
Di Fabio, A. (2017). The psychology of sustainability and sustainable development for well-being in organizations. Front. Psychol. 8, 1534. doi:10.3389/fpsyg.2017.01534
Dimitropoulos, P. E. (2022). Corporate social responsibility and earnings management in the EU: A panel data analysis approach. Soc. Responsib. J. 18, 68–84. doi:10.1108/srj-04-2020-0156
Edeigba, J., and Arasanmi, C. (2022). An empirical analysis of SMES’ triple bottom line practices. J. Account. Organ. Change 18, 238–259. doi:10.1108/jaoc-12-2020-0206
El Baz, J., Tiwari, S., Akenroye, T., Cherrafi, A., and Derrouiche, R. (2022). A framework of sustainability drivers and externalities for Industry 4.0 technologies using the Best-Worst Method. J. Clean. Prod. 344, 130909. doi:10.1016/j.jclepro.2022.130909
Evans, S., Vladimirova, D., Holgado, M., Van Fossen, K., Yang, M., Silva, E. A., et al. (2017). Business model innovation for sustainability: Towards a unified perspective for creation of sustainable business models. Bus. Strategy Environ. 26, 597–608. doi:10.1002/bse.1939
Fielding, K. S., and Hornsey, M. J. (2016). A social identity analysis of climate change and environmental attitudes and behaviors: Insights and opportunities. Front. Psychol. 7, 121. doi:10.3389/fpsyg.2016.00121
Fornell, C., and Larcker, D. F. (1981). Evaluating structural equation models with unobservable variables and measurement error. J. Mark. Res. 18, 39–50. doi:10.2307/3151312
França, C. L., Broman, G., Robèrt, K.-H., Basile, G., and Trygg, L. (2017). An approach to business model innovation and design for strategic sustainable development. J. Clean. Prod. 140, 155–166. doi:10.1016/j.jclepro.2016.06.124
Franceschelli, M. V., Santoro, G., and Candelo, E. (2018). Business model innovation for sustainability: A food start-up case study. Br. Food J. 120, 2483–2494. doi:10.1108/bfj-01-2018-0049
Geissdoerfer, M., Morioka, S. N., De Carvalho, M. M., and Evans, S. (2018). Business models and supply chains for the circular economy. J. Clean. Prod. 190, 712–721. doi:10.1016/j.jclepro.2018.04.159
Hair, J. F., Ringle, C. M., and Sarstedt, M. (2014). PLS-SEM: Indeed a silver bullet. J. Mark. Theory Pract. 19, 139–152. doi:10.2753/mtp1069-6679190202
Hair, J. F., Risher, J. J., Sarstedt, M., and Ringle, C. M. (2019). When to use and how to report the results of PLS-SEM. Eur. Bus. Rev. 31, 2–24. doi:10.1108/ebr-11-2018-0203
Hair JR, J. F., Hult, G. T. M., Ringle, C. M., and Sarstedt, M. (2021). A primer on partial least squares structural equation modeling (PLS-SEM). New York: Sage publications.
Hein, A. M., Jankovic, M., Feng, W., Farel, R., Yune, J. H., and Yannou, B. (2017). Stakeholder power in industrial symbioses: A stakeholder value network approach. J. Clean. Prod. 148, 923–933. doi:10.1016/j.jclepro.2017.01.136
Henseler, J., Ringle, C. M., and Sarstedt, M. (2015). A new criterion for assessing discriminant validity in variance-based structural equation modeling. J. Acad. Mark. Sci. 43, 115–135. doi:10.1007/s11747-014-0403-8
Heyes, G., Sharmina, M., Mendoza, J. M. F., Gallego-Schmid, A., and Azapagic, A. (2018). Developing and implementing circular economy business models in service-oriented technology companies. J. Clean. Prod. 177, 621–632. doi:10.1016/j.jclepro.2017.12.168
Hong, J.-C., Lin, P.-H., and Hsieh, P.-C. (2017). The effect of consumer innovativeness on perceived value and continuance intention to use smartwatch. Comput. Hum. Behav. 67, 264–272. doi:10.1016/j.chb.2016.11.001
Isik, C., Ongan, S., Ozdemir, D., Ahmad, M., Irfan, M., Alvarado, R., et al. (2021). The increases and decreases of the environment Kuznets curve (EKC) for 8 OECD countries. Environ. Sci. Pollut. Res. 28, 28535–28543. doi:10.1007/s11356-021-12637-y
IşıK, C., Sirakaya-Turk, E., and Ongan, S. (2020). Testing the efficacy of the economic policy uncertainty index on tourism demand in USMCA: Theory and evidence. Tour. Econ. 26, 1344–1357. doi:10.1177/1354816619888346
IşıK, C. (2013). The importance of creating a competitive advantage and investing in information technology for modern economies: An ARDL test approach from Turkey. J. Knowl. Econ. 4, 387–405. doi:10.1007/s13132-011-0075-2
Kurucz, E. C., Colbert, B. A., Lüdeke-Freund, F., Upward, A., and Willard, B. (2017). Relational leadership for strategic sustainability: Practices and capabilities to advance the design and assessment of sustainable business models. J. Clean. Prod. 140, 189–204. doi:10.1016/j.jclepro.2016.03.087
Lee, K.-H., Noh, J., and Khim, J. S. (2020). The blue economy and the united nations’ sustainable development goals: Challenges and opportunities. Environ. Int. 137, 105528. doi:10.1016/j.envint.2020.105528
Legris, P., Ingham, J., and Collerette, P. (2003). Why do people use information technology? A critical review of the technology acceptance model. Inf. Manag. 40, 191–204. doi:10.1016/s0378-7206(01)00143-4
Li, H., and Liu, Y. (2014). Understanding post-adoption behaviors of e-service users in the context of online travel services. Inf. Manag. 51, 1043–1052. doi:10.1016/j.im.2014.07.004
Lichtenthaler, U. (2022). Explicating a sustainability-based view of sustainable competitive advantage. J. Strategy Manag. 15, 76–95. doi:10.1108/jsma-06-2021-0126
López-Concepción, A., Gil-Lacruz, A. I., and Saz-Gil, I. (2022). Stakeholder engagement, csr development and sdgs compliance: A systematic review from 2015 to 2021. Corp. Soc. Responsib. Environ. Manag. 29, 19–31. doi:10.1002/csr.2170
Lozano, R. (2018). Sustainable business models: Providing a more holistic perspective. Bus. Strategy Environ. 27, 1159–1166. doi:10.1002/bse.2059
Lüdeke-Freund, F., and Dembek, K. (2017). Sustainable business model research and practice: Emerging field or passing fancy? J. Clean. Prod. 168, 1668–1678. doi:10.1016/j.jclepro.2017.08.093
Lüdeke-Freund, F. (2020). Sustainable entrepreneurship, innovation, and business models: Integrative framework and propositions for future research. Bus. Strategy Environ. 29, 665–681. doi:10.1002/bse.2396
Ma, Y., Zhang, Q., and Yin, H. (2020). Environmental management and labor productivity: The moderating role of quality management. J. Environ. Manag. 255, 109795. doi:10.1016/j.jenvman.2019.109795
Morioka, S. N., Bolis, I., Evans, S., and Carvalho, M. M. (2017). Transforming sustainability challenges into competitive advantage: Multiple case studies kaleidoscope converging into sustainable business models. J. Clean. Prod. 167, 723–738. doi:10.1016/j.jclepro.2017.08.118
Neumeyer, X., and Santos, S. C. (2018). Sustainable business models, venture typologies, and entrepreneurial ecosystems: A social network perspective. J. Clean. Prod. 172, 4565–4579. doi:10.1016/j.jclepro.2017.08.216
Northcutt, N., and Mccoy, D. (2004). Interactive qualitative analysis: A systems method for qualitative research. Los Angeles: Sage.
Oliver, R. L. (1980). A cognitive model of the antecedents and consequences of satisfaction decisions. J. Mark. Res. 17, 460–469. doi:10.2307/3150499
Oliver, R. L. (1993). Cognitive, affective, and attribute bases of the satisfaction response. J. consumer Res. 20, 418–430. doi:10.1086/209358
Piscicelli, L., Ludden, G. D. S., and Cooper, T. (2018). What makes a sustainable business model successful? An empirical comparison of two peer-to-peer goods-sharing platforms. J. Clean. Prod. 172, 4580–4591. doi:10.1016/j.jclepro.2017.08.170
Rahi, S., and Ghani, M. A. (2019). Integration of expectation confirmation theory and self-determination theory in internet banking continuance intention. J. Sci. Technol. Policy Manag. 10, 533–550. doi:10.1108/jstpm-06-2018-0057
Reinhardt, R., Christodoulou, I., García, B. A., and Gasso-Domingo, S. (2020). Sustainable business model archetypes for the electric vehicle battery second use industry: Towards a conceptual framework. J. Clean. Prod. 254, 119994. doi:10.1016/j.jclepro.2020.119994
Ringle, C. M., Wende, S. V. E. N., and Becker, (2015). Boenningstedt: SmartPLS. JAN-MICHAEL 2015. SmartPLS 3.
Ritala, P., Huotari, P., Bocken, N., Albareda, L., and Puumalainen, K. (2018). Sustainable business model adoption among S&P 500 firms: A longitudinal content analysis study. J. Clean. Prod. 170, 216–226. doi:10.1016/j.jclepro.2017.09.159
Sachs, J., Kroll, C., Lafortune, G., Fuller, G., and Woelm, F. (2021). Sustainable development report 2021. Cambridge: Cambridge University Press.
Sachs, J., Kroll, C., Lafortune, G., Fuller, G., and Woelm, F. (2022). Sustainable development report 2022. Cambridge: Cambridge University Press.
Sanders, R. (1987). The pareto principle: Its use and abuse. J. Serv. Mark. 1, 37–40. doi:10.1108/eb024706
Sinha, A., Mishra, S., Sharif, A., and Yarovaya, L. (2021). Does green financing help to improve environmental & social responsibility? Designing SDG framework through advanced quantile modelling. J. Environ. Manag. 292, 112751. doi:10.1016/j.jenvman.2021.112751
Soja, E., and Soja, P. (2017). Exploring root problems in enterprise system Adoption from an employee age perspective: A people-process-technology framework. Inf. Syst. Manag. 34, 333–346. doi:10.1080/10580530.2017.1366218
Sousa-Zomer, T. T., and Cauchick Miguel, P. A. (2018). Sustainable business models as an innovation strategy in the water sector: An empirical investigation of a sustainable product-service system. J. Clean. Prod. 171, S119–S129. doi:10.1016/j.jclepro.2016.07.063
Stubbs, W. (2017). Sustainable entrepreneurship and B corps. Bus. Strategy Environ. 26, 331–344. doi:10.1002/bse.1920
Sukma, N., and Leelasantitham, A. (2022a). A community sustainability ecosystem modeling for water supply business in Thailand. Front. Environ. Sci. 10. doi:10.3389/fenvs.2022.940955
Sukma, N., and Leelasantitham, A. (2022b). Factors affecting adoption of online community water user participation. Hum. Behav. Emerg. Technol. 2022, 1–13. doi:10.1155/2022/1732944
Sukma, N., and Leelasantitham, A. (2022c). The influence and continuance intention of the E-government system: A case study of community water supply business. Front. Environ. Sci. 10. doi:10.3389/fenvs.2022.918981
Sukma, N., and Leelasantitham, A. (2022d). Understanding online behavior towards community water user participation: A perspective of a developing country. PLOS ONE 17, e0270137. doi:10.1371/journal.pone.0270137
Sunmola, F. T., and Javahernia, A. (2021). Manufacturing process innovation deployment readiness from an extended people, process, and technology framework viewpoint. Procedia Manuf. 55, 409–416. doi:10.1016/j.promfg.2021.10.056
Swan, J. E., and Trawick, I. F. (1981). Disconfirmation of expectations and satisfaction with a retail service. J. Retail. 57, 49–67.
Tenenhaus, M., Vinzi, V. E., Chatelin, Y.-M., and Lauro, C. (2005). PLS path modeling. Comput. statistics data analysis 48, 159–205. doi:10.1016/j.csda.2004.03.005
Todeschini, B. V., Cortimiglia, M. N., Callegaro-De-Menezes, D., and Ghezzi, A. (2017). Innovative and sustainable business models in the fashion industry: Entrepreneurial drivers, opportunities, and challenges. Bus. Horizons 60, 759–770. doi:10.1016/j.bushor.2017.07.003
Ullah, F., Qayyum, S., Thaheem, M. J., Al-Turjman, F., and Sepasgozar, S. M. E. (2021). Risk management in sustainable smart cities governance: A TOE framework. Technol. Forecast. Soc. Change 167, 120743. doi:10.1016/j.techfore.2021.120743
Vagin, S. G., Kostyukova, E. I., Spiridonova, N. E., and Vorozheykina, T. M. (2022). Financial Risk Management Based on Corporate Social Responsibility in the Interests of Sustainable Development, 10.Risks
Vaportzis, E., Clausen, M. G., and Gow, A. J. (2017). Older adults perceptions of technology and barriers to interacting with tablet computers: A focus group study. Front. Psychol. 8, 1687. doi:10.3389/fpsyg.2017.01687
Weissbrod, I., and Bocken, N. M. P. (2017). Developing sustainable business experimentation capability – a case study. J. Clean. Prod. 142, 2663–2676. doi:10.1016/j.jclepro.2016.11.009
Woods, N., and Narlikar, A. (2001). Governance and the limits of accountability: The WTO, the IMF, and the world bank. Int. Soc. Sci. J. 53, 569–583. doi:10.1111/1468-2451.00345
Wu, B., and Chen, X. (2017). Continuance intention to use MOOCs: Integrating the technology acceptance model (TAM) and task technology fit (TTF) model. Comput. Hum. Behav. 67, 221–232. doi:10.1016/j.chb.2016.10.028
Yang, M., Evans, S., Vladimirova, D., and Rana, P. (2017). Value uncaptured perspective for sustainable business model innovation. J. Clean. Prod. 140, 1794–1804. doi:10.1016/j.jclepro.2016.07.102
Keywords: sustainable business model, sustainable development goals, interactive qualitative analysis, community engagement, risk management, sustainable production and consumption
Citation: Sukma N and Leelasantitham A (2022) From conceptual model to conceptual framework: A sustainable business framework for community water supply businesses. Front. Environ. Sci. 10:1013153. doi: 10.3389/fenvs.2022.1013153
Received: 06 August 2022; Accepted: 24 October 2022;
Published: 10 November 2022.
Edited by:
Cem Işık, Anadolu University, TurkeyReviewed by:
Gulnaz Muneer, Bahauddin Zakariya University, PakistanManob Das, University of Gour Banga, India
Copyright © 2022 Sukma and Leelasantitham. This is an open-access article distributed under the terms of the Creative Commons Attribution License (CC BY). The use, distribution or reproduction in other forums is permitted, provided the original author(s) and the copyright owner(s) are credited and that the original publication in this journal is cited, in accordance with accepted academic practice. No use, distribution or reproduction is permitted which does not comply with these terms.
*Correspondence: Adisorn Leelasantitham, YWRpc29ybi5sZWVAbWFoaWRvbC5hYy50aA==