 Hui Tang1,2,3*
 Ove Westermoen Haugvaldstad1
 Frode Stordal1
 Jianrong Bi4
 Christine D. Groot Zwaaftink5Henrik Grythe5
 Bin Wang6Zhimin Rao7
 Zhongshi Zhang8,9,10Terje Berntsen1
 Anu Kaakinen2
- 1Department of Geosciences, University of Oslo, Oslo, Norway
- 2Department of Geosciences and Geography, University of Helsinki, Helsinki, Finland
- 3Climate System Research, Finnish Meteorological Institute (FMI), Helsinki, Finland
- 4College of Atmospheric Sciences, Lanzhou University, Lanzhou, China
- 5Norwegian Institute for Air Research (NILU), Kjeller, Norway
- 6School of Geography and Tourism, Shaanxi Normal University, Xi’an, China
- 7School of Electrical and Information Engineering, North Minzu University, Yinchuan, China
- 8Department of Atmospheric Science, School of Environmental Studies, China University of Geoscience, Wuhan, China
- 9School of Geographic Science, Nantong University, Nantong, China
- 10NORCE Norwegian Research Centre, Bjerknes Centre for Climate Research, Bergen, Norway
The 2021 East Asia sandstorm began from the Eastern Gobi desert steppe in Mongolia on March 14, and later spread to northern China and the Korean Peninsula. It was the biggest sandstorm to hit China in a decade, causing severe air pollution and a significant threat to human health. Capturing and predicting such extreme events is critical for society. The Lagrangian particle dispersion model FLEXPART and the associated dust emission model FLEXDUST have been recently developed and applied to simulate global dust cycles. However, how well the model captures Asian dust storm events remains to be explored. In this study, we applied FLEXPART to simulate the recent 2021 East Asia sandstorm, and evaluated its performance comparing with observation and observation-constrained reanalysis datasets, such as the Modern-Era Retrospective analysis for Research and Applications, Version 2 (MERRA-2) and CAMS global atmospheric composition forecasts (CAMS-F). We found that the default setting of FLEXDUST substantially underestimates the strength of dust emission and FLEXPART modelled dust concentration in this storm compared to that in MERRA-2 and CAMS-F. An improvement of the parametrization of bare soil fraction, topographical scaling, threshold friction velocity and vertical dust flux scheme based on Kok et al. (Atmospheric Chemistry and Physics, 2014, 14, 13023–13041) in FLEXDUST can reproduce the strength and spatio-temporal pattern of the dust storm comparable to MERRA-2 and CAMS-F. However, it still underestimates the observed spike of dust concentration during the dust storm event over northern China, and requires further improvement in the future. The improved FLEXDUST and FLEXPART perform better than MERRA-2 and CAMS-F in capturing the observed particle size distribution of dust aerosols, highlighting the importance of using more dust size bins and size-dependent parameterization for dust emission, and dry and wet deposition schemes for modelling the Asian dust cycle and its climatic feedbacks.
1 Introduction
Mineral dust aerosols have a large impact on climate, ecosystem functioning and human health (Huang et al., 2014; Li et al., 2022b). Dust can both scatter and absorb solar radiation (Li et al., 2022a), with a net negative radiative impact of dust being widely documented, especially over the dust source regions (Myhre and Stordal, 2001; Myhre et al., 2003). The direct radiation effect of dust accounts for a substantial fraction of the total dust aerosol feedback in the climate system (Li et al., 2021; Kok et al., 2018). Dust can also exert an indirect radiative effect by aerosol-cloud interactions. It can either serve as cloud condensation nuclei (CCN) that increase cloud cover and exert a net negative radiative impact (Jia et al., 2021), or modify the vertical profile of temperature and thus relative humidity and stability of the atmosphere, likely inducing less clouds and a net positive radiative impact (Huang et al., 2014). Better understanding the natural processes of the dust cycle is essential for estimating and projecting its climatic, ecological and societal impacts in the future, and providing guidance to alleviate the issues caused by severe dust storms.
Dust models describing dust emission, transport and deposition, are important tools for understanding the dust cycles. As part of the aerosol module, it has been implemented in many global and regional Earth system models or weather forecast models to describe complex dust aerosol feedbacks in the Earth system and provide a forecast of dust storms (Kok et al., 2014; Checa-Garcia et al., 2021). Most dust models capture the spatial patterns and seasonal cycles of global dust processes well. But large uncertainties and inter-model differences remain, particularly with regard to dust emission, and the dust seasonal cycles over North China and North America (Zeng et al., 2020; Zhao et al., 2022). Observations, especially remotely sensed aerosol optical depth, have been assimilated to improve dust modelling (Gong and Zhang, 2008; Benedetti et al., 2019; Randles et al., 2017). Nevertheless, dust emission and deposition are still poorly constrained in these models.
Off-line Lagrangian dispersion models that can trace the movement of an air parcel or particles in the atmopshere, provide an alternative way to study dust cycles. They do not include dust-climate feedbacks, and therefore can be focused on the dust emission and deposition processes (Sodemann et al., 2015). They can be run in both forward and backward modes and are particularly efficient for studying dust processes by comparing with site observations. Since these models use a numerically non-diffusive Lagrangian particle solver, they exhibit much less numerical diffusion than the grid-based Eulerian approach (Cassiani et al., 2016; Ramli and Esler, 2016) which is commonly employed in the weather prediction models or Earth system models. When the meteorological forcing data are available, these models require much less computing resources, and therefore allow for high-resolution representation of dust particle size bins in the simulation. However, there has been few Lagrangian trajectory models that implement dust emission and deposition schemes to properly describe the full dust cycle (Sodemann et al., 2015; Mallia et al., 2017). The Lagrangian particle dispersion model FLEXPART and the associated dust emission model FLEXDUST is one of the few models that can simulate the full global dust cycle and high-latitude regions in particular (Sodemann et al., 2015; Groot Zwaaftink et al., 2017, 2016; Zamora et al., 2022). The model has also been shown valuable in modelling regional dust events (Groot Zwaaftink et al., 2022), but its application to modelling extreme dust storms in specific regions, like East Asia, remains to be tested.
East Asia is one of the natural hot spots for dust storms (Shao and Dong, 2006; Chen et al., 2017). The emitted dust from the desert regions in central Asia, such as the Taklimakan and Gobi deserts, can give rise to strong episodic dust storms swiping over East Asia, and sometimes, even being transported to North America (Uno et al., 2009) and high Arctic regions (Huang et al., 2015). Asian dust storms mostly occur in spring, due to drier soil conditions, strong wind and cold surges in the season (Shao and Dong, 2006). The frequency of Asian dust storm events has decreased rapidly in the past decades, particularly over northern China, which has been attributed to the weakened temperature gradients and decreased zonal winds in spring and winter associated with the enhanced warming in the Arctic (Liu et al., 2019). In addition, the large-scale vegetation restoration projects in the arid regions of northern China have also contributed to the recent inhibition of dust emission (Wang et al., 2021).
Contrary to the long-term decline of the Asian dust storms, the 2021 East Asia sandstorm (Figure 1), beginning from the Eastern Gobi desert steppe in Mongolia on 14 March, and later spreading over North China and the Korean Peninsula, was the most severe sandstorm to hit China in a decade (Filonchyk, 2022). It has been found that the barer, drier and more loosened soil due to the anomalous early snow melting and a lack of precipitation in spring over the dust source region, together with the exceptionally strong Mongolian cyclone developed over the source region (i.e., central and eastern Mongolia), had triggered the emission and transport of enormous amounts of dust to East Asia during this event (Gui et al., 2022; Yin et al., 2022). The 2021 East Asia sandstorm has provided a unique testbed for dust modelling, particularly in regard to dust emission schemes which has the largest uncertainties (Jin et al., 2022; Wang et al., 2022). The ability of dust models in reproducing such extreme dust events will be critical for understanding the causes and projecting the occurrences of such extreme events in the future.
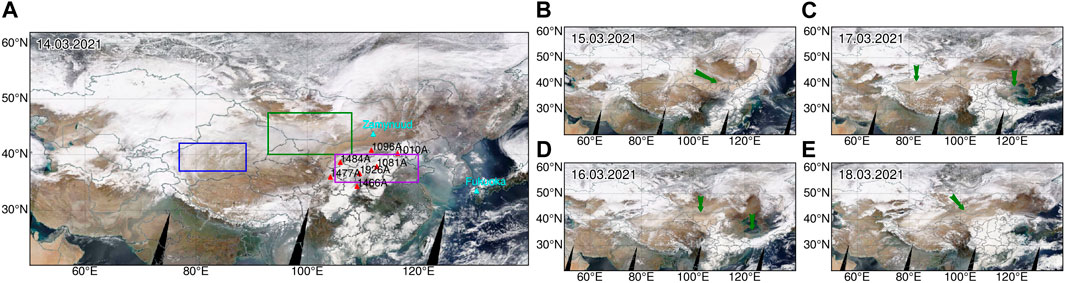
FIGURE 1. Terra MODIS true color image showing the 2021 East Asia dust storm event during March 14-18, 2021 (A–E) (from: https://worldview.earthdata.nasa.gov). The green arrows denotes the dust storm visible from the images. The red triangles in (A) denote the sites for the backward simulations of FLEXPART and the observation sites used in Figure 5. The blue triangles in (A) denote the observation sites used in Figure 6. The blue, green and purple boxes in (A) denote the Taklimakan Desert (TA), Gobi Desert (GB), and North China (NC) used in Table 2, respectively.
In this study, we applied FLEXDUST and FLEXPART to simulate the 2021 East Asia dust storm event. We focus on evaluating and improving the performance of FLEXDUST and FLEXPART in reproducing the strength and spatio-temporal pattern of the dust cycle during the event as shown by available observation and observation-constrained reanalysis data. In Section 2, we introduce the FLEXDUST and FLEXPART models and the observation and reanalysis data used in this study. In Section 3, we examine the ability of FLEXDUST and FLEXPART in depicting dust emission, concentration and deposition during the dust storm event. In Section 4, the consistency between forward and backward FLEXPART simulations in simulating dust concentration at individual sites are analyzed, followed by the discussion on the biases of FLEXDUST and FLEXPART in representing the spike of dust concentration during the dust storm event, and their comparison with the reanalysis data. The results of this study are expected to provide valuable insights into further development and application of FLEXDUST and FLEXPART for studying the Asian dust cycles on longer time scales.
2 Materials and methods
2.1 FLEXPART and FLEXDUST
We used a recent FLEXPART development branch (v10.4-36-g1228ef7) based on version 10.4 (Pisso et al., 2019) (access from: https://www.flexpart.eu/browser/flexpart.git). Compared to the previous model versions, FLEXPART version 10.4 has been improved in several aspects, including a new turbulence scheme for the convective boundary layer considering the skewness in the vertical velocity distribution and vertical air density gradient, a new gravitational settling parameterization for aerosols, a rewritten wet deposition scheme based on cloud information from the meteorological input fields, and a new dust mobilization tool (i.e., FLEXDUST) to work with FLEXPART for simulating the full dust cycle. More details about these improvements and available options for these processes can be found in Pisso et al. (2019). In this study, the original FLEXPART code was only adapted for using new meteorological forcing.
FLEXDUST is a stand-alone dust emission model that can provide mineral dust emissions as gridded output or release files which contain the position and number of dust particles emitted at each time step that can be directly read by FLEXPART as input (Groot Zwaaftink et al., 2016). Depending on the types of FLEXPART simulations, FLEXDUST can be used as either a preprocessing tool providing release files for the forward simulation of FLEXPART, or a postprocessing tool yielding gridded output that can work together with the output of the backward simulation of FLEXPART to estimate dust concentration or deposition at a receptor point. The vertical dust flux in FLEXDUST is estimated based on Marticorena and Bergametti (1995) by default. A soil texture-dependent minimum threshold friction velocity for wind erosion according to Shao and Lu (2000) is assumed for dust emission to occur. The dust emission rate is further scaled by the erodibility of the surface, which is parameterized according to the bare ground fraction estimated using land cover data from Global Land Cover by National Mapping Organizations (GLCNMO), topographic depressions using Eq. 1 (Ginoux et al., 2001), as well as soil moisture and snow cover. We refer to Groot Zwaaftink et al. (2016) for more detailed description of FLEXDUST.
In this study, we used the most recent version of FLEXDUST (https://git.nilu.no/christine/flexdust, commit: e60cabd). For the default setting experiment (referred to as FLEXDUST-default hereafter), the model was only modified to use new meteorological forcing, and write specific output. In addition, soil texture data from World Soil Information (ISRIC) (Poggio et al., 2021) and land cover data from GLCNMO version 3 (Kobayashi et al., 2017) were used, following the study by Haugvaldstad (2021) who found that the update of soil texture data is necessary for capturing the dust source regions in Asia.
For the improved setting experiment (referred to as FLEXDUST-update), we further improved the model in the following aspects to reduce the biases in simulating dust emission.
(1) Default topographic scaling accounting for the potential influence of local topography on the erodibility of soil in FLEXDUST is based on Ginoux et al. (2001) (see Eq. 1).
Here zi is the local elevation, zmax and zmin are the maximum and minimum elevation in a 10° × 10° area. A 10° × 10° box is commonly used when topographical data are on coarse spatial resolution. But when topographical data have high spatial resolution, local depressions at finer scale can be missed by this definition. Therefore, we used different sizes of the box to derive a topographic scaling S similar to the approach proposed for creating global Sand and Dust Storms Source Base-map (https://maps.unccd.int/sds/).
where S9 × 9, S6 × 6, S3 × 3 and S1.2 × 1.2 are topographic scaling factors using 9°, 6°, 3°, and 1.2°boxes, respectively.
(2) In FLEXDUST-default, the land cover types that could emit dust are limited to bare ground, and sparse vegetation types in GLCNMO classification scheme. It has, however, been widely observed that both herbaceous and crop land cover types in GLCNMO may have at least seasonal dust emission, especially in winter and spring. Hence, we expand the land cover types in GLCNMO that can contribute to bare ground fraction and thus dust emission in FLEXDUST-update. The total effect of the updates (1) and (2) on the erodibility is shown in Figure 2.
(3) In FLEXDUST, the threshold friction velocity u*t is calculated using the expression from Shao and Lu (2000):
where ρp and ρa are density of dust particle and air, respectively. dp is particle diameter, g is acceleration due to gravity. The parameters An = .0123 and γ = 2.9 × 10⁴ kg/s2 are from Shao and Lu (2000) in FLEXDUST-default. In FLEXDUST-update, we modified An to .0025 to lower the threshold friction velocity for dust emission.
(4) The default scheme describing vertical dust fluxes from the surface is based on Marticorena and Bergametti (1995) (referred to as MB95 scheme) and is used in FLEXDUST-default. In contrast, the scheme based on Kok et al. (2014) (referred to as KOK14) is used in FLEXDUST-update. We note that different global tuning factors have been used in the MB95 scheme (4.8 × 10⁻⁴) and the KOK14 scheme (4.8 × 10⁻³) to produce comparable results.
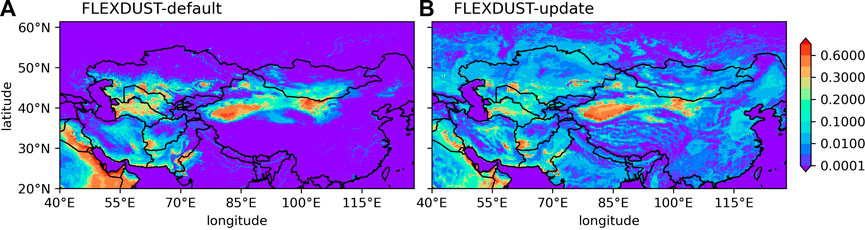
FIGURE 2. Erodibility of the default FLEXDUST (FLEXDUST-default) (A) and updated FLEXDUST (FLEXDUST-update) (B).
2.2 Model experiments
The 3-hourly meteorological forcings for both FLEXDUST and FLEXPART are derived from the fifth generation atmospheric reanalysis of the global climate (ERA5) produced by the European Centre for Medium-Range Weather Forecasts (ECMWF) (Hersbach et al., 2018) using Flex_extract (version 7.0.4, downloaded from: https://www.flexpart.eu/wiki/FpInputMetEcmwf), a pre-processing tool developed for preparing the GRIB files needed by FLEXDUST and FLEXPART from the ECMWF Meteorological Archival and Retrieval System (Tipka et al., 2020). The domain of the meteorological forcing in our application covers 10–160° east longitude and 10–80° north latitude with 30 km horizontal resolution (T639) and 137 vertical levels from surface to .01 hPa (80 km).
In this study, both FLEXDUST-default and FLEXDUST-update were run for the whole month of March in 2021 with spatial resolution of .1° covering the major dust source regions (20°–62° north latitude and 40°-128° east longitude), and temporal resolution of 1 h. The emitted dust particles are assumed to be spherical, and are represented by 10 size bins (see Table 1). The volume size distribution of the 10 size bins follows the brittle fragmentation theory according to Kok (2011) (see Supplementary Figure S1) and is assumed to be independent of soil texture and wind conditions as saltation and sand-blasting have been considered as the main mechanisms contributing to dust emission.
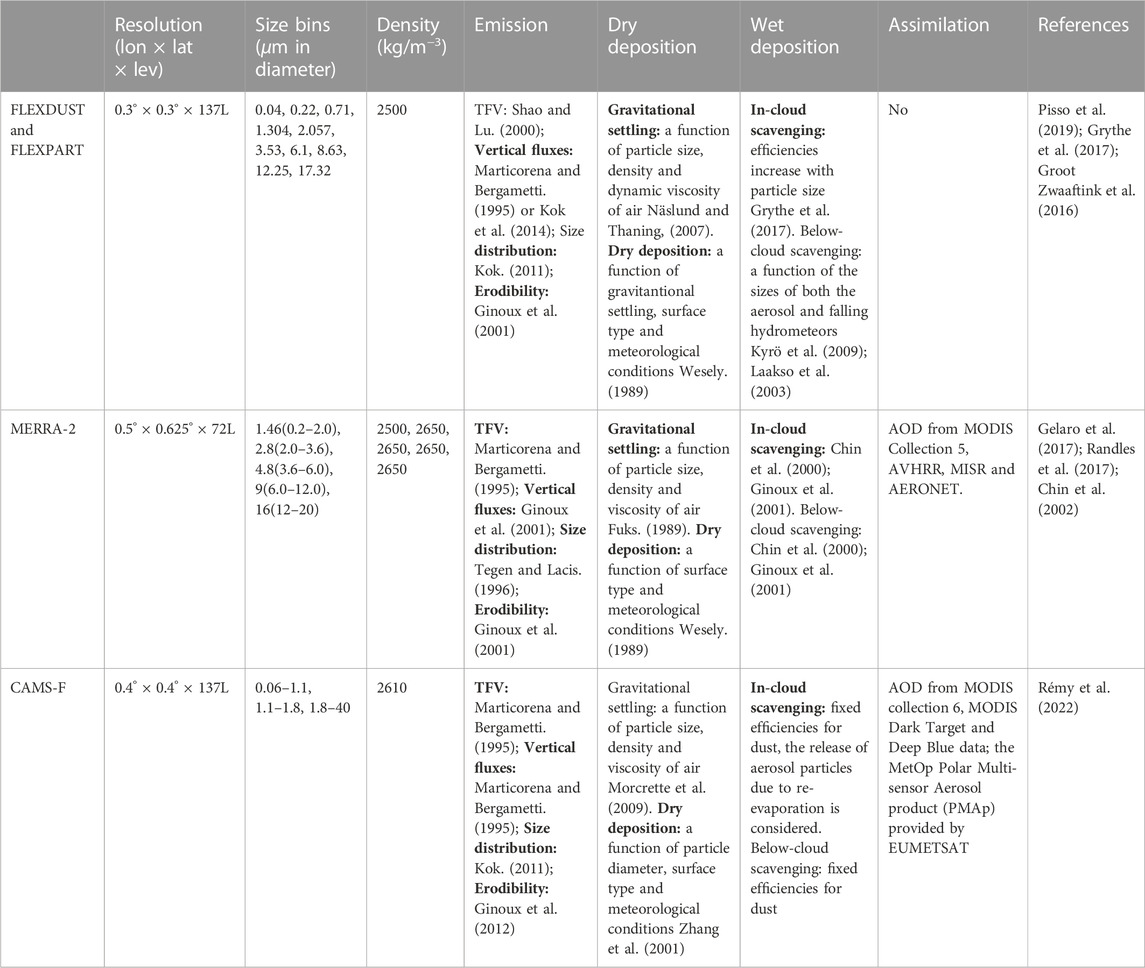
TABLE 1. Summary of the settings for dust modelling in FLEXDUST and FLEXPART, MERRA-2 and CAMS-F.
FLEXPART was run in both forward and backward modes in this study. Results are independent of whether the model is run forward or backward in time. Direction of modelling is therefore chosen based on what is numerically efficient and what analyses are desired. The forward simulation (referred to as FLEXPART-F) started on 01.03.2021 well before the dust storm events (14-18.03.2021) to capture the potential contribution of long-living dust aerosols (
Backward FLEXPART simulations (referred to as FLEXPART-B) were setup for specific receptor sites. In each simulation, computational dust tracer particles were released at hourly intervals throughout the dust storm event (from 10.03.2021 to 20.03.2021). Following the release at the receptor, the particles were traced backwards in time for 10 days (240 h), which has been shown to be sufficient for capturing the Asian dust cycle (Haugvaldstad, 2021). The output of FLEXPART-B is the emission sensitivity (ES) which corresponds to a distribution of all possible dust sources that could influence the dust concentration at the receptor location at a given time interval over the 10 days backward period. The predefined output region of ES is at a resolution of .1°covering 25°–65° latitude and 50°–128° longitude. The ES is then combined with the dust emission field from FLEXDUST with the same time stamp and summed up temporally over the 10 days backward period to yield a map of source contribution (SC) at a given time (see Eq. 4). Summing up the (SC) spatially over the output domain then gives the concentration at the receptor at specific time interval (1-hourly averaged). The details of the FLEXPART-B derivation and how it is related to FLEXPART-F are described in Seibert and Frank (2004).
where ESr is the emission sensitivity field (unit: s) for a receptor from FLEXPART-B simulation. E is the emission field from FLEXDUST (unit: kgm−2s−1). H = 100 is the hight (m) of the surface atmospheric level where ESr is derived. SCr is the source contribution (unit: kgm−3) for a receptor. t and bt denote the time when particles are released from the receptor, and the backward tracing time (unit: hour), respectively. j and i are the indices of latitude and longitude of a grid cell, respectively.
In FLEXPART-B, the same 10 dust size bins as in FLEXPART-F were simulated individually to generate ES for each dust size bin. The emission of each dust size bin was derived by scaling the total emission with their volumetric fraction assumed in FLEXDUST (See Supplementary Figure S1), so that the variations of emission in space and time were taken into account equally in FLEXPART-B and FLEXPART-F simulations. Summing up the estimated dust concentration of each size bin at a receptor gives the total dust concentration and also the distribution of the 10 dust size bins at a receptor. There are in total 7 receptor sites across North China chosen for the FLEXPART-B simulations (see Figure 1), as they cover the area that experienced the most severe dust storm during the event, and also show certain differences in the timing and strength of the dust storm along the west-east and north-south gradient.
2.3 Reanalysis and observation dataset
2.3.1 MERRA-2 and CAMS-F
To evaluate the performance of FLEXDUST and FLEXPART in depicting the full dust cycle of the 2021 East Asia dust storm, the Modern-Era Retrospective Analysis for Research and Applications, version 2 (MERRA-2) produced by the NASA’s Global Modeling and Assimilation Office (Gelaro et al., 2017) and the global atmospheric composition forecast (referred to as CAMS-F) produced by the Copernicus Atmosphere Monitoring Service (Inness et al., 2019) were used. MERRA-2 was generated using the Goddard Earth Observation System (GEOS-5) with a 3D variational data assimilation system that assimilates aerosol optical depth (AOD) from various ground- and space-based remote sensing platforms, improving estimates of aerosol properties over the simulations without AOD assimilation (Randles et al., 2017). MERRA-2 has an hourly output on spatial resolution of .5° × .625° and 72 hybrid-eta levels from the surface to .01 hPa. The dust emission scheme in MERRA-2 is based on Ginoux et al. (2001) and Marticorena and Bergametti (1995) using five size bins (Table 1). The dry and wet deposition are based on the GOCART aerosol module (Ginoux et al., 2001; Chin et al., 2002). It has been demonstrated that MERRA-2 is capable of characterizing the three-dimensional evolution of dust aerosols in East Asia and Sahara (Buchard et al., 2017; Yao et al., 2020) comparing with satellite and ground-based observations.
CAMS-F uses the Integrated Forecasting System (IFS) that also produces ECMWF weather forecasts, but with additional modules enabled for aerosols, reactive gases and greenhouse gases that have been developed within CAMS (Rémy et al., 2022). It provides the estimation of dust aerosols with three size bins (Table 1) and the spatial resolution of .45° × .45° and 137 vertical levels. CAMS-F does not assimilate observations throughout the prediction period. It, however, starts every 12 h with initial conditions obtained by combining a previous forecast with the satellite retrievals of many atmospheric constituents including AOD from different remote sensing platforms through data assimilation. CAMS-F, in 48 h projection, has been shown to capture the Asian dust cycle (especially the dust AOD) better than the unconstrained model when comparing with observations (Benedetti et al., 2019). We use CAMS-F instead of the CAMS global reanalysis (known as EAC4) which assimilates observations at each time step, because CAMS-F does not only provide the dust aerosol mixing ratio and optical depth, but also emission, dry and wet deposition rates which are absent in EAC4. This allows us to better quantify the full dust cycle during the dust storm. Details of the dust emission, and dry and wet deposition schemes used in CAMS-F are summarized in Table 1.
2.3.2 Observation dataset
2.3.2.1 PM10 concentrations from the CNEMC network
Hourly averaged PM10 (Particle matter with an aerodynamic diameter smaller than 10 μ m) for different sites in northern China (Figure 1) were obtained from the air quality monitoring network operated by China National Environmental Monitoring Center (CNEMC). The dataset was created in 2013 and is constantly updated thereafter. The method for measuring PM10 is described by the National Environmental Protection Standards HJ 653–2013 (MEP, 2013). The air quality monitoring stations are located at least 50 m from any noticeable stationary sources of pollution, and instrument inlets were located at least 1 m above the roof of a building or wall.
2.3.2.2 Particle size distrisbution
At the Semi-Arid Climate and Environment Observatory of Lanzhou University (SACOL) (1477A in Figure 1), a GRIMM Optical Aerosol Spectrometer (model EDM180) has been devised to simultaneously measure dust particle size distribution and mass concentrations (e.g., PM10, PM2.5, and PM1.0) based on the principle of light scattering with scattering angle of 0°–90°. It can provide 31 size bins ranging from .25 to 32 μm. The measurement range and accuracy of mass concentration are expected to be .1-6000 and .2 μg.m−3, respectively. An automatic Nafion isothermal dehumidification system is installed inside the sampling tube, which could effectively retain some semivolatile aerosol compounds. The sample flow rate is 1.2 L/min and the measurement uncertainty of the dust size distribution is ±5% of the maximum range (Grimm and Eatough, 2009). Since the station is well selected to be representative of the region (Huang et al., 2008), we consider the uncertainties caused by spatial heterogeneity to be small. The size distribution of dust aerosol measured during the 2021 East Asia dust storm event was used in this study to compare with the modelled distribution of different dust size bins.
2.3.2.3 Ground-based lidar observation
The Asian dust and aerosol lidar observation network (AD-Net) (Shimizu et al., 2004) is a lidar network continuously monitoring the vertical profile of dust and other aerosols with high temporal (15 min) and vertical (30 m) resolution in real time. Over more than 20 sites in East Asia are included in AD-Net. The standard lidar system at each site is a two-wavelength (1,064 nm, 532 nm) polarization sensitive Mie-scattering lidar. In this study, we chose one site close to the dust source region (Zamynuud in Mongolia) and one site located in the deposition region (Fukuoka in Japan) to evaluate the vertical dust profile simulated by FLEXDUST and FLEXPART. The data was downloaded from: https://www-lidar.nies.go.jp/AD-Net/. The geographical locations of the two sites are shown in Figure 1. The variables used in this study were the 532 nm aerosol extinction coefficient and attenuated backscatter coefficient. For more details on the processing of lidar data from AD-Net and its quality control, we refer to the original data website.
3 Results
3.1 Dust source of the 2021 East Asia dust storm
Figure 3 shows daily averaged dust emission during the dust storm event (13-17.03.2021) simulated by FLEXDUST-update, along with MERRA-2 and CAMS-F. All the models show the strongest dust emission over the Gobi Desert (especially the Eastern Gobi desert steppe) at the start of the dust storm event (14.03.2021). Later on, the center of high dust emission moved westward with weakened dust emission in the Gobi Desert, but enhanced dust emission in the Taklimakan desert. FLEXDUST-default seriously underestimates dust emission compared to MERRA-2 and CAMS-F (Supplementary Figure S2). In particular, dust emissions from the Taklimakan desert and eastern Inner Mongolia are missing throughout the dust storm event. In comparison, FLEXDUST-update shows persistently high dust emission in both the Taklimakan desert and Qaidam basin (Figure 3), which is more consistent with MERRA-2 and CAMS-F. The strength of emission over the main dust source regions (e.g., Gobi and Taklimakan deserts) is the strongest in CAMS-F while FLEXDUST-update and MERRA-2 are similar to each other (Table 2). FLEXDUST-update still shows slightly lower emission over North China than CAMS-F and MERRA-2.
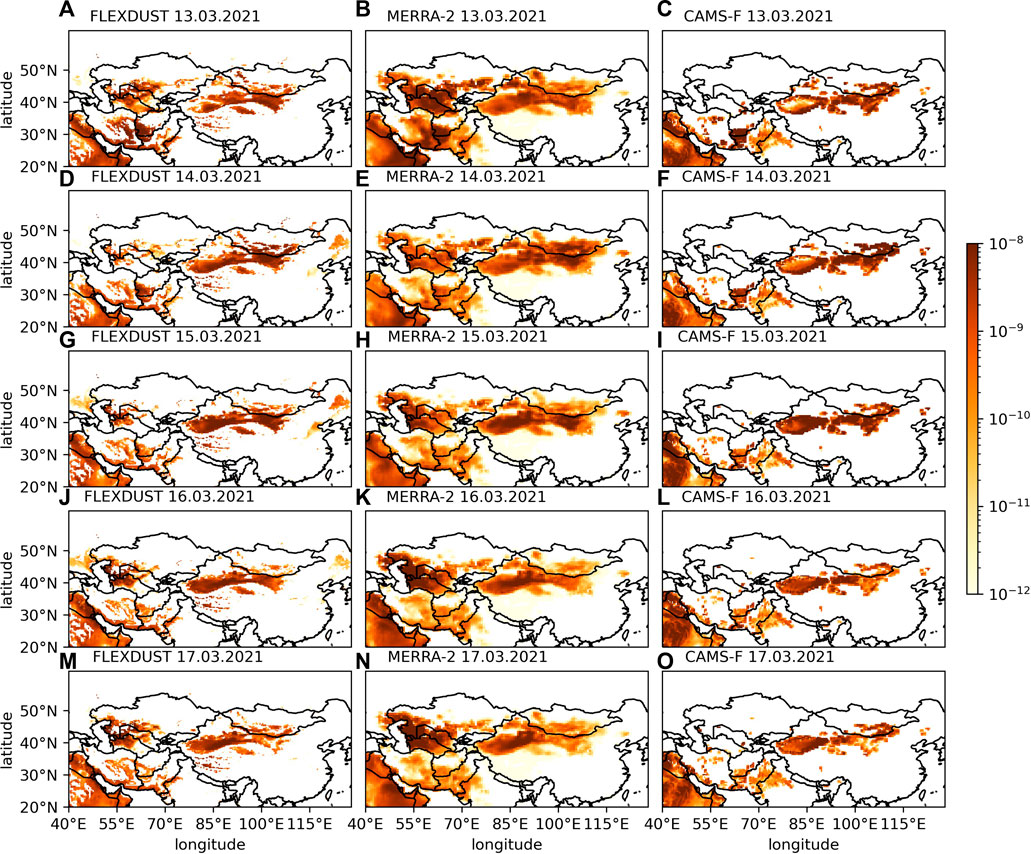
FIGURE 3. Daily average of dust emission (kg m−2 s−1) during the dust storm event, each of the days from 13.03 to 17.03.2021. (A,D,G,J,M) FLEXDUST-update, (B,E,H,K,N) MERRA-2, (C,F,I,L,O) CAMS-F. Dust emission of FLEXDUST-default using MB95 scheme is shown in Supplementary Material.
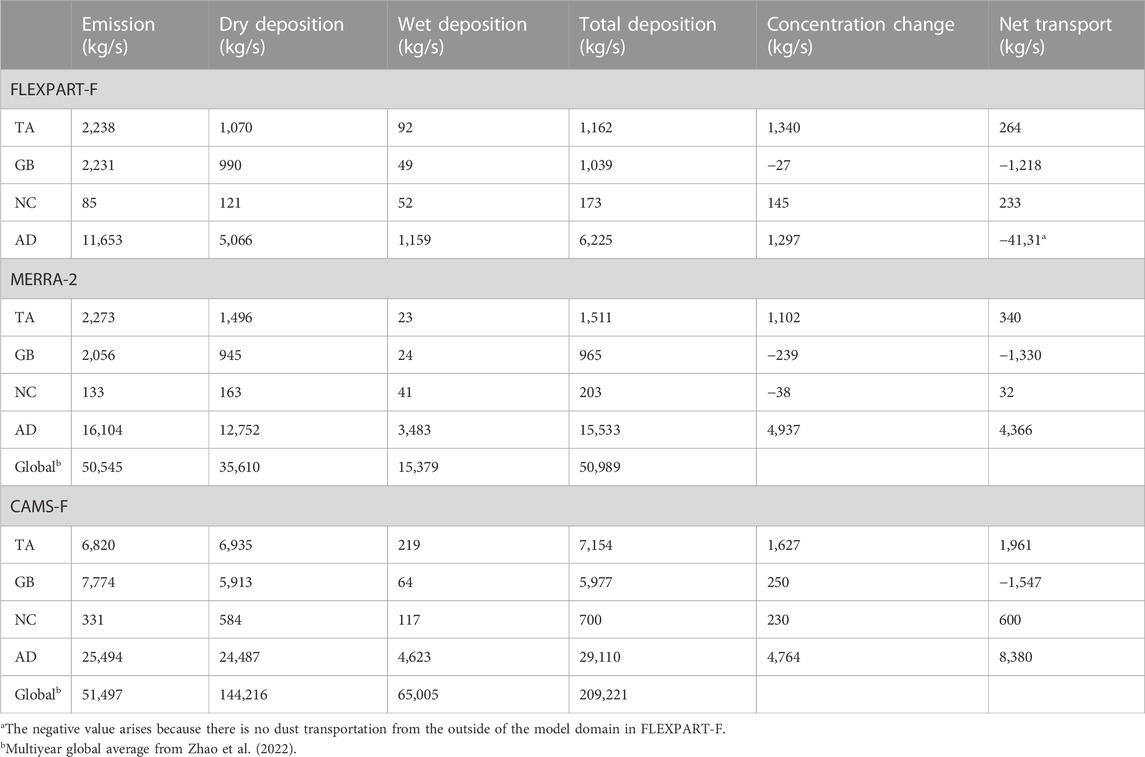
TABLE 2. Dust budget over the major dust source and deposition regions during the 2021 East Asia dust storm event (14/03/2021 00:00 - 18/03/2021 00:00, Beijing time). TA: Taklimakan desert (77–89°E, 37–42°N), GB: Gobi desert (93–108°E, 40–47.5°N), NC: North China (105–120°E, 35–40°N), AD: Asian domain (50–140°E, 20–65°N).
3.2 Dust concentration of the 2021 East Asia dust storm
Figure 4 illustrates vertically integrated total dust concentration simulated by FLEXPART-F using the emission from FLEXDUST-update. Similar to CAMS-F and MERRA-2, the highest total dust concentration over the dust source region (Taklimakan and Gobi deserts) is well depicted in FLEXPART. In addition, the movement of the high dust concentration belt swiping from Mongolia at the beginning of the dust storm event to northern China and southern Japan in the later stage of the dust storm event (Figure 4), as observed in MERRA-2 and CAMS-F as well as the satellite image (Figure 1), is also captured in FLEXPART-F. In contrast, FLEXPART-F using the emission from FLEXDUST-default shows much lower total dust concentration than that in MERRA-2 and CAMS-F (Supplementary Figure S3). In general, the spatio-temporal pattern of total dust concentration in FLEXPART-F is more similar to that in CAMS-F than in MERRA-2. While MERRA-2 shows dust (
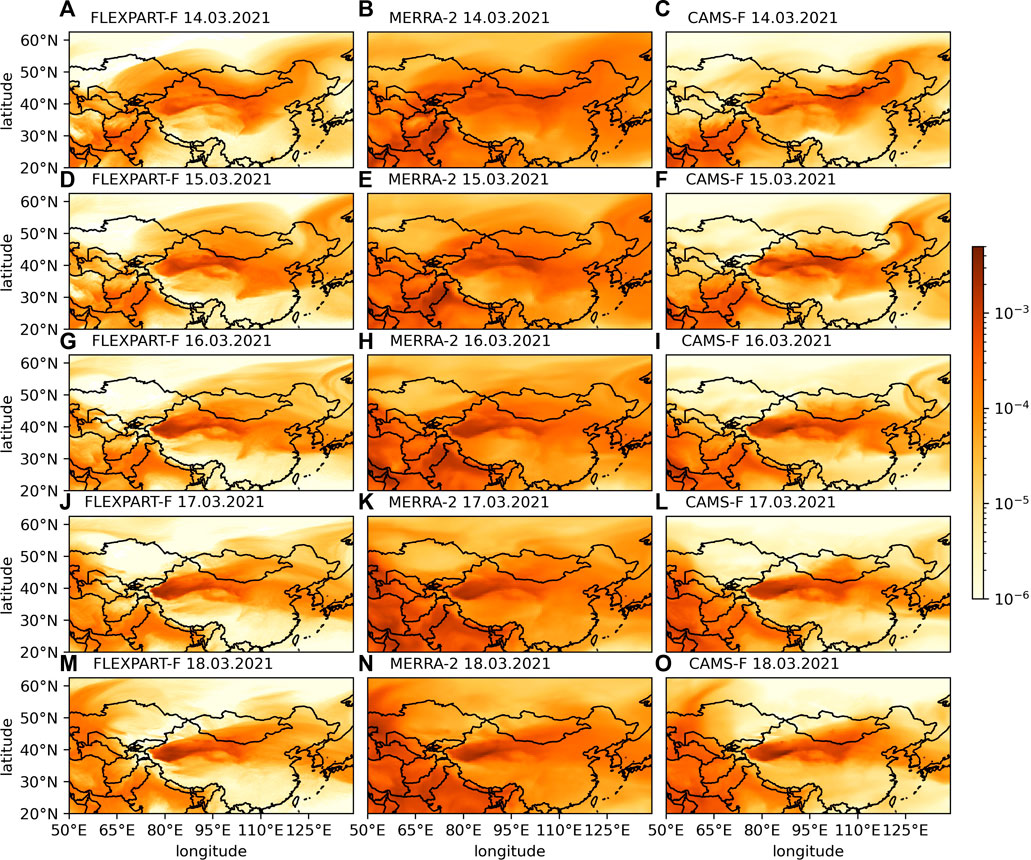
FIGURE 4. Daily average of vertically integrated dust concentration (kg m−2) during the dust storm event. (A,D,G,J,M) FLEXPART-F using the emission from FLEXDUST-update, (B,E,H,K,N) MERRA-2, (C,F,I,L,O) CAMS-F.
To further evaluate the performance of FLEXDUST and FLEXPART in simulating surface dust concentration, we compared the modelled dust PM10 with the observed dust PM10 at individual sites over North China (Figure 5). The concentration estimated by FLEXPART-B are shown together with FLEXPART-F to test the consistency and robustness of the two approaches for estimating dust concentration at a site. All the models underestimate the dust PM10 peak as indicated by observation by an order of magnitude, except Xi’an (1466A), where the model and observation match well with each other. The dust PM10 simulated by FLEXPART-F and FLEXPART-B agrees well with each other and is also consistent with that from MERRA-2 and CAMS-F in terms of both timing and magnitude. Over the Beijing (1010A) and Hohhot (1096A) sites, CAMS-F exhibits a higher dust PM10 peak than MERRA-2 and FLEXPART, likely owing to the higher emission strength of CAMS-F over Mongolia and the eastern Inner Mongolia, which are the major dust source for the two sites. In contrast, at the more western and southern sites such as Xi’an (1466A), Yan’an (1926A) and Yinchuan (1484A), dust PM10 simulated by MERRA-2 and FLEXPART are generally higher than that in CAMS-F, especially for the dust PM10 peak during 19-20.03.2021.
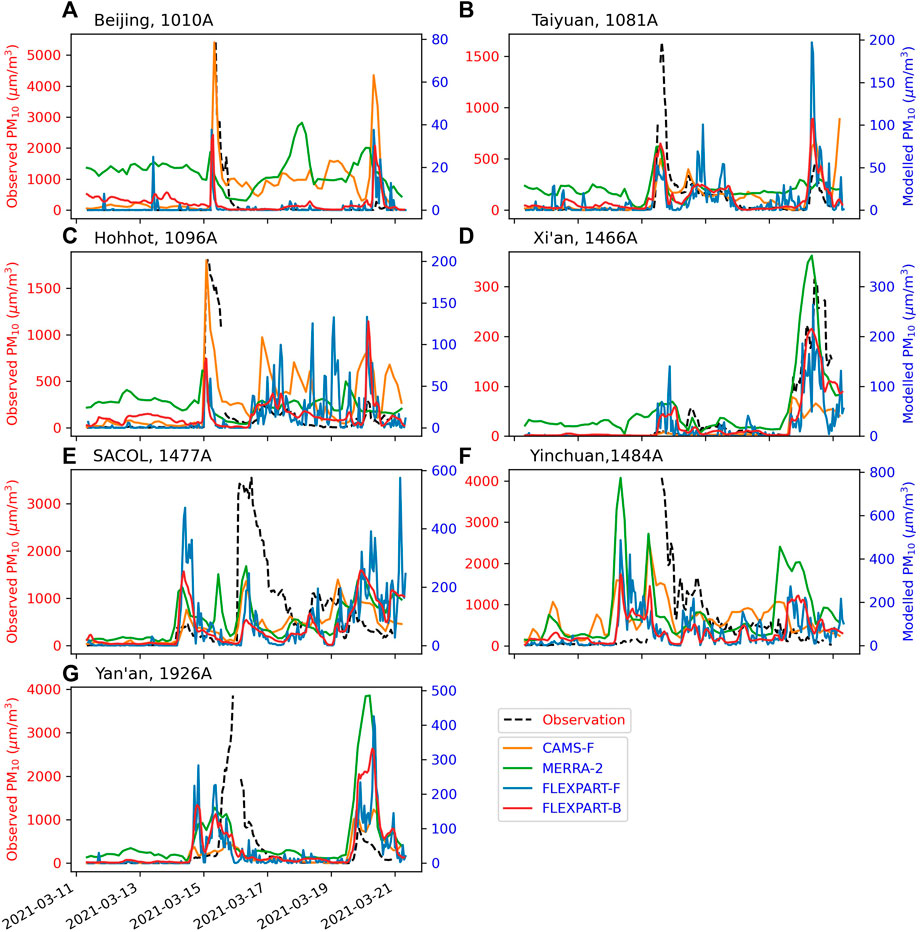
FIGURE 5. Comparison of modelled dust PM10 (μg.m−3) at the surface (0–100 m) with observations over sites in China. (A) Beijing (1010A), (B) Taiyuan (1081A), (C) Hohhot (1096A), (D) Xi’an (1466A), (E) SACOL (1477A), (F) Yinchuan (1484A), (G) Yan’an (1926A). The names in brackets are the site codes used in the CNEMC network. The observed dust PM10 is derived from observed total PM10 scaled by dust:total PM10 ratio estimated by CAMS-F. The location of the sites are shown in Figure 1. How dust PM10 was derived for FLEXPART, MERRA-2 and CAMS-F can be found in the Supplementary Material. Note that local time (i.e., Beijing time) is adopted in this figure.
Figure 6 shows the temporal evolution of the vertical profile of dust concentration over sites with lidar measurement of dust aerosols. At the Mongolian site (Zamynuud) which is in the dust source region, the starting of the dust storm (i.e., high local dust emission from the surface) on 14.03.2021 is visible in both attenuated backscatter coefficient and aerosol extinction coefficient at 532 nm (Figures 6A, C). The dust event is followed by a reduced local dust emission, but a salient high-level transport of dust from other source regions during 15-16.03.2021. The presence of high-level (as high as 10 km above surface) dust plume at the location, is consistent with the results from CALIPSO (Filonchyk, 2022). A second local dust emission occurred on 18.03.2021, but this dust event is mostly restricted to the lower and middle troposphere. FLEXPART-F captures these observed features well (Figure 6E), and the temporal-vertical structure is quite similar to that in CAMS-F, except that a strong local dust emission persists during 15-16.03.2021 in CAMS-F. Compared to FLEXPART-F and CAMS-F, MERRA-2 tends to overestimate dust concentration in the middle and upper troposphere (Figures 6G,I).
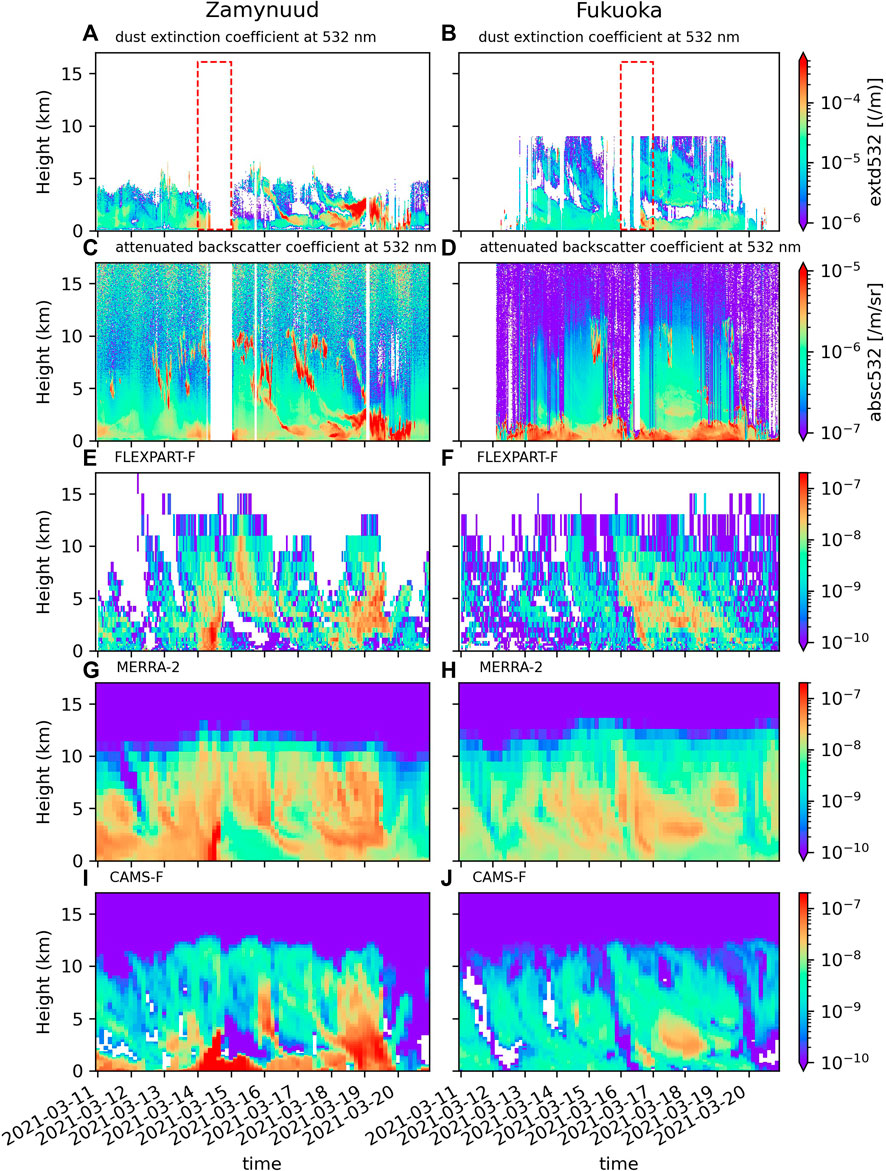
FIGURE 6. Modelled temporal-vertical profile of dust concentration (kg m−3) and its comparision with lidar measurement over Zamynuud, Mongolia (A,C,E,G,I) and Fukuoka, Japan (B,D,F,H,J). (A,B) Attenuated backscatter coefficient at 532 nm, (C,D) Dust extinction coefficient at 532 nm, (E,F) FLEXPART-F, (G,H) MERRA-2, (I,J) CAMS-F. The locations of the two sites are shown in Figure 1. The red boxes denote the dust storm event at the locations.
At the Fukuoka site in Japan which is far from the dust source regions, the influence of the dust storm event is clearly shown in both FLEXPART-F and CAMS-F (Figures 6F,J), and is also present but less obvious in the lidar observation and MERRA-2. The arrival of the dust plume first appears in the upper troposphere on 16.03.2021, while the majority of the dust transported through mid-troposphere arrived on 17.03 and 18.03.2021. As the location is at the coast, the constantly high extinction attenuated backscatter coefficient (Figure 6D) likely arises from the influence of sea salt aerosols. Both FLEXPART-F and the reanalysis data suggest low dust concentration in the lower troposphere for the entire period except the beginning of 17.03.2021.
The ability of FLEXPART in simulating the size distribution of dust aerosols at the surface is evaluated against the observation from the SACOL site (Figure 7). The fluctuation in dust size distribution mainly occurs on 14.03, 16.03, and 19.03.2021 with a sharp increase of coarse particles (
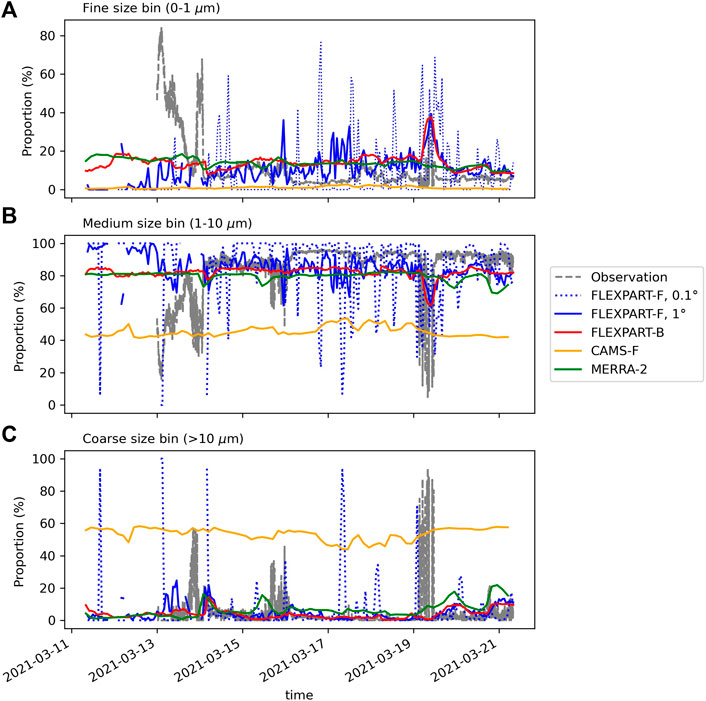
FIGURE 7. Observed and modelled particle size distribution at the SACOL site. (A) Fine size bin (0-1 μm), (B) Medium size bin (1-10 μ m), (C) Coarse size bin (
To further analyze the cause of the variations in the dust particle size distribution at the SACOL site, the emission sensitivity and the source contribution for different dust size bins during individual episodes with a strong increase in coarse particles, i.e., 14.03, 16.03, 19.03.2021 are shown in Figures 8, 9 and Supplementary Figure S5, respectively. The major dust source regions on 14.03 and 19.03.2021 are quite different. On 14.03.2021, the dust, including coarse particles, was mainly from the west along the northern slope of the Tibetan Plateau, transported by energetic westerly and north westerly wind (Figure 8). In contrast, on 19.03.2021, the dust was mainly from the northern and northeastern source regions, and the transport of coarse dust particles to the SACOL site was much weaker than that of the finer dust particles (Figure 9). The difference in the dominant wind system and source regions may explain why the high proportion of coarse dust particles on 14.03.2021 are well captured in FLEXPART, but not on 19.03.2021. The coarse dust particles observed on 19.03.2021 were likely derived from the nearby regions northeast of the SACOL site (Figure 9C), where there is little dust emission in FLEXDUST.
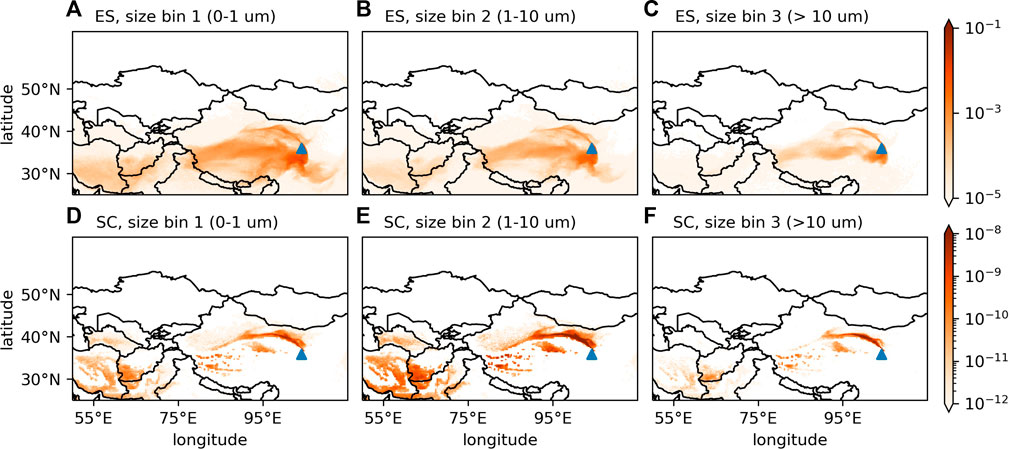
FIGURE 8. Emission sensitivity (ES, unit: s) (A–C) and source contribution (SC, unit: kgm−3) (D–F) for the dust aerosol concentration near surface (0–100 m) at SACOL during 18:00 13.03-06:00 14.03.2021 (Beijing time) estimated by FLEXPART-B. The blue triangle denotes the location of the SACOL site.
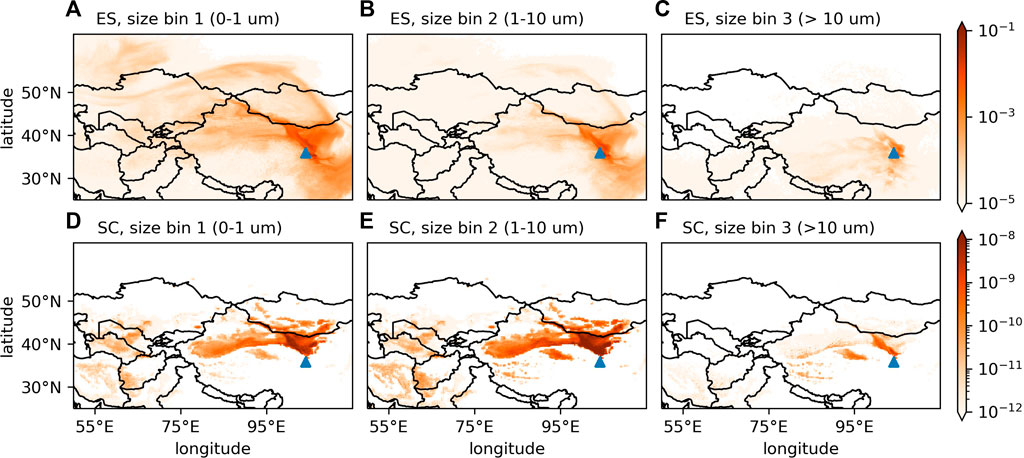
FIGURE 9. The same as Figure 8 but for 00:00-12:00 19.03.2021 (Beijing time).
3.3 Dust deposition of the 2021 East Asia dust storm
The spatio-temporal pattern of dry deposition is quite similar to that of the dust concentration (cf. Figures 4, 10). Both FLEXPART-F and reanalysis data show high dry deposition in dust source regions such as the Taklimakan and the Gobi deserts. On average, CAMS-F has the strongest dry deposition, while FLEXPART-F has lower dry deposition similar to MERRA-2.
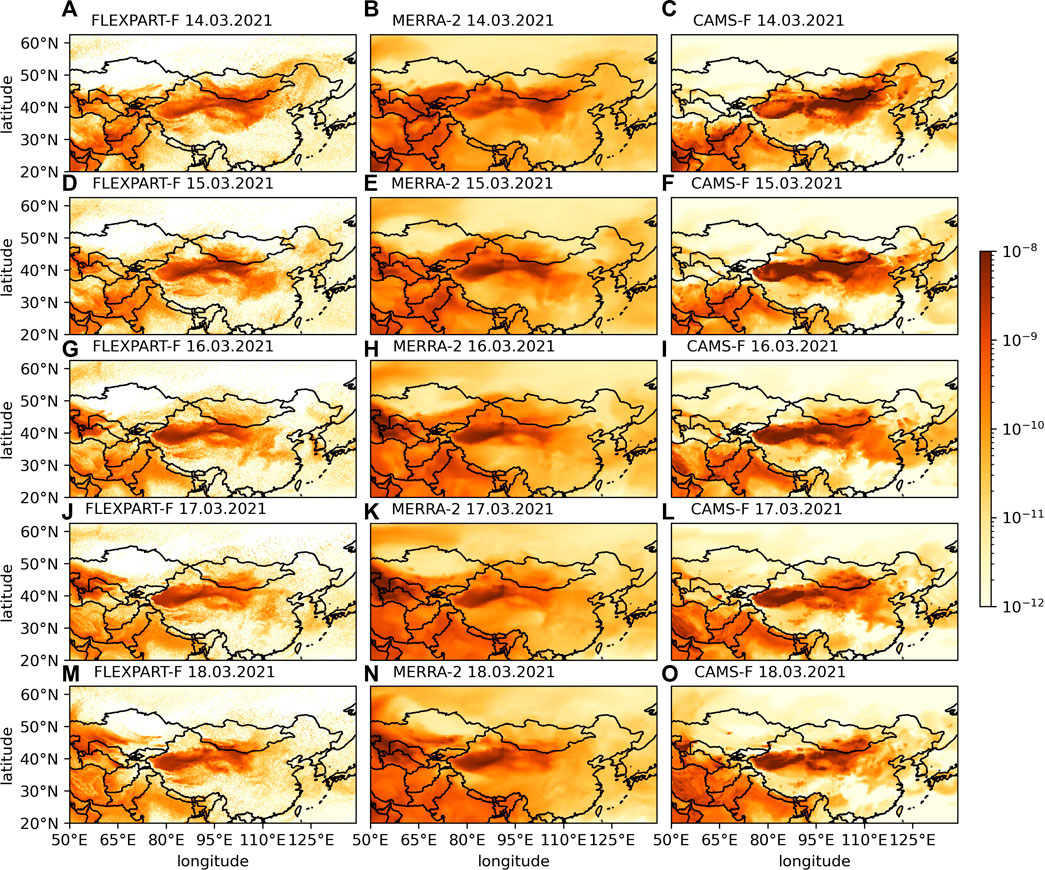
FIGURE 10. Daily average of total dry dust deposition (including gravitational settling) (kg m−2 s−1) during the dust storm event. (A,D,G,J,M) FLEXPART-F using emission from FLEXDUST-update; (B,E,H,K,N) MERRA-2; (C,F,I,L,O) CAMS-F.
The wet deposition in FLEXPART-F is also weaker than in CAMS-F and the strength is closer to MERRA-2 (Figure 11). The spatial pattern of wet deposition is closely related to precipitation in the model. The precipitation and cloud fields used in FLEXPART-F are derived from ERA5, which shares the same IFS modelling system as CAMS-F, and thus exhibits good similarity to CAMS-F in their spatial structures (see Supplementary Figures S6, S7). Accordingly, FLEXPART-F and CAMS-F display quite similar spatio-temporal pattern of wet deposition compared to that of MERRA-2. For instance, the presence of wet deposition in northern China on 16.03.2021 (Figures 11G–I), and the strong wet deposition over the Tibetan Plateau and the Taklimakan desert on 18.03.2021 (Figures 11M–O), are observed in both FLEXPART-F and CAMS-F, but not shown in MERRA-2 due to its different precipitation and cloud fields.
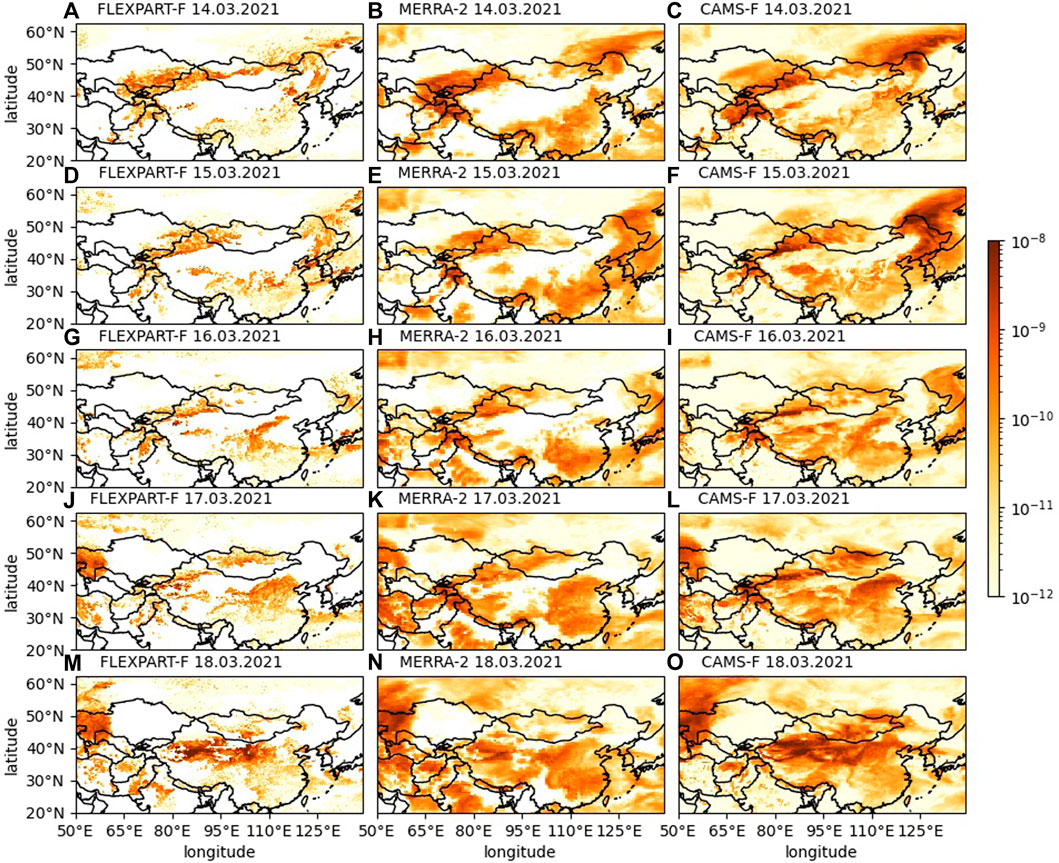
FIGURE 11. The same as Figure 10, but for wet deposition.
3.4 Dust budget of the 2021 East Asia dust storm
The total dust budget for the major source and deposition regions of the East Asia dust storm in FLEXPART-F is rather consistent with that in CAMS-F and MERRA-2 (Table 2). All the models indicate that the Gobi Desert (GB) is the major dust source region for the dust storm, having a net outward transport of dust from the region. In contrast, although the Taklimakan desert (TK) is a dust region, it has a net dust transport into the region. North China (NC) is a major region for dust deposition, and hence has a net dust transport into the region. The net dust transport for the larger Asian domain (AD) is negative in FLEXPART-F (Table 2), while it is positive in CAMS-F and MERRA-2. This is because FLEXDUST and FLEXPART cover only the AD, and do not account for the dust transport from outside of the AD, as opposed to the global datasets of MERRA-2 and CAMS-F. Dusts from the middle East and eastern Europe were likely to be transported to the AD during the dust storm event. But they probably deposited in the western part of the AD (Figure 10), and had minor influence on the dust concentration over East Asia (see Figure 4). This explains why there are much higher dust deposition rate and greater increase of dust concentration over the AD in MERRA-2 and CAMS-F than in FLEXPART-F, while the dust budgets over TA, GB and NC in MERRA-2 and CAMS-F are more consistent with that in FLEXPART-F (Table 2).
4 Discussion
4.1 Consistency between backward and forward FLEXPART simulations
Numerous studies have shown that running FLEXPART in forward and backward mode to simulate aerosol concentration or deposition at a site yields consistent results, given the sources and parameter settings are the same (Seibert and Frank, 2004; Eckhardt et al., 2017). Direction of modelling is therefore chosen based on what is numerically efficient and what analyses are desired. When the number of sources exceed the number of receptors it is generally more cost efficient to run backward simulations. Our results further confirm that both FLEXPART-F and FLEXPART-B can consistently depict dust concentration changes at a site during the 2021 East Asia dust storm event (Figures 5, 7). However, the results from FLEXPART-F are in general noisier than FLEXPART-B. We find that increasing backward tracing time and the number of particles released at each time in FLEXPART-B do not significantly improve the consistency between FLEXPART-F and FLEXPART-B. Instead, the spatial averaging of the results of FLEXPART-F from .1 × .1° to 1 × 1 ° can greatly reduce the discrepancies between forward and backward simulations (Figure 7). This implies that the particles reaching at the site (namely .1 × .1° box) in the forward simulation may not be sufficient to achieve statistical robust results, even though the total number of particles released in FLEXPART-F is already quite high. The spatial resolution and representativeness of the forward simulation at a site are strongly limited by the number of particles reaching to the site, and therefore need to be tested for each individual cases.
4.2 Underestimation of dust emission and concentration in FLEXDUST and FLEXPART
It has previously been found that FLEXDUST and FLEXPART considerably underestimate monthly dust concentrations and annual dust deposition over an East Asian site (Cheju) (Groot Zwaaftink et al., 2016). Consistent to this study, we found that FLEXPART using the output of FLEXDUST-default underestimates the strength of the 2021 Asian dust storm compared to observations and reanalysis data (see Supplementary Figures S2, S3). This can be largely attributed to the underestimation of dust emission in FLEXDUST-default owing to the limited types of vegetation used to infer the bare soil fraction in FLEXDUST, and the coarse topographical scaling used to depict the erodibility of the surface (Figures 2, 12A,B). In addition, the threshold friction velocity (TFV) for dust emission is also overestimated, prohibiting dust emission during the dust storm event (Figure 12C). This is in line with previous studies showing that TFV parameterization is the main source of the uncertainties for accurate dust-emission forecasts (Jin et al., 2018). The parameters (e.g., An) used in Eq. 3 to estimate TFV were derived from wind tunnel experiments (Shao and Lu, 2000) using loosely spread spherical particles on a dry and bare surface. The finer the particles, the larger are the uncertainties of Eq. 3 in predicting TFV. We found that lowering An is necessary to increase the extent and strength of dust emission during this dust storm event, while the modification of γ in Eq. 3 has only a minor effect. According to Shao and Lu (2000), the deviation from default parameters in the equation would implies that dust particles emitted during the dust storm are likely to be finer or less spherical than that originally assumed when deriving the equation.
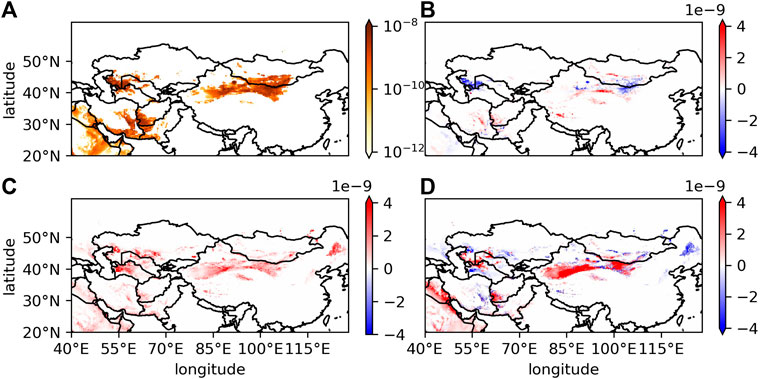
FIGURE 12. Average dust emission (kg m−2 s−1) during the whole dust storm event (13.03.2021-17.03.2021) simulated by FLEXDUST-default with MB95 scheme (A), and the changes in emission (kg m−2 s−1) due to improved erodibity (B), improved TFV (C), and the switch from MB95 to KOK14 scheme (D).
We also note that the KOK14 scheme in general performs better than the MB95 scheme in depicting the vertical dust flux from the surface during the strong Asian dust storm event. In particular, the KOK14 scheme simulates more (less) emission over Taklimakan desert (northeastern China) than the MB95 scheme (Figure 12D; Supplementary Figure S8), which is more consistent with MERRA-2 and CAMS-F. The better performance of the KOK14 scheme has been demonstrated in Kok et al. (2014) and has been shown in previous studies that the KOK14 scheme tends to predict more dust emission than the MB95 scheme during the Asian dust storm event (Wu et al., 2019; Zeng et al., 2020; Wang et al., 2022) and thus shows better agreement with observation. This can be linked to the high sensitivity of dust flux in the KOK14 scheme to the soil’s threshold friction velocity, as it accounts for soil’s increased ability to produce dust under continuous saltation bombardment, taking also into account an increased scaling of the vertical dust flux with wind speed (Kok et al., 2014). Moreover, soil texture (i.e., the fraction of soil clay content) exerts a linear influence on dust emission throughout its range (0%–100%) in the KOK14 scheme (Kok et al., 2014), while it has an exponential impact on dust emission, only within a limited range (0%–20%), in the MB95 scheme (Marticorena and Bergametti, 1995). The reduced sensitivity to the soil clay fraction in the KOK14 scheme enhances the dust emissions from the sandy deserts where the soil clay fraction is small, e.g the Taklimakan desert (Figure 12D).
FLEXPART using the output of FLEXDUST-update yields comparable results to MERRA-2 and CAMS-F, and similar to the two dataset, it still underestimates the observed peak of surface PM10 (by an order of magnitude at some sites) during the dust storm event (Figure 5). It is also noticed that studies using the meso-scale model WRF-CHEM and an offline chemical transport model CAMx also exhibit a similar magnitude of underestimation of surface PM10 during the East Asian dust storm events using their default settings (Song et al., 2019; Wang et al., 2022).
The underestimation of the observed surface PM10 peak during the dust storm event can be largely ascribed to the underestimation of the dust emission in the models. The analysis of global dust emission using inversion model constrained by available observation data reveals that current dust models on average underestimate the Asian dust emission (Kok et al., 2021). Consistently, a recent study applying data assimilation to derive dust emission suggests
Moreover, the biases in surface wind speed, soil moisture and vegetation cover, which are critical for dust emission may also contribute to the underestimation. These data were all derived from ERA5. For surface wind speed and soil moisture, ERA5 has been shown to exhibit the least biases against station observations among the available reanalysis data (Li et al., 2020; Fan et al., 2021), hence is unlikely to be the main reason for the underestimation of dust emission in FLEXDUST. To further confirm this, we calculated the mean surface wind speed for the available observation stations (Dunn, 2019) over the TA (2.8 m/s), GB (4.5 m/s) and NC (2.8 m/s) regions during the 2021 East Asia dust storm event. ERA5 indeed exhibits small biases in the mean wind speed in TA (+.3 m/s), GB (−.2 m/s) and NC (+.1 m/s). On the other hand, Wang et al. (2022) has shown that the use of gusty wind to capture short-term variation in wind speed can increase dust emission and concentration by more than 50% for the 2021 dust storm. Using gusty wind instead of hourly-average wind speed in FLEXDUST may help reducing the underestimation of dust emission.
For vegetation cover, the data from ERA5 is low in the main desert areas (such as Taklimakan Desert, Gobi Desert and Qaidam basin) (Supplementary Figure S4). But other regions (e.g., North China), which can potentially be a seasonal dust source in spring, have quite high static vegetation cover throughout the year. The lack of seasonality in the vegetation cover data from ERA5 may explain the underestimation of the dust emission, especially over northern China, an important nearby local dust sources for the observation sites of surface PM10 in Figure 5. Further improvement, such as using leaf area index (LAI) instead of total vegetation cover from ERA5, to infer the seasonal variation in vegetation and its potential impact on dust emission, would be needed.
We also notice that with the strength and spatial distribution of dust emission similar to FLEXDUST-update, Wang et al. (2022) show that the use of the KOK14 scheme for dust emission in CAMx is sufficient to reproduce the observed peak of surface PM10 during the 2021 East Asia dust storm. This indicates that the underestimation of the observed surface PM10 in FLEXPART may result from the too short lifetime of dust particles in the atmosphere. A modelling study of the East Asian dust storm in 2017 (Song et al., 2019) also found that increasing the proportion of the finer dust particles emitted from the surface and thus longer lifetime in the atmosphere, can significantly alleviate the underestimation of the surface PM10 during the dust storm event. Following this study, we have tested different size distributions of the emitted dust in FLEXPART-B, but found little improvement in the predicted surface PM10 (Figure not shown). This suggests that further tuning of the dust transport and deposition parameters in FLEXPART seem to be necessary to fully resolve the underestimation of the observed strength of the extreme Asian dust storms.
4.3 Comparison with MERRA-2 and CAMS-F
Owing to the lack of observation data on dust emission and deposition, we have employed the state-of-the-art reanalysis data, such as MERRA-2 and CAMS-F to evaluate the performance of FLEXDUST and FLEXPART. We note that MERRA-2 and CAMS-F are still model results and may suffer from large potential biases compared to observation (e.g., Figure 5) when simulating the dust cycle, even though they have assimilated remote-sensed aerosol optical depth (AOD). The comparison with MERRA-2 and CAMS-F can only tell how much FLEXDUST and FLEXPART deviate from the observation-constrained dust cycle as represented in MERRA-2 and CAMS-F.
It is found that using FLEXDUST-update, FLEXPART-F can well capture the strength and spatio-temporal evolution of the dust storm consistent with that in MERRA-2 and CAMS-F. In general, the strength of the dust emission, concentration and deposition in FLEXPART-F resemble those in MERRA-2 (Table 2), likely due to the similarity in their emission and deposition schemes (Table 1). In contrast, the spatio-temporal pattern of the dust cycle in FLEXPART is more consistent with that in CAMS-F than in MERRA-2 (Figures 3, 4, 10, 11). This can result from the similarity in their atmospheric forcing fields, such as wind, temperature and precipitation, as FLEXPART-F uses forcings from ERA5, which is produced with the same IFS system as CAMS-F (see Supplementary Figures S4, S6, S7).
The stronger dust emission, and dry and wet deposition in CAMS-F during the dust storm event than that in MERRA-2 and FLEXPAR-F are consistent with the finding by Zhao et al. (2022) on global scale (Table 2). Due to the lack of observation data, it remains uncertain whether CAMS-F is better in capturing the full dust cycle during the dust storm event. Given that CAMS-F is better in capturing the magnitude and temporal changes of the observed surface PM10 (Figure 5), the high dust emission in CAMS-F might be more realistic than MERRA-2 and FLEXPART-F. However, the analyses on AEROVAL (https://aeroval.met.no/) reveal that CAMS generally overestimates PM10 in North China on seasonal and yearly scale. The higher dust emission in CAMS-F can be related to its use of a more recent observation-based approach to quantify erodibility, instead of the topographic scaling adopted in both MERRA-2 and FLEXDUST (Table 1). In addition, soil map (e.g., soil texture) used in CAMS-F is different from MERRA-2 and FLEXDUST, which may also explain the differences in emission (Rémy et al., 2022).
We note that FLEXPART-F shows a noticeable weak wet deposition compared to CAMS-F and even MERRA-2 in some regions (Figure 11). This can be ascribed to the parameterization of wet deposition scheme in FLEXPART-F where dust particles are set up as very poor cloud condensation nuclei and thus are inefficiently removed by in-cloud scavenging (Grythe et al., 2017). Furthermore, there is initially very little precipitation close to the source, which gives time for dry deposition of the larger particles leaving mainly smaller particles that are less efficiently removed by below-cloud scavenging. Also the wet deposition in FLEXPLART-F displays a more “patchy” pattern compared to that in CAMS-F and MERRA-2. This can be related to the number of particles used in the simulation, but also to the issue of precipitation disaggregation using Flex_extract and the spatial interpolation of the variables (e.g., cloud water content and total cloud cover) required by the wet scavenging scheme, as pointed out by Hittmeir et al. (2018) and Tipka et al. (2020).
Our results reveal a high capability of FLEXDUST and FLEXPART in simulating the particle size distribution and its variation (Figure 7). Although a fixed size distribution of emitted dust (i.e., 10 dust size bins) has been assumed in FLEXDUST (see Supplementary Figure S1), FLEXPART is still able to reproduce the variation of the particle size distribution well during the dust storm event, owing to the particle-size dependent parameterization employed in both dry (e.g. gravitational settling) and wet deposition (e.g., below-cloud scavenging) in FLEXPART. Compared to FLEXDUST and FLEXPART, CAMS-F and MERRA-2 use less size-dependent parameterizations for dry and wet deposition (Table 1), and less dust size bins, namely 3 and 5 size bins for CAMS-F and MERRA-2, respectively. This can explains the lower performance of CAMS-F and MERRA-2 in simulating the particle size distribution and its changes during the dust storm event at the SACOL site. Further improvement of the dust emission, and dry and wet deposition in FLEXDUST and FLEXPART and other dust models with size-segregated/size-resolved schemes (e.g., Holopainen et al., 2020; Zeng et al., 2020), will likely help to better simulate the size distribution of the Asian dust aerosol and its climatic impact.
5 Conclusion
In this study, the performance of the Lagrangian trajectory model system FLEXDUST and FLEXPART in simulating the 2021 East Asia dust storm was evaluated against available observation data and observation-constrained reanalysis/forecast data of the atmospheric compositions (i.e., MERRA-2 and CAMS-F). It is found that the default FLEXDUST underestimates dust emission during the event compared to MERRA-2 and CAMS-F. Modification of the parameterization of the topographic scaling, bare soil fraction as well as threshold friction velocity in FLEXDUST can reproduce the strength and spatial extent of the dust emission, and the resultant concentration, and dry and wet deposition comparable to MERRA-2 and CAMS-F. Both FLEXPART and the reanalysis data, however, underestimate the peak of surface dust PM10 over North China during the dust storm event, even though the timing of the peak is well reproduced. This can be attributed to various reasons, such as the lack of nearby natural or anthropogenic dust sources and positive feedback between soil erodibility and dust emission in the models, the biases in surface wind speed, and the size distribution of emitted dust, and other factors leading to the too-short lifetime of dust in the model. More studies are needed to improve the dust models to better represent the dust cycle during the extreme Asian dust storms without deteriorating the performance during normal conditions. FLEXDUST and FLEXPART can better represent the observed size distribution of dust aerosol than MERRA-2 and CAMS-F, highlighting the importance of using a high number of dust size bins (e.g., more than 10) and size-dependent dust emission and deposition schemes in depicting the Asian dust storms and its climatic, ecological and socio-economic impacts. This evaluation study provides not only a direction for futher improvements of FLEXDUST and FLEXPART in representing Asian dust cycle, but also a basis for employing FLEXDUST and FLEXPART in studying the spatio-temporal dynamics of Asian dust in the past, present and future conditions.
Data availability statement
The datasets presented in this study can be found in online repositories. The names of the repositories and accession number(s) can be found Supplementary Material.
Author contributions
HT, OH, FS, and AK designed the study. HT performed forward simulations of FLEXDUST and FLEXPART, while OH performed backward simulations for the study. JB, BW, and ZR provided observation data for this study. HG and CZ provided insights on the modelled processes in FLEXDUST and FLEXPART. HT led the writing and the analyses of the results. All the co-authors contributed to the analyses of the results and the writing of the manuscript.
Funding
The study is supported by Academy of Finland, grant no. 316799. JB, BW, and ZR are supported by the Natural Science Foundation of China (NSFC), grant no. 42075126, 42072208, and 42105140, respectively.
Acknowledgments
The authors would like to express special thanks to all staff of SACOL and AD-Net for supplying the ground-based observations. Lidar data were provided by courtesy of AD-Net (https://www-lidar.nies.go.jp/AD-Net). The simulations were performed on resources provided by Sigma2—the National Infrastructure for High Performance Computing and Data Storage in Norway. The MERRA-2 data used in this study have been provided by the Global Modeling and Assimilation Office (GMAO) at NASA Goddard Space Flight Center. CAMS data used in this study were generated using Copernicus Atmosphere Monitoring Service Information (2022). ERA5 data used in this study were downloaded using the Copernicus Climate Change Service (C3S) Climate Data Store. Neither the European Commission nor ECMWF is responsible for any use that may be made of the information it contains. We would also like to acknowledge the two reviewers for their valuable comments.
Conflict of interest
The authors declare that the research was conducted in the absence of any commercial or financial relationships that could be construed as a potential conflict of interest.
Publisher’s note
All claims expressed in this article are solely those of the authors and do not necessarily represent those of their affiliated organizations, or those of the publisher, the editors and the reviewers. Any product that may be evaluated in this article, or claim that may be made by its manufacturer, is not guaranteed or endorsed by the publisher.
Supplementary material
The Supplementary Material for this article can be found online at: https://www.frontiersin.org/articles/10.3389/fenvs.2022.1013875/full#supplementary-material
References
Benedetti, A., Di Giuseppe, F., Jones, L., Peuch, V. H., Rémy, S., and Zhang, X. (2019). The value of satellite observations in the analysis and short-range prediction of Asian dust. Atmos. Chem. Phys. 19, 987–998. doi:10.5194/ACP-19-987-2019
Buchard, V., Randles, C. A., Silva, A. M. d., Darmenov, A., Colarco, P. R., Govindaraju, R., et al. (2017). The MERRA-2 aerosol reanalysis, 1980 onward. Part II: Evaluation and case studies. J. Clim. 30, 6851–6872. doi:10.1175/JCLI-D-16-0613.1
Cassiani, M., Stohl, A., Olivié, D., Seland, y., Bethke, I., Pisso, I., et al. (2016). The offline Lagrangian particle model FLEXPART-NorESM/CAM (v1): Model description and comparisons with the online NorESM transport scheme and with the reference FLEXPART model. Geosci. Model Dev. 9, 4029–4048. doi:10.5194/GMD-9-4029-2016
Checa-Garcia, R., Balkanski, Y., Albani, S., Bergman, T., Carslaw, K., Cozic, A., et al. (2021). Evaluation of natural aerosols in CRESCENDO Earth system models (ESMs): Mineral dust. Atmos. Chem. Phys. 21, 10295–10335. doi:10.5194/ACP-21-10295-2021
Chen, S., Huang, J., Qian, Y., Zhao, C., Kang, L., Yang, B., et al. (2017). An overview of mineral dust modeling over East Asia. J. Meteorological Res. 31 (31), 633–653. doi:10.1007/S13351-017-6142-2
Chin, M., Ginoux, P., Kinne, S., Torres, O., Holben, B. N., Duncan, B. N., et al. (2002). Tropospheric aerosol optical thickness from the GOCART model and comparisons with satellite and sun photometer measurements. J. Atmos. Sci. 59, 461–483. doi:10.1175/1520-0469(2002)059¡0461:taotft¿2.0.co;2
Chin, M., Rood, R. B., Lin, S. J., Müller, J. F., and Thompson, A. M. (2000). Atmospheric sulfur cycle simulated in the global model GOCART: Model description and global properties. J. Geophys. Res. Atmos. 105, 24671–24687. doi:10.1029/2000JD900384
Eckhardt, S., Cassiani, M., Evangeliou, N., Sollum, E., Pisso, I., and Stohl, A. (2017). Source-receptor matrix calculation for deposited mass with the Lagrangian particle dispersion model FLEXPART v10.2 in backward mode. Geosci. Model Dev. 10, 4605–4618. doi:10.5194/GMD-10-4605-2017
Fan, W., Liu, Y., Chappell, A., Dong, L., Xu, R., Ekström, M., et al. (2021). Evaluation of global reanalysis land surface wind speed trends to support wind energy development using in situ observations. J. Appl. Meteorology Climatol. 60, 33–50. doi:10.1175/JAMC-D-20-0037.1
Filonchyk, M. (2022). Characteristics of the severe March 2021 Gobi Desert dust storm and its impact on air pollution in China. Chemosphere 287, 132219. doi:10.1016/J.CHEMOSPHERE.2021.132219
Gelaro, R., McCarty, W., Suárez, M. J., Todling, R., Molod, A., Takacs, L., et al. (2017). The Modern-Era retrospective analysis for research and applications, Version 2 (MERRA-2). J. Clim. 30, 5419–5454. doi:10.1175/JCLI-D-16-0758.1
Ginoux, P., Chin, M., Tegen, I., Prospero, J. M., Holben, B., Dubovik, O., et al. (2001). Sources and distributions of dust aerosols simulated with the GOCART model. J. Geophys. Res. Atmos. 106, 20255–20273. doi:10.1029/2000JD000053
Ginoux, P., Prospero, J. M., Gill, T. E., Hsu, N. C., and Zhao, M. (2012). Global-scale attribution of anthropogenic and natural dust sources and their emission rates based on MODIS Deep Blue aerosol products. Rev. Geophys. 50, 3005. doi:10.1029/2012RG000388
Gong, S. L., and Zhang, X. Y. (2008). CUACE/Dust: An integrated system of observation and modeling systems for operational dust forecasting in Asia. Atmos. Chem. Phys. 8 (9), 2333–2340. doi:10.5194/ACP-8-2333-2008
Grimm, H., and Eatough, D. J. (2009). Aerosol measurement: The use of optical light scattering for the determination of particulate size distribution, and particulate mass, including the semi-volatile fraction. J. Air & Waste Manag. Assoc. 59, 101–107. doi:10.3155/1047-3289.59.1.101
Groot Zwaaftink, C. D., Aas, W., Eckhardt, S., Evangeliou, N., Hamer, P., Johnsrud, M., et al. (2022). What caused a record high PM10 episode in northern Europe in October 2020? Atmos. Chem. Phys. 22, 3789–3810. doi:10.5194/ACP-22-3789-2022
Groot Zwaaftink, C. D., Arnalds, l., Dagsson-Waldhauserova, P., Eckhardt, S., Prospero, J. M., and Stohl, A. (2017). Temporal and spatial variability of Icelandic dust emissions and atmospheric transport. Atmos. Chem. Phys. 17, 10865–10878. doi:10.5194/ACP-17-10865-2017
Groot Zwaaftink, C. D., Grythe, H., Skov, H., and Stohl, A. (2016). Substantial contribution of northern high-latitude sources to mineral dust in the Arctic. J. Geophys. Res. Atmos. 121, 13, 678–713, 697. doi:10.1002/2016JD025482
Grythe, H., Kristiansen, N. I., Zwaaftink, C. D., Eckhardt, S., Ström, J., Tunved, P., et al. (2017). A new aerosol wet removal scheme for the Lagrangian particle model FLEXPART v10. Geosci. Model Dev. 10, 1447–1466. doi:10.5194/GMD-10-1447-2017
Gui, K., Yao, W., Che, H., An, L., Zheng, Y., Li, L., et al. (2022). Record-breaking dust loading during two mega dust storm events over northern China in March 2021: Aerosol optical and radiative properties and meteorological drivers. Atmos. Chem. Phys. 22, 7905–7932. doi:10.5194/ACP-22-7905-2022
Haugvaldstad, O. W. (2021). Aeolian dust sources, transport and deposition over the Chinese loess plateau during 1999-2019: A study using the FLEXDUST and FLEXPART models. Oslo, Norway: Master Thesis, University of Oslo.
Hersbach, H., Bell, B., Berrisford, P., Biavati, G., Horányi, A., Muñoz Sabater, J., et al. (2018). ERA5 hourly data on pressure levels from 1959 to present. Copernic. Clim. Change Serv. (C3S) Clim. Data Store (CDS). doi:10.24381/cds.bd0915c6
Hittmeir, S., Philipp, A., and Seibert, P. (2018). A conservative reconstruction scheme for the interpolation of extensive quantities in the Lagrangian particle dispersion model FLEXPART. Geosci. Model Dev. 11, 2503–2523. doi:10.5194/GMD-11-2503-2018
Holopainen, E., Kokkola, H., Laakso, A., and Kühn, T. (2020). In-cloud scavenging scheme for sectional aerosol modules - implementation in the framework of the Sectional Aerosol module for Large Scale Applications version 2.0 (SALSA2.0) global aerosol module. Geosci. Model Dev. 13, 6215–6235. doi:10.5194/GMD-13-6215-2020
Huang, J., Wang, T., Wang, W., Li, Z., and Yan, H. (2014). Climate effects of dust aerosols over East Asian arid and semiarid regions. J. Geophys. Res. Atmos. 119, 398–411. doi:10.1002/2014JD021796
Huang, J., Zhang, W., Zuo, J., Bi, J., Shi, J., Wang, X., et al. (2008). An overview of the semi-arid climate and environment research observatory over the loess plateau. Adv. Atmos. Sci. 25, 906–921. doi:10.1007/s00376-008-0906-7
Huang, Z., Huang, J., Hayasaka, T., Wang, S., Zhou, T., and Jin, H. (2015). Short-cut transport path for asian dust directly to the arctic: A case study. Environ. Res. Lett. 10, 114018. doi:10.1088/1748-9326/10/11/114018
Inness, A., Ades, M., Agustí-Panareda, A., Barr, J., Benedictow, A., Blechschmidt, A. M., et al. (2019). The CAMS reanalysis of atmospheric composition. Atmos. Chem. Phys. 19, 3515–3556. doi:10.5194/ACP-19-3515-2019
Jia, H., Ma, X., Yu, F., and Quaas, J. (2021). Significant underestimation of radiative forcing by aerosol–cloud interactions derived from satellite-based methods. Nat. Commun. 12 (12), 3649. doi:10.1038/s41467-021-23888-1
Jin, J., Lin, H. X., Heemink, A., and Segers, A. (2018). Spatially varying parameter estimation for dust emissions using reduced-tangent-linearization 4DVar. Atmos. Environ. 187, 358–373. doi:10.1016/J.ATMOSENV.2018.05.060
Jin, J., Pang, M., Segers, A., Han, W., Fang, L., Li, B., et al. (2022). Inverse modeling of the 2021 spring super dust storms in East Asia. Atmos. Chem. Phys. 22, 6393–6410. doi:10.5194/ACP-22-6393-2022
Kobayashi, T., Tateishi, R., Alsaaideh, B., Sharma, R. C., Wakaizumi, T., Miyamoto, D., et al. (2017). Production of global land cover data – GLCNMO2013. J. Geogr. Geol. 9, 1. doi:10.5539/JGG.V9N3P1
Kok, J. F. (2011). A scaling theory for the size distribution of emitted dust aerosols suggests climate models underestimate the size of the global dust cycle. Proc. Natl. Acad. Sci. U. S. A. 108, 1016–1021. doi:10.1073/pnas.1014798108
Kok, J. F., Adebiyi, A. A., Albani, S., Balkanski, Y., Checa-Garcia, R., Chin, M., et al. (2021). Contribution of the world’s main dust source regions to the global cycle of desert dust. Atmos. Chem. Phys. 21, 8169–8193. doi:10.5194/ACP-21-8169-2021
Kok, J. F., Mahowald, N. M., Fratini, G., Gillies, J. A., Ishizuka, M., Leys, J. F., et al. (2014). An improved dust emission model – Part 1: Model description and comparison against measurements. Atmos. Chem. Phys. 14, 13023–13041. doi:10.5194/acp-14-13023-2014
Kok, J. F., Ward, D. S., Mahowald, N. M., and Evan, A. T. (2018). Global and regional importance of the direct dust-climate feedback. Nat. Commun. 9, 241–311. doi:10.1038/s41467-017-02620-y
Kyrö, E.-M., Grönholm, T., Vuollekoski, H., Virkkula, A., Kulmala, M., Laakso, L., et al. (2009). Snow scavenging of ultrafine particles: Field measurements and parameterization. Boreal Environ. Res. 4, 527–538.
Laakso, L., Grönholm, T., Rannik, l., Kosmale, M., Fiedler, V., Vehkamäki, H., et al. (2003). Ultrafine particle scavenging coefficients calculated from 6 years field measurements. Atmos. Environ. 37, 3605–3613. doi:10.1016/S1352-2310(03)00326-1
Li, J., Carlson, B. E., Yung, Y. L., Lv, D., Hansen, J., Penner, J. E., et al. (2022a). Scattering and absorbing aerosols in the climate system. Nat. Rev. Earth Environ. 3, 363–379. doi:10.1038/s43017-022-00296-7
Li, J., Hao, X., Liao, H., Yue, X., Li, H., Long, X., et al. (2022b). Predominant type of dust storms that influences air quality over Northern China and future projections. Earth’s Future 10. doi:10.1029/2022EF002649
Li, M., Wu, P., and Ma, Z. (2020). A comprehensive evaluation of soil moisture and soil temperature from third-generation atmospheric and land reanalysis data sets. Int. J. Climatol. 40, 5744–5766. doi:10.1002/JOC.6549
Li, L., Mahowald, N. M., Miller, R. L., Pérez García-Pando, C., Klose, M., Hamilton, D. S., et al. (2021). Quantifying the range of the dust direct radiative effect due to source mineralogy uncertainty. Atmos. Chem. Phys. 21 (5), 3973–4005. doi:10.5194/ACP-21-3973-2021
Liu, J., Wu, D., Liu, G., Mao, R., Chen, S., Ji, M., et al. (2019). Impact of Arctic amplification on declining spring dust events in East Asia. Clim. Dyn. 54, 1913–1935. doi:10.1007/S00382-019-05094-4
Mallia, D. V., Kochanski, A., Wu, D., Pennell, C., Oswald, W., and Lin, J. C. (2017). Wind-blown dust modeling using a backward-Lagrangian particle dispersion model. J. Appl. Meteorology Climatol. 56, 2845–2867. doi:10.1175/JAMC-D-16-0351.1
Marticorena, B., and Bergametti, G. (1995). Modeling the atmospheric dust cycle: 1. Design of a soil-derived dust emission scheme. J. Geophys. Res. Atmos. 100, 16415–16430. doi:10.1029/95JD00690
MEP (2013). Specifications and test procedures for ambient air quality continuous automated monitoring system for PM10 and PM2.5. Beijing, China: The Ministry of Environmental Protection of People’s Republic of China. HJ 653-2013.
Morcrette, J. J., Boucher, O., Jones, L., Salmond, D., Bechtold, P., Beljaars, A., et al. (2009). Aerosol analysis and forecast in the European Centre for medium-range weather forecasts integrated forecast system: Forward modeling. J. Geophys. Res. Atmos. 114, D06206. doi:10.1029/2008JD011235
Myhre, G., Grini, A., Haywood, J. M., Stordal, F., Chatenet, B., Tanré, D., et al. (2003). Modeling the radiative impact of mineral dust during the Saharan Dust Experiment (SHADE) campaign. J. Geophys. Res. Atmos. 108, 8579. doi:10.1029/2002JD002566
Myhre, G., and Stordal, F. (2001). Global sensitivity experiments of the radiative forcing due to mineral aerosols. J. Geophys. Res. Atmos. 106, 18193–18204. doi:10.1029/2000JD900536
Näslund, E., and Thaning, L. (2007). On the settling velocity in a nonstationary atmosphere. Aerosol Sci. Technol. 14, 247–256. doi:10.1080/02786829108959487
Pisso, I., Sollum, E., Grythe, H., Kristiansen, N. I., Cassiani, M., Eckhardt, S., et al. (2019). The Lagrangian particle dispersion model FLEXPART version 10.4. Geosci. Model Dev. 12, 4955–4997. doi:10.5194/GMD-12-4955-2019
Poggio, L., De Sousa, L. M., Batjes, N. H., Heuvelink, G. B., Kempen, B., Ribeiro, E., et al. (2021). SoilGrids 2.0: Producing soil information for the globe with quantified spatial uncertainty. SOIL 7, 217–240. doi:10.5194/SOIL-7-217-2021
Ramli, H. M., and Esler, J. G. (2016). Quantitative evaluation of numerical integration schemes for Lagrangian particle dispersion models. Geosci. Model Dev. 9, 2441–2457. doi:10.5194/GMD-9-2441-2016
Randles, C. A., Silva, A. M. d., Buchard, V., Colarco, P. R., Darmenov, A., Govindaraju, R., et al. (2017). The MERRA-2 aerosol reanalysis, 1980 onward. Part I: System description and data assimilation evaluation. J. Clim. 30, 6823–6850. doi:10.1175/JCLI-D-16-0609.1
Rémy, S., Kipling, Z., Huijnen, V., Flemming, J., Nabat, P., Michou, M., et al. (2022). Description and evaluation of the tropospheric aerosol scheme in the Integrated Forecasting System (IFS-AER, cycle 47R1) of ECMWF. Geosci. Model Dev. 15, 4881–4912. doi:10.5194/GMD-15-4881-2022
Seibert, P., and Frank, A. (2004). Source-receptor matrix calculation with a Lagrangian particle dispersion model in backward mode. Atmos. Chem. Phys. 4, 51–63. doi:10.5194/ACP-4-51-2004
Shao, Y., and Dong, C. H. (2006). A review on East Asian dust storm climate, modelling and monitoring. Glob. Planet. Change 52, 1–22. doi:10.1016/J.GLOPLACHA.2006.02.011
Shao, Y., and Lu, H. (2000). A simple expression for wind erosion threshold friction velocity. J. Geophys. Res. Atmos. 105, 22437–22443. doi:10.1029/2000JD900304
Shimizu, A., Sugimoto, N., Matsui, I., Arao, K., Uno, I., Murayama, T., et al. (2004). Continuous observations of Asian dust and other aerosols by polarization lidars in China and Japan during ACE-Asia. J. Geophys. Res. Atmos. 109, D19S17–36. doi:10.1029/2002JD003253
Sodemann, H., Lai, T. M., Marenco, F., Ryder, C. L., Flamant, C., Knippertz, P., et al. (2015). Lagrangian dust model simulations for a case of moist convective dust emission and transport in the Western Sahara region during Fennec/LADUNEX. J. Geophys. Res. Atmos. 120, 6117–6144. doi:10.1002/2015JD023283
Song, P., Fei, J., Li, C., and Huang, X. (2019). Simulation of an asian dust storm event in may 2017. Atmosphere 10 (10), 135. doi:10.3390/ATMOS10030135
Tegen, I., and Lacis, A. A. (1996). Modeling of particle size distribution and its influence on the radiative properties of mineral dust aerosol. J. Geophys. Res. Atmos. 101, 19237–19244. doi:10.1029/95JD03610
Tipka, A., Haimberger, L., and Seibert, P. (2020). Flex_extract v7.1.2 – A software package to retrieve and prepare ECMWF data for use in FLEXPART. Geosci. Model Dev. 13, 5277–5310. doi:10.5194/gmd-13-5277-2020
Uno, I., Eguchi, K., Yumimoto, K., Takemura, T., Shimizu, A., Uematsu, M., et al. (2009). Asian dust transported one full circuit around the globe. Nat. Geosci. 2, 557–560. doi:10.1038/ngeo583
Wang, J., Zhang, B., Zhang, H., Hua, C., An, L., Gui, H., et al. (2022). Simulation of a severe sand and dust storm event in March 2021 in Northern China: Dust emission schemes comparison and the role of gusty wind. Atmosphere 13, 108. doi:10.3390/ATMOS13010108
Wang, S., Yu, Y., Zhang, X. X., Lu, H., Zhang, X. Y., and Xu, Z. (2021). Weakened dust activity over China and Mongolia from 2001 to 2020 associated with climate change and land-use management. Environ. Res. Lett. 16, 124056. doi:10.1088/1748-9326/AC3B79
Wesely, M. L. (1989). Parameterization of surface resistances to gaseous dry deposition in regional-scale numerical models. Atmos. Environ. 23, 1293–1304. doi:10.1016/0004-6981(89)90153-4
Wu, M., Liu, X., Yang, K., Luo, T., Wang, Z., Wu, C., et al. (2019). Modeling dust in East Asia by CESM and sources of biases. J. Geophys. Res. Atmos. 124, 8043–8064. doi:10.1029/2019JD030799
Yao, W., Che, H., Gui, K., Wang, Y., and Zhang, X. (2020). Can MERRA-2 reanalysis data reproduce the three-dimensional evolution characteristics of a typical dust process in East Asia? A case study of the dust event in may 2017. Remote Sens. 12, 902. doi:10.3390/RS12060902
Yin, Z., Wan, Y., Zhang, Y., and Wang, H. (2022). Why super sandstorm 2021 in North China? Natl. Sci. Rev. 9, nwab165. doi:10.1093/NSR/NWAB165
Zamora, L. M., Kahn, R. A., Evangeliou, N., and Groot Zwaaftink, C. D. (2022). Comparisons between the distributions of dust and combustion aerosols in MERRA-2, FLEXPART and CALIPSO and implications for deposition freezing over wintertime Siberia. Atmos. Chem. Phys. Discuss. 2022, 1–25. doi:10.5194/acp-2022-124
Zeng, Y., Wang, M., Zhao, C., Chen, S., Liu, Z., Huang, X., et al. (2020). WRF-Chem v3.9 simulations of the East Asian dust storm in May 2017: Modeling sensitivities to dust emission and dry deposition schemes. Geosci. Model Dev. 13, 2125–2147. doi:10.5194/GMD-13-2125-2020
Zhang, L., Gong, S., Padro, J., and Barrie, L. (2001). A size-segregated particle dry deposition scheme for an atmospheric aerosol module. Atmos. Environ. 35, 549–560. doi:10.1016/S1352-2310(00)00326-5
Keywords: particle size distribution, PM10, extreme dust storm, dust emission, Lagrangian modelling
Citation: Tang H, Haugvaldstad OW, Stordal F, Bi J, Groot Zwaaftink CD, Grythe H, Wang B, Rao Z, Zhang Z, Berntsen T and Kaakinen A (2023) Modelling the 2021 East Asia super dust storm using FLEXPART and FLEXDUST and its comparison with reanalyses and observations. Front. Environ. Sci. 10:1013875. doi: 10.3389/fenvs.2022.1013875
Received: 07 August 2022; Accepted: 19 December 2022;
Published: 06 January 2023.
Edited by:
Longlei Li, Cornell University, United StatesReviewed by:
Chenglai Wu, Institute of Atmospheric Physics (CAS), ChinaYong Zhao, Chengdu University of Information Technology, China
Copyright © 2023 Tang, Haugvaldstad, Stordal, Bi, Groot Zwaaftink, Grythe, Wang, Rao, Zhang, Berntsen and Kaakinen. This is an open-access article distributed under the terms of the Creative Commons Attribution License (CC BY). The use, distribution or reproduction in other forums is permitted, provided the original author(s) and the copyright owner(s) are credited and that the original publication in this journal is cited, in accordance with accepted academic practice. No use, distribution or reproduction is permitted which does not comply with these terms.
*Correspondence: Hui Tang, aHVpLnRhbmdAZ2VvLnVpby5ubw==