- School of Economices and Management, China University of Geosciences, Beijing, China
In September 2020, China proposed a carbon neutral target for 2060, and at the same time proposed to accelerate the implementation of the national carbon peaking task for 2030. In the context of “dual carbon,” provinces and cities urgently need to achieve low-carbon transformational development, but there are significant differences in the development level, process and trend of carbon emission reduction among regions. Therefore, it is necessary to understand the carbon emission characteristics of each city, so as to provide scientific and effective guidance for local governments to adopt differentiated low-carbon emission reduction measures. In this paper, the spatial and temporal distribution characteristics of carbon emissions and carbon intensity of 16 cities in Shandong Province were analyzed with the help of ArcGIS, and then the static and dynamic factors affecting urban carbon emissions were considered comprehensively, and the clustering analysis of 16 cities was conducted by using the systematic clustering method. The results show that, according to the characteristics of each type of cities, they can be summarized into four categories: “low economic high carbon type,” “high economic high carbon type,” “high economic low carbon type,” “low carbon.” The results show that the cities in each category do not have complete geographical continuity. Finally, after analyzing the characteristics of carbon emissions in each type of cities, this paper proposes targeted policy recommendations to promote the development of low-carbon emission reduction.
Introduction
The issue of climate warming has received widespread attention for its severity of damage to the ecological environment and the urgency of solving the threat to human survival and development, and the joint global response to climate warming has become the rightful meaning of the community of human destiny. According to the International Energy Agency (IEA), China leads the world in carbon emissions with 98.09 × 10⁸ t in 2019. Facing this severe carbon emission status, in September 2020, China announced at the 75th session of the United Nations General Assembly that it “will increase its autonomous national contribution, adopt more vigorous policies and measures, and strive to reach peak CO2 emissions by 2030 and achieve carbon neutrality by 2060 (Zhang Y. X. et al., 2021). As China’s economy enters a critical period of high-quality development, emission peak and carbon neutrality will effectively help China to cope with global climate change and will become the general grasp to promote the development of comprehensive green transformation of economy and society (Xu et al., 2020). And strengthen research on green technologies and other aspects to promote sustainable development.
Cities are the main sources of energy consumption and greenhouse gas emissions, and they are also the main subjects of energy transition and environmental management policies (Jiao et al., 2018). Due to different economic and social development requirements and ecological constraints, the carbon emission reduction potential of cities varies greatly (Aubrey et al., 2015). And due to the regional differences and unevenness in the natural conditions, resource endowment, energy structure, industrial structure and economic development level of cities, the development path of low-carbon cities should also be different from city to city (Gu, 2019). Different cities are at different stages of development and have different potential and abilities to control carbon emissions. With large differences in urban carbon emissions, unified carbon emission reduction policy requirements have instead brought greater negative impacts on the low-carbon development of some cities. The driving factors of urban development in the same region are similar, and the development factors are more mobile, so the governance models can influence and learn from each other well (Guo and Yuan, 2020). The “Action Plan for Carbon Peaking by 2030” released on 26 October 2021, emphasizes the important ideas of overall deployment, categorized policies, and local adaptation to promote regional carbon peaking and carbon neutrality. From the perspective of carbon emission reduction, the classification of city types based on their carbon reduction capacity is the key to effectively guiding regional low-carbon development (Yu et al., 2012). Therefore, it is important to study the spatial pattern changes and distribution characteristics of carbon emissions in cities on a longtime scale, clarify the influencing factors of carbon emissions, cluster and analyze different characteristic city clusters, and identify different types of cities’ carbon peak paths, and insist on localization, classification, and intra-regional linkage (Yilin and Ming, 2018). It is of strategic importance to promote the coordinated, sequential, and orderly peaking of cities for the overall low-carbon development of the country.
Therefore, it is urgent to study and analyze the spatial and temporal distribution characteristics and clustering characteristics of carbon emissions for cities in large carbon emission provinces, and effectively promote their low-carbon transition development. Shandong Province, with the highest population and GDP in China, is the key region in the eastern region to accomplish carbon emission reduction tasks, and promoting carbon emission reduction in Shandong Province has a catalytic effect on promoting low-carbon development nationwide (Liu, 2020). Moreover, there are large differences in development factors such as natural resources and economic development levels among cities in Shandong Province, therefore, studying the differences in carbon emission reduction possibilities among cities in Shandong Province is important for clarifying regional carbon emission reduction capacity, guiding the government to coordinate the formulation of effective low-carbon transition development policies, forming a reasonable provincial grid-based emission reduction path, and strongly promoting the achievement of national double carbon targets as well as the construction of innovative cities in China and promote city sustainable development is of great significance (Wang, 2018). In summary, this study firstly compares the relevant literature on urban carbon emissions, clarifies the existing methods and results, and thoroughly investigates the spatial and temporal characteristics and dynamic evolution patterns of carbon emissions and carbon intensity of cities in Shandong Province. Considering various static and dynamic factors affecting carbon peaking and carbon neutralization, the study Uses the systematic clustering method to cluster 16 cities in Shandong, we deeply explore the characteristics of indicators, and propose corresponding countermeasures and paths for carbon emission reduction in Shandong cities based on the clustering results, to provide decision-making support for the high-quality development of Shandong cities.
Literature review
Previous studies in the literature show that greenhouse gas emissions are closely related to human economic and social activities, and carbon-containing gases, mainly carbon dioxide, are an important component of greenhouse gases (Wang and Ma, 2020). Some scholars have shown that urban carbon emissions are mainly influenced by several dimensions such as socio-economic and technological levels, physical geography, and policy culture (Shan Y. L. et al., 2018). Among them, socio-economic factors have been most widely discussed in the previous literature. For example, the level of economic development of cities, similar to the level of urbanization, follows the environmental Kuznets curve theory with an inverted U-shaped relationship with carbon emissions (Lin and Du, 2015). There is a certain super-linear or sub-linear proportional relationship between population size and urban CO2 emissions, implying different types of urban development (Xu et al., 2018). In terms of policy, China’s pilot low-carbon city policy can significantly improve the carbon efficiency of cities, and its channels of action include optimizing the industrial structure and improving energy use efficiency (Fu et al., 2021). The impact factors in most studies were economic, demographic Trade and investment, science and technology, etc., and there are obvious regional differences and temporal variations in the degree and direction of their effects, as well as certain regularities. Identifying the key influencing factors on local carbon emissions according to different cities is the basis for achieving low-carbon development (Auffhammer et al., 2016).
The study of the spatial and temporal distribution characteristics of carbon emissions can analyze the trend of carbon emissions in cities. In this regard, some scholars have studied the spatial and temporal heterogeneity of carbon emissions in different industries (Xu et al., 2017). The carbon emission intensity of China’s construction industry as a whole shows a decreasing trend, with a decreasing trend in the eastern and central regions and an insignificant decreasing trend in the western region (Su et al., 2020). Using a geographically weighted regression model to study the carbon emissions of China’s manufacturing industry, it was found that economic growth has a positive impact on carbon emissions, and the impact decreases from the east to the central and western regions (Liu and Feng, 2020). Some scholars have also studied carbon emissions from different regional perspectives (Schipper et al., 2001). The spatial dependence structure of provincial carbon emissions in China was found to be higher in the eastern and northern regions than in the western and southern regions, while the central region was in between (Pan et al., 2019). Using a geographically weighted regression model, we analyzed the spatial differences and multiple mechanisms of China’s provincial carbon footprint in 2010, revealing that the expansion of economic scale and population size is the driving force for the rapid growth of carbon footprint (Wang et al., 2014). The spatial variation of carbon emission factors was analyzed in four aspects: industrial structure, energy intensity, urbanization level, and foreign trade degree (Chen Y. et al., 2020).
In addition, in the cluster analysis on urban carbon emissions. In the existing literature, carbon emission factors have been studied by machine learning algorithms such as cluster analysis and classification trees to classify cities considering various characteristics of cities (Hu et al., 2018). Based on the classification tree model, 155 representative cities around the world were selected, and their resource consumption was classified into 15 categories based on their climatic conditions, urban GDP, population and population density, and the differences in resource metabolism of different types of cities were analyzed (Saldivar, 2010). Traditional fuzzy cluster analysis of China’s sub-provincial carbon emissions is explored (Zhang et al., 2011). Classification of 30 Chinese provinces into carbon emission dominant, potential, and lagging regions based on factor analysis and cluster analysis (Zhang and Zhao, 2019). Based on the usual geographical classifications of North China, Central China, South China, Southwest China, and Northwest China, the influence of carbon emissions from different regions by urbanization effects was analyzed (Zhang, 2017). The causes of regional CO2 emission inequality and low carbon development strategies are explored based on different economic zones and economic regions (Wang et al., 2013).
In summary, the current research methods for carbon emissions are rich and extensive, and some progress has been made, but there are still some shortcomings in the research to effectively promote the development of regional low-carbon emission reduction., On the one hand, the scope of research is mostly global or national in scope, there are fewer studies of Chinese cities, in particular, and only a few studies have classified Chinese cities based on the perspective of urban carbon peaks (Zhang and Ma 2020). The current studies on carbon emission characteristics in China mainly focus on the national and provincial levels, or some already developed and mature urban agglomerations, while Shandong province, as an emerging development focus, has less literature on its systematic analysis and research. In addition, previous studies are mainly based on static cross-sectional indicators, lacking consideration of dynamic factors affecting urban classification, which weakens the reliability and significance of relevant research results. In this paper, based on the reference of previous literature, a classification analysis of carbon emission characteristics of 16 cities in Shandong Province was conducted based on the systematic clustering method. The contribution of this paper is that the specific provinces and cities are selected for the study, and comprehensively considers dynamic and static indicators, analyzes the spatial and temporal characteristics and clustering characteristics of carbon emissions in each city, and proposes practical and effective policy recommendations based on the characteristic analysis, which provides theoretical support for the government to take low-carbon emission reduction measures.
Model and data sources
City carbon emissions measurement
Referring to Shan and Guan et al.’s study (Shan Y. et al., 2018), this paper uses the carbon accounting database (China Emission Accounts & Datasets, CEAD) from China. The inventory method is chosen as the method to account for carbon emissions. From the production side, the calculation is based on the fossil energy used by different production sectors. The basic principle is that carbon emissions are equal to the activity level (different types of fossil energy consumed by each production sector) multiplied by the emission factor of that type of fossil energy (Guo et al., 2020). The specific calculation formula is.
Cluster analysis methods
Clustering is an important class of technical methods in data mining and is widely used in urban classification (Xu and Donald, 2005). Cluster analysis is the process of obtaining optimal divisions based on the similarity or distance of given sample features in an unsupervised state, ultimately achieving maximum similarity of samples within groups and high heterogeneity of samples between groups (Chen J. D. et al., 2020). There are many different branches of cluster analysis methods, among which the most important and widely used are fuzzy clustering, systematic clustering, optimal partitioning, dynamic clustering, and K-means clustering (Wang et al., 2013). In contrast to other classification methods, cluster analysis is based on the characteristics of the data itself, does not rely on limited criteria, and facilitates the identification of hidden correlations in the data.
The systematic clustering method first groups all observations into one class, and then merges them according to the distance between observations, cycling several times until all observations are combined into one class. Compared with K-means clustering and other classification methods, systematic clustering analysis can classify not only records but also study variables and is more adaptable because of the flexibility of the method for calculating the distance between classes (Jiang et al., 2017). The commonly used systematic clustering methods mainly include the shortest distance method, the longest distance method, the intermediate distance method, the Ward method, etc. The clustering statistics mainly include Block Distance, Euclidean Distance, etc (Wang et al., 2018). In this paper, the systematic clustering method was selected and the latest version of SPSS software was used to perform systematic clustering analysis using intergroup link-squared Euclidean distance-range 0–1 normalized for 16 cities in Shandong province.
Indicator selection and data sources
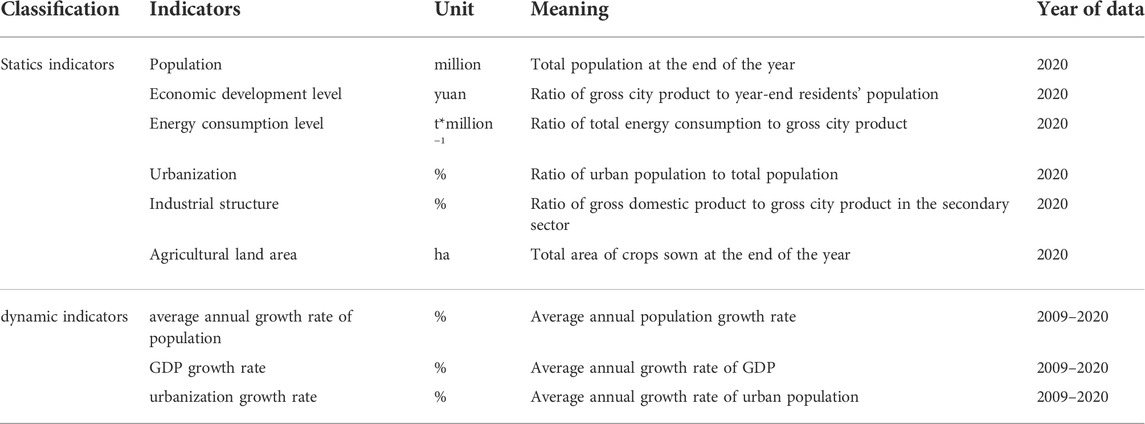
The construction of a carbon emission factor clustering index system needs to meet the principles of scientificity, systematicity, comparability, and operability. Considering data availability and consistency of statistical caliber, all relevant factors are included in the construction of the indicator system affecting carbon peak and carbon-neutral as far as possible (Guo et al., 2021). The selection of static indicators is mainly based on the influence patterns of different factors on urban carbon emissions found in previous literature and is used to reflect the cross-sectional characteristics of carbon emissions in different types of cities (Li et al., 2020). The dynamic indicators, on the other hand, are designed to further help judge the trend characteristics of carbon emissions in different cities. Reflecting the cross-sectional characteristics of carbon emissions in different cities, four dynamic indicators further portray the trend characteristics of carbon peaks in different cities for systematic cluster analysis. Six static indicators are selected, namely, population size, economic development level, energy consumption level, urbanization rate, industrial structure, and agricultural land area. Four dynamic data are selected, which are the average annual growth rate of population, GDP, and urbanization. The cluster analysis index system is shown in Table 1, and the specific indicators are selected based on the following.
(1) Population. As the population grows, the consumption of resources and energy will also increase, and therefore, the carbon emissions caused by energy consumption will also increase. The year-end total population of each city and its average annual growth rate were selected to reflect the city’s demographic characteristics (Cheng et al., 2020).
(2) Economic development level. Economic development requires the input and use of energy resources. As the level of economic development changes, according to the environmental Kuznets curve, the level of carbon emissions will first increase and then decrease (Guo and Yuan, 2020). GDP per capita and its average annual growth rate are chosen to represent the level of economic development of the city (Wang and Zhang, 2020).
(3) Energy consumption level. The higher the energy consumption level, the lower the energy intensity, which leads to smaller carbon emissions generated. In this paper, we choose energy consumption per unit GDP to reflect the energy consumption level of each city (Zhang X. et al., 2021).
(4) Urbanization. The process of urbanization will cause the construction of housing, transportation, and other infrastructure, resulting in changes in the spatial structure and economic structure of society, and the input and production efficiency of social resources, thus indirectly or directly causing changes in carbon emissions (Du and Sun, 2021). The urbanization rate and its average annual growth rate are selected to represent the urbanization level.
(5) Industrial structure. The fossil energy combustion in the secondary industry (especially the energy-consuming industry) is an important source of carbon emissions in cities, and the value-added ratio of the secondary industry is chosen to characterize the industrial structure of cities (Du and Sun, 2021).
(6) Agricultural land area. Agricultural carbon emissions have gradually become an important factor affecting total urban carbon emissions, and the agricultural land area was chosen to represent the characteristics of urban agriculture (Dong et al., 2020).
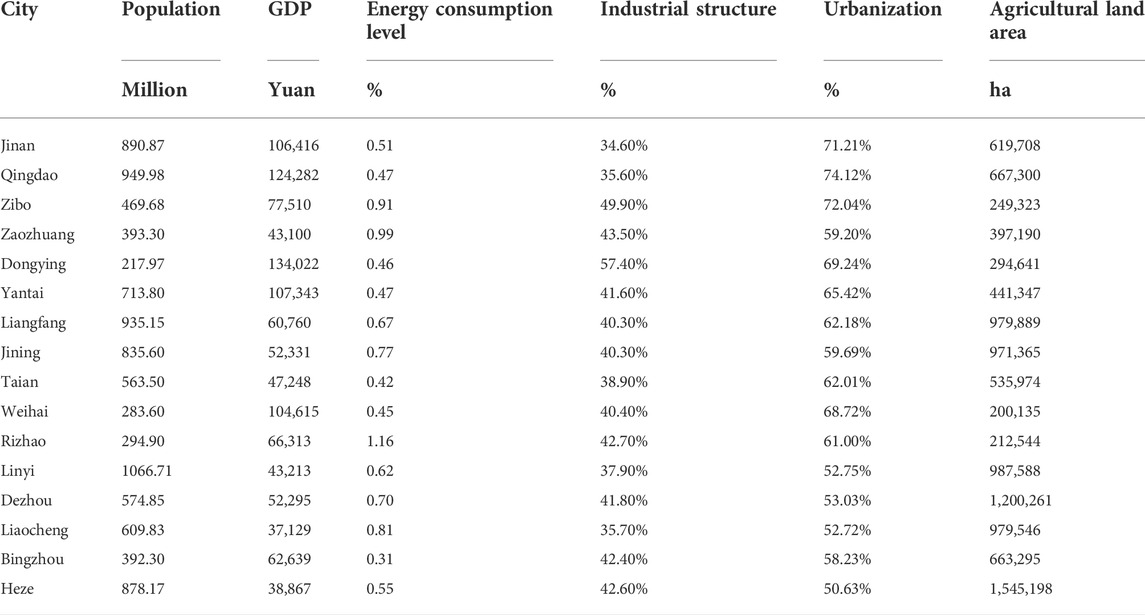
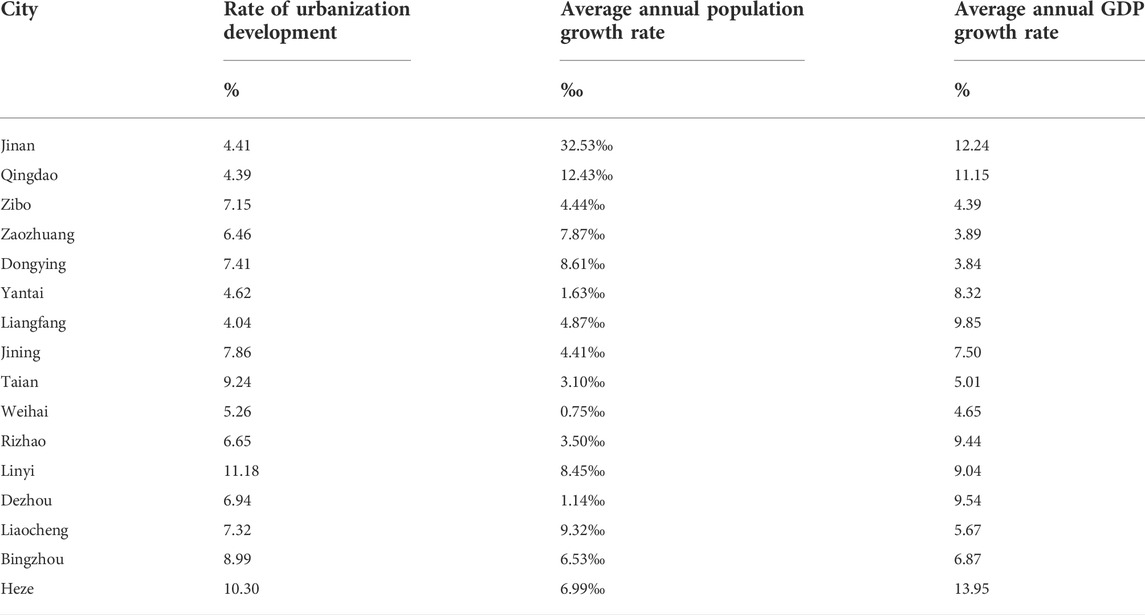
The data in this article were downloaded and compiled from the official statistical yearbook, among which the static index data are taken from the Statistical Yearbook of Shandong Province in 2020 and the statistical yearbooks of each city. Dynamic data are taken from the Statistical Yearbook of Shandong Province 2009–2020 and the statistical yearbooks of each city. The collected and collated data are shown in Tables 2, 3.
Results and analysis
Analysis of spatial and temporal characteristics of carbon emissions in Shandong Province
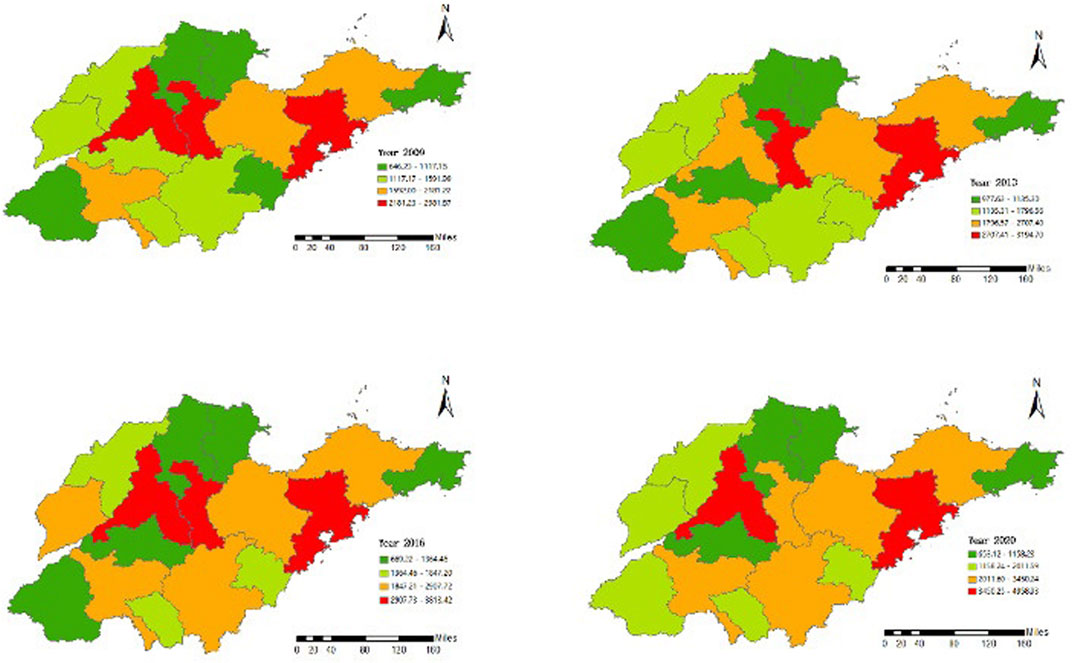
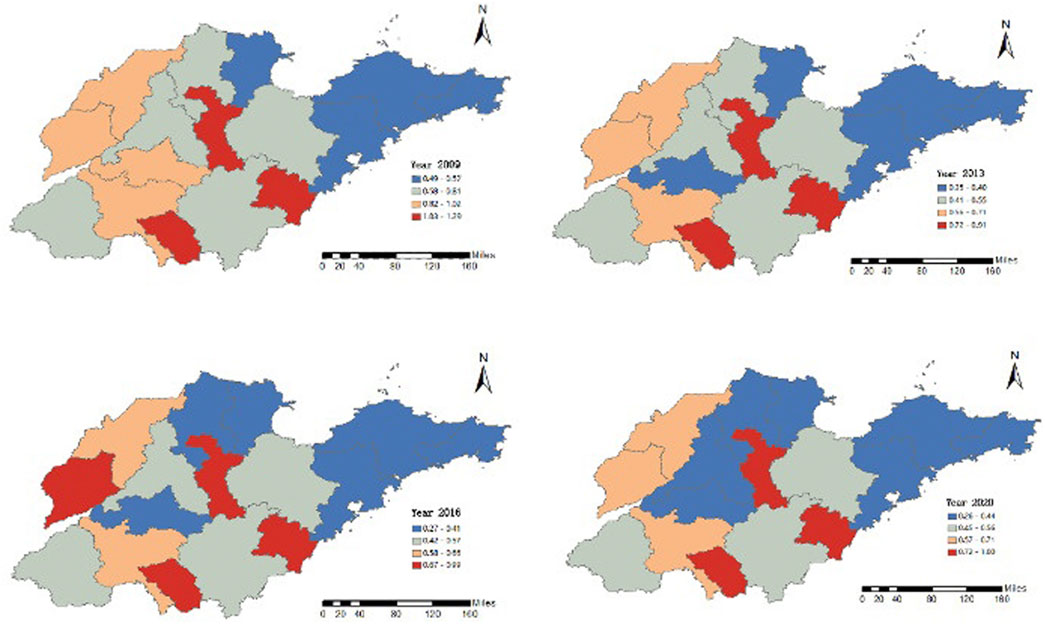
To facilitate the analysis of the current status of urban carbon emissions, four cross-sectional data for the years 2009, 2013, 2016 and 2020 were selected for the study. To accurately portray the spatial differences and temporal evolution trends of carbon emissions in 16 cities in Shandong, the natural breakpoint method was used to identify the natural turning points and characteristic points in the carbon emissions data as the grading criteria according to the statistical distribution pattern of the data. The carbon emissions were divided into four grades, and the grading results are shown in Figure 1.
Analyzing the spatial and temporal trends of the total carbon emissions of the whole region, we can see that most of the cities in Shandong province maintain an increasing trend of carbon emissions over time from 2009 to 2020. Although the overall carbon emissions are increasing, the carbon emission trends of different cities start to differ. Two cities, Jinan and Qingdao, start to show a decrease in carbon emissions. While inland cities such as Rizhao and Zibo are increasing carbon emissions year by year with the development of the industry. And the carbon emissions in coastal areas such as Yantai, Weihai, and Dongying are relatively stable.
Carbon emissions can only reflect the current overall emission level of local municipalities, which is an absolute indicator. In multi-city analysis and comparison, carbon emission intensity is often used as a criterion for city comparison because of the differences in economic level, population size, the historical basis of development, and other factors, resulting in absolute indicators often lacking comparability. The carbon emission intensity of 16 cities in Shandong Province was classified into four levels using the natural breakpoint method, and the grading results are shown in Figure 2.
In contrast to the rising trend of carbon emissions, the carbon emission intensity maintains a decreasing trend from 2010 to 2020. That is, the carbon emission generated per unit of GDP is gradually decreasing, and the energy efficiency of the whole region is improving year by year. However, the spatial distribution structure of carbon emission intensity changes at each time point. Zibo, Zaozhuang, and Rizhao were relatively high-value areas in 2000; the average carbon emission intensity of Dezhou, Liaocheng, and Tai’an in the middle or upper-middle level of the province was higher compared to the inland cities Binhai city, Jinan, Linyi, Langfang, etc. And the cities in the coastal area, such as Yantai, Qingdao, Weihai, etc., have lower carbon emission intensity. By 2016, Liaocheng joins the high-value city and the carbon emission intensity reaches a new high, while the carbon emission intensity of other cities is not much different from that of 2013. By 2020, the carbon emission intensity of inland cities such as Jinan and Tai’an decreases and successfully join the ranks of the third tier.
In summary, the total carbon emissions in the whole study re increase year by year during 2009–2020 and have been spatially maintained gradually decreasing from inland to coastal, with the provincial capital cities, as the core of the region, and major industrial cities being the high-value cities of carbon emissions in the city. Unlike the changes in carbon emissions, the carbon emission intensity is decreasing in the whole study area, but there are city differences in the magnitude of the decrease. Cities in the inland such as Jinan had the most significant decrease in carbon emission intensity; followed by cities in the middle and upper reaches such as Dezhou, which decreased by 0.055 Mt/billion in 2017; and cities in the coastal region had the smallest decrease.
The analysis found that the high-value cities of carbon emissions and carbon emission intensity do not exactly match, and the evolutionary trends of the two indicators are different, indicating that the energy use efficiency and emission reduction effectiveness of cities and towns are not the same, and the future development of carbon emission reduction policies in Shandong Province needs to be tailored to local conditions.
Clustering results
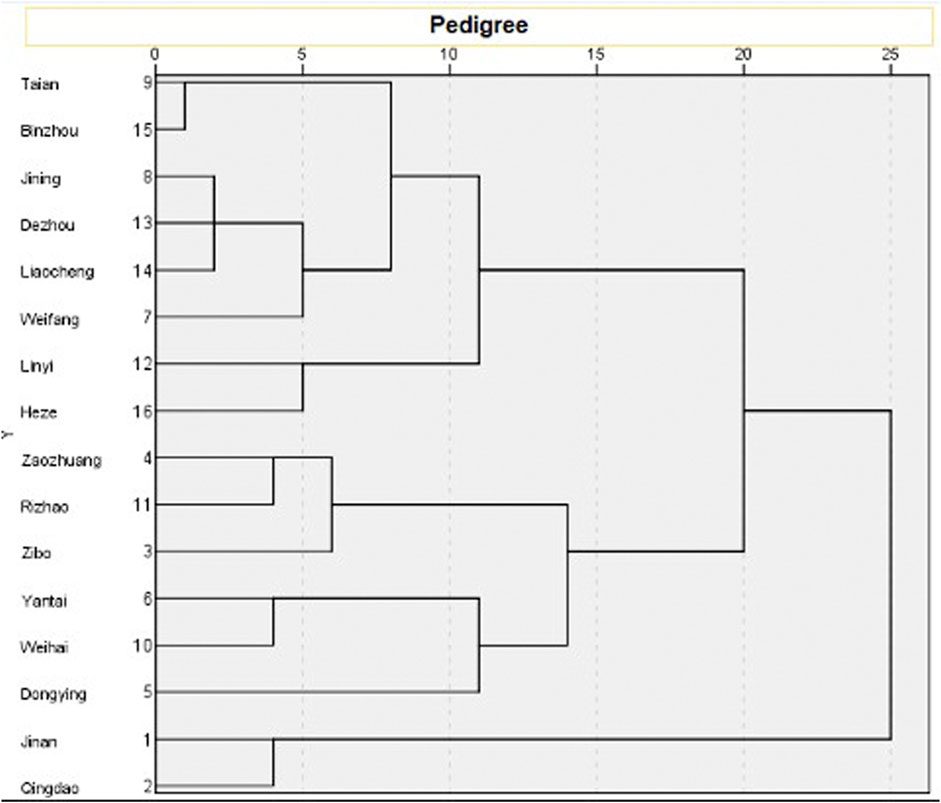
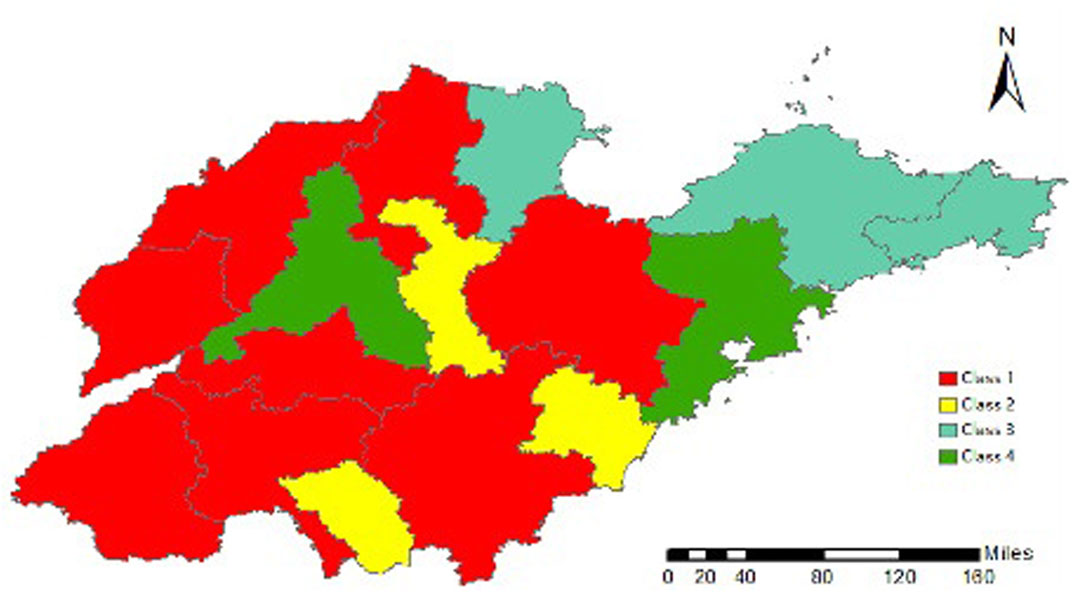
The collected data were imported into SPSS software, and a systematic cluster analysis was performed on 16 cities in Shandong Province by using squared Euclidean distance and standardizing the range 0–1, and the cluster spectrum is shown in Figure 3. The distance 12 was chosen to classify the 16 cities into four categories, the first category: Tai’an, Binzhou, Jining, Dezhou, Liaocheng, Weifang, Linyi, Heze; the second category: Zaozhuang, Rizhao, Zibo; the third category: Yantai, Weihai, Dongying; the fourth category: Jinan, Qingdao. As shown in Table 4.
The classification results are presented visually in the map using ArcGIS, and it can be seen from Figure 4 that the classification results do not fully reflect the continuity characteristics of the region. From the classification results, unlike the traditional east-west and north-south divisions, the classification results show dispersion and span in terms of geography. This also indicates that when formulating low-carbon emission reduction policies, promoting carbon emission peaks and realizing low-carbon development in Shandong Province, should not apply uniform methods and means and implement “one-size-fits-all” policies, but also avoid the wrong way of traditional regional classification, and conduct targeted classification guidance research based on the comprehensive characteristics of each city scientifically.
Cluster feature analysis
Through the above cluster analysis and based on the indicator data and overall characteristics of each category, the four categories classified can be summarized as “low economy high carbon type,” “high economy high carbon type,” “high economy low carbon type” and “low carbon demonstration type.” Low Carbon” and “Low Carbon Demonstration” cities.
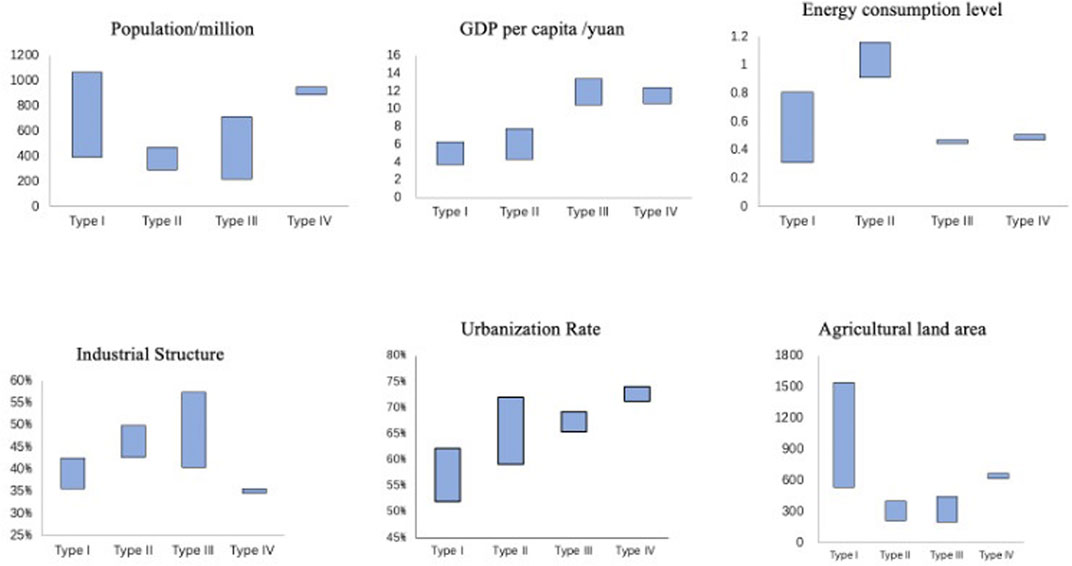
The distribution range and characteristics of indicators for each type of city are shown in Table 5.
To provide policy recommendations for the effective adoption of low-carbon emission reduction measures in each city, an analysis of carbon emission characteristics of various cities should be taken. Figures 5, 6 give the indicator characteristics of each city, and a detailed analysis of the four types of cities is carried out according to the distribution range and characteristics of each indicator data.
The first category of low economic and high carbon type cities. The economic development of this type of city is relatively backward, with low GDP per capita, between 37,129 and 62,639 yuan, located below the provincial average. However, energy consumption is high, and the energy consumption of 10,000 yuan GDP in several areas exceeds the provincial average, including Jining and Liaocheng, which reach 0.77 tons of standard coal and 0.81 tons of standard coal, among the top five in the province in terms of energy consumption intensity. With the same level of economic development, the level of urbanization in this category is also relatively low, with the urbanization rate ranging from 52.03% to 62.18%, which is below the provincial average. From the above data, it can be concluded that the first category cities are currently in the development stage of economy, industrialization, and urbanization, and the development level is relatively lower than other categories of cities. However, the average annual GDP growth rate and urbanization speed are at the top of the province.
The agricultural land area indicators can be derived from this type of city of the agricultural land area is more extensive, accounting for up to 71.84% of the province, and the primary industry accounted for 10.33, higher than the average level of the province, so agricultural carbon emissions also make a certain contribution to the overall high carbon emissions.
The second type of “high economic and high carbon” cities. Relative to the first category, the second category cities have a higher level and speed of economic development and are located in the middle or upper-middle of the province, among which Rizhao and Zibo have a GDP per capita of more than 65,000 yuan, and Rizhao has a GDP per capita growth rate of 9.44%. However, its “high carbon” characteristics are particularly obvious, and the energy consumption intensity of 10,000 Yuan GDP in all cities of the second category exceeds the provincial average, between 0.91 tons and 1.16 tons of standard coal, with an average of 1.02 tons of standard coal. The urbanization rate and growth rates are 64.08% and 6.75% on average, located at the middle level of the province. The overall industrial structure of such cities is relatively heavy, and Zibo City, as a typical old industrial city in Shandong, is particularly urbanized and industrialized, with an urbanization rate of 72.04% and a secondary industry share of 49.90%, both of which are at the forefront of the province. Such cities have a small population and slow growth rate, but their “high consumption and high emission” industrialization development approach has led to a higher level of economic development and relatively high per capita carbon emissions.
The third type of “high economic and low carbon” cities, including Yantai, Weihai, and Dongying, are mainly located in the eastern coastal region. These cities are characterized by a high level of economic development but low energy consumption, good carbon emission reduction effect, and have passed the second category of “high economic and high carbon” development period, controlling carbon emission while high economic development and high resource utilization. The average GDP per capita of such cities is 114,326 yuan, and Dongying City is as high as 134,022 yuan, much higher than the provincial average, while the average energy consumption of 10,000 yuan GDP is 0.46 tons of standard coal, lower than the provincial average. The level of urbanization is high, with an urbanization rate of about 67.79%. The low-carbon ecological construction of this type of city has been effective, but the industrial structure should continue to be improved, and continue to control carbon emissions while maintaining economic development.
The fourth category of “low-carbon demonstration type” cities, of which Qingdao is the first low-carbon pilot city in the province. The main characteristics of the fourth type of city are similar to the third type of high economic low carbon type, but the overall low carbon development level is higher than the third type of city. It is characterized by a high level of economic development, with an average GDP per capita of 115,349 yuan, which is at the forefront of the province; the energy consumption of 10,000 yuan GDP is 0.49 tons of standard coal, with a high energy intensity and energy consumption level. The large population size and the average annual growth rate of the population in this type of city are the key population inflow cities in the province. In addition, the industrial structure presents a good state, the internal structure of the primary industry is improved, and with the industrial structure adjustment, the proportion of the secondary industry decreases, averaging 35.10%. At present, the development is mainly based on tertiary industry, and the service industry has realized the upgrade transformation from traditional to modern. With the construction and development, the urbanization rate has reached a high level and the growth rate has started to slow down. Such cities have reached the low-carbon goal, and can control the growth of carbon emissions while economic development, and should follow up to achieve the “emission peak” task as early as possible to make an example for other cities in the province.
Policy suggestions
For the four types of cities, “low economy high carbon,” “high economy high carbon,” “high economy low carbon” and “low carbon demonstration,” if we continue to follow the existing economic development model, the urban development of the former will evolve into the urban development stage of the latter as time goes by. Therefore, for cities with different development characteristics, in order to avoid the old path of “pollution before treatment” and “development before carbon reduction,” based on the analysis of the development characteristics of various types of cities, we will give specific suggestions to effectively promote their low carbon emission reduction process and achieve “leapfrog development.”
The fourth category of cities is low-carbon demonstration cities in the province, with the development level and urbanization rate at the forefront of the province. Jinan and Qingdao have the initial conditions to reach the carbon peak, so they should lead the province in low-carbon construction, achieve the peak and decouple as soon as possible, and lay a good foundation for achieving carbon neutrality. Firstly, we should continue to optimize the industrial and energy structure. At present, the industrial structure of these cities is good, and the proportion of secondary industry in Qingdao and Jinan has been reduced to 35.6% and 34.6%, while the proportion of tertiary industry has increased to 60.89% and 61.79%. The second is to strengthen energy conservation, reduce energy consumption and improve energy utilization. We will strengthen industrial energy efficiency, enhance building energy efficiency and promote transportation energy efficiency. Third, accelerate the construction of green cities. We will create a green industrial system, carry out pilot projects in green areas, and actively promote low-carbon concepts and low-carbon lifestyles for all people.
The third category of cities has achieved remarkable results in low carbon construction, with high energy utilization and effective reduction of carbon emission in the process of economic development. The next step is to optimize the industrial structure. On the one hand, we should promote the transformation and upgrading of traditional industries, increase the efforts to eliminate backward production capacity, and reduce high pollution and high emission industries. On the other hand, we should increase the cultivation of new industries, vigorously develop service industries, and increase the proportion of the added value of tertiary industries; secondly, we should strengthen technical support and policy guidance, and establish and implement market-based mechanisms for energy conservation and emission reduction; finally, we should use city resources to explore sustainable development paths. Finally, Yantai, Weihai, and Dongying should actively use marine resources to build a green and low-carbon recycling economy and respond to the national requirement of increasing carbon sink capacity by developing marine “blue carbon,” strengthening marine ecological protection and restoration, and enhancing marine carbon sequestration.
The second category of cities has high energy consumption along with economic development. In the process of continuing to promote industrialization and urbanization development, attention should be paid to abandoning the old development model of high energy-consuming, high-polluting, and high-emission industries, re-laying the industrial system, and planning a low-carbon urban pattern. First, we should promote the upgrading of low-carbon industries. In the secondary industry, we should promote the transformation and upgrading of industry, adopt low-carbon and environmental protection technologies to upgrade traditional industries, and reduce high-consumption and high-emission industries. The third industry increases the development of new industries, and promotes the transformation and upgrading of the service industry; the second promotes the transformation of low-carbon energy. Clean low-carbon energy is the main direction of adjusting the energy structure, adhering to the clean use of fossil energy and vigorously developing non-fossil energy, and strictly implementing the dual control of energy consumption intensity and total. Improve energy utilization technology to reduce energy consumption intensity.
Although the energy consumption intensity is lower than that of the second category, the first category is in the stage of rapid industrialization and urbanization, and the carbon emission will continue to rise as the economy continues to develop. To avoid the old road of “pollution first and then treatment,” we should change the economic development mode and focus on the layout of a low-carbon industrial system. First, targeting high-carbon industries, transforming and upgrading traditional old energy. Accelerate the elimination of backward production capacity in the electric power industry, actively promote production capacity in the iron and steel industry, and strictly control new production capacity in the non-ferrous industry. The second is to strengthen the construction of energy-saving, new buildings to fully implement green building design standards, promote the creation of green construction technology demonstration projects, accelerate the process of green construction, reduce carbon emissions in infrastructure construction, and the concept of low carbon into the urbanization process. Third, advocate the development of green agriculture, the first type of cities of agricultural land accounted for more than half of the province, agricultural carbon emissions are a key link to promoting the low-carbon development of such cities. Therefore, it is necessary to reduce the use of pesticides, fertilizers, and other harmful substances, reduce high-energy-consuming agricultural machinery and equipment, and establish an agricultural economic system with green, low-carbon, and cyclic development. Fourth, we should promote the concept of low-carbon for all people and advocate a low-carbon lifestyle.
Conclusion
Under the background of “double carbon,” it is urgent to effectively implement urban carbon reduction governance and promote urban low-carbon transition development. However, due to many factors such as natural resources, socio-economics and technology level, there are large differences in the development characteristics of different cities, so the low-carbon development plan of each region should be designed and promoted by classification. In this paper, we use cluster analysis to classify 16 cities in Shandong Province, and according to the clustering results, we can classify 16 regions in Shandong Province into four categories, which are “low economic high carbon type,” “high economic high carbon type,” “Based on the analysis of the classification results, scientific suggestions are provided to promote low-carbon development in each type of region.
The research content of this paper has certain significance in both theory and practice. First of all, in terms of theory, the research object is selected as a specific city, which narrows the scope of the study and makes the policy recommendations more practical and effective, and the factors influencing carbon emissions are selected by considering both static and dynamic aspects, which strengthens the scientific nature of the study. In practice, because it can be seen from the classification results that although there is a great correlation between carbon emissions and socio-economic development, the socio-economic development index cannot be completely used as the basis for the classification of carbon emission reduction regions. Moreover, the results of clustering show incomplete regional continuity, indicating that neither undifferentiated uniformity can be carried out in future regional carbon emission reduction guidance, nor can carbon emission reduction actions be fully promoted by geographical location division. This study proposes that in promoting carbon emission reduction and low-carbon transition in the future, provincial regions should fully consider the characteristics of cities with different carbon emission types and formulate targeted and effective policies based on their different conditions, which will not only help provincial regions achieve carbon emission reduction targets, but also help promote regional development and narrow the relative development gap between regions. Therefore, the policy recommendations proposed in this paper provide support for the government to effectively promote the development of low-carbon transition in each city.
In addition, there are some limitations in this paper, mainly in the selection of specific indicators, due to the availability of data and other reasons, all relevant factors affecting carbon emissions were not selected, about which further research will be conducted subsequently.
Data availability statement
The datasets presented in this study can be found in online repositories. The names of the repository/repositories and accession number(s) can be found below: http://tjj.shandong.gov.cn/col/col6279/index.html.
Author contributions
AY: idea, Methodology, Investigation, performed the experiment, Writing - Original Draft. LZ: Conceptualization, Supervision, Writing - Review & Editing. SZ: Data Curation and Data Visualization. ZZ: Data Curation. JS: Data Curation and helped perform the analysis with constructive discussions.
Conflict of interest
The authors declare that the research was conducted in the absence of any commercial or financial relationships that could be construed as a potential conflict of interest.
Publisher’s note
All claims expressed in this article are solely those of the authors and do not necessarily represent those of their affiliated organizations, or those of the publisher, the editors and the reviewers. Any product that may be evaluated in this article, or claim that may be made by its manufacturer, is not guaranteed or endorsed by the publisher.
References
Aubrey, T., Wang, H., and Alimujiang, K. (2015). Evaluation of environmental. pollution level in Western region based on systematic cluster analysis. Glacial Permafr. 37, 266–270.
Auffhammer, M., Sun, W. Z., Wu, J. F., and Zheng, S. (2016). The decomposition and dynamics of industrial carbon dioxide emissions for 287 Chinese cities in 1998-2009[J]. J. Econ. Surv. 30, 460–481. doi:10.1111/joes.12158
Chen, J. D., Gao, M., Cheng, S. L., Hou, W., Song, M., Liu, X., et al. (2020b). County-level CO2 emissions and sequestration in China during 1997-2017. Sci. Data 7, 391. doi:10.1038/s41597-020-00736-3
Chen, Y., Wang, M. Y., Feng, C. P., Zhou, H. D., and Wang, K. (2020a). Total factor energy efficiency in Chinese manufacturing industry under industry and regional heterogeneities. Resour. Conserv. Recycl. 168, 105255. doi:10.1016/j.resconrec.2020.105255
Cheng, Z. H., Liu, J., Li, L. H., and Gu, X. B. (2020). Research on meta-frontier total-factor energy efficiency and its spatial convergence in Chinese provinces. Energy Econ. 86, 104702. doi:10.1016/j.eneco.2020.104702
Dong, B. Y., Ma, X. J., Zhang, Z. L., Zhang, H., Chen, R., Song, Y., et al. (2020). Carbon emissions, the industrial structure and economic growth: Evidence from heterogeneous industries in China. Environ. Pollut. 262 (7), 114322. doi:10.1016/j.envpol.2020.114322
Du, J., and Sun, Y. (2021). The nonlinear impact of fiscal decentralization on carbon emissions:from the perspective of biased technological progress. Environ. Sci. Pollut. Res. 28, 29890–29899. doi:10.1007/s11356-021-12833-w
Fu, Y., He, C. Y., and Luo, L. (2021). Does the low-carbon city policy make a difference? Empirical evidence of the pilot scheme in China with DEA and PSM-DID. Ecol. Indic. 122, 107238–238. doi:10.1016/j.ecolind.2020.107238
Gao, Y. N., Zhang, M. C., and Zheng, J. H. (2020). Accounting and determinants analysis of China’s provincial total factor productivity considering carbon emissions. China Econ. Rev. 65, 101576. doi:10.1016/j.chieco.2020.101576
Gu, C. L. (2019). Urbanization: Processes and driving forces. Sci. China Earth Sci. 62, 1351–1360. doi:10.1007/s11430-018-9359-y
Guo, F., Wang, C., and Zhang, S. H. (2021). Cluster analysis of carbon attainment trends in Chinese cities. China Environ. Manag. 13, 40–48. doi:10.16868/j.cnki.1674-6252.2021.01.040
Guo, R., and Yuan, Y. J. (2020). Different types of environmental regulations and heterogeneous influence on energy efficiency in the industrial sector: Evidence from Chinese provincial data. Energy Policy 145, 111747–747. doi:10.1016/j.enpol.2020.111747
Hu, Y., Peng, L., Li, X., Yao, X., Lin, H., and Chi, T. (2018). A novel evolution tree for analyzing the global energy consumption structure. Energy 147, 1177–1187. doi:10.1016/j.energy.2018.01.093
Jiang, J., Ye, B., Xie, D., and Tang, J. (2017). Provincial-level carbon emission drivers and emission reduction strategies in China:combining multi-layer LMDI decomposition with hierarchical clustering. J. Clean. Prod. 169, 178–190. doi:10.1016/j.jclepro.2017.03.189
Jiao, J., Jiang, G., and Yang, R. (2018). Impact of R&D technology spillovers on carbon emissions between China’s regions. Struct. Chang. Econ. Dyn. 47, 35–45. doi:10.1016/j.strueco.2018.07.002
Li, B., Han, S. W., Wang, Y. F., Wang, Y. F., Li, J. Y., and Wang, Y. (2020). Feasibility assessment of the carbon emissions peak in China's construction industry: Factor decomposition and peak forecast. Sci. Total Environ. 706 (9), 135716. doi:10.1016/j.scitotenv.2019.135716
Lin, B. Q., and Du, K. R. (2015). Modeling the dynamics of carbon emission performance in China: A parametric malmquist index approach. Energy Econ. 49, 550–557. doi:10.1016/j.eneco.2015.03.028
Liu, Y., and Feng, C. (2020). Decouple transport CO2 emissions from China’s economic expansion: A temporal-spatial analysis. Transp. Res. Part D Transp. Environ. 79, 102225. doi:10.1016/j.trd.2020.102225
Liu, Y. (2020). Regional projections of China's carbon emission peaking in 2030 and analysis of influencing factors. Shangdong: Shandong University.
Pan, X., Pan, X., Jiao, Z., Song, J., and Ming, Y. (2019). Stage characteristics and driving forces of China’s energy efficiency convergence—an empirical analysis. Energy Effic. 12, 2147–2159. doi:10.1007/s12053-019-09825-8
Peters, G. P., and Hertwich, E. G. (2008). Post-kyoto greenhouse gas inventories: Production versus consumption. Clim. Change 86, 51–66. doi:10.1007/s10584-007-9280-1
Saldivar, N. D. (2010). A global typology of cities: Classification tree analysis of urban resource consumption. Cambridge: Massachusetts Institute of Technology.
Schipper, L., Murtishaw, S., Khrushch, M., Ting, M., Karbuz, S., and Unander, F. (2001). Carbon emissions from manufacturing energy use in 13 IEA countries:Long-term trends through 1995. Energy Policy 29, 667–688. doi:10.1016/s0301-4215(00)00163-4
Shan, Y., Guan, D., Zheng, H., Ou, J., Li, Y., Meng, J., et al. (2018b). China CO2 emission accounts 1997–2015. Sci. Data 5, 170201. doi:10.1038/sdata.2017.201
Shan, Y. L., Gyan, D. B., Hubacek, K., Zheng, B., Davis, S. J., Jia, L., et al. (2018a). City-level climate change mitigation in China. Sci. Adv. 4, eaaq0390. doi:10.1126/sciadv.aaq0390
Su, K., Wei, D. Z., and Lin, W. X. (2020). Influencing factors and spatial patterns of energy-related carbon emissions at the city-scale in Fujian province, Southeastern China. J. Clean. Prod. 244, 118840. doi:10.1016/j.jclepro.2019.118840
Wang, C., and Zhang, Y. X. (2020). The pathway and policy system of carbon neutrality vision. China Environ. Manag. 12, 58–64. doi:10.16868/j.cnki.1674-6252.2020.06.058
Wang, J. (2012). Regional carbon inequality in China: Measurement and influencing factors (Doctoral dissertation). Chongqing: Chongqing University.
Wang, S. J. (2018). Driving factors of Carbon emissions in China: Based on provincial. level from 2004 to 2014. J. Financial Econ. 8, 37–39. doi:10.14057/j.cnki.cn43-1156/f.2018.08.016
Wang, S. J., Fang, C. L., Ma, H. T., Wang, Y., and Qin, J. (2014). Spatial differences and multimechanism of carbon footprint based on GWR model in provincial China. J. Geogr. Sci. 24, 612–630. doi:10.1007/s11442-014-1109-z
Wang, S. J., Su, Y. X., and Zhao, Y. B. (2018). Regional inequality, spatial overflow effects and influencing factors of China’s city-level energy-related carbon emissions. J. Geogr. 73, 414–428.
Wang, W. B., and Ma, X. (2020). Science and technology investment, networks characteristics and ecological efficiency - a case study of central plains urban agglomerations. Technol. Econ. 39, 109–118.
Wang, Y., Cheng, X., and Yin, P. H. (2013). Regional characteristics affecting China's carbon emission performance: Cluster analysis based on entropy method. J. Nat. Resour. 28, 1106–1116.
Xu, B., Xu, L., Xu, R., and Luo, L. (2017). Geographical analysis of CO 2 emissions in China's. Manufacturing industry: A geographically weighted regression model. J. Clean. Prod. 166, 628–640. doi:10.1016/j.jclepro.2017.08.052
Xu, G., Schwarz, P., and Yang, H. (2020). Adjusting energy consumption structure to achieve China’s CO2 emissions peak. Renew. Sustain. Energy Rev. 122, 109737. doi:10.1016/j.rser.2020.109737
Xu, Q., Dong, Y. X., and Yang, R. (2018). Urbanization impact on carbon emissions in the Pearl River Delta region: Kuznets curve relationships. J. Clean. Prod. 180, 514–523. doi:10.1016/j.jclepro.2018.01.194
Xu, R., and Donald, W. (2005). Survey of clustering algorithms. IEEE Trans. Neural Netw. 16, 645–678. doi:10.1109/tnn.2005.845141
Yilin, Z., and Ming, L. (2018). Are large cities more environmentally unfriendly? -Based on the analysis of scale effect and cohort effec. J. Fudan Soc. Sci. Ed. 60, 133–144.
Yu, S., Wei, Y. M., Fan, J., Zhang, X., and Wang, K. (2012). Exploring the regional characteristics of inter-provincial CO2 emissions in China: An improved fuzzy clustering analysis based on particle swarm optimization. Appl. Energy 92, 552–562. doi:10.1016/j.apenergy.2011.11.068
Zhang, B., Yao, N., and Liu, X. M. (2011). A preliminary study on carbon emissions in China by provinces based on fuzzy clustering. China Population-Resources Environ. 21, 53–56.
Zhang, L., and Ma, L. (2020). The relationship between industrial structure and carbon intensity at different stages of economic development: An analysis based on a dynamic threshold panel model. Environ. Sci. Pollut. Res. 12, 33321–33338. doi:10.1007/s11356-020-09485-7
Zhang, L. (2017). Research on the impact of urbanization process on carbon emissions. Beijing: China University of Mining and Technology.
Zhang, S., and Zhao, T. (2019). Identifying major influencing factors of CO2 emissions in China: Regional disparities analysis based on STIRPAT model from 1996 to 2015. Atmos. Environ. 207, 136–147. doi:10.1016/j.atmosenv.2018.12.040
Zhang, X., Geng, Y., Tong, Y. W., Kua, H. W., Dong, H., and Pan, H. (2021b). Trends and driving forces of low-carbon energy technology innovation in China’s industrial sectors from 1998 to 2017: From a regional perspective. Front. Energy 15 (2), 473–486. doi:10.1007/s11708-021-0738-z
Keywords: carbon emission characteristics, temporal and spatial, cluster analysis, low carbon, governance strategies
Citation: Yang A, Zhang L, Zhang S, Zhan Z and Shi J (2022) Research on the temporal and spatial characteristics, spatial clustering and governance strategies of carbon emissions in cities of Shandong. Front. Environ. Sci. 10:1024122. doi: 10.3389/fenvs.2022.1024122
Received: 21 August 2022; Accepted: 26 September 2022;
Published: 13 October 2022.
Edited by:
Kangyin Dong, University of International Business and Economics, ChinaReviewed by:
Jing Yin, Beijing University of Civil Engineering and Architecture, ChinaLibo Liu, Ningxia University, China
Copyright © 2022 Yang, Zhang, Zhang, Zhan and Shi. This is an open-access article distributed under the terms of the Creative Commons Attribution License (CC BY). The use, distribution or reproduction in other forums is permitted, provided the original author(s) and the copyright owner(s) are credited and that the original publication in this journal is cited, in accordance with accepted academic practice. No use, distribution or reproduction is permitted which does not comply with these terms.
*Correspondence: Long Zhang, emhhbmdsb25nZHJhZ29uQGhvdG1haWwuY29t
†These authors share first authorship
 Ahui Yang
 Long Zhang*†