 Linghong Zhang*
 Wenchao Yu
- School of Business, Shandong Normal University, Jinan, China
More and more green manufacturers are entering the market, which poses a challenge to ordinary manufacturers as to whether they must produce environmental products. Motivated by competition between green manufacturers and ordinary manufacturers, this study examines how an ordinary manufacturer that produces a traditional product (product 1) adapts its product portfolio to compete with a new-entrant green manufacturer. The sale period is divided into two periods. In period 1, the green manufacturer enters the market and provides one green product (product 2). Subsequently, the ordinary manufacturer decides whether to develop a green product (product 3) in period 2. The products are differentiated in two characteristics: traditional quality and environmental quality. We derive the demand function by comparing the consumer utility obtained from the three products. Then, we investigate the ordinary and green manufacturers’ optimal decisions using game theory. Furthermore, we study how government subsidy of green products affects the two manufacturers’ decisions. Finally, we extend our model to discuss the market position of the two green produc2ts when the green technology level is fixed for two manufacturers. Our study suggests that 1) the ordinary manufacturer may not introduce the green product when the difference in environmental quality between two green products is much larger; 2) government subsidy is effective in stimulating the ordinary manufacturer to introduce green product, especially when the traditional manufacturer could provide high-environmental-quality product; and 3) the manufacturer’s green technology level and green technology maturity, and consumers’ willingness to pay for traditional quality, together affect product position.
Introduction
Green products with environmental technology development have recently captured the interest of the public and private sectors. With the rise in consumers’ environmental awareness, manufacturers that only produce environmentally friendly products (for example, Tesla) are entering the market, imposing high competitive pressure and eroding the market share of ordinary manufacturers that often only produce traditional products without much environmental consideration. For ordinary manufacturers (incumbent manufacturers), one strategy is to use pricing to compete with the entrant. In some cases, the incumbent may introduce new products with environmentally friendly design to compete with the entrant. For example, traditional car makers such as Nissan, General Motors, and Chevy Volt have introduced electric or hybrid cars to capture the markets in search of higher profit (Cohen et al., 2015).
However, if an ordinary manufacturer introduces an inappropriate product, it may fail to capture the market share and obtain a higher profit. A study of 126 U.S. durable goods firms reported that 40% of new products failed after launch (Ettlie, 1993). Manufacturers must make trade-offs between the design and performance of a product in the new product development process, and they must take account of competing products in the market. In the context of environmentally friendly product for ordinary manufacturers, whether to introduce a green product version and, if so, its environmental quality (i.e., whether it shall be higher than, lower than, or the same as that of the green manufacturer) are critically important for success in the market. Therefore, the purpose of this paper is to understand how an ordinary manufacturer can develop its product portfolio to face competition from a newly emerging green product maker. Specifically, we primarily address the following questions:
1) How would the entrant’s green product influence the incumbent’s strategy to accommodate the entrant (i.e., introducing one green product or not)?
2) In what conditions could the ordinary manufacturer introduce green product, and what kind of green product could be introduced?
3) How does the government subsidy affect manufacturers’ strategies?
We consider a competition problem between two manufacturers: manufacturer 2 (the entrant and the green product’s producer) sets the price for its green product (product 2) and enters into the market. The incumbent firm (ordinary manufacturer/manufacturer 1) provides traditional product (product 1) for consumers in the market and decides whether to introduce a new version of product (product 3) to compete with the entrant. We assume that each product has two basic attributes: the traditional attribute/quality and the environmental attribute/quality. We assume that the three products’ traditional attributes are the same: first, we study the optimal prices of products 2 and 3, considering product competition. We also present the incumbent firm’s optimal product strategy using simulation; then, we analyze the effects of government subsidy of green products on the strategies of manufacturers 1 and 2. Considering the three products’ different traditional and environmental attributes, we first study the optimal traditional quality and price of product 2 and discuss products 2’s optimal market positioning; then, we explore product 3’s traditional quality and price when manufacturer 1 decides to produce green product, and we discuss product 3’s optimal market position. We obtain several interesting conclusions: when the three products have the same traditional quality, then 1) the ordinary manufacturer may not introduce green product when the difference in environmental quality between two green products is much larger; 2) government subsidy could encourage the ordinary manufacturer to produce green product, and the subsidy would be more effective in incentivizing the ordinary manufacturer to produce green product if the ordinary manufacturer could produce higher-environmental-quality product; and 3) product 2’s market position is determined by the environmental quality of product 2, the green cost coefficient, and consumers’ willingness to pay for traditional quality, while product 3’s market position is determined by the green cost coefficient and product 3’s environmental quality.
The contribution of the paper is threefold. First, few articles have studied how ordinary manufacturers respond to the entry of green manufacturers (Benthem et al., 2008; Lobel and Perakis, 2011; Alizamir et al., 2016). However, it is meaningful to explore how ordinary manufacturers react to green manufacturers, especially when there are more and more green manufacturers entering the market. Second, most studies (Zhang et al., 2015; Zhu and He, 2016; Li et al., 2020; Liu et al., 2021) of green products have focused on the environmental quality (e.g., the carbon emission of a vehicle) of green products but neglected the traditional quality (e.g., the safety of the electric vehicle) of the product. However, traditional quality is often the first factor to be considered by the consumer, especially when the traditional quality of the green product is worse than that of the ordinary product. Third, studies of market entry have mainly focused on the optimal pricing and entry times (Klastorin and Tsai, 2004; Schmidt and Druehl, 2005; Alptekinoglu and Corbett, 2008; Seref et al., 2016) but have not considered quality differences between two products. In fact, the entrant’s product and the incumbent’s product are always different. In this study, we extend prior research by considering that the entrant’s and the incumbent’s products are distinct in two aspects, namely, their traditional and environmental qualities, and we discuss products’ market positioning problem.
This paper is organized as follows. The Literature review section gives the related literature. The Model description and analysis section presents products’ optimal prices and manufacturer 1’s product strategy (introducing or not introducing green product). The Government subsidy section illustrates how the government subsidy affects the manufacturers’ decisions. The Extension section extends the model to a scenario in which the three products are different in traditional quality and gives the optimal product position of the green products. The Discussion section discusses the main results. The Conclusion and future research section concludes the paper. All proofs are relegated to Appendix A.
Literature review
There are two streams of research directly related to our study. The first stream investigates how to determine the environmental quality and the price of green products and the impact of government policy on manufacturers’ strategies. The environmental quality of the product includes the clean-up level, emission level, and eco-labeling. Chen (2001) examined how to design the traditional and environmental quality and price of both green and traditional products to maximize profit and found that green product development and stricter environmental standards might not necessarily benefit the environment. Amacher et al. (2004) investigated how to set green technology investment (eco-labeling) to maximize the manufacturer’s profit, and they showed that socially optimal investment for both firms is always positive but is lower than in the duopoly solution. Su et al. (2012) detailed how Zero-Sum and Synergy technology impact the market structure strategy for green products and indicated that to increase total green quality, investing in technology improvement to enable Synergy is more effective than introducing more products. Liu et al. (2012) showed how to set environmental quality with retailer and manufacturer competition. Yang et al. (2020) studied the equilibrium solutions that two enterprises can achieve in terms of technical strategies and analyzed the effect of government subsidies, concluding that government subsidy is conducive to expanding the green product market and improving social welfare. Işık et al. (2021) investigated the convergence of per capita ecological footprints. Tirkolaee et al. (2021) proposed an integrated decision-making approach for green supplier selection to provide products with lower prices and higher quality. Isik et al. (2021) investigated the validity of the environmental Kuznets curve hypothesis for eight OECD countries. Goli et al. (2020) aimed to minimize the related costs and total CO2 emissions and to maximize social responsibility, considering lead time for the production and delivery of perishable products. They showed that the novel hybrid algorithm provides Pareto solutions with acceptable quality and diversity. Lotfi et al. (2022) investigated the time–cost–quality–energy–environment problem in executing projects with resource constraints.
With the government policy (e.g., environmental standard, subsidy and tax policy), Bansal and Gangopadhyay (2003) investigated a policy of discriminatory subsidy and concluded that it improves welfare and also mitigates total pollution; they concluded that a policy of discriminatory subsidy is welfare-improving and also mitigates total pollution. Lombardini-Riipinen (2005) investigated how governments set socially optimal emissions and commodity tax policy and showed that when firms compete in environmental quality, a combination of a uniform ad valorem tax and an emission tax can induce the social optimum. Yakita and Yamauchi (2011) explored how the environmental R&D strategies of firms in symmetric equilibrium affect levels of social welfare and found that the degree of product differentiation is positively correlated with social welfare. Alizamir et al. (2016) analyzed how the government sets electricity purchasing prices using a feed-in tariff policy with renewable energy technologies. They characterized a no-delay region in the problem’s parameters, such that the profitability index should strictly decrease over time if the diffusion and learning rates belong to this region. Raz and Ovchinnikov (2015) presented a stylized framework for analyzing the design of government incentives for public-interest goods. Işık et al. (2022) investigated optimal government spending levels considering the environment and GDP. Cohen et al. (2015) studied government subsidies for the green technology adoption price-setting newsvendor model and showed that when policymakers such as governments ignore demand uncertainty when designing consumer subsidies, they can significantly miss the desired adoption target level. Hong et al. (2021) examined the impact of corporate subsidy and consumer subsidy policies on a market comprising two vertically differentiated products: green products and low-green products. They found that subsidy for firm policy is capable of inducing a higher level of green product adoption than subsidy for consumer policy. Işık et al. (2020) explored the efficacy and the impact of the economic policy uncertainty index in predicting the tourism demand on international tourist arrivals. Chen et al. (2022) developed a differential game-based model to explore optimal production and subsidy rates considering the different objectives of maximizing government social welfare and maximizing government utility.
However, most of the literature has only employed environmental quality in differentiating products and has focused on how to set green products’ environmental quality and prices and on the impact of government policy; they have not considered competition between ordinary and green manufacturers. In this article, we distinguish green product and ordinary product in two aspects: traditional quality and environmental quality. This is in line with reality because the traditional quality of some environmental products is lower than that of ordinary products. We also explore whether the ordinary manufacturer must adjust their product strategy to compete with the green manufacturer. The second stream of relevant literature, accordingly, includes papers that analyze problems related to entry model with price competition. Alptekinoglu and Corbett (2008) studied competition between two multi-product firms with distinct production technologies in a market where customers have heterogeneous preferences on a single-taste attribute and found that an MP facing competition from an MC offers lower product variety than does an MP monopolist to reduce the intensity of price competition. Plambeck and Wang (2009) investigated how two manufacturers determine the prices of old and new products, when there is e-waste regulation of new product introduction, in a stylized model of the electronics industry, and showed that a fee upon sale would increase manufacturers’ profit. Koca et al. (2010) studied product rollover strategy decisions, in which a firm decides whether to phase out an old generation of a product to replace it with a new generation, with either a dual or single roll; they concluded that lower market risk and higher performance improvement for the new generation are associated with the single roll strategy. Su and Rao (2011) studied the timing of new product pre-announcement and launch when two firms compete in the same market and showed that anticipated competitor’s timing choices are the most significant factors. Rubel (2013) studied how firms price new products when they do not know the timing, nor the nature, of the next competitive entry and demonstrated that the randomness of competitive entries makes forward-looking managers choose constant prices. Seref et al. (2016) investigated optimal timing and dynamic pricing when one manufacturer plans to introduce a stream of new products into the marketplace and found that in the single-product rollover case, when price effects dominate diffusion effects, a single-generation solution is optimal. Wang et al. (2016) analyzed the role of pricing and branding in an incumbent firm’s decision when facing competition from an entrant firm with limited capacity; they showed that the incumbent may even increase its price and successfully deter entry by investing in consumers’ preferences for its product. Yu (2018) developed a game theory model to examine the role of green consumerism in competition by combining green and brown products and concluded that enlarging the size of the green customer group may result in a loss–loss situation for manufacturers. Hafezalkotob (2018) established a set of green and non-green production competition models to investigate the balance between green and non-green product types under different modes of government intervention. Hong et al. (2018) investigated green product pricing issues by considering consumer environmental awareness and non-green product references. The results showed that differential pricing strategies should be adopted, facing consumers with differential purchasing behaviors. Hafezalkotob (2018) discussed direct and indirect schemes of government intervention in the competition between green and non-green supply chains and concluded that when choosing an appropriate schema, the corresponding effects on the stakeholders should be considered. Li et al. (2021) investigated a manufacturer’s encroachment decision in a dual-channel supply chain with two differentiated green products and stated that for the green manufacturer, the encroachment strategy can outperform the no-encroachment strategy in terms of profitability, social welfare, and environmental performance. Hua et al. (2022) developed two pricing models to address competition between green and non-green products. Işık (2013) examined the importance of creating a competitive advantage in terms of economies.
The aforementioned literature mainly discussed products’ price competition between green and traditional manufacturers and the optimal time of entering the market, but most of them neglected differences in product quality. In this paper, we not only study price competition among products that have different environmental and traditional qualities but also discuss products’ marketing position problems and the impact of government policy on firms’ strategies. We summarize the most relevant papers in Table 1.
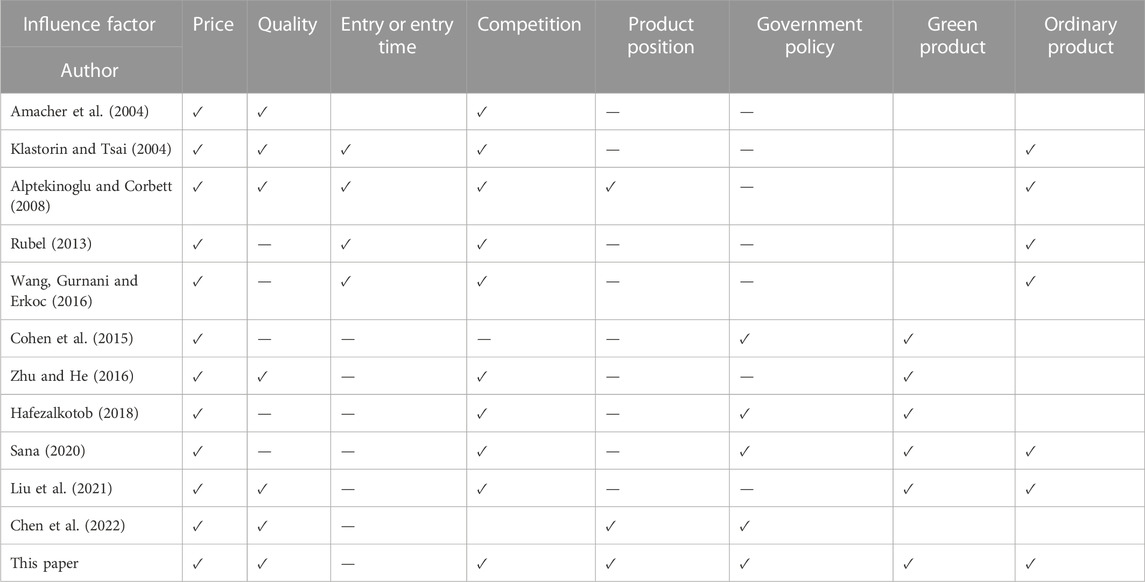
TABLE 1. Studies related to our paper.
Model description and analysis
In this section, we first present descriptions of the manufacturers, products, and demand functions and then explore optimal strategies for the ordinary and green manufacturers. We designate the incumbent firm (i.e., the ordinary manufacturer) as manufacturer 1 and the entry firm (i.e., the green manufacturer) as manufacturer 2. Manufacturer 1 provides ordinary product (named product 1) and manufacturer 2 provides green product (named product 2) in the marketplace.
Model description
Manufacturer
We consider a green manufacturer as an entrant to the market when there is already an ordinary manufacturer in the marketplace. The green and ordinary manufacturers are competitors. The ordinary manufacturer produces one product: an ordinary product without any environmental characteristics. The green manufacturer provides a green product. As a new entrant, the green manufacturer must determine what kind of green product will meet consumer demand and compete with the ordinary product. In other words, the green manufacturer must determine the environmental quality and price of the green product. Then, with the competition, manufacturer 1 will determine to whether to introduce green product (named product 3) to capture more market share.
Product
We assume that each product has two attributes, traditional and environmental, for which individuals may express quantifiable preferences. Given the assumption that both attributes behave as “qualities” (i.e., consumers who value each attribute prefer higher levels to lower levels on the attribute), we refer to them as “traditional” and “environmental” qualities (denoted by qt and qe and
Assumption 1. Assume that the traditional qualities of the three products are equal:
Cost structure
We assume that the variable cost of offering an attribute is a quadratic function,
Consumer
The variables vt and ve denote the positive marginal valuations of traditional and environmental qualities. We assume that consumers have the same valuation of traditional quality vt but have different valuations of environmental quality ve. We assume that ve is uniformly distributed over the interval [0,1]. A consumer buys one unit of the good from one of the two firms or does not buy at all, depending on the utility,
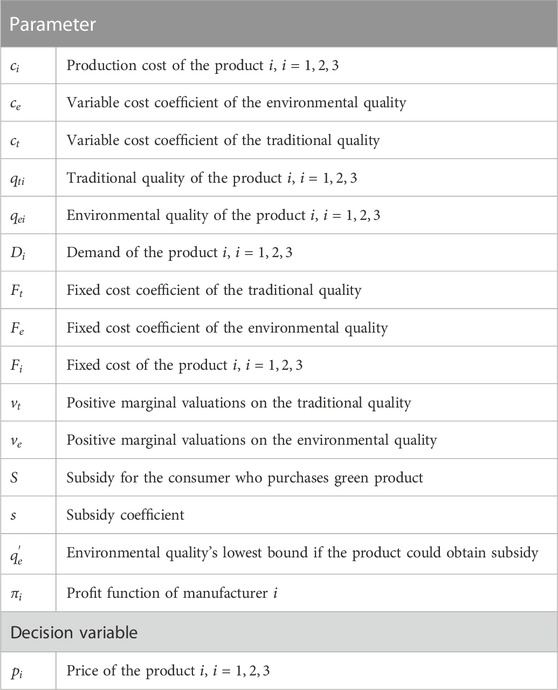
TABLE 2. Model parameters and decision variables.
Model analysis
The ordinary manufacturer sells the traditional product 1 in the market. We assume that there are two periods: in period 1, the green manufacturer enters the market and determines price of green product (product 2),
Ordinary manufacturer does not introduce green product
In this scenario, there are two products: product 1 and product 2. A consumer purchases product 2 if and only if they will obtain more utility compared with that of product 1, that is, if it satisfies following conditions:
The first constraint condition is the self-selection constraint imposed to ensure that the customer chooses product 2, which provides them with higher utility. The second constraint is the participation constraint imposed to make sure that the utility derived from the product is non-negative.
Assumption 2. Assume that the price of the ordinary product p1 satisfies
Assumption 3. The fixed and variable costs coefficients satisfy
With Assumption 2, we can remove constraint 1), and then the optimal solutions can be given in the following Proposition.
Proposition 1. The optimal price of product 2 is
From Proposition 1, we can see that the optimal price of green product increases with product 1’s price and product 2’s environmental quality, when manufacturer 1 only produces one product.Substituting product 2’s optimal price, we can obtain the maximum profit functions for manufacturers 1 and 2:
Ordinary manufacturer introduces green product
In this subsection, we explore the scenario in which manufacturer 1 introduces green product (product 3) in period 2. Manufacturer 1 may introduce green product with lower or higher environmental quality. We denote the environmental quality and price of product 3 as
Assumption 4. 1) When manufacturer 1 introduces green product with low environmental quality, that is,
2) when manufacturer 1 introduces green product with high environmental quality, that is,
The consumer purchases product 1 if and only if
When manufacturer 1 introduces green product with higher environmental quality, then manufacturer 2’s and manufacturer 1’s objective functions are as follows:
We apply the backward method to solve the Stackelberg game problem. Hence, we first solve the optimal price of product 2, then give the optimal price of product 3.
Proposition 2.
1) If
2) if
From Proposition 2, we can see that product 2’s price is related to product 2′s and product 3′s environmental qualities and product 1’s and product 3’s prices. Interestingly, when product 2’s environmental quality is the largest of the three products, product 2’s price is not related to product 1’s price and is only related to product 3’s price; only when the environmental quality of product 2 is located between that of product 1 and 3 is product 2’s price related to product 1’s and product 3’s prices. Product 2’s price increases with product 1’s and product 3’s prices.
Proposition 3.
1) If
2) if
From Proposition 3, we can see that product 3’s price is related to product 1’s price, the environmental quality of product 2, and its own environmental quality, and that product 3’s price increases with product 1’s price.In period 2, manufacturer 1 could determine their optimal choice by comparing their profit,
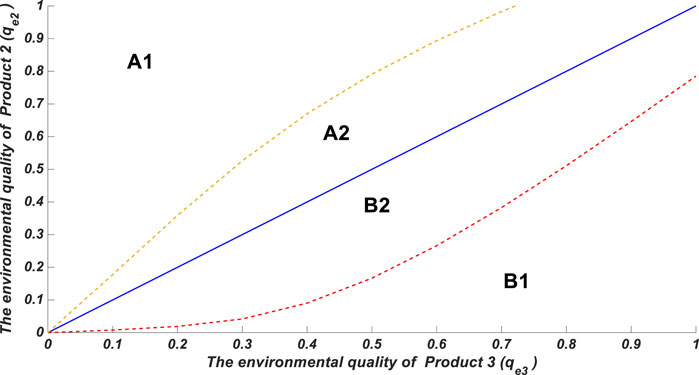
FIGURE 1. Optimal strategy for manufacturer 1.
Government subsidy
To stimulate manufacturers to produce environmental product, governments always provide subsidy for green product. Therefore, in this subsection, we consider changes in the optimal solutions for manufacturers 1 and 2 with subsidy and provide some suggestions for government subsidy.
We assume that a consumer who purchases green product could obtain total subsidy S and that the subsidy is related to the environmental quality of the green product. Similar to Zhou and Huang (2016), we assume that
With subsidy-ordinary manufacturer does not introduce green product
Similar to the Model description subsection, consumers purchase ordinary product when
Consumers purchase green product when
Hence, the demand function of product 1 is
Therefore, manufacturer 2’s objective function is
Proposition 4. When there is government subsidy, the optimal price of product 2 is as follows:
With subsidy-ordinary manufacturer introduces green product
In this subsection, we discuss the case in which manufacturer 1 provides green product. Manufacturer 1 may produce product 3 with lower environmental quality or higher environmental quality.
As in the Model analysis subsection, when
When manufacturer 1 introduces green product with higher environmental quality, that is,
Proposition 5.
1) If
2) if
Proposition 6.
1) If
2) if
From Proposition 6, we can determine that product 3’s price increases with the subsidy coefficient and that the larger the environmental quality of product 3, the higher its price increment with subsidy.Similar to Figure 1, in order to determine whether the ordinary manufacturer introduces green product, we present Figure 2. From Figure 2, we find that manufacturer 1 could produce a green product with lower and higher environmental quality in zones A2 and B2, respectively, and provide only ordinary product in zones A1 and B1. However, compared with Figure 1, with government subsidy, zones A2 and B2 are larger than with no subsidy, that is, the subsidy is effective in incentivizing manufacturer 1 to produce green product. In addition, the subsidy is more effective in stimulating the ordinary manufacturer to introduce green product when the ordinary manufacturer owns the green technology to produce green product with higher environmental quality (the increment of B2 is bigger than that of A2 compared with Figure 1).
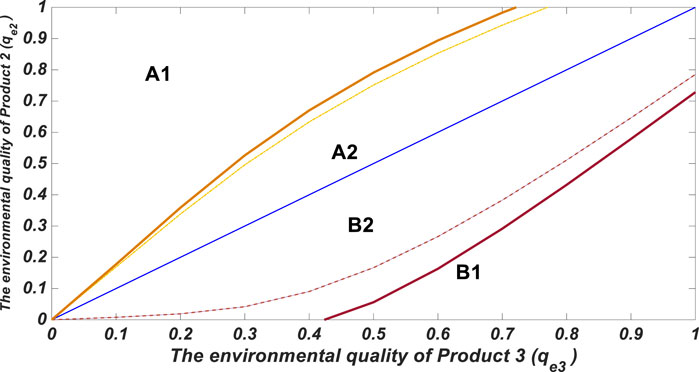
FIGURE 2. Optimal strategy for manufacturer 1 with subsidy.
Extension
In the Model description and analysis section and the Discussion section, we discuss two manufacturers’ strategies when manufacturers 1 and 2 provide green products whose traditional quality is the same as product 1’s traditional quality, that is,
Assume that the green technology levels of manufacturers 1 and 2 are given and that the green manufacturer could produce much greener product than the ordinary manufacturer, that is,
Taking products 1 and 2 as examples, we denote that product 2 (product 1) is a high-end (low end) product if
Competition between product 1 and product 2
In this subsection, we discuss the scenario in which manufacturer 1 only provides ordinary product.
Unlike in the Model description subsection, manufacturer 2 needs determine product 2’s traditional quality and price. As in the Model description subsection, considering consumers’ demand function, we can give manufacturer 2’s profit function:
Assumption5. The fixed and variable costs coefficients satisfy
Proposition 7. The optimal traditional quality and price of product 2 are as follows:
Interestingly, from Proposition 7 we see that the optimal traditional quality of product 2 decreases with that of product 1. Next, we compare the difference between product 1 and product 2.
Proposition 8.
1) When
(i) if
(ii) if
(iii) if
2) when
(i) if
(ii) if
(iii) if
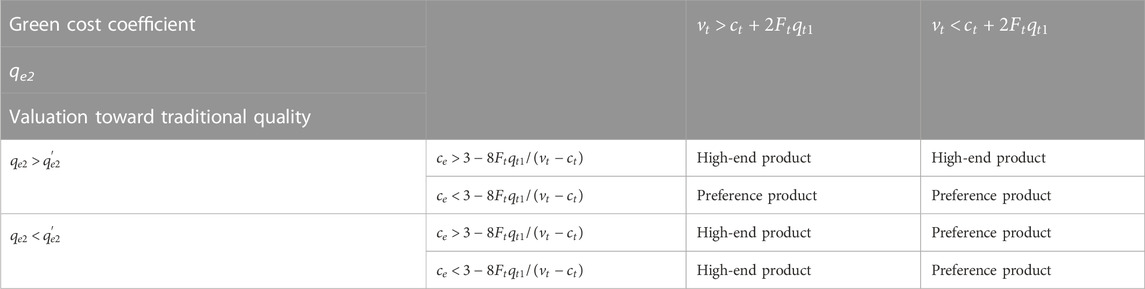
TABLE 3. Product 2’s market positioning by configuration of traditional and environmental attributes.
Competition between products 1, 2, and 3
In this subsection, we discuss the scenario in which manufacturer 1 introduces product 3 to the market after manufacturer 2 has entered the market. Considering the reality, product 2 (produced by manufacturer 2, which specializes in producing green product) has higher environmental quality level than product 3, which is provided by ordinary manufacturer 1. Hence, in this subsection we assume that
As in the Model analysis subsection, manufacturer 2’s profit function is
Manufacturer 1’s profit function is
Proposition 9. Product 2’s optimal price is
From Proposition 9, we can determine that product 2’s price increases with product 3’s price and the environmental quality difference between two products and the traditional quality difference between products 2 and 3.Substituting
Proposition 10. The optimal traditional quality and price of product 3 are as follows:
Proposition 11.
1) If
2) if
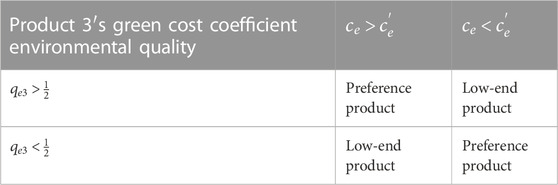
TABLE 4. Product 3’s market positioning in the marketplace with competition.
Discussion
This paper studies whether the ordinary manufacturer must introduce green products to respond to the green manufacturer’s market invasion. We consider the scenarios of ordinary manufacturers not introducing or introducing green products, then discuss the impact of government subsidies for green products on the introduction strategy of the ordinary manufacturer. The practical implications and managerial insights are as follows.
1) As for whether manufacturer 1 introduces the green product, this paper finds that manufacturer 1 may not introduce green product when the difference in environmental quality between two green products is very large; and manufacturer 1 will be more willing to introduce green product if the ordinary manufacturer could produce green product with much higher environmental quality than the green manufacturer 2 does.
2) For the pricing problem, we find that when product 2’s environmental quality is the largest among the three products, product 2’s price is not related to product 1’s price and is only related to product 3’s price; only when the environmental quality of product 2 is located between that of products 1 and 3 is product 2’s price related to product 1’s and 3’s prices. Additionally, product 2’s price increases with products 1’s and product 3’s prices.
3) For the subsidy for the green product, we find that the subsidy is effective for incentivizing the ordinary manufacturer to introduce green product and that the stimulating effect is more obvious if the ordinary manufacturer has a higher technology level to produce green products and could provide the green product with high environmental quality.
Furthermore, under the assumption that the green manufacturer has green product production advantages, we studied products’ market positioning. We find the following two results about product 2’s and product 3’s market positioning.
1) Product 2’s market position is determined by the green manufacturer’s green technology level and the green technology maturity level: with high green technology level and technology maturity level, product 2 should be positioned as a preference product; with high green technology level and low technology maturity level, product 2 should be positioned as a high-end product; and with low green technology level and low technology maturity level, product 2’s position is determined by consumers’ willingness to pay for traditional quality. If the willingness to pay is low, then product 2 should be a preference product; otherwise, product 2 should be a high-end product.
2) Product 3’s market position is also determined by the ordinary manufacturer’s green technology level and green technology maturity level. With the high or low green technology level and maturity level, product 3 should be positioned as a low-end product; otherwise, product 3 should be a preference product.
Conclusion and future research
In this paper, we considered two manufacturers, namely, an ordinary manufacturer and a green manufacturer, competing in two periods. In period 1, there exists an ordinary manufacturer producing traditional product in the market, and a green manufacturer providing the green product enters the market; in period 2, the ordinary manufacturer determines whether to introduce green product to compete with the entrant. First, we focus on green manufacturer pricing of product 2 and whether the incumbent manufacturer introduces and, if they introduce, what type of green product they should provide. Second, we study the effect of the government subsidy on manufacturers’ decisions. Finally, we extend our model to discuss product 2’s and product 3’s optimal market positioning.
The main findings are as follows: 1) manufacturer 1 will not introduce the green product when the difference in environmental quality between the two green products is much larger; 2) the government subsidy is effective in stimulating the ordinary manufacturer to introduce green product, especially in the context of uncertainty and COVID, and the subsidy will be more efficient if the ordinary manufacturer can provide high-environmental-quality product; 3) the manufacturer’s green technology level, the green technology maturity, and consumers’ willingness to pay for traditional quality affect the product’s market positioning. We present product 2’s and product 3’s optimal market positions in period 1 and 2.
Our model could be extended in numerous ways. For example, manufacturers always need to determine when to introduce new products; hence, the introduction timing is an area for further research. In addition, if the manufacturer could produce the product with any environmental quality level, then they must determine what kind of green product they should provide; therefore, optimal environmental quality should be considered in future research.
Data availability statement
The original contributions presented in the study are included in the article/Supplementary Materials; further inquiries can be directed to the corresponding author.
Author contributions
LZ was responsible for the overall writing of the paper, and WY was in charge of modeling.
Funding
This study was supported by the National Social Science Fund of China (grant number: 21ZDA024).
Conflict of interest
The authors declare that the research was conducted in the absence of any commercial or financial relationships that could be construed as a potential conflict of interest.
Publisher’s note
All claims expressed in this article are solely those of the authors and do not necessarily represent those of their affiliated organizations, or those of the publisher, the editors, and the reviewers. Any product that may be evaluated in this article, or claim that may be made by its manufacturer, is not guaranteed or endorsed by the publisher.
References
Alizamir, S., Véricourt, F. D., and Sun, P. (2016). Efficient feed-in-tariff policies for renewable energy technologies. Operations Res. 64 (1), 52–66. doi:10.1287/opre.2015.1460
Alptekinoǧlu, A., and Corbett, C. J. (2008). Mass customization vs. Mass production: Variety and price competition. Manuf. Serv. Operations Manag. 10 (2), 204–217. doi:10.1287/msom.1070.0155
Amacher, G. S., Koskela, E., and Ollikainen, M. (2004). Environmental quality competition and eco-labeling. J. Environ. Econ. Manag. 47 (2), 284–306. doi:10.1016/s0095-0696(03)00078-0
Bansal, S., and Gangopadhyay, S. (2003). Tax/subsidy policies in the presence of environmentally aware consumers. J. Environ. Econ. Manag. 45 (2), 333–355. doi:10.1016/s0095-0696(02)00061-x
Benthem, A. V., Gillingham, K., and Sweeney, J. (2008). Learning-by-doing and the optimal solar policy in California. Energy J. 29 (3), 131–151. doi:10.5547/ISSN0195-6574-EJ-Vol29-No3-7
Chen, C. (2001). Design for the environment: A quality-based model for green product development. Manag. Sci. 47 (2), 250–263. doi:10.1287/mnsc.47.2.250.9841
Chen, S., Su, J., Wu, Y., and Zhou, F. (2022). Optimal production and subsidy rate considering dynamic consumer green perception under different government subsidy orientations. Comput. Industrial Eng. 168, 108073. doi:10.1016/j.cie.2022.108073
Cohen, M. C., Lobel, R., and Perakis, G. (2015). The impact of demand uncertainty on consumer subsidies for green technology adoption. Soc. Sci. Electron. Publ. 62 (4), 1235–1258. doi:10.1287/mnsc.2015.2173
Eberle, D. U., and Helmolt, D. R. V. (2010). Sustainable transportation based on electric vehicle concepts: A brief overview. Energy & Environ. Sci. 3 (6), 689–699. doi:10.1039/c001674h
Goli, A., Tirkolaee, E. B., and Weber, G. W. (2020). “A perishable product sustainable supply chain network design problem with lead time and customer satisfaction using a hybrid whale-genetic algorithm,” in Logistics operations and management for recycling and reuse (Berlin, Heidelberg: Springer), 99–124.
Hafezalkotob, A. (2018). Direct and indirect intervention schemas of government in the competition between green and non-green supply chains. J. Clean. Prod. 170, 753–772. doi:10.1016/j.jclepro.2017.09.124
Hong, Z., Wang, H., and Yu, Y. (2018). Green product pricing with non-green product reference. Transp. Res. Part E Logist. Transp. Rev. 115, 1–15. doi:10.1016/j.tre.2018.03.013
Hong, I. H., Chiu, A., and Gandajaya, L. (2021). Impact of subsidy policies on green products with consideration of consumer behaviors: Subsidy for firms or consumers? Resour. Conservation Recycl. 173 (10), 105669. doi:10.1016/j.resconrec.2021.105669
Hua, G., Liu, S., Ma, B. J., and Cheng, T. C. E. (2022) Competition between green and non-green products in the blockchain era. Available at SSRN 4136519.
Işık, C., Sirakaya-Turk, E., and Ongan, S. (2020). Testing the efficacy of the economic policy uncertainty index on tourism demand in USMCA: Theory and evidence. Tour. Econ. 26 (8), 1344–1357. doi:10.1177/1354816619888346
Isik, C., Ongan, S., Ozdemir, D., Ahmad, M., Irfan, M., Alvarado, R., et al. (2021). The increases and decreases of the environment Kuznets curve (EKC) for 8 OECD countries. Environ. Sci. Pollut. Res. 28, 28535–28543. doi:10.1007/s11356-021-12637-y
Işık, C., Ahmad, M., Ongan, S., Ozdemir, D., Irfan, M., and Alvarado, R. (2021). Convergence analysis of the ecological footprint: Theory and empirical evidence from the USMCA countries. Environ. Sci. Pollut. Res. 28 (25), 32648–32659. doi:10.1007/s11356-021-12993-9
Işık, C., Ongan, S., Bulut, U., Karakaya, S., Irfan, M., Alvarado, R., et al. (2022). Reinvestigating the Environmental Kuznets Curve (EKC) hypothesis by a composite model constructed on the Armey curve hypothesis with government spending for the US States. Environ. Sci. Pollut. Res. 29 (11), 16472–16483. doi:10.1007/s11356-021-16720-2
Işık, C. (2013). The importance of creating a competitive advantage and investing in information technology for modern economies: An ARDL test approach from Turkey. J. Knowl. Econ. 4, 387–405. doi:10.1007/s13132-011-0075-2
Kim, K., Chhajed, D., and Liu, Y. (2013). Can commonality relieve cannibalization in product line design? Mark. Sci. 32 (3), 510–521. doi:10.1287/mksc.2013.0774
Klastorin, T., and Tsai, W. (2004). New product introduction: Timing, design, and pricing. Manuf. Serv. Operations Manag. 6 (4), 302–320. doi:10.1287/msom.1040.0050
Koca, E., Souza, G. C., and Druehl, C. T. (2010). Managing product rollovers. Decis. Sci. 41 (2), 403–423. doi:10.1111/j.1540-5915.2010.00270.x
Li, Q., Guan, X., Shi, T., and Jiao, W. (2020). Green product design with competition and fairness concerns in the circular economy era. Int. J. Prod. Res. 58, 165–179. doi:10.1080/00207543.2019.1657249
Li, J., Liang, J., Shi, V., and Zhu, J. (2021). The benefit of manufacturer encroachment considering consumer's environmental awareness and product competition. Ann. Operations Res 2021, 1–21. doi:10.1007/s10479-021-04185-y
Liu, Z., Anderson, T. D., and Cruz, J. M. (2012). Consumer environmental awareness and competition in two-stage supply chains. Eur. J. Operational Res. 218 (3), 602–613. doi:10.1016/j.ejor.2011.11.027
Liu, Z., Zhou, C., Liu, J., and Zhou, X. (2021). Revelation for green product operation strategy of a retailer under different reliability levels of servicing the market. Comput. Industrial Eng. 160, 107594. doi:10.1016/j.cie.2021.107594
Lobel, R., and Perakis, G. (2011). Consumer choice model for forecasting demand and designing incentives for solar technology. Ssrn Electron. J 4872-11, 1–36. doi:10.2139/ssrn.1748424
Lombardini-Riipinen, C. (2005). Optimal tax policy under environmental quality competition. Environ. Resour. Econ. 32 (3), 317–336. doi:10.1007/s10640-005-4680-z
Lotfi, R., Yadegari, Z., Hosseini, S., Khameneh, A. H., Tirkolaee, E. B., and Weber, G. W. (2022). A robust time-cost-quality-energy-environment trade-off with resource-constrained in project management: A case study for a bridge construction project. J. Industrial Manag. Optim. 18 (1), 375. doi:10.3934/jimo.2020158
Plambeck, E., and Wang, Q. (2009). Effects of E-waste regulation on new product introduction. INFORMS.
Raz, G., and Ovchinnikov, A. (2015). Coordinating pricing and supply of public interest goods using government rebates and subsidies. IEEE Trans. Eng. Manag. 62 (1), 65–79. doi:10.1109/tem.2014.2380999
Rubel, O. (2013). Stochastic competitive entries and dynamic pricing. Eur. J. Operational Res. 231 (2), 381–392. doi:10.1016/j.ejor.2013.05.014
Sana, S. S. (2020). Price competition between green and non green products under corporate social responsible firm. J. Retail. Consumer Serv. 55, 102118. doi:10.1016/j.jretconser.2020.102118
Schmidt, G. M., and Druehl, C. T. (2005). Changes in product attributes and costs as drivers of new product diffusion and substitution. Prod. Operations Manag. 14 (3), 272–285. doi:10.1111/j.1937-5956.2005.tb00024.x
Şeref, M. M. H., Carrillo, J. E., and Yenipazarli, A. (2016). Multi-generation pricing and timing decisions in new product development. Int. J. Prod. Res. 54 (7), 1919–1937. doi:10.1080/00207543.2015.1061220
Su, J., Wang, L., and Ho, J. C. (2012). The impacts of technology evolution on market structure for green products. Math. Comput. Model. 55 (3), 1381–1400. doi:10.1016/j.mcm.2011.10.017
Su, M., and Rao, V. R. (2011). Timing decisions of new product pre-announcement and launch with competition. Int. J. Prod. Econ. 129 (1), 51–64. doi:10.1016/j.ijpe.2010.09.001
Tirkolaee, E. B., Dashtian, Z., Weber, G. W., Tomaskova, H., Soltani, M., and Mousavi, N. S. (2021). An integrated decision-making approach for green supplier selection in an agri-food supply chain: Threshold of robustness worthiness. Mathematics 9 (11), 1304. doi:10.3390/math9111304
Wang, H. Q., Gurnani, H., and Erkoc, M. (2016). Entry deterrence of capacitated competition using price and non-price strategies. Prod. Operations Manag. 25 (4), 719–735. doi:10.1111/poms.12500
Wauthy, X. (1996). Quality choice in models of vertical differentiation. J. Industrial Econ. 44 (3), 345–353. doi:10.2307/2950501
Yakita, A., and Yamauchi, H. (2011). Environmental awareness and environmental R&D spillovers in differentiated duopoly. Res. Econ. 65 (3), 137–143. doi:10.1016/j.rie.2010.02.003
Yang, R., Tang, W., and Zhang, J. (2020). Technology improvement strategy for green products under competition: The role of government subsidy. Eur. J. Operational Res. 289 (2), 553–568. doi:10.1016/j.ejor.2020.07.030
Yu, Z. (2018). The role of green customers under competition: A mixed blessing? J. Clean. Prod. 170, 857–866. doi:10.1016/j.jclepro.2017.09.155
Zhang, L., Wang, J., and You, J. (2015). Consumer environmental awareness and channel coordination with two substitutable products. Eur. J. Operational Res. 241 (1), 63–73. doi:10.1016/j.ejor.2014.07.043
Zhou, W., and Huang, W. (2016). Contract designs for energy-saving product development in a monopoly. Eur. J. Operational Res. 250, 902–913. doi:10.1016/j.ejor.2015.10.024
Keywords: product competition, environmental quality, price, government subsidy, product market position
Citation: Zhang L and Yu W (2023) Reacting to the entry of green manufacturers: A perspective from ordinary manufacturers. Front. Environ. Sci. 10:1040161. doi: 10.3389/fenvs.2022.1040161
Received: 09 September 2022; Accepted: 19 December 2022;
Published: 10 March 2023.
Edited by:
Cem Işık, Anadolu University, TurkeyReviewed by:
Erfan Babaee Tirkolaee, University of Istinye, TurkeyJoanna Rosak-Szyrocka, Częstochowa University of Technology, Poland
Ferhat Özbay, Isparta University of Applied Sciences, Turkey
Copyright © 2023 Zhang and Yu. This is an open-access article distributed under the terms of the Creative Commons Attribution License (CC BY). The use, distribution or reproduction in other forums is permitted, provided the original author(s) and the copyright owner(s) are credited and that the original publication in this journal is cited, in accordance with accepted academic practice. No use, distribution or reproduction is permitted which does not comply with these terms.
*Correspondence: Linghong Zhang, emhhbmdsaW5naG9uZzIwMDVAMTI2LmNvbQ==