 Mengyao Xia
 Helen Huifen Cai
 Qiong Yuan2*
- 1School of Management Engineering. Nanjing University of Information Science and Technology, Nanjing, China
- 2Middlesex University Business School, London, United Kingdom
Overwhelming evidence from prior research suggests the functions of the board of directors have a vital influence on carbon performance. However, very little is known about the moderating effect of board functions. This study attempts to fill this gap by developing and empirically testing a conceptual model that highlights the role of board carbon awareness and firm reputation in the relationship between board climate-responsible orientation (BCO) and carbon performance. Using a fixed effect model to analyze data from 665 US listed firms covering a period of 2010–2019, we find that BCO and carbon performance show a U-shaped non-linear relationship. Increased experience of BCO improves corporate carbon performance. The results also provide evidence of the moderating effect of carbon awareness and firm reputation on the relationship between BCO and carbon performance. Carbon awareness reduces symbolic emission reduction actions in carbon management, while, firm reputation will cause symbolic emission reduction actions. Besides, splitting the sample according to firm size and carbon dependency shows BCO has a better effect on the carbon performance of small or medium-sized and high carbon-dependency firms. The findings have important implications for managers to use firm governance mechanisms to improve carbon performance.
1 Introduction
Greenhouse gases (GHG) produced by firms’ activities have become a serious problem for corporate environmental accountability. More and more firms are aware of the increased costs and risks associated with climate change (World Economic Forum, 2020). Carbon performance defined as firm actual or outcome-oriented GHG emissions is an indicator to measure corporate governance effectiveness in carbon emission reduction (Bui et al., 2020; Nuber and Velte, 2021). Firms are both emitters, and solvers of carbon emissions (Klettner et al., 2014). In response to the prominent climate change problem, firms have begun to consider environmental responsibilities, establishing mitigation strategies and conducting carbon disclosure (Gallego-Álvarez et al., 2015).
Corporate carbon performance has gained substantial attention due to firms facing increasing and multiple social, economic, and regulatory pressures (Moussa et al., 2020). Corporate governance effectiveness plays a critical role in addressing corporate environmental and climate-related risks, and monitoring a firm’s engagement in carbon initiatives (Peters and Romi, 2014). Researchers try to identify and improve these corporate governance mechanisms to successfully improve carbon performance. The board as an effective means of corporate governance, influences firm decision-making through its monitoring functions. In January 2019, the World Economic Forum published a white paper titled ‘How to Set Up Effective Climate Governance on Corporate Boards: Guiding Principles and Questions’. The board needs to take primary responsibility for corporate climate governance and provide guidance for climate governance. More and more scholars are trying to establish a theoretical framework or understanding relationship between the board characteristics and corporate environmental performance (Dixon-Fowler et al., 2017; Hussain et al., 2018; Homroy and Slechten, 2019; Shahbaz et al., 2020; Aguilera et al., 2021; Orazalin and Mahmood, 2021). The role of boards in reducing carbon emissions and environmental orientation have become a new focal point of board characteristics (Luo and Tang, 2021; Kyaw et al., 2022). Different scholars have proposed the positive and negative effects of this characteristic on carbon performance (Prado-Lorenzo and Garcia-Sanchez, 2010; De Villiers et al., 2011; Haque, 2017). This study will more clearly classify the impact of BCO on corporate carbon performance, and the mechanisms that cause these effects.
Monitoring management and accessible for information and resources are two functions of the board. To meet stakeholders’ expectations of environmental responsibility, playing a good monitoring role in the corporate environmental practices have become an important objective for boards. Environmental practices require significant investments and have a long cycle of returns (Aragón-Correa and Sharma, 2003). Given this, management is often reluctant to pursue a high level of environmental performance and abandon immediate financial benefits. Management may be reluctant to incur expenses that do not have immediate financial benefits and therefore often focus on conservative initiatives that will maximize their reputation and financial benefits in the short term (Chen and Ma, 2021). Research based on agency theory suggests that the monitoring role of the board may not be significantly effective in this scenario because boards have no direct power over decision making. Some scholars find that firms pay attention to process-oriented environmental performance and carbon reduction plans (Moussa et al., 2020). In pursuit of reputational benefits, firms are more willing to take carbon reduction initiatives which can be easily communicated to the market and other stakeholders in order to change firm image immediately. However, the actual carbon performance has not improved in the form of reducing greenhouse gas emissions (Cho et al., 2012).
The effectiveness of the board depends not only on their monitoring orientation, but also on their influence on resource access (Erhardt et al., 2003; Konadu et al., 2022). Boards with a climate-responsible orientation tend to place greater emphasis on the monitoring of corporate environmental performance, ensuring that management better incur environmental responsibility (Russo and Harrison, 2005; Moussa et al., 2020). Based on resource dependence theory, a climate-responsible orientated board is more able to improve corporate environmental performance by accessing environment-related resources (Hillman and Dalziel, 2003). Directors’ experience can enhance their ability to perform their board roles (Tejerina-Gaite and Fernández-Temprano, 2021). Long-tenured directors are able to assess the potential consequences of strategic decisions for short-term and long-term performance (Kor, 2006). The increased carbon-awareness of the board can be seen as a manifestation of the board’s access to environment-related resources. The higher the awareness of carbon risk the better the ability to coordinate and deploy relevant resources (Luo and Tang, 2021). Board function is necessary not only to meet the environmental expectations of stakeholders but also to meet the social criteria of legitimacy. Firms must increase board effectiveness in carbon-related aspects to legitimize firm activities (Liao et al., 2015). Thus, we argue a relationship between board effectiveness and corporate environmental responsibilities actions: climate-responsible oriented boards produce symbolic emission reduction actions, but with the increase in access to environment-related resources, it will substantively affect corporate environmental responsibility actions to secure legitimacy. Our study raises the vital research question on whether board climate-responsible orientation improve corporate carbon performance and the role of board carbon awareness and firm reputation in the relationship between board climate-responsible orientation (BCO) and carbon performance.
This paper makes some contributions to the literature on corporate governance and carbon performance. We combine three theories, agency theory, resource dependence theory and legitimacy theory, to capture the complex relationship between BCO, board carbon awareness, firm reputation and carbon performance through an integrated analysis. This is conducted by using 665 firms from the United States, because the United States is in transition towards a low-carbon future and experiences negative growth in CO2 emissions as GDP per capita continues to grow (Wang et al., 2018). Thus, the United States is a good example of how to study carbon emissions. Specifically, we contribute to the existing literature by first exploring the nonlinear relationships of BCO, identifying and explaining the symbolic and substantive relationships of BCO to the effectiveness of carbon performance. Second, we contribute to the literature by investigating how BCO influences carbon performance, and examining whether board carbon awareness and firm reputation moderate the relationship between BCO and carbon performance. When examining both direct relationships and moderating effects, we first attempt to capture both the symbolic and substantive effects of BCO on carbon performance through empirical models. Unlike past studies, the agency theory, resource dependence theory and legitimacy theory are combined to propose the impact of the board of directors on carbon performance should shift from the negative linear relationship of monitoring management function to the positive linear relationship of accessible for information and resources function. The turning point of this U-shaped relationship is generated by corporations to meet the legitimacy (Moussa et al., 2020). We integrate various theories and propose a new conceptual framework to make the impact process of the board of directors on carbon performance more complete and have theoretical support.
The rest of this paper is organized as follows. Section 2 presents the theoretical background and develops our hypotheses. Section 3 presents current status of climate change and carbon emissions reforms in the united states. Section 4 presents research design. Section 5 presents the results of the empirical research. Section 6 presents the results of moderating effect. Section 7 presents the discussion.
2 Theoretical background and hypotheses development
Firms are facing climate change issues that are becoming increasingly prominent and they are expected to be accountable not only for their financial performance but also for their social impact. As an effective means of internal governance, the board of directors plays a critical role in addressing firms’ environmental and climate-related risks and monitoring a firm’s engagement in carbon initiatives (Peters and Romi, 2014). Carbon performance is a unique dimension of environmental performance, which is regulated by specific legislation and regulations. The internal governance mechanism must meet legality requirements (He et al., 2021). The board achieves effective governance of corporate carbon performance through enhancing the two functions of monitoring and resource provision (Hillman and Dalziel, 2003; De Villiers et al., 2011). The role of board governance effectiveness on carbon performance is viewed from different theoretical perspectives, depending on agency, resource dependency, and legitimacy theories. The main thesis of each of these theories is discussed below, leading to hypothesis development.
Legitimacy theory proposes the concept of social contract, whereby organizations must satisfy certain social regulations that exist in society. Thus, firm activities must meet societal expectations to establish and improve legitimacy. These social expectations change over time, and require firms to be constantly responsive to their operation environment (Deegan, 2002). With increasing climate change pressures on firms, they must showcase good carbon performance to gain and maintain legitimacy (Bansal and Clelland, 2004). Firms with high legitimacy threats are more likely to take actions to demonstrate concern for climate change, because of better resources, and less scrutiny (Meyer and Rowan, 1977; Salancik and Pfeffer, 1978; Alsaifi et al., 2020).
The agency theory is the theoretical underpinning for the board’s monitoring function. The theory assumes a conflict of interest between managers with control and shareholders with ownership. Managers incur agency costs when they pursue self-interest at the expense of profit maximization (Hoskisson et al., 2009). The board can reduce agency costs by monitoring the behavior of agents (managers) (Daily et al., 2003). In the context of climate change, agency theory is more oriented towards the conflict between financially oriented shareholders and environmentally oriented stakeholders. Managers tend to over-invest in environmental performance to gain reputation (Malmendier and Tate, 2005). This over-investment is a waste of resources that can damage firm value (Ferrell et al., 2016). Board monitoring is a means of effective internal control, and its vigilance has a strong influence on firms’ strategic choices (Chari et al., 2019). Some scholars argue that the ability of the board to effectively monitor environmental policy is contextually dependent (Tuggle et al., 2010). When board members have an economic incentive to monitor environmental performance, they will be more vigilant in exercising their responsibility for monitoring.
Resource dependence theory focuses on the board’s ability to access resources. The board of directors generates human capital and relational capital through four types of resource provisioning advice and counsel, legitimacy, broadening information channels with outsiders, and prioritizing access to external resources (Kor and Sundaramurthy, 2009). Different directors can provide different types of resources to the board. The resources and expertise accumulated by directors from external experience, including environmental aspects, can guide the board’s strategic decisions (Kor and Misangyi, 2008). Some scholars argue that resource-rich directors are positively associated with good environmental performance because they are more likely to be knowledgeable about environmental issues and more suited to a resource provision role in the pursuit of corporate positive environmental performance (de Villiers et al., 2011).
When explaining the influence of BCO on carbon performance, we implement multiple theoretical frameworks, including combining agency theory, resource dependence theory and legitimacy theory to develop the hypotheses.
2.1 Board climate-responsible orientation and carbon performance
Environmental protection and related strategies are increasingly important for corporate development. Good environmental performance promotes corporations to achieve the best gains (Barnett and Salomon, 2006). The effectiveness of board monitoring gradually leads to improving corporate environmental performance and carbon performance to ensure that managers better pursue environmental performance and assume environmental responsibility (Russo and Harrison, 2005; Hafsi and Turgut, 2013). Boards with a climate-responsible orientation are more likely to exert monitoring pressure on managers to ensure corporate responsibility for climate change. In environmental management, managers may perform symbolic environmental performance in pursuit of economic benefits and good reputation (Talbot and Boiral, 2018), because image management is easier than actual performance change (Cho et al., 2012). The board as a supervisor is not directly involved in strategic decision-making and therefore cannot effectively monitor the improvement of actual carbon performance. However, some environmental strategies are also in the best interests of corporations, and managers must demonstrate good actual carbon performance to gain and maintain legitimacy (Bansal and Clelland, 2004). The board needs to strike a balance between a firm’s financial and non-financial goals, resolve conflicts of interest among various stakeholders and facilitate the achievement of corporate actual carbon performance meet (Liao et al., 2015). We argue that the board’s monitoring in a climate-responsible orientation is more conducive to firms’ carbon strategy management, and the accumulation of monitoring experience enables the board to provide more relevant resources for the carbon strategies. This experience and knowledge can be effective in improving substantial carbon performance. Thus, we propose the following hypothesis:
Hypothesis 1. BCO has a U-shaped effect on carbon performance.
2.2 The moderating role of board carbon awareness
The efficient management of attention facilitates performance (Chan et al., 2021). Boards with climate-responsible orientation pay more attention to corporate environment-related monitoring. As resource dependence theory suggests, the board’s accumulated experience and related mix of capital can increase the board’s carbon awareness (Kolev et al., 2019). In the board carbon monitoring awareness, board carbon-related experience can provide managers with environmental strategic advice, and open up opportunities to improve carbon performance. The more unique resources and knowledge the board with a stronger carbon monitoring awareness acquires in relation to the environment, the more able it is to monitor managers pursuing active environmental strategies (Boh et al., 2020). In the board carbon risk awareness, boards with higher carbon risk awareness can more carefully monitor the problems faced by corporation in achieving carbon performance, and can better coordinate and deploy corporate environmental strategies. Jung et al. (2018) find that firms with greater carbon risk awareness are more likely to implement proactive carbon management strategies. Carbon risk awareness can motivate the board to better align corporate social objectives with financial objectives (Galbreath, 2018). Thus, we propose the following hypothesis:
Hypothesis 2a. Board carbon risk awareness moderates the U-shaped relationship between BCO and carbon performance.
Hypothesis 2b. Board carbon monitoring awareness moderates the U-shaped relationship between BCO and carbon performance.
2.3 The moderating role of firm reputation
Firm reputation represents the past behavior of firms and can indicate the firm’s possible future financial performance to stakeholders (Davies et al., 2003). Firm reputation is an intangible strategic asset, a competitive advantage that cannot be replicated by competitors, which thus contributes to firm performance and survival (Miller and Triana, 2010). Firm reputation can position a firm to gain competitive advantages that lead to sustainable performance. A good reputation is related to firms’ environmental problems (Ghuslan et al., 2021), and is a relevant outcome measure (Singh and Misra, 2021). Thus, studies on the legitimacy issues arising from reputation in the context of firm sustainability will be especially useful. Previous studies have shown that board characteristics are positively associated with the firm image and level of reputation, which foster more effective monitoring and oversight (Baselga-Pascual et al., 2018). Board’s attention to monitoring management is also affected by reputational effects and greatly influences board decision-making on environmental issues (Tuggle et al., 2010). Based on the legitimacy theory, boards need to cope with external pressures and meet legal requirements to maintain and gain a good reputation, and for this purpose, symbolic and/or substantive actions will often be adopted (de Quevedo-Puente et al., 2007; Truong et al., 2021). Substantive actions minimize the firm’s environmental impact and improve their environmental performance (Rodrigue et al., 2013; Berrone et al., 2017). However, improving carbon performance is a long-term process and the board cannot change the daily activities and strategic goals of the firms in a short period of time, so using symbolic environmental actions to mitigate the negative of environmental effects is popular for firms. Thus, we propose the following hypothesis:
Hypothesis 3. Firm reputation has a negative moderating effect between BCO and carbon performance.Figure 1 illustrates the framework of theories used to test these three hypotheses, which examine the links among BCO, board carbon awareness, firm reputation, and carbon performance.
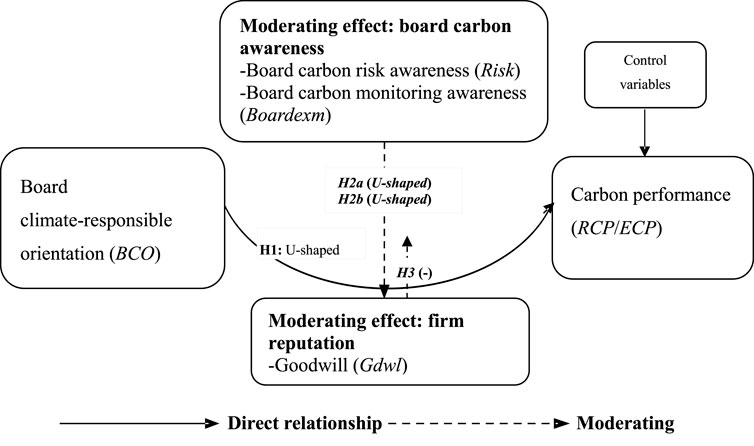
FIGURE 1. Conceptual framework.
3 Current status of climate change and carbon emissions reforms in the United States
The United States is the world’s most developed economy, and at the same time the economy with the highest per capita carbon emissions (Song et al., 2019). Therefore, the United States has been greatly concerned about the issue of emission reduction. The Kyoto Protocol is the first international agreement by countries to limit greenhouse gas emissions in the form of regulations. The William J. Clinton Administration signed the Kyoto Protocol in 1997, but in 2001 George W. Bush abandoned the agreement on the ground that it would harm the economy (Lord, 2005). The Paris Agreement. 2015), adopted at the United Nations Climate Change Conference in 2015, will replace the Kyoto Protocol and provide a unified arrangement for global action on climate change beyond 2020. The Paris Agreement is also second legally binding climate agreement. The Obama administration formally signed the Paris Agreement in 2016 (Clémençon, 2016). However, in 2017, the Trump administration announced its withdrawal from the Paris Agreement on the grounds that the agreement is unfavorable to the United States and advantages to other countries, and formally withdraw in 2020 (Zhang et al., 2017). Less than a year later, the Biden administration signed an executive order announcing the United States’ return to the Paris Agreement (South et al., 2021). We can see that the attitude of the US federal government to the emission reduction policy is constantly wavering.
While official statements from consecutive presidential administrations have expressed commitment to climate protection, actual federal efforts to reduce emissions have not gone much beyond support for research and voluntary programs (Moser, 2007). In the absence of any comprehensive federal climate change law, state and local governments’ emissions reductions rely largely on market-based incentives and voluntary action. In 2005, seven US states, including Connecticut, Delaware, and Maine, signed a regional greenhouse gas initiative (RGGI) framework agreement, which formed the first market-based greenhouse gas emissions trading system in the United States. RGGI was a state-based regional partnership to combat climate change, sustaining and reducing CO2 emissions in RGGI member states in the most economical way possible. The RGGI agreement set a cap on greenhouse gas emissions from signatory states and planned to reduce greenhouse gas emissions by 10% by 2018 compared to 2009. In 2007, California and seven other western states signed the Western Climate Initiative (WCI). WCI established an integrated carbon market that included. It was intended multiple industries and plans to be fully operational by 2015 and cover 90% of its member states’ greenhouse gas emissions to reduce emissions by 15% by 2020 (Perdan and Azapagic, 2011).
In the context of the uncertain attitudes to emission reduction policy, the United States has taken a voluntary carbon emission reductions route based on the development of clean energy, using fiscal policy and carbon trading market mechanisms to promote the low-carbon transformation of firms. The United States is currently experiencing negative growth in CO2 emissions, while the country’s GDP per capita has continued to grow since2007<sup>1</sup>. Based on the BP Statistical Review of World Energy. (2016) (Sakata et al., 2017), United States. carbon emissions increased year-on-year before 2007. Then, between 2007 and 2015, US carbon emissions decreased from 6132.4 to 5485.7 Mt per annum (Li and Su, 2017). First, the United States has successfully achieved carbon emission reduction without hindering economic development, which is worth studying and learning from (Li and Su, 2017). Second, carbon emissions reduction in the United States relies essentially on voluntary actions, which is consistent with our research data. We use second-hand data provided by CDP based on voluntary disclosures by companies, and we looked at data voluntarily disclosed by US. firms, which we argue are more reliable.
4 Research design
4.1 Data source
Our research data consists of 665 US. listed corporations reported by the Carbon Disclosure Project (CDP) during the period 2010–2019. We build a 10-year unbalanced panel dataset. The CDP report is a shared database used for recent company carbon emissions (Dahlmann et al., 2019). Over 80% of the world’s largest 500 corporations now voluntarily provide information to the CDP (CDP Questionnaire, 2012). Although far from perfect, Kolk (2008) observes that CDP data are increasingly reliable. Disclosure includes information on senior management responsibilities for climate change. Data related to carbon emissions are constructed from firm responses to the standardized CDP questionnaire. We gather data related to firm characteristics and firm financial information from the Compustat database. According to each firm name, we determine its ticker symbol in the American Stock Exchange, and according to the ticker symbol, we merge the CDP database with the Compustat database to form our sample. A total of observations are eliminated from our sample according to the following criteria: missing carbon emissions data, incomplete or missing firm governance data, and missing financial data from Compustat. To mitigate the effect of outliers in our subsequent tests, we also winsorize all continuous financial variables at the levels of 1% and 99%.
4.2 Variables measurement
4.2.1 Dependent variables
Carbon performance (RCP/ECP). In measuring the overall effect on the carbon performance level, we employ the sum of Scope 1 and 2 emissions to estimate the relationship<sup>2</sup>. We use two carbon performance measures. Revenues intensity performance (RCP) and employee intensity performance (ECP). Here, we need to point out that carbon performance is the inverse of carbon emission intensity and carbon emission intensity data from the CDP report. We obtain the data from responses to the questions: ‘What are your organisation’s gross global Scope 1 emissions in metric tons CO2e?’ and ‘Describe your organisation’s approach to reporting Scope 2 emissions,’ in the emissions data chapter’ (CDP Global 500 Report, 2018). Revenue carbon emission intensity is defined as metric ton carbon emissions per revenue, and employee carbon emission intensity is defined as metric ton carbon emissions per full time equivalent employee. Thus, the measure of RCP = ln (1/revenue carbon emission intensity) and ECP = ln (1/employee carbon emissions intensity).
4.2.2 Independent variables
Board climate-responsible orientation (BCO). We define BCO as the extent to which the board of directors has climate-responsible awareness, which is measured by the board of directors as the duration of responsibility for climate change. We obtain the role of managers occupying the highest level of direct responsibility for climate change within organisations from the CDP reports, based on two questions: ‘Where is the highest level of direct responsibility for climate change within your organisation?’ and ‘Identify the position(s) of the individual(s) on the board with responsibility for climaterelated issues.’ We manually scrutinise the managers’ role descriptions and identified firms that assigned the board of directors the highest level of direct responsibility for climate change within the organisation. We use the cumulative board service duration as a proxy variable for the BCO. We argue that the longer the board serves, the higher its climate-responsible awareness. Furthermore, we add the quadratic term variable BC O2 to examine the nonlinear relationship in the model.
4.2.3 Moderating variable
Board carbon risk awareness (Risk). We define risk as a dummy variable, which represents board carbon risk awareness. We obtain the data from the CDP reports, in response to the question: ‘Have you identified any inherent climate-related risks with the potential to have a substantive financial or strategic impact on your business?’ If there exists an awareness of the substantive financial or strategic impact of climate-related risks on the business, we assign the value of “1”. Otherwise the value is “0”.
4.2.4 Board carbon monitoring awareness
We define Boardexm as a dummy variable, which represents board carbon monitoring awareness. We obtain the data from the CDP reports, based on the question: ‘Is there board-level monitoring of climate-related issues within your organization?’ If a firm has board-level monitoring of climate-related issues, we assign the value of “1”. Otherwise the value is “0”.
4.2.5 Firm reputation
Goodwill is one of the driving forces for firms to meet legal requirements. We obtain it from the Compustat database.
4.2.6 Control variable
To control the impact of firm-specific and other governance variables on carbon performance, we control several variables, consistent with prior research (Ben-Amar et al., 2017; Haque, 2017; Bui et al., 2020; Tingbani et al., 2020; Aguilera et al., 2021; Nuber and Velte, 2021; Konadu et al., 2022). Firstly, we control for carbon attributes and board attributes including firm emission trading schemes, firm managing climate change incentives, board size and executive directors. Scheme is a dummy variable to indicate whether corporations participate in any emission trading schemes. Incentive is a dummy variable to indicate whether corporations provide incentives for managing climate change issues, including attaining targets. Both emissions reduction schemes and incentives reflect a positive attitude toward climate matters. Bsize is the number of directors serving on the board. Free-rider problems and conflicting decision-making in larger boards make them ineffective on climate matters (Prado-Lorenzo and Garcia-Sanchez, 2010). Exdirector is the total number of executive directors. Secondly, we also control firm-specific variables for firm size, capital intensity, return on assets, capital expenditure, slack resources and market-to-book ratio. Size shows organisational visibility, which exposes a firm to intense legitimacy scrutiny, resulting in greater responsiveness towards environmental and emission reduction issues (Datt et al., 2019). Asset is the ratio of firm’s property, plant and equipment in total assets because firms with modern equipment are considered to have the capacity to control their emissions better than those with older equipment (Tingbani et al., 2020). Capex is the total capital divided by total sales. Firms with higher capital expenditure employ clean and energy efficient technologies, leading to an improvement in energy efficiency and carbon performance (Luo et al., 2012). Roa is determined by profit after tax, divided by total assets. Independent carbon assurance is more likely to occur in firms with higher returns on assets because such firms have more resources to afford the cost of this service (Luo et al., 2013). Slack captures firm’s liquidity, since highly liquid firms have adequate resources that enable them to manage climate change challenges. Mtbt is the ratio of market-to-book value of equity. Firms with higher market-to-book ratios provide more environmental disclosure to reduce the information asymmetry between the firm and external investors (Tingbani et al., 2020). Table 1 provides all variables definition and measurement.
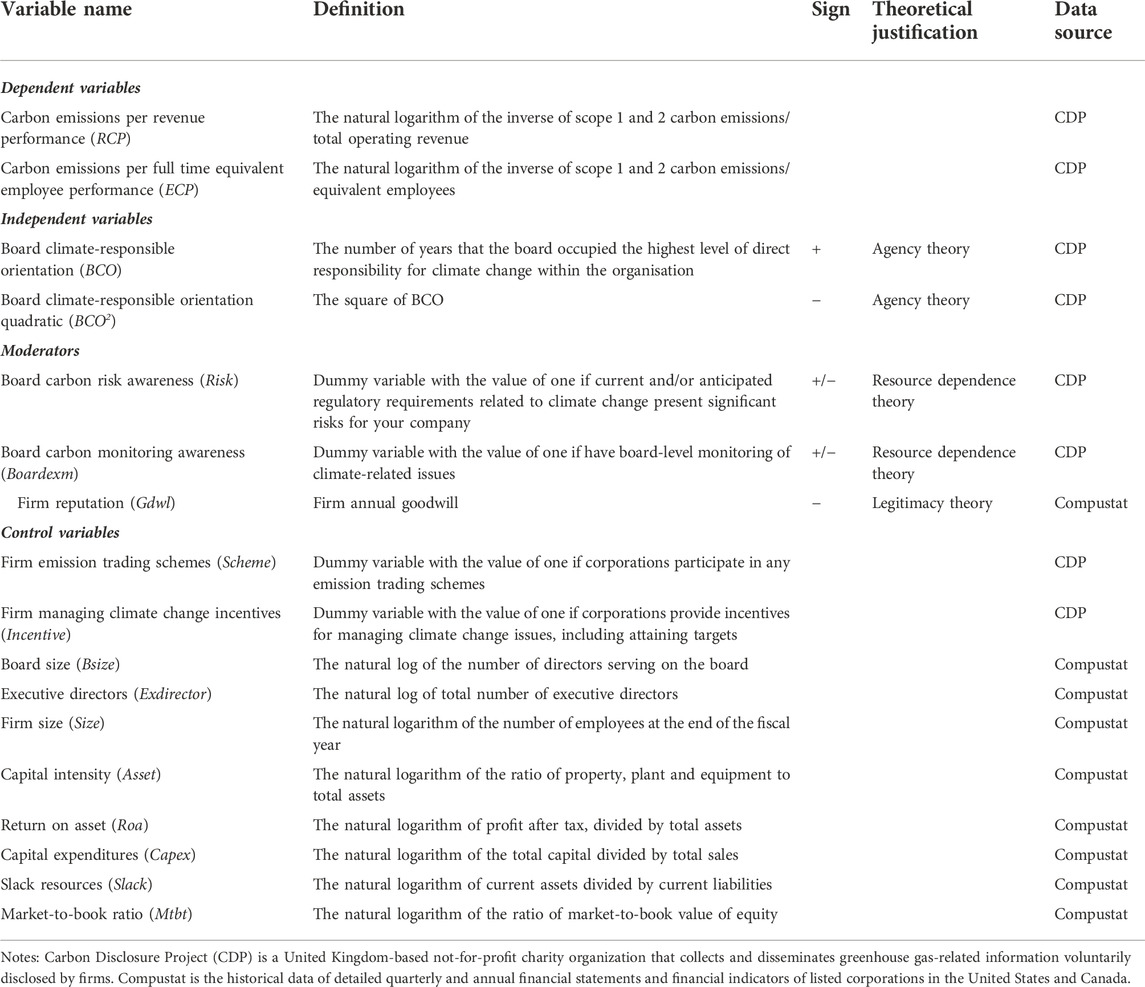
TABLE 1. Variable definition and measurement.
The tests for multicollinearity reveal the highest variance inflation factor (VIF) is 3.06, well below the suggested threshold of 10 for the risk of multicollinearity, which indicates that there are no serious collinearity problems between variables. Table A1 provides summary statistics of all variables. Table A2 presents the correlations between all variables.
4.3 Regression models
We use the following regression analysis to test the relationship between BCO and corporate carbon performance:
where i indexes the firm, and t indexes the year. Carboni,t is the dependent variable to reflect carbon performance, including RCPi,t and ECPi,t. BCOi,t is an independent variable indicating board climate-responsible orientation. BCO2i,t is the square of BCO. Control i,t, including a set of time-varying control variables. αi is firm fixed effects, and δt is year fixed effects. β0 is the intercept, and εi,t is the error term.
Moreover, we add the interaction items to the model to further investigate the moderating effect of board carbon awareness (Risk/Boardexm/Gdwl) on carbon performance. The moderating effect estimation model is as follows:
where Moderatei,t including Riski.t, Boardexmi.t and Gdwli.t. Riski.t is board carbon risk awareness. Boardexmi.t is board carbon monitoring awareness. Gdwli.t is firm reputation.
4.4 Analytical approach
We start with the Hausman, (1978) test to examine the influence of contemporaneous correlation between the regression and the error terms. The results show a p-value of 0.0006, which is less than 1% (0.01). Thus, we reject null hypothesis and accept the alternative hypothesis. We use fixed effect models to measure the nonlinear relationship between BCO and carbon performance to control firm-year heterogeneity.
Although we have controlled for factors at the corporation level, there remain the possible endogeneity biases. We employ the instrumental variable (IV) approach and Heckman two-step procedure to alleviate endogeneity. Specifically, ‘the number of firms where climate-responsible orientation boards in a certain industry (IV)’ is used as an instrument variable, following Fu et al. (2019) and Awaysheh et al. (2020).
Furthermore, to examine the effectiveness of BCO, we take board carbon awareness and firm reputation as moderating variables to explore therelationship between BCO and carbon performance.
5 Results and analysis
5.1 Baseline regression results
Table 2 reports the regression results of BCO on carbon performance. We add the square of BCO to examine the nonlinear relationship. All models control for firm fixed effects and year fixed effects. Columns (1), (2), (4), and (5) do not include firm-level control variables. Columns (3) and (6) include firm-level control variables. In Columns (1) and (4), we examine the relationship between BCO and carbon performance. The coefficients of BCO are negative. And BCO is significant at the level of 5% for ECP. In Columns (2), (3), 5) and (6), the coefficients of BCO are negative and BCO2 are positive. BCO and BCO2 are all significant at the level of 1%, which indicates BCO has a U-shaped relationship with carbon performance. The regression results support hypothesis 1. At the early stage of boards’ responsibility for climate change, their carbon management experience is not adequate. Boards might take symbolic emission reduction actions to meet shareholders’ expectations and secure legitimacy. Thus, we find that the carbon performance is not ameliorated effectively. After boards hve been responsible for climate change for a while, they produce substantive action and the effect on carbon performance improve.
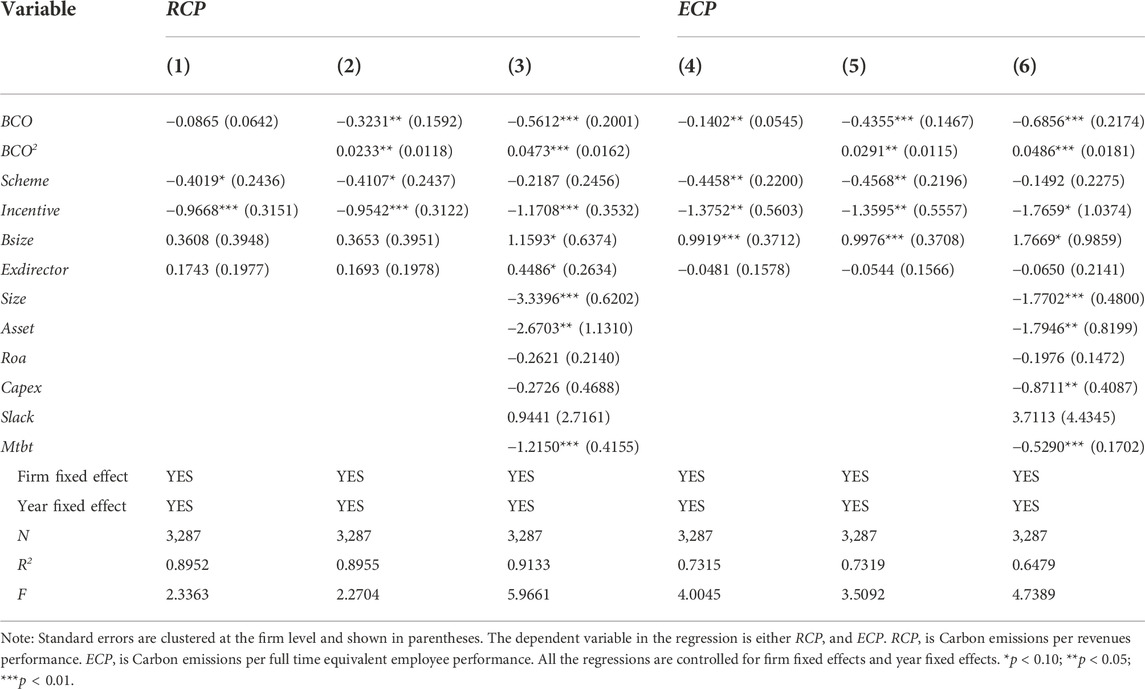
TABLE 2. Fixed-effects regression of BCO and carbon performance.
5.2 Addressing endogeneity
CDP is a questionnaire that is voluntarily filled out by firms. We argue that most firms willing to disclose climate information in CDP may themselves have, good climate governance systems, which leads to the problem of sample selection bias. We use Heckman is two-step method to test this biased result to verify the reliability of the conclusion. We choose the following covariables: 1) Firm size (Emp). The larger the firm size, the more attention if can pay to board carbon management to meet legality requirements and obtain a good firm image. 2) Whether or not the firm participates in carbon emission trade schemes (Ets). Boards participating in ETS are more likely to have a climate-responsible orientation to better manage carbon emissions. 3) Whether or not the firm establishes sustainability development committees (Sdc). The main responsibilities of the sustainable development committee are closely related to corporate sustainable development and environmental issues, so they presence shows boards with strong climate-responsible awareness. 4) Whether or not the firm has emissions reduction targets (Target). Emissions reduction targets are a manifestation of board climate-responsible awareness. 5) Total number of independent directors (Indirector). Independent directors tend to have a long-term perspective and thus tend to pursue sustainable development (Liao et al., 2015). The higher the proportion of independent directors, the higher the level of effective board monitoring of climate-responsibility. 6) Research and development investment (Rd). Rd embodies firm innovation ability, which is needed to support firm emission reduction. Firms with higher Rd have boards with more climate and environmental awareness. In Panel A of Table 3, the regression results for Heckman’s two-step method show that the lambda is both not significant, which indicates our results have no sample selectivity bias.
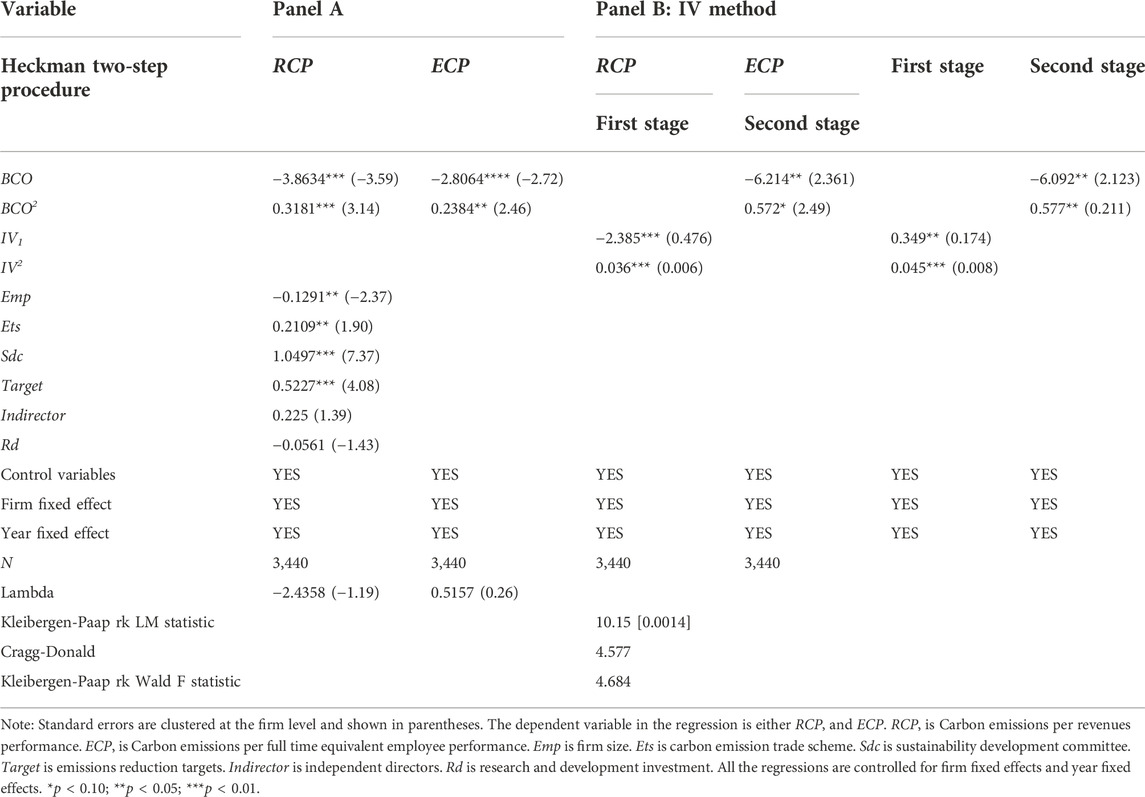
TABLE 3. Addressing the endogeneity.
Further, to alleviate the coherence bias problem, we implement the two-stage least squares (2SLS) instrumental variables approach. A valid instrument for the endogenous variable must meet two conditions: the relevance condition and exclusion restriction. The relevance condition requires a non-zero correlation between the endogenous variable and the instrument. The exclusion restriction requires that the instrument is indirectly related to the outcome variable through its effect on the endogenous variable. We use ‘the number of firms with board climate-responsible orientation in a certain industry (IV)’ as the instrumental variable. The instrumental variables are measures as follows: Firstly, when firms are considering whether to appoint the board in charge of climate-related activities, they may take the practices of firms in the same industry or the same region as a reference, so the two indicators meet the correlation hypothesis. Secondly, the number of firms that appoint the board in charge of climate-related activities in a certain industry or region has a minor impact on the carbon emissions at the firm-level, satisfying the exogenous hypothesis of instrumental variables. The regression results are reported in panel B of Table 4. The first stage regression results show that the instrumental variable (IV) is significantly related to the endogenous variables at the level of 1%, satisfying the correlation hypothesis. The Kleibergen-Paap rk LM statistic is 9.727 (p-value is 0.0018), which strongly rejects the unidentified null hypothesis. The Cragg-Donald Wald F statistic is 4.42, and the Kleibergen-Paap rk Wald F statistic is 4.535. All reject the weak instrumented hypothesis. In the second stage, the coefficients of BCO and BC O2 are all significant at the level of 5%, which supports the instrumental variable regressions. It indicates that BCO has a U-shaped relationship with carbon performance.
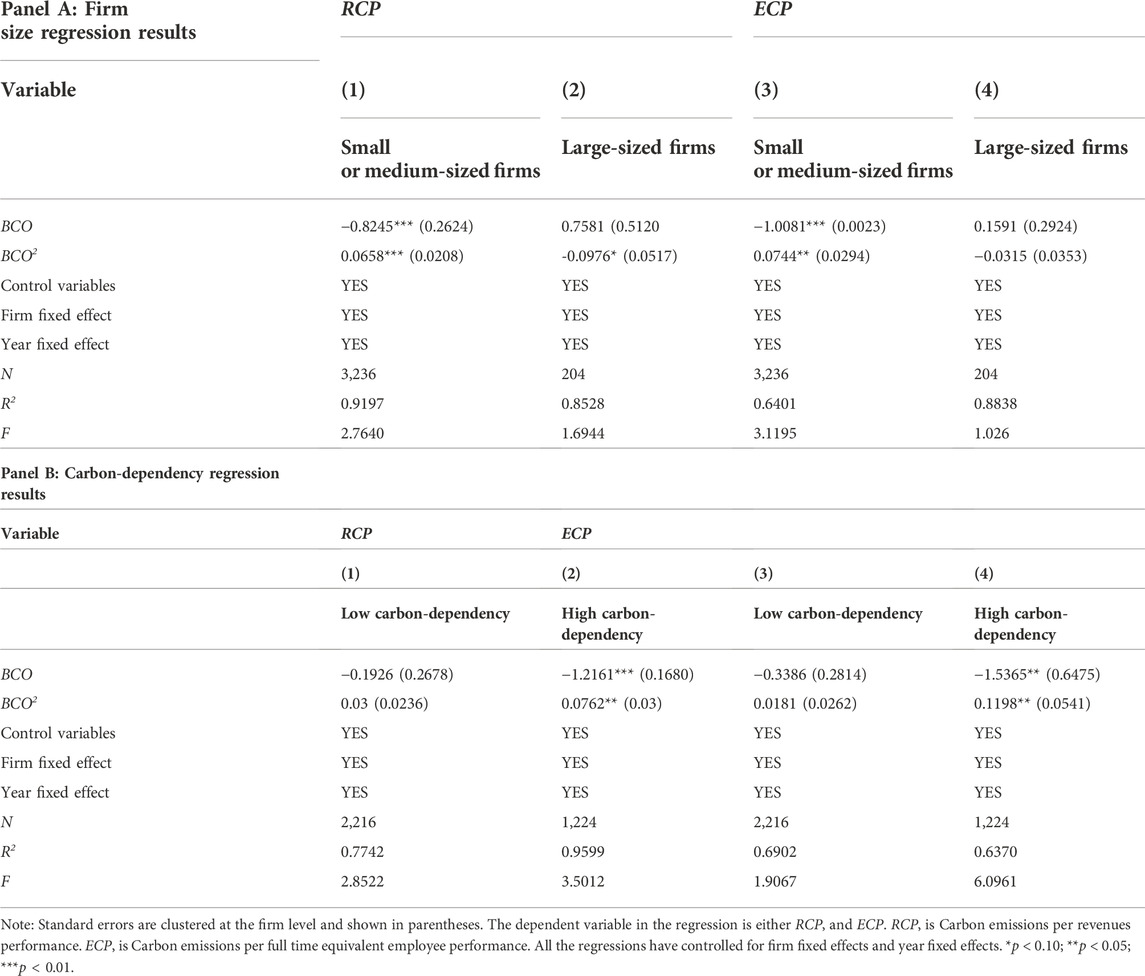
TABLE 4. Subsample analysis for firm and industry characteristics and carbon performance.
5.3 Additional analysis
5.3.1 Small or medium versus large firms
In panel A of Table 4, we examine the impact of firm size on carbon performance. In columns (1) and (3), we use fixed effects models to estimate the regression results of small or medium corporations. In columns (2) and (4), we use fixed effects models to estimate the regression results of large firms. We find that the effects of BCO on carbon performance are significant for small or medium-sized firms. In large-sized firms, the effect is insignificant, even negative. In column (2), the coefficients of BCO2 are negative and are significant at the level of 10%, which means BCO cannot effectively improve carbon performance for large-sized firms, but decreases carbons performance instead. Firstly, large-sized firms tend to emit more GHGs, which causes a burden on carbon performance management. Secondly, large-sized firm operations are intricate and the implementation results of carbon management to are slow to take effect. Thirdly, large-sized firms need to maintain profitability and pay attention to good reputations, so they are more likely to adopt symbolic carbon management to meet the legal requirements while acquiring profitability.
5.3.2 High versus low carbon-dependency industries
In panel B of Table 4, we examine the impact of different industry carbon-dependency on carbon performance. We bounded by the median number of full-time employees and divide our sample into two subsamples. Small or medium-sized firms are below 50 percentiles and large-sized firms are above 50 percentiles. There are huge differences across firms with different carbon dependencies. Firms with high carbon-dependence are subject to higher climate change-related risks. Therefore, we might expect these corporations to provide more information about climate change-related strategies than firms with low carbon-dependency. We follow the CDP (2008) methodology and define firms in the fields of automobile and components, chemicals, forest products, gas and electrical utilities, oil and gas, mining, pipelines, precious metals, steel, and transportation as highly carbon-dependency. In columns (1) and (3), we estimate the results of firms with low carbon-dependency. In columns (2) and (4), we estimate the results of firms with high carbon-dependency. We find that the effects of BCO on carbon performance are significant for firms with high carbon-dependency. In firms with low carbon-dependency, the effect is insignificant. Firstly, the transformation of firms with high carbon-dependency is critical to achieving global low carbon growth. Thus, the carbon management of firms with high carbon-dependency is vital. Secondly, for firms with high carbon-dependency, carbon management is difficult, so the board of directors will focus more on corporate climate responsibility to be effective.
5.4 Robustness checks and system generalized method of moments
We perform some robustness tests to make our regression results more reliable. Firstly, we examine BCO on the composition of carbon performance. Specifically, we use Scope 1 and 2 emissions individually as alternative measures of carbon performance, including the reciprocal of scope 1 carbon emissions per revenue (RCP1), the reciprocal of scope1 carbon emissions per full time equivalent employee (ECP1), the reciprocal of scope 2 carbon emissions per revenue (RCP2), the reciprocal of scope 2 carbon emissions per full time equivalent employee (ECP2). The regression results are reported in Panel A of Table 4. Secondly, Panel B of Table 5 shows the regression results of seventy percent of the sample.
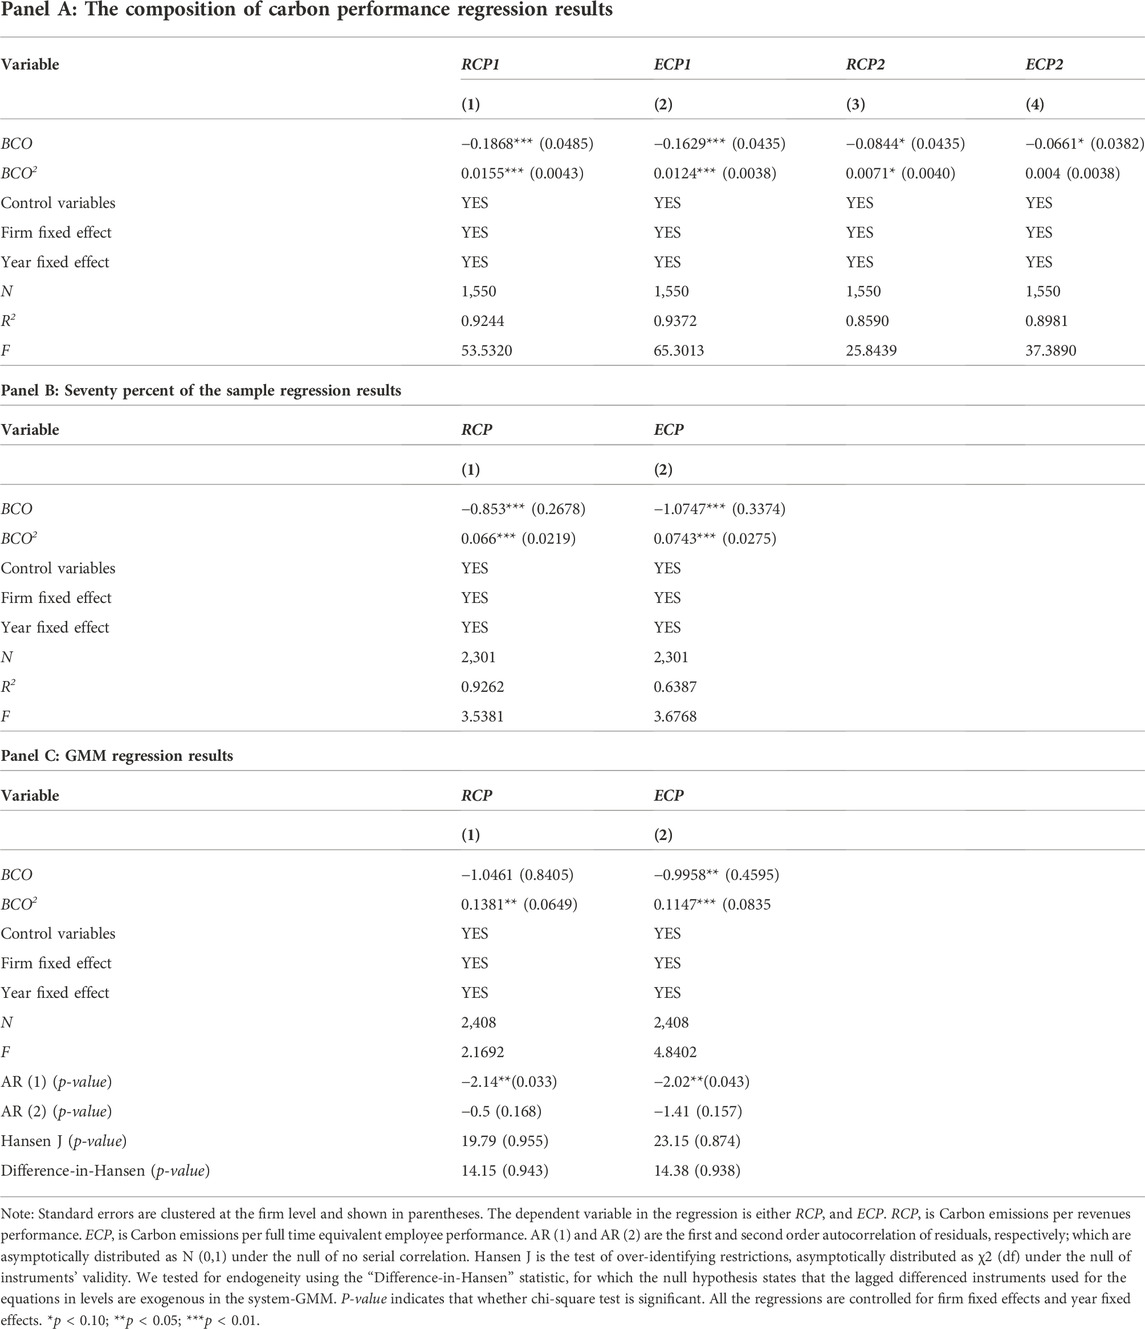
TABLE 5. Additional robustness tests.
Finally, to address the concerns about potential endogeneity and reverse causality among BCO and carbon performance, we estimate a model using a dynamic two-step system generalized method of moments (GMM) panel data estimator. We have added firm dummies in all our models to control for firm-level fixed effects. In our GMM regression for BCO, we use IV as an endogenous variable; the specification of carbon performance (RCP/ECP) includes BCO as an endogenous variable. In all specification we use the first lags of all independent variables as instruments. The validity of the instruments is tested using the Hansen J statistic of overidentifying restrictions and the Arellano-Bond test of the absence of serial autocorrelation. The regression results reported in Panel C of Table 5 suggest no significant difference from the reported findings.
6 The moderating effect
6.1 The moderating effect of board carbon awareness
We consider board carbon awareness as a possible moderator variable; the results are reported in Table 6. Columns (1), generalized method of moments (2) and (3) are the regression results of fixed effect models with RCP as the dependent variable. Columns (4), (5), and (6) are the regression results of the year and firm fixed effect models with ECP as the dependent variable. Firstly, to test whether board carbon risk awareness can improve the effectiveness of board carbon management, we add the interaction terms BCO × Risk and BCO2 × Risk in our model. Column (1) shows the results we see that board carbon risk awareness (Risk) moderates the relationship between BCO and carbon performance. The interaction term BCO × Risk is positive and is significant at the level of 1%. The interaction term BCO2 × Risk is negative and is significant at the level of 5%. This indicates that board who are aware of carbon risks may reduce symbolic emission reduction actions in carbon management. However, in substantive emission reduction actions, the board weakens emissions reduction efforts, perhaps out of cautious consideration for risk. The regression results support Hypothesis 2a.
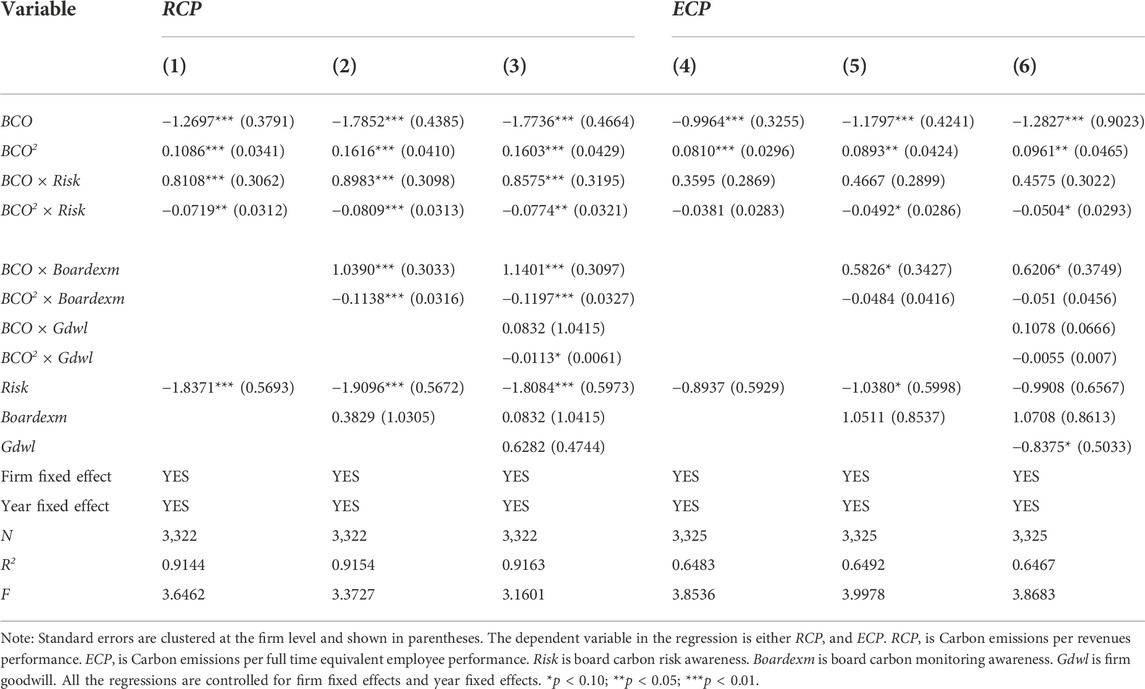
TABLE 6. Results for moderating effects.
Secondly, board carbon monitoring awareness can show the extent to which the board implements effective carbon management. To test this, we add the interaction terms BCO × Boardexm and BCO2 × Boardexm in our model. Columns (2) and (4) show the results, indicating that board carbon monitoring awareness (Boardexm) moderates the relationship between BCO and carbon performance. The interaction term BCO × Boardexm is positive and is significant at the level of 10%. BCO × Boardexm all have a significant influence on RCP and ECP. The interaction term BCO2 × Boardexm is negative and is significant at the level of 1%. This indicates that board carbon monitoring awareness is mainly reflected in decreased symbolic emission reduction actions, and strict regulations on substantively emission reduction actions, which makes the improvement of carbon performance slow.
6.2 The moderating effect of firm reputation
Firm reputation is to meet legitimacy requirements. We add the interaction term BCO × Gdwl and BCO2 × Gdwl in the model. Columns (2) and (4) show the results for firm reputation (Gdwl), it indicating that it moderates the relationship between BCO and carbon performance. The interaction term BCO × Gdwl is insignificant. The interaction term BCO2 × Gdwl is negative and is significant at the level of 10%. This indicates Gdwl has a negative influence on firm substantive carbon performance. We argue that when firms excessively pursue high reputation, they tend to carry out symbolic carbon emission reduction activities that can easily be displayed to the outside world, but damage substantive carbon performance.
7 Discussion
7.1 Significance of the results
In this study, we provide empirical evidence that BCO has a U-shaped relationship with carbon performance, which is consistent with our theoretical framework. Our findings indicate that the monitoring function does not play an effective role when the board has less experience in monitoring climate issues. When the board of directors is under more legitimacy pressure, firms will implement symbolic emission reduction actions to maintain their reputation. As experience increases, the board of directors accumulates environment-related knowledge and resources to effectively monitor the firm’s substantive emission reduction actions. Besides, we find that BCO has a better effect on the carbon performance of small or medium-sized and high carbon dependency firms.
Through the introduction of board carbon awareness and firm reputation, our research further explores the mechanism of BCO on carbon performance. Board carbon awareness increases the board’s monitoring function on specific issues. Firstly, increased carbon risk awareness makes the board proactively identify the key risks arising from carbon-related issues and implement carbon strategies. Thus, carbon risk awareness will reduce symbolic emission reduction actions. Carbon risk awareness leads to more cautious board decision-making, so the board’s carbon efficiency in substantive carbon reduction activities decreases. Secondly, we further consider carbon monitoring awareness. The Board’s monitoring functions are selective, based on environmental and structural factors. The board of directors attend selectively to their monitoring function based on contextual and structural factors (Tuggle et al., 2010). We find that monitoring awareness also reduces symbolic carbon reduction actions and mitigates the effectiveness of carbon performance in substantively emission reduction actions. Thirdly, we consider the moderating effect of firm reputation. Most of the legitimacy pressure on firms is related to the pursuit of reputation. Firms that implement symbolic emission reduction actions establish a good firm image to maintain and enhance their reputation. We find that goodwill plays a negative monitoring role in corporate carbon performance, which indicates firms do engage in symbolic carbon reduction actions in pursuit of reputation.
7.2 Theoretical contributions
This paper implements multiple theoretical frameworks to make the theoretical explanation of carbon performance of board of directors more complete. Based on the two basic functions of board monitoring function and resource access functions, this paper combines the theory of agency on behalf of the monitoring function and theresource dependence theory on behalf of the resource access functions. We argue that he impact of the board of directors on carbon performance should shift from the negative linear relationship of monitoring management function to the positive linear relationship of accessible for information and resources function. This is because the agency theory leads to the symbolic emission reduction actions of the board of directors, and the resource dependence theory makes the board of directors more able to improve corporate environmental performance by accessing environment-related resources. Board function is necessary not only to meet the environmental expectations of stakeholders but also to meet the social criteria of legitimacy. Firms must increase board effectiveness in carbon-related aspects to legitimize firm activities. Thus, in our research, legitimacy theory is necessary, which is also the turning point of U-shaped relationship. What’s more, we further examine the boundary effects of resource access functions and external environmental factors on carbon performance. We find that carbon awareness explained by resource dependence theory and corporate reputation influenced by legitimacy theory both affect the effectiveness of board on carbon performance. Based on the proposed theoretical framework, we explain that the U-shaped relationship between board of directors and carbon performance will be affected by carbon awareness and corporate reputation, which broadens the applicability of the theory.
7.3 Managerial contributions
Our findings offer important implications for managers and policymakers. Firstly, the increased experience of BCO will lead to better carbon performance. Based on this study, we recommend managers to actively establish the BCO and improve the board’s monitoring ability. Secondly, to improve the effectiveness of the BCO monitoring function, compensation incentives, strategic carbon-reduction initiatives and other means should be implemented to facilitate BCO members’ access to resources. Thirdly, for investors, invest in environmentally-friendly firms, corporations taking symbolic of carbon reduction actions without improving substantive carbon performance can confuse investors. Our results provide a reference for investors when choosing investment firms. Forthly, for policymakers, they can impose external pressure on firms through policy-making, and promoting board monitoring awareness and carbon awareness. Simultaneously, policymakers should formulate specific emission reduction requirements and evaluation criteria to measure substantive emission reduction, and prevent firms from taking symbolic emission reduction actions.
7.4 Limitations and future research
Our study is subject to several limitations that indicate potential avenues for future research. Firstly, because of data availability, our study is limited to United States. listed firms. Future, when data is available in other areas, it would be useful to extend this study to make the results more general. Secondly, this paper only considers board-level climate-responsible orientation. As climate change issues intensify, firms are increasingly inclined to appoint sub-committees to manage climate change. Future research could consider such committees’ monitoring function and further refine the role of board-level monitoring. Thirdly, according to resource dependence theory, board members may access more resources of emission reduction strategies as a way to achieve effective monitoring functions. In future, the specific paths of the board’s impact on carbon performance can be considered, for example, whether carbon performance is related to the large-size application of low carbon technology or internal carbon pricing.
Data availability statement
The original contributions presented in the study are included in the article/Supplementary Material, further inquiries can be directed to the corresponding author.
Author contributions
MX: Conceptualization; Data curation and analysis; Roles/Writing—original draft; Visualization HC: Writing—Review and editing; Supervision. QY: Data analysis; Writing—Review.
Conflict of interest
The authors declare that the research was conducted in the absence of any commercial or financial relationships that could be construed as a potential conflict of interest.
Publisher’s note
All claims expressed in this article are solely those of the authors and do not necessarily represent those of their affiliated organizations, or those of the publisher, the editors and the reviewers. Any product that may be evaluated in this article, or claim that may be made by its manufacturer, is not guaranteed or endorsed by the publisher.
Footnotes
1The data source from U.S Environmental Protection Agency (EPA).
2Scope 1 emissions are direct emissions, which refer to emissions related to the combustion of fossil fuels or the processing of chemicals and materials from sources that are owned or controlled by the company. Scope 2 emissions are indirect emissions, which refer to emissions from the generation of purchased electricity, heat or steam
References
Aguilera, R. V., Aragón-Correa, J. A., Marano, V., and Tashman, P. A. (2021). The corporate governance of environmental sustainability: A review and proposal for more integrated research. J. Manag. 47 (6), 1468–1497. doi:10.1177/0149206321991212
Alsaifi, K., Elnahass, M., and Salama, A. (2020). Carbon disclosure and financial performance: UK environmental policy. Bus. Strategy Environ. 29 (2), 711–726. doi:10.1002/bse.2426
Aragón-Correa, J. A., and Sharma, S. (2003). A contingent resource-based view of proactive corporate environmental strategy. Acad. Manag. Rev. 28 (1), 71–88. doi:10.2307/30040690
Awaysheh, A., Heron, R. A., Perry, T., and Wilson, J. I. (2020). On the relation between corporate social responsibility and financial performance. Strateg. Manag. J. 41 (6), 965–987. doi:10.1002/smj.3122
Bansal, P., and Clelland, I. (2004). Talking trash: Legitimacy, impression management, and unsystematic risk in the context of the natural environment. Acad. Manage. J. 47 (1), 93–103. doi:10.5465/20159562
Barnett, M. L., and Salomon, R. M. (2006). Beyond dichotomy: The curvilinear relationship between social responsibility and financial performance. Strateg. Manag. J. 27 (11), 1101–1122.
Baselga-Pascual, L., Trujillo-Ponce, A., Vhmaa, E., and Vhmaa, S. (2018). Ethical reputation of financial institutions: Do board characteristics matter? J. Bus. Ethics 148 (3), 489–510. doi:10.1007/s10551-015-2949-x
Ben-Amar, W., Chang, M., and McIlkenny, P. (2017). Board gender diversity and corporate response to sustainability initiatives: Evidence from the carbon disclosure project. J. Bus. Ethics 142 (2), 369–383. doi:10.1007/s10551-015-2759-1
Berrone, P., Fosfuri, A., and Gelabert, L. (2017). Does greenwashing pay off? Understanding the relationship between environmental actions and environmental legitimacy. J. Bus. Ethics 144 (2), 363–379. doi:10.1007/s10551-015-2816-9
Boh, W. F., Huang, C. J., and Wu, A. (2020). Investor experience and innovation performance: The mediating role of external cooperation. Strateg. Manag. J. 41 (1), 124–151. doi:10.1002/smj.3089
BP Statistical Review of World Energy (2016). Energy economics. Available At: http://www.bp.com/en/global/corporate/energy economics/statistical-review-of-world-energy.html ((accessed on April 10, 2017).
Bui, B., Houqe, M. N., and Zaman, M. (2020). Climate governance effects on carbon disclosure and performance. Br. Account. Rev. 52 (2), 100880. doi:10.1016/j.bar.2019.100880
CDP Global 500 Report (2018). “Carbon Disclosure Project 2018 Global 500 Report,” Carbon Disclosure Project. Available at: https://www.cdp.net.
CDP Questionnaire (2012). “2022 Public Authorities Questionnaire,” Carbon Disclosure Project. Available at: https://www.cdproject.net/cdpquestionnaire. (Accessed January, 2012).
Chan, T., Wang, I., and Ybarra, O. (2021). Leading and managing the workplace: The role of executive functions. Acad. Manag. Perspect. 35 (1), 142–164. doi:10.5465/amp.2017.0215
Chari, M. D., David, P., Duru, A., and Zhao, Y. (2019). Bowman's risk-return paradox: An agency theory perspective. J. Bus. Res. 95, 357–375. doi:10.1016/j.jbusres.2018.08.010
Chen, Y., and Ma, Y. (2021). Does green investment improve energy firm performance? Energy Policy 153, 112252. doi:10.1016/j.enpol.2021.112252
Cho, C. H., Guidry, R. P., Hageman, A. M., and Patten, D. M. (2012). Do actions speak louder than words? An empirical investigation of corporate environmental reputation. Account. Organ. Soc. 37 (1), 14–25. doi:10.1016/j.aos.2011.12.001
Clémençon, R. (2016). The two sides of the Paris climate agreement: Dismal failure or historic breakthrough? J. Environ. Dev. 25 (1), 3–24. doi:10.1177/1070496516631362
Dahlmann, F., Branicki, L., and Brammer, S. (2019). Managing carbon aspirations: The influence of corporate climate change targets on environmental performance. J. Bus. Ethics 158 (3), 1–24. doi:10.1007/s10551-017-3731-z
Daily, C. M., Dalton, D. R., and Cannella, A. A. (2003). Corporate governance: Decades of dialogue and data. Acad. Manag. Rev. 28 (3), 371–382. doi:10.2307/30040727
Datt, R. R., Luo, L., and Tang, Q. (2019). The impact of legitimacy threaton the choice of external carbon assurance: Evidence from the US. Account. Res. J. 32 (2), 181–202. doi:10.1108/arj-03-2017-0050
Davies, R., Chun, R., and Roper, S. (2003). Corporate reputation and competitiveness. Corp. Reput. Rev. 5, 368–370. doi:10.1057/palgrave.crr.1540185
de Quevedo-Puente, E., De La Fuente-Sabaté, J. M., and Delgado-Garcia, J. B. (2007). Corporate social performance and corporate reputation: Two interwoven perspectives. Corp. Reput. Rev. 10 (1), 60–72. doi:10.1057/palgrave.crr.1550038
De Villiers, C., Naiker, V., and Van Staden, C. J. (2011). The effect of board characteristics on firm environmental performance. J. Manag. 37 (6), 1636–1663. doi:10.1177/0149206311411506
Deegan, C. (2002). Introduction: The legitimising effect of social and environmental disclosures–a theoretical foundation. Account. Auditing Account. J. 15 (3), 282–311. doi:10.1108/09513570210435852
Dixon-Fowler, H. R., Ellstrand, A. E., and Johnson, J. L. (2017). The role of board environmental committees in corporate environmental performance. J. Bus. Ethics 140 (3), 423–438. doi:10.1007/s10551-015-2664-7
Erhardt, N. L., Werbel, J. D., and Shrader, C. B. (2003). Board of director diversity and firm financial performance. Corp. Gov. 11 (2), 102–111. doi:10.1111/1467-8683.00011
Ferrell, A., Liang, H., and Renneboog, L. (2016). Socially responsible firms. J. Financial Econ. 122 (3), 585–606. doi:10.1016/j.jfineco.2015.12.003
Fu, R., Tang, Y., and Chen, G. (2019). Chief sustainability officers and corporate social (Ir) responsibility. Strateg. Manag. J. 41 (4), 656–680. doi:10.1002/smj.3113
Galbreath, J. (2018). Do boards of directors influence corporate sustainable development? An attention-based analysis. Bus. Strategy Environ. 27 (6), 742–756. doi:10.1002/bse.2028
Gallego-Álvarez, I., Segura, L., and Martínez-Ferrero, J. (2015). Carbon emission reduction: The impact on the financial and operational performance of international companies. J. Clean. Prod. 103, 149–159. doi:10.1016/j.jclepro.2014.08.047
Ghuslan, M. I., Jaffar, R., Mohd Saleh, N., and Yaacob, M. H. (2021). Corporate governance and corporate reputation: The role of environmental and social reporting quality. Sustainability 13 (18), 10452. doi:10.3390/su131810452
Hafsi, T., and Turgut, G. (2013). Boardroom diversity and its effect on social performance: Conceptualization and empirical evidence. J. Bus. Ethics 112 (3), 463–479.
Haque, F. (2017). The effects of board characteristics and sustainable compensation policy on carbon performance of UK firms. Br. Account. Rev. 49 (3), 347–364. doi:10.1016/j.bar.2017.01.001
Hausman, J. A. (1978). Specification tests in econometrics. Econometrica: J. Econom. Soc., 1251–1271.
He, R., Luo, L., Shamsuddin, A., and Tang, Q. (2021). The value relevance of corporate investment in carbon abatement: The influence of national climate policy. Eur. Account. Rev. 2021, 1–29. doi:10.1080/09638180.2021.1916979
Hillman, A. J., and Dalziel, T. (2003). Boards of directors and firm performance: Integrating agency and resource dependence perspectives. Acad. Manag. Rev. 28 (3), 383–396. doi:10.2307/30040728
Homroy, S., and Slechten, A. (2019). Do board expertise and networked boards affect environmental performance? J. Bus. Ethics 158 (1), 269–292. doi:10.1007/s10551-017-3769-y
Hoskisson, R. E., Castleton, M. W., and Withers, M. C. (2009). Complementarity in monitoring and bonding: More intense monitoring leads to higher executive compensation. Acad. Manag. Perspect. 23 (2), 57–74. doi:10.5465/amp.2009.39985541
Hussain, N., Rigoni, U., and Orij, R. P. (2018). Corporate governance and sustainability performance: Analysis of triple bottom line performance. J. Bus. Ethics 149 (2), 411–432. doi:10.1007/s10551-016-3099-5
Jung, J., Herbohn, K., and Clarkson, P. (2018). Carbon risk, carbon risk awareness and the cost of debt financing. J. Bus. Ethics 150 (4), 1151–1171. doi:10.1007/s10551-016-3207-6
Klettner, A., Clarke, T., and Boersma, M. (2014). The governance of corporate sustainability: Empirical insights into the development, leadership and implementation of responsible business strategy. J. Bus. Ethics 122 (1), 145–165. doi:10.1007/s10551-013-1750-y
Kolev, K. D., Wangrow, D. B., Barker, V. L., and Schepker, D. J. (2019). Board committees in corporate governance: A cross-disciplinary review and agenda for the future. J. Manage. Stud. 56 (6), 12444–21193. doi:10.1111/joms.12444
Kolk, A. (2008). Sustainability, accountability and corporate governance: Exploring multinationals' reporting practices. Bus. Strategy Environ. 17 (1), 1–15. doi:10.1002/bse.511
Konadu, R., Ahinful, G. S., Boakye, D. J., and Elbardan, H. (2022). Board gender diversity, environmental innovation and corporate carbon emissions. Technol. Forecast. Soc. Change 174, 121279. doi:10.1016/j.techfore.2021.121279
Kor, Y. Y. (2006). Direct and interaction effects of top management team and board compositions on R&D investment strategy. Strateg. Manag. J. 27 (11), 1081–1099. doi:10.1002/smj.554
Kor, Y. Y., and Misangyi, V. F. (2008). Outside directors' industry-specific experience and firms' liability of newness. Strateg. Manag. J. 29 (12), 1345–1355. doi:10.1002/smj.709
Kor, Y. Y., and Sundaramurthy, C. (2009). Experience-based human capital and social capital of outside directors. J. Manag. 35 (4), 981–1006. doi:10.1177/0149206308321551
Kyaw, K., Treepongkaruna, S., and Jiraporn, P. (2022). Board gender diversity and environmental emissions. Business Strategy and the Environment. Technol. Forecast. Soc. Change 174, 3052. doi:10.1002/bse.3052
Li, R., and Su, M. (2017). The role of natural gas and renewable energy in curbing carbon emission: Case study of the United States. Sustainability 9, 600–618. doi:10.3390/su9040600
Liao, L., Luo, L., and Tang, Q. (2015). Gender diversity, board independence, environmental committee and greenhouse gas disclosure. Br. Account. Rev. 47 (4), 409–424. doi:10.1016/j.bar.2014.01.002
Lord, D. (2005). Dubya: The toxic texan: George W. Bush and environmental degradation. New York, Lincoln Shanghai: iUniverse.
Luo, L., Lan, Y. C., and Tang, Q. (2012). Corporate incentives to disclose carbon information: Evidence from the CDP Global 500 report. J. Int. Financ. Manag. Account. 23 (2), 93–120.
Luo, L., and Tang, Q. (2021). Corporate governance and carbon performance: Role of carbon strategy and awareness of climate risk. Acc. Finance 61 (2), 2891–2934. doi:10.1111/acfi.12687
Malmendier, U., and Tate, G. (2005). CEO overconfidence and corporate investment. J. Finance 60 (6), 2661–2700. doi:10.1111/j.1540-6261.2005.00813.x
Meyer, J. W., and Rowan, B. (1977). Institutionalized organizations: Formal structure as myth and ceremony. Am. J. Sociol. 83 (2), 340–363. doi:10.1086/226550
Miller, T., and Triana, M. D. C. (2010). Demographic diversity in the boardroom: Mediators of the board diversity–firm performance relationship. J. Manag. Stud. 46 (5), 755–786. doi:10.1111/j.1467-6486.2009.00839.x
Moser, S. C. (2007). In the long shadows of inaction: The quiet building of a climate protection movement in the United States. Glob. Environ. Politics 7 (2), 124–144.
Moussa, T., Allam, A., Elbanna, S., and Bani-Mustafa, A. (2020). Can board environmental orientation improve US firms' carbon performance? The mediating role of carbon strategy. Bus. Strategy Environ. 29 (1), 72–86. doi:10.1002/bse.2351
Nuber, C., and Velte, P. (2021). Board gender diversity and carbon emissions. European evidence on curvilinear relationships and critical mass. Bus. Strategy Environ. 30 (4), 1958–1992. doi:10.1002/bse.2727
Orazalin, N., and Mahmood, M. (2021). Toward sustainable development: Board characteristics, country governance quality, and environmental performance. Bus. Strategy Environ. 30 (8), 3569–3588. doi:10.1002/bse.2820
Perdan, S., and Azapagic, A. (2011). Carbon trading: Current schemes and future developments. Energy policy 39 (10), 6040–6054. doi:10.1016/j.enpol.2011.07.003
Peters, G. F., and Romi, A. M. (2014). Does the voluntary adoption of corporate governance mechanisms improve environmental risk disclosures? Evidence from greenhouse gas emission accounting. J. Bus. Ethics 125 (4), 637–666. doi:10.1007/s10551-013-1886-9
Prado-Lorenzo, J. M., and Garcia-Sanchez, I. M. (2010). The role of the board of directors in disseminating relevant information on greenhouse gases. J. Bus. Ethics 97 (3), 391–424. doi:10.1007/s10551-010-0515-0
Rodrigue, M., Magnan, M., and Cho, C. H. (2013). Is environmental governance substantive or symbolic? An empirical investigation. J. Bus. Ethics 114 (1), 107–129. doi:10.1007/s10551-012-1331-5
Russo, M. V., and Harrison, N. S. (2005). Organizational design and environmental performance: Clues from the electronics industry. Acad. Manage. J. 48 (4), 582–593. doi:10.5465/amj.2005.17843939
Sakata, M., Phan, H. G., and Mitsunobu, S. (2017). Variations in atmospheric concentrations and isotopic compositions of gaseous and particulate boron in Shizuoka City, Japan. Atmos. Environ. 148, 376–381. doi:10.1016/j.atmosenv.2016.11.013
Salancik, G. R., and Pfeffer, J. (1978). A social information processing approach to job attitudes and task design. Adm. Sci. Q. 23, 224–253. doi:10.2307/2392563
Shahbaz, M., Karaman, A. S., Kilic, M., and Uyar, A. (2020). Board attributes, CSR engagement, and corporate performance: What is the nexus in the energy sector? Energy Policy 143, 111582. doi:10.1016/j.enpol.2020.111582
Singh, K., and Misra, M. (2021). Linking corporate social responsibility (CSR) and organizational performance: The moderating effect of corporate reputation. Eur. Res. Manag. Bus. Econ. 27 (1), 100139.
Song, Y., Zhang, M., and Zhou, M. (2019). Study on the decoupling relationship between CO2 emissions and economic development based on two-dimensional decoupling theory: A case between China and the United States. Ecol. Indic. 102, 230–236. doi:10.1016/j.ecolind.2019.02.044
South, D., Vangala, S., and Hung, K. (2021). The biden administration's approach to addressing climate change. Clim. Energy 37, 8–18. doi:10.1002/gas.22222
Talbot, D., and Boiral, O. (2018). GHG reporting and impression management: An assessment of sustainability reports from the energy sector. J. Bus. Ethics 147 (2), 367–383. doi:10.1007/s10551-015-2979-4
Tejerina-Gaite, F. A., and Fernández-Temprano, M. A. (2021). The influence of board experience on firm performance: Does the director’s role matter? J. Manag. Gov. 25 (3), 685–705. doi:10.1007/s10997-020-09520-2
The Paris Agreement (2015). The Paris agreement. AvaliableAt: https://unfccc.int/resource/docs/2015/cop21/eng/l09r01.pdf.
Tingbani, I., Chithambo, L., Tauringana, V., and Papanikolaou, N. (2020). Board gender diversity, environmental committee and greenhouse gas voluntary disclosures. Bus. Strategy Environ. 29 (6), 2194–2210. doi:10.1002/bse.2495
Truong, Y., Mazloomi, H., and Berrone, P. (2021). Understanding the impact of symbolic and substantive environmental actions on organizational reputation. Ind. Mark. Manag. 92, 307–320. doi:10.1016/j.indmarman.2020.05.006
Tuggle, C. S., Sirmon, D. G., Reutzel, C. R., and Bierman, L. (2010). Commanding board of director attention: Investigating how organizational performance and CEO duality affect board members' attention to monitoring. Strateg. Manag. J. 31 (9), 946–968. doi:10.1002/smj.847
Wang, Q., Zhao, M., Li, R., and Su, M. (2018). Decomposition and decoupling analysis of carbon emissions from economic growth: A comparative study of China and the United States. J. Clean. Prod. 197, 178–184.
Zhang, Y. X., Chao, Q. C., Zheng, Q. H., and Huang, L. (2017). The withdrawal of the US from the Paris Agreement and its impact on global climate change governance. Adv. Clim. Change Res. 8, 213–219. doi:10.1016/j.accre.2017.08.005
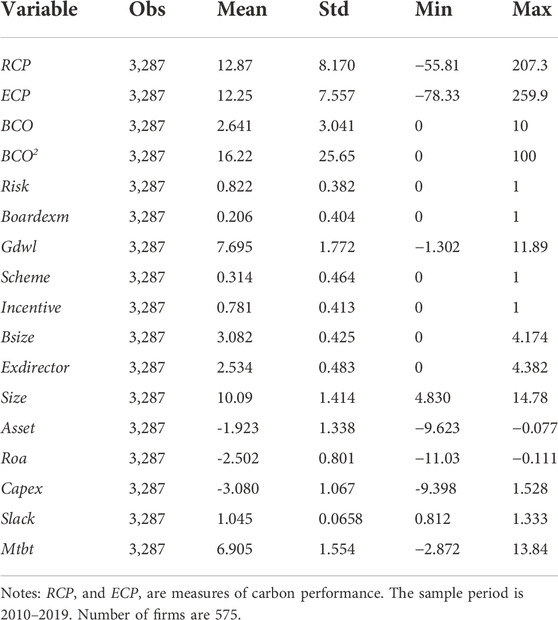
TABLE A1. Descriptive statistics.
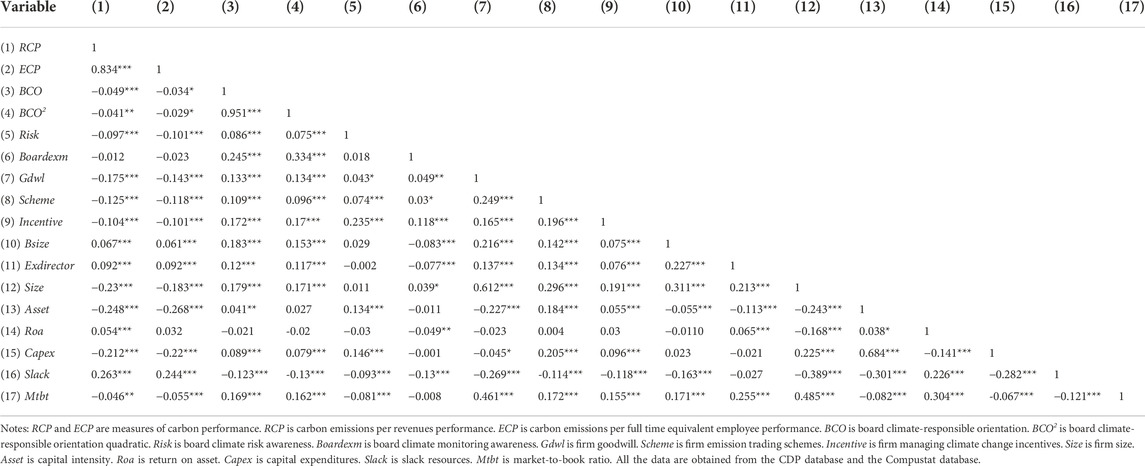
TABLE A2. Correlation matrix of variables.
Keywords: board climate-responsible orientation, carbon awareness, firm reputation, carbon performance, agency theory, resource dependence theory, legitimacy theory
Citation: Xia M, Cai HH and Yuan Q (2022) Can board climate-responsible orientation improve corporate carbon performance? The moderating role of board carbon awareness and firm reputation. Front. Environ. Sci. 10:1043325. doi: 10.3389/fenvs.2022.1043325
Received: 13 September 2022; Accepted: 24 October 2022;
Published: 25 November 2022.
Edited by:
Xiaowei Chuai, Nanjing University, ChinaReviewed by:
Olu Aluko, Nottingham Trent University, United KingdomHui Zhou, Cornell University, United States
Copyright © 2022 Xia, Cai and Yuan. This is an open-access article distributed under the terms of the Creative Commons Attribution License (CC BY). The use, distribution or reproduction in other forums is permitted, provided the original author(s) and the copyright owner(s) are credited and that the original publication in this journal is cited, in accordance with accepted academic practice. No use, distribution or reproduction is permitted which does not comply with these terms.
*Correspondence: Mengyao Xia, eGlhbWVuZ3lhb0AxNjMuY29t; Qiong Yuan, UVkwMjlAbGl2ZS5tZHguYWMudWs=