 Tiantian Li
 Haidong Gao1,2*
- 1State Key Laboratory of Northwest Arid Zone Ecological Water Resources, Xi’an University of Technology, Xi’an, China
- 2School of Civil Engineering and Construction, Xi’an University of Technology, Xi’an, China
With the rapid economic development in recent years, China has increased its investment in infrastructure construction, and the construction industry has become a significant contributor to China’s carbon dioxide (CO2) emissions. Therefore, carbon emission reduction in the construction industry is crucial to achieving the goal of “carbon peaking and carbon neutrality” as soon as possible. However, few studies have investigated the factors influencing CO2 emissions from the construction industry in terms of spatial and temporal differences. To address this gap, we first improve the calculation method for the construction industry’s life-cycle assessment (LCA). The geographically and temporally weighted regression (GTWR) model is then utilized to provide insight into the spatio-temporal heterogeneity of the various factors influencing CO2 emissions across other regions and times. The results show that: 1) CO2 emissions from the construction industry in China increased rapidly from 576.5 million tons (Mt) in 2004–3,230 Mt in 2012 and then gradually decreased to 1998.51 Mt in 2020; indirect CO2 emissions accounted for more than 90% of the total CO2 emissions after 2008. 2) There is a solid global positive correlation between CO2 emissions from the construction industry in China during most of the time, and the spatial distribution of CO2 emissions shows a northeast-southwest pattern, with the center of gravity gradually shifting from central China to the southwest. 3) Economic output and industrial agglomeration are positive factors for the increase of CO2 emissions from the construction industry; and urbanization level, production efficiency, and energy efficiency are inhibiting factors for the increase of CO2 emissions from the construction industry. But the contribution and trend of each influencing factor differed significantly across time and regions, showing substantial spatial and temporal heterogeneity. Our findings provide a scientific basis for the Chinese government to implement a regional carbon reduction strategy for the construction industry.
1 Introduction
Global warming caused by greenhouse gases is a global environmental problem that has become a significant threat to the survival of humans and other species (Lu et al., 2020). Among the many greenhouse gases, CO2 accounts for about 70% (Li and Chen, 2020)and is the most important anthropogenic greenhouse gas in the environment (Li et al., 2021). To fight global warming, it is necessary to ensure that countries worldwide effectively reduce CO2 emissions (Lu et al., 2020). With rapid urbanization and economic growth, China’s CO2 emissions are enormous and continue to grow, nearly doubling those of the United States and reaching one-third of the world’s emissions (Lu et al., 2016; Ma et al., 2019; Zhang et al., 2022). The Chinese government is taking active measures to control CO2 emissions (Du et al., 2018). Chinese President Xi Jinping pledged at the UN General Assembly and Climate Summit in 2020 that China will increase its autonomous national contribution and introduce more robust policy measures to peak carbon emissions by 2030 and achieve carbon neutrality by 2060 (Mallapaty, 2020; Normile, 2020). Therefore, economic restructuring and low carbon development are one of the country’s most essential tasks at the moment (Chuai et al., 2015).
Previous studies have shown that the construction industry accounts for more than 40% of the world’s energy consumption and 36% of the world’s CO2 emissions (Li et al., 2021). It is an important pillar industry of China’s national economy and a resource-intensive industry (Wang and Feng, 2018). Huge resource and energy consumption generate a large amount of CO2 emissions, accounting for 30% of the national CO2 emissions (Li and Jiang, 2017).This is great challenge for China achieving its goals of carbon peak in 2030 and carbon neutrality in 2060 (Li B. et al., 2020). Today, the contradiction between the development of China’s construction industry and emission reduction is becoming increasingly prominent. Energy consumption and CO2 emissions in the construction industry have become increasingly important issues in China’s sustainable development (Zhang X. and Wang F., 2016). Therefore, researches are desired which analyze the mechanism behind various factors influencing CO2 emissions in the construction industry and provide policy suggestions of regional carbon emission reduction and decarbonization development in the construction industry (Wang and Feng, 2018). Because such research works can not only contribute to the sustainable development of China’s economy but also the successful realization of “carbon peak and carbon neutrality” goals (Ma et al., 2020; Shi et al., 2020).
Many existing studies have investigated the influencing factors of CO2 emissions in the construction industry using methods such as the structural decomposition analysis (SDA) (Shi et al., 2017), logarithmic mean divisia index (LMDI) (Jiang and Li, 2017), etc. However, they do not reflect the spatial and temporal differences of the influencing factors among provinces. The relationship between variables and the structure of the model often change with geographical location. And the spread of CO2 in the atmosphere needs to be considered (Wang et al., 2018).
Therefore, it is necessary to consider the spatial effect of CO2 emissions from the construction industry. In this paper, we first improved the method to simplify LCA, and then innovatively introduced the GTWR model to explore the influence mechanism of different factors on CO2 emissions in the construction industry from two dimensions of time and space, so as to make up for the deficiency of existing research in this aspect. Finally, our analysis results provide a theoretical basis for realizing the low-carbon transformation and development of construction industry in various regions of China and regional carbon emission reduction. To the best of our knowledge, this paper is one of the first studies to analyze the influence mechanism of different factors on CO2 emissions in the construction industry from the perspective of spatial and temporal differentiation.
The rest of this paper is structured as follows: Section 2 provides a review of the relevant literature. Section 3 provides the data sources and research methodology. Section 4 analyses the data and provides key results. Section 5 discusses the results of the study and develops policy recommendations. Section 6 summarizes the research work and proposes future research directions.
2 Literature review
There are two types of CO2 emissions from the construction industry: direct and indirect CO2 emissions (Chen et al., 2017). Direct CO2 emissions are those caused by on-site combustion activities (Onat et al., 2014). Indirect CO2 emissions are CO2 emissions from other related industries induced by the construction industry (Feng and Wang 2015). Indirect CO2 emissions from the construction industry account for a significant proportion of total CO2 emissions. Two main methods for calculating CO2 emissions from the construction industry are the input-output analysis (Hung et al., 2019) and the LCA (Lu et al., 2016). Influenced by Zhang and Liu (2013), the input-output analysis method is valid and commonly used for analyzing indirect CO2 emissions from the construction industry (Chen et al., 2017; Shi et al., 2017). For example, Du et al. (2019b) used an input-output model to investigate the carbon emissions from the construction industry in Chinese provinces in 2006, 2009, 2012, and 2015 and found that the economic development level of most provinces was positively correlated with carbon emissions. However, China publishes a basic or extended input-output table every 2 or 3 years (Qi and Zhang, 2013), making the input-output analysis method unsuitable for in-depth and timely study (Wu et al., 2018). In contrast, the LCA method conducts a more timely and in-depth study of CO2 emissions in the construction industry through the statistical data updated every year. Therefore, the LCA has been widely adopted in recent years. The complete life cycle of a building consists of six stages, namely the manufacturing phase of building materials, the transportation phase of building materials, the construction phase, the operation phase, the demolition phase, the waste disposal phase and the recycling phase (Zhang Z. and Wang B., 2016). Due to incomplete dataset, the simplified LCA method proposed by Feng and Wang (2015) considered CO2 emissions from five construction materials (cement, steel, glass, wood and aluminum) produced by the relevant industries as indirect CO2 emissions. Many researches assessed the carbon emissions of the construction industry using this simplified LCA, including Zhang et al. (2021), Chi et al. (2021), Wang et al. (2022) and Wen et al. (2020). Among them, Chi et al. (2021) pointed out that indirect carbon emissions from the construction industry accounted for about 95% of the total carbon emissions.
Currently, there are two common decomposition analysis approaches to study factors influencing CO2 emissions in the construction industry, namely the index decomposition analysis (IDA) and SDA (Chen et al., 2019b). SDA is mainly used with input-output models, which have been extended to help reveal changes in energy consumption or CO2 emissions in the economy (Chen et al., 2019a). For example, Liu et al. (2022) used SDA method to find that the industrial structure optimization after 2015 has a significant inhibitory effect on CO2 emissions in the construction industry, and the final demand plays an absolutely dominant role in improving CO2 emissions. IDA is mainly used by researchers aiming to understand better the factors influencing energy consumption and CO2 emissions in specific industries, such as construction. IDA can be further divided into arithmetic mean divisor index (AMDI) methods, LMDI and other forms (Lu et al., 2016). It is worth noting that most researchers prefer to use the LMDI to decompose CO2 emissions (Gong and Song, 2015; Li D. et al., 2020). The LMDI calculation process is reversible, with no residuals or zero values in the decomposition (Li D. et al., 2020); and it can be developed more flexibly and requires less data than SDA (Shi et al., 2017). In addition, other studies applied models such as the Kaya model (Qi and Zhang, 2013; Shang et al., 2018; Lai et al., 2019), the generalized dividing index method (GDIM) (Li B. et al., 2020), the SDA and the sensitivity analysis (SA) combined model (Chen et al., 2019a), to decompose the factors influencing CO2 emission changes in China’s construction industry. The extended STIRPAT model further takes into account the impact of technological progress. The existing studies have explored the factors influencing CO2 emissions in the construction industry by constructing extended STIRPAT models and combining them with fixed effects ordinary least squares (OLS) (Zhang et al., 2021), ridge regression (Cong et al., 2015; Zou et al., 2016; Peng, 2019), panel quantile regression (Wang et al., 2020a; Li and Chen, 2020). In addition, some scholars have carried out the structural path of carbon dioxide emissions in the construction industry to discover the impact of different structural paths on carbon dioxide emissions in the construction industry (Wang et al., 2020b; Chen et al., 2022).
Based on the above literature review, we can find that the existing research assumes that different regions are independent of each other, focusing on analyzing the influencing factors of CO2 emissions in the construction industry from a global perspective, and ignoring the significant spatial interaction effects. Although the spatial Durbin model (SDM) (Lu et al., 2020; Wen et al., 2020) has been used to take the spatial weight matrix into account, no research has studied the different factors influencing the CO2 emissions from the construction industry in various regions from the perspective of temporal and spatial differentiation (Shen et al., 2020). Therefore, it is necessary for us to explore the influence of different factors from the perspective of temporal and spatial differentiation. The main contributions of this paper are as follows: existing research ignored the fact that the CO2 emission coefficients of power and heat in different provinces of China are different, and improved the simplified LCA in consideration of these two kinds of energy, so as to make the CO2 emission estimation of the construction industry more accurate. Then, this paper reveals the spatial and temporal heterogeneity of the impact of different factors on CO2 emissions from the construction industry. Comparing the traditional research methods of influencing factors reflects the space-time characteristics of the influencing mechanism. The research results provide a reference value for the government to formulate carbon emission reduction policies for the regional construction industry.
3 Materials and methods
In order to study CO2 emissions from the construction industry in a more timely and in-depth manner, this paper adopts a simplified LCA method to estimate CO2 emissions from the construction industry in China; then the dynamic evolution characteristics of spatial pattern in CO2 emissions at the provincial level are analyzed using a combination of global Moran’s
3.1 Simplified life-cycle assessment
In this paper, we improve the simplified LCA approach proposed by Feng and Wang, (2015) to divide CO2 emissions from the construction industry into two parts: direct CO2 emissions and indirect CO2 emissions, taking into full consideration the variability of thermal and electric power CO2 emissions coefficients across regions in China. Direct CO2 emissions are calculated by multiplying 13 primary energy consumptions such as raw coal, briquette, coke, gasoline, diesel, kerosene, fuel oil, lubricating oil, liquefied petroleum gas, and natural gas by the corresponding CO2 emission coefficient, plus the secondary energy consumption is calculated by multiplying the related CO2 emission efficient. Indirect CO2 emissions are calculated by multiplying the consumption of different building materials (cement, steel, glass, wood and aluminum) by the corresponding CO2 emission and recovery factors. Through the above methods, we established Eqs 1–3 to calculate the total CO2 emissions from the construction industry:
Where
3.2 Global Moran’s
We use global Moran’s
Where
For Moran’s
where
3.3 Standard deviation ellipse
In order to investigate the individual characteristics of CO2 emissions from the construction industry, this paper uses the standard deviation ellipse to study the evolution characteristics of the spatial differences in CO2 emissions. Standard deviation ellipse is one of the critical spatial econometric analysis methods used to measure regional economic factors’ spatial differences and analyze economic factors’ spatial distribution characteristics (Liu and Chen, 2016). The main elements include the center of gravity (center point), azimuth, major semi-axis, minor semi-axis, etc. Among them, the center of gravity represents the relative position of the spatial distribution of regional economic factors, and the calculation formula is shown in Eq. 6:
The azimuth angle θ is the angle formed by the clockwise rotation from the north direction to the long axis of the ellipse, which represents the main trend direction of the spatial distribution of economic factors. The calculation formula is shown in Eq. 7:
The long semi-axis reflects the degree of dispersion of economic factors in the main trend direction; the short semi-axis reflects the degree of dispersion of economic factors in the secondary direction. The calculation formula is shown in Eq. 8:
Where
3.4 STIRPAT model
Thomas Dietz (1994) proposed the STIRPAT model based on the IPAT model incorporating the environmental impact of socioeconomic activities (He et al., 2017); the model is nonlinear and can estimate elastic coefficients (Zhang et al., 2021). Therefore, the STIRPAT model provides a broad framework for studying the environmental impact of various factors. The standard STIRPAT model is:
where
In order to fully and accurately explore the main influencing factors of CO2 emissions from the construction industry, we added several other important factors to the model (Du et al., 2017; Li B. et al., 2020; Wang et al., 2020a; Lu et al., 2020; Zhang et al., 2021) and expressed all variables in the logarithmic form to eliminate possible heteroskedasticity. The extended STIRPAT model is as follows:
where the CO2 emissions from the construction industry are the dependent variable. We use year-end population (POP) to denote P. Per capita GDP (PGDP) and economic output (ECO) denote A. Energy efficiency (ENE) denotes T. Extending the STIRPAT model on this basis, we select urbanization level (URB), labor productivity (LP) and industrial agglomeration (IA) as other important factors affecting CO2 emissions from the construction industry. The detailed definitions of these variables are shown in Table 1.
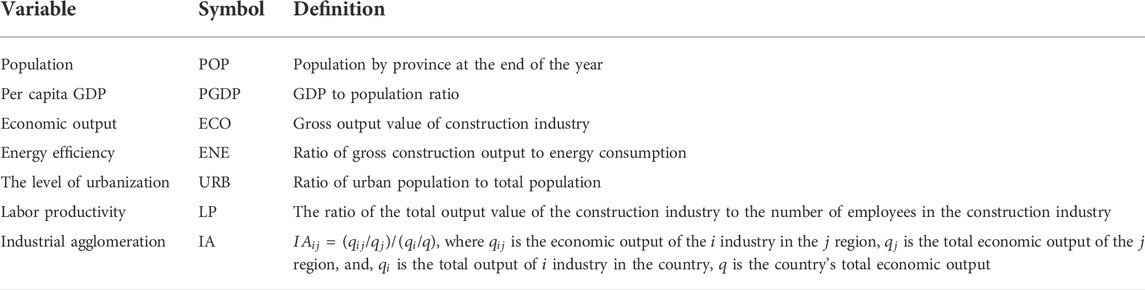
TABLE 1. Statistical description.
3.5 GTWR model
Although the geographically weighted regression (GWR) model considers spatial non-stationarity, GWR ignores temporal non-stationarity. In contrast, GTWR considers both spatial and temporal non-stationarity (Yuan et al., 2020). Therefore, we use this model to explore the temporal and spatial heterogeneity of the influence mechanism of different factors on the CO2 emissions from China’s construction industry. The core of GTWR is the selection of the spatial weight function. The spatial correlation of the data is realized through constructing the spatial weight matrix. In this paper, we use the Gaussian function method proposed by Huang et al. (2010) to combine the information from spatial and temporal dimensions.
Before GTWR builds the model, we use the multi-collinearity test to check the collinearity of seven variables, including population, urbanization level, per capita GDP, economic output, energy efficiency, labor productivity, and industrial agglomeration. Through the variance inflation factor (VIF) test (as shown in Table 2), it is found that there is a serious collinearity between economic output, population, and GDP per capita. Economic output is closely related to CO2 emissions (Du et al., 2019b; Lai et al., 2019). However, the spatio-temporal relationship between economic output and CO2 emission in China’s construction industry is far from clear. Understanding this relationship provides a valuable reference for comparing the ‘quality’ of economic growth in terms of carbon emissions with international counterparts (Wu et al., 2018). Thus, population and GDP per capita are excluded. We combined the STIRPAT model and the VIF test to establish the Eq. 11 of the GTWR model to study the influence of various factors on CO2 emissions from the construction industry from the perspective of temporal and spatial differentiation.
Where
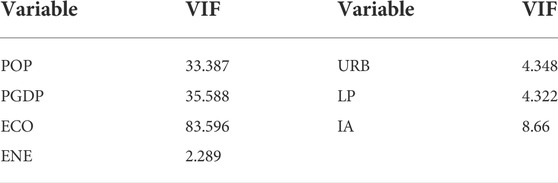
TABLE 2. VIF test.
3.6 Data sources
This paper takes 2004–2020 as the research period and takes the construction industry of 30 provinces in China (due to the lack of energy data, Tibet, Hong Kong, Macao and Taiwan are not included) as the research object. The above-required data are mainly obtained from the 2004–2020 China Statistical Yearbook, the China Construction Statistical Yearbook, the China Energy Statistical Yearbook and IPCC Guidelines for National Greenhouse Gas Inventories. The CO2 emission coefficients of electricity and heat are derived from the studies of Fan and Zhou (2019), and Li and Zhang (2016), respectively. The CO2 emission coefficients of building materials are derived from the studies of Feng and Wang (2015).
4 Results
4.1 Estimation of CO2 emission from construction industry
Figure 1 shows the total CO2 emissions from China’s construction industry from 2004 to 2020. From Figure 1, we can see that CO2 emissions increased from 576.5 Mt to 1998.51 Mt. Between 2004 and 2009, the national CO2 emissions from the construction industry showed a slow increase with an average annual growth rate of 13.75%. Between 2010 and 2012, national CO2 emissions from the construction industry increased rapidly, with an average yearly growth rate of 51.95%. Between 2013 and 2020, the trend shifted to a steady decline, with an average annual growth rate of -1.17%, in response to the economic recession triggered by the global financial crisis in 2008. The Chinese government launched the 4 trillion RMB stimulus package to address the challenges of this crisis, which invested mainly in infrastructure development (Naughton, 2009). This led to massive consumption of building materials in Jilin and Hebei, resulting in a rapid increase in CO2 emissions from the construction industry from 2010 to 2012. After the 12th Five-Year Plan, China has increased efforts to restructure its industries, placing greater emphasis on energy conservation and emission reduction and curbing high energy consumption. By controlling the total amount of pollutants emitted in the production of building materials such as cement, steel and glass and the regional spatial layout of the building materials industry, indirect CO2 emissions have been reduced (Chi et al., 2021). As a result, the total amount of CO2 emissions from the construction industry has shown a decreasing trend. During the survey period, indirect CO2 emissions accounted for about 90% of the total CO2 emissions of the construction industry. In contrast, the proportion of direct CO2 emissions is very small, ranging from 4.02% to 12.04%. During the period from 2004 to 2020, the direct CO2 emissions of China’s construction industry did not change much; The trend of indirect CO2 emissions is basically consistent with that of the total CO2 emissions of the construction industry.
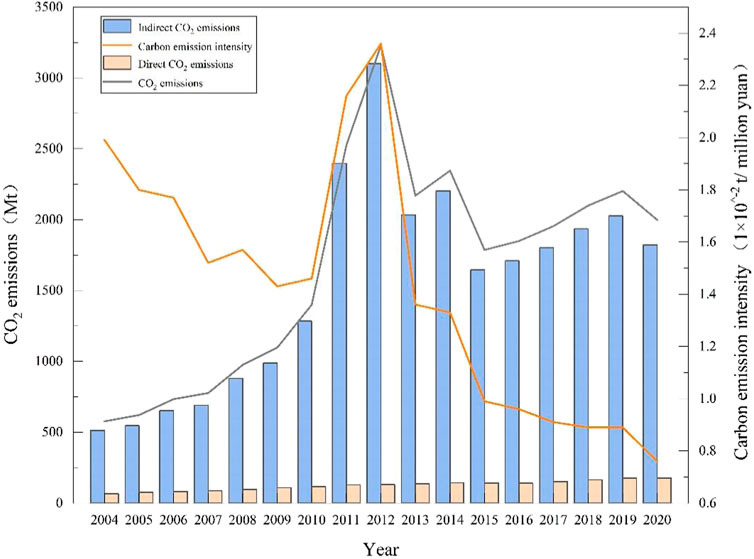
FIGURE 1. Estimation of CO2 emissions from construction industry in China.
Figure 1 also shows the carbon emission intensity of China’s construction industry (the ratio of CO2 emissions to GDP). As can be observed, it declined from 1.988
4.2 Spatial autocorrelation test
This paper uses GeoDa software to calculate the global Moran’s

TABLE 3. Global Moran’s
The global Moran’s
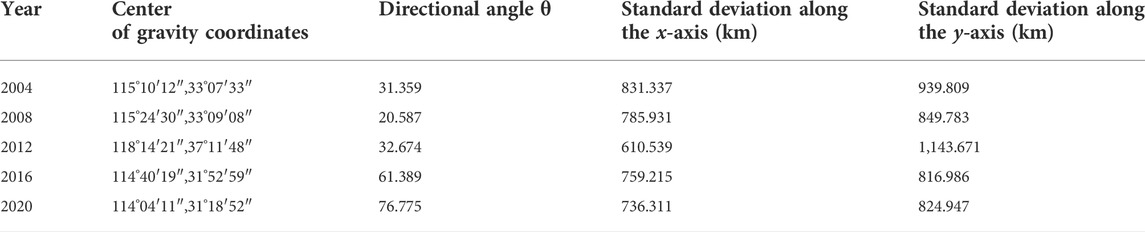
TABLE 4. Statistical description of standard deviation results.
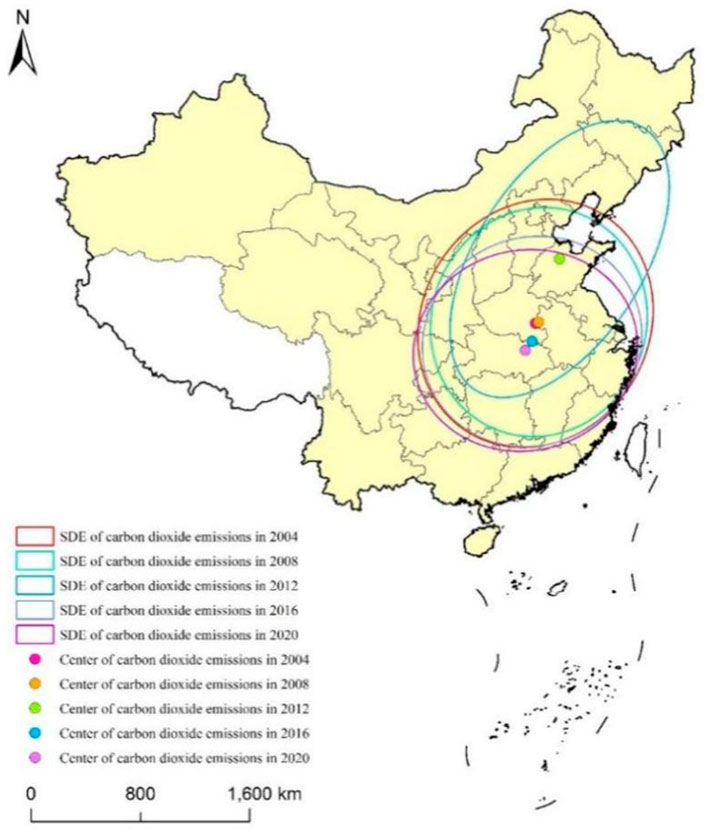
FIGURE 2. Elliptic evolution result of standard deviation.
In the direction of the long axis of the standard deviation ellipse, the standard deviation of the Y-axis shortens from 939.809 km in 2004 to 824.947 km in 2020, indicating a spatial polarization of CO2 emissions in the northeast-southwest direction. Specifically, the standard deviation on the Y-axis shortens from 939.809 km in 2004 to 849.783 km in 2008; the reason for this change is the weak economic base and slow economic growth in the southwest and northeast regions. This makes the increment of CO2 emissions from the construction industry decrease. The standard deviation on the Y-axis expands from 849.783 to 960.939 km from 2008 to 2014, indicating that the spatial distribution of CO2 emissions tends to diverge in the Y-axis direction, a trend that may be explained by the fact that in response to the economic crisis, the state increased its investment in infrastructure, and the northeast and southwest regions promoted the rapid development of the construction industry with the help of national policies, resulting in a surge in CO2 emissions from the construction industry in the two regions. From 2014 to 2018, the standard deviation of the Y-axis shortened from 960.939 km to 801.559 km, and the spatial polarization of construction CO2 emissions in the northeast-southwest direction intensifies; this results from the technological spillover effect of the construction industry in the eastern region, pulling the emission reduction efforts in the northeast and southwest regions. In period 2018–2020, it expands from 801.559 km to 824.947 km, indicating that the spatial distribution of the construction CO2 emissions tends to be dispersed again. In the direction of the short axis of the standard deviation ellipse, the standard deviation along the X-axis continues to shorten from 831.337 km in 2004 to 736.31 km in 2020, indicating the spatial polarization of CO2 emissions from the construction industry in China is increasing in the northeast-southwest direction.
4.3 GTWR test
4.3.1 Model fitting
The above analysis reveals the spatial autocorrelation and significant spatial variation of CO2 emissions in China’s construction industry through global Moran’s I and standard deviation ellipses, showing that CO2 emissions in China’s construction industry have spatial autocorrelation and significant spatial differences. To further reveal the formation mechanism of the dynamic evolution characteristics of spatial differences in CO2 emissions in China’s construction industry, this paper uses GTWR to conduct a comparative analysis of five factors, namely urbanization, economic output, energy efficiency, industrial agglomeration, and labor productivity.
To verify the applicability and accuracy of the GTWR model, calculations were performed using 17 years of spatial panel data from 2004 to 2020, and the GTWR results were compared with those of OLS, GWR and time weighted regression (TWR). The model-related parameters are shown in Table 5. R2 and adjusted R2 (Adj. R2) reflect the degree of model fit; the residual sum of squares (RSS) reflects the model’s accuracy. The AICc value can be used as another important criterion to assess the model’s merit, with smaller values indicating higher accuracy (Ma et al., 2021). As can be seen from the table, the GTWR model has a maximum fit of 0.939. The AICc values between models are much greater than 3, with the minimum value being 387.1 for GTWR, indicating a significant difference in the performance among various models. The GTWR model has higher accuracy. Compared with other models, the regression coefficients of the GTWR model are non-stationary in time and space; therefore, it can better explain the spatial and temporal distribution of factors influencing CO2 emissions in the construction industry Table 5.
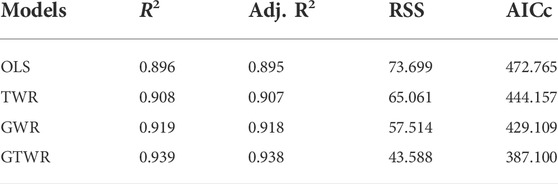
TABLE 5. Comparison of model test results.
4.3.2 Time evolution of influence degree
Figure 3 shows the time evolution characteristics of the five influencing factors of CO2 emissions from the construction industry in China. We can see that economic output is the dominant factor in the increase of CO2 emissions each year. The development of the economy has driven the development of the industry; the real estate boom continues to heat up. The increasing standard of living has increased the demand for infrastructure construction, housing construction and commercial and industrial land construction. With the continuous expansion of construction scale, the energy consumption of the construction industry increases, and the carbon emissions also increases accordingly. From 2004 to 2012, the contribution of economic output to the construction industry’s CO2 emissions increased, with the regression coefficient reaching its maximum value in 2012. The contribution of economic output to the construction industry’s CO2 emissions gradually weakened after 2012, and the regression coefficient reached its lowest level in 2020. With the improvement of the economic development level, the formulation of the low-carbon economy strategy and the introduction of carbon emission reduction targets, the development of a low-carbon economy strategy and the carbon emission reduction goal has made it possible to control the CO2 emissions. Industrial agglomeration has contributed to the increase of CO2 emissions in the construction industry in all years. On the one hand, industrial agglomeration increases economic activity and leads to more CO2 emissions; on the other hand, industrial agglomeration may lead to specialization and technological innovation in the construction industry, resulting in a reduction of CO2 emissions. Our results seem to imply that the ‘growth effect’ is greater than the ‘reduction effect’, which leads to an increase in construction CO2 emissions (Li et al., 2021).
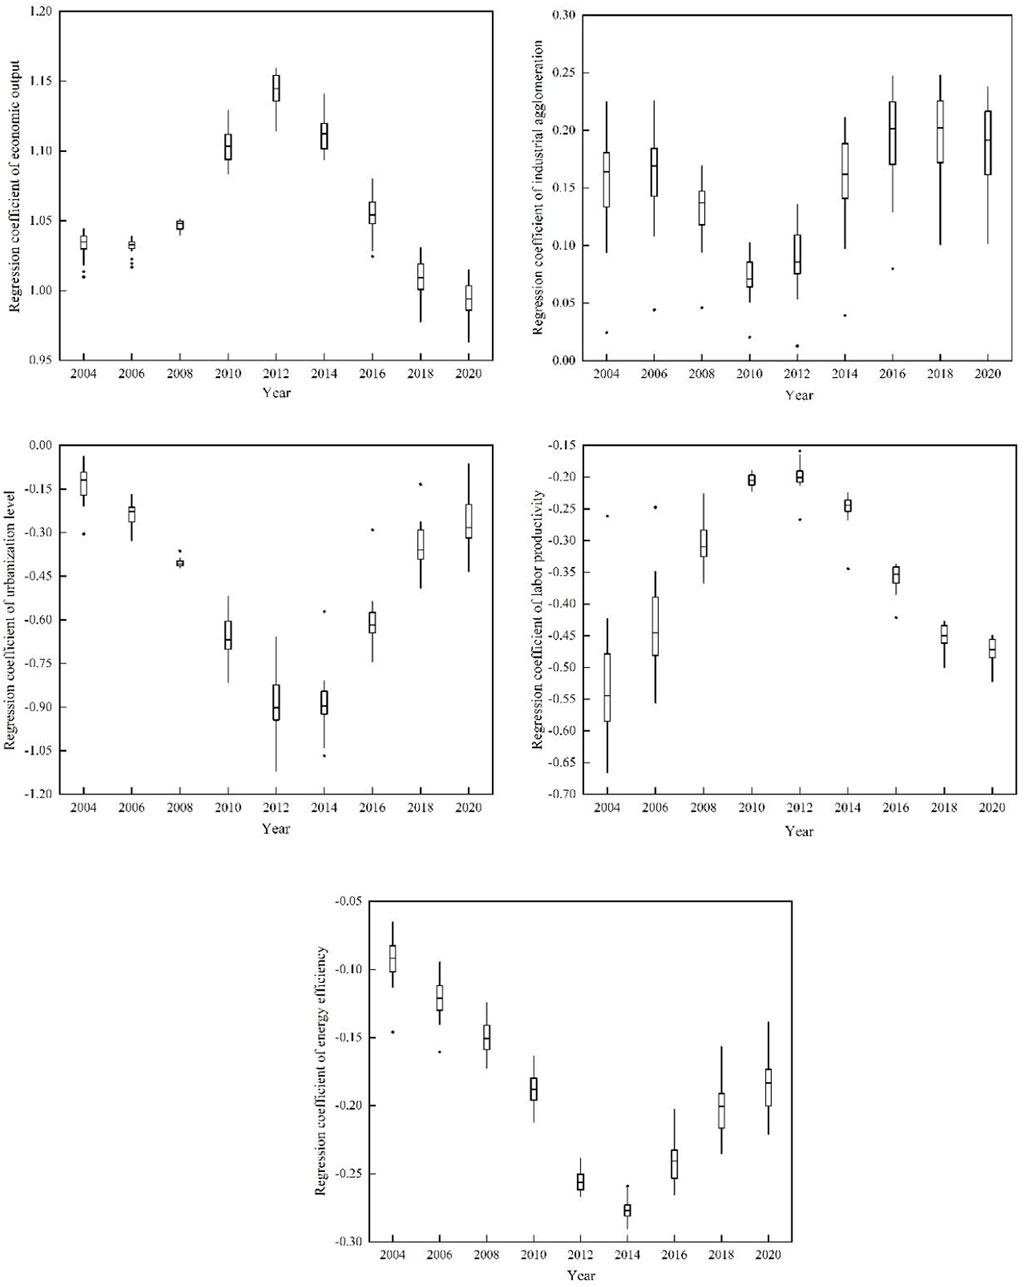
FIGURE 3. Time series trend of GTWR regression coefficients.
The level of urbanization is the main inhibiting factor for the increase in CO2 emissions from the construction industry. Urbanization has been shown to promote the concentration of production factors, accelerate technological development and promote cleaner production, thereby reducing CO2 (Zhang et al., 2016; Wang and Zhao, 2018). The inhibition effect of urbanization level has been increasing from 2004 to 2012, with the regression coefficient reaching a maximum in 2012 and decreasing thereafter. Labor productivity is the second most important inhibiting factor for the increase of CO2 emissions in the construction industry. The inhibition effect of labor productivity, which reflects the level of production technology in the construction industry, has shown a weakening and then increasing impact over time. In the years following the financial crisis, China increased investment in infrastructure construction, leading to relatively extensive operation and management which decreases the labor productivity and an increases the CO2 emissions from the construction industry. It is worth noting that in some years, labor productivity had a stronger role in curbing construction CO2 emissions than urbanization. Energy efficiency had a inhibition effect on the increase in construction CO2 emissions in all years, but energy efficiency had little influence on reducing national construction CO2 emissions (Wang et al., 2018). Energy efficiency is a measure of energy-efficient technologies in the construction industry, and the fragile inhibition effect of energy efficiency in 2004 suggests that the construction industry employs few energy-efficiency technologies in the early years. This inhibition effect slowly increases as the level of energy-efficient technologies develop in the construction industry Figures 4, 5, 6, 7, 8.
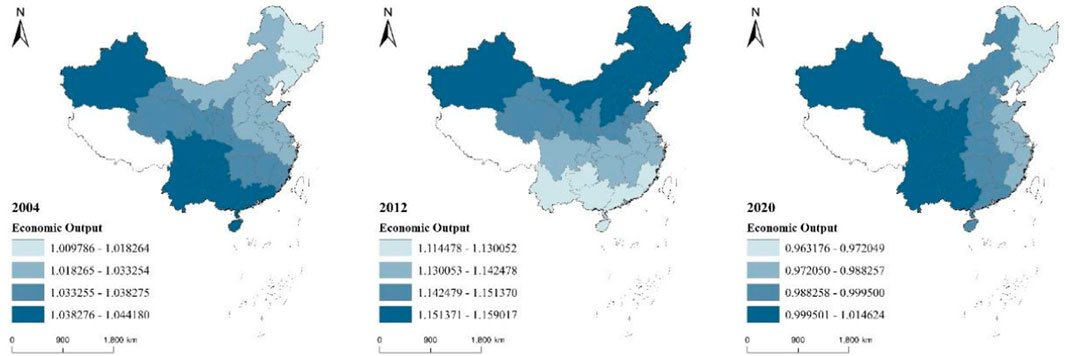
FIGURE 4. Regression coefficients for economic output.
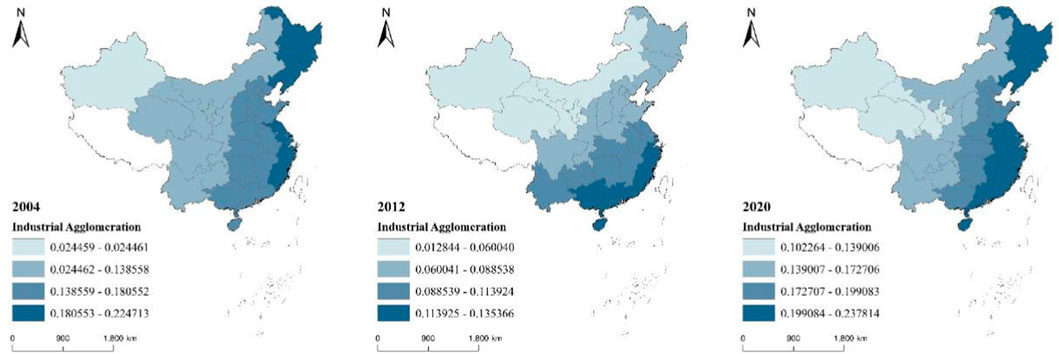
FIGURE 5. Regression coefficients for industrial agglomeration.
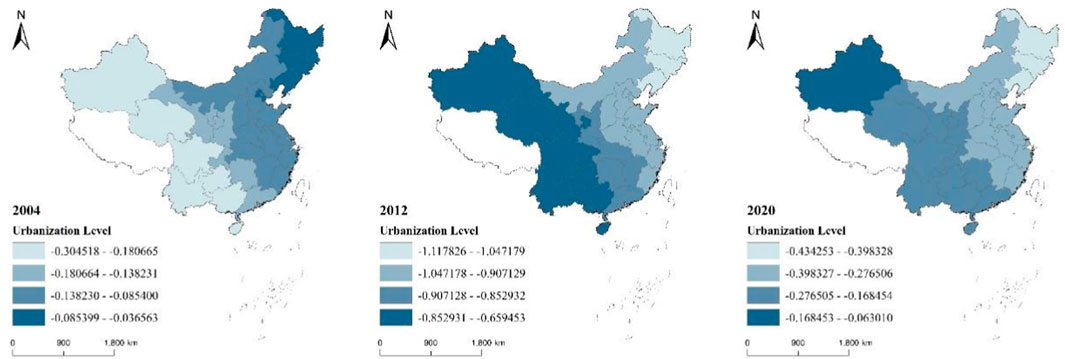
FIGURE 6. Regression coefficients for urbanization levels.
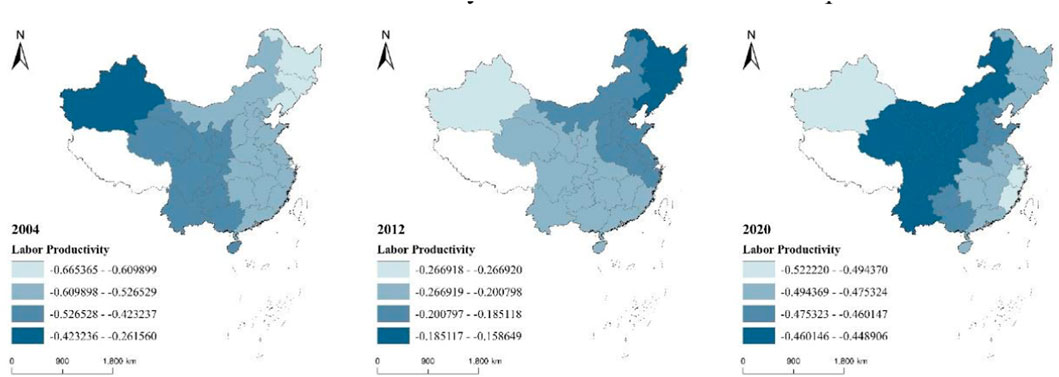
FIGURE 7. Regression coefficients for labor productivity.
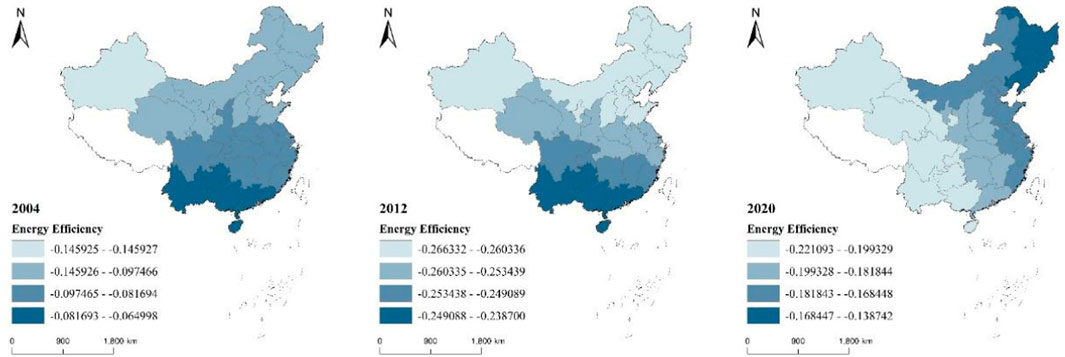
FIGURE 8. Regression coefficients for energy efficiency.
4.3.3 Spatial heterogeneity of influence degree
The GTWR model can calculate regression coefficients for different temporal and spatial influences and visualize them in ArcGIS 10.3. This aids to explore the various factors influencing carbon emissions in a local area. Results are visualized for 2004, 2012 and 2020 in this paper.
As shown in Figure 4, economic output yields higher influence on CO2 emissions in the western provinces such as Xinjiang, Yunnan, Sichuan and Guizhou, mainly because these regions are relatively underdeveloped and lack of advanced technologies; they need to consume more energy and produce large amounts of CO2 in exchange for the development of the construction industry. The provinces with higher regression coefficients of economic output in 2004 are located in the western regions, and in 2012 the provinces with higher regression coefficients shifted to the northeast and north central. The government has increased infrastructure investment to rapidly revive China’s economy, leading to a significant construction boom in traditional industrial bases such as Heilongjiang, Jilin and Hebei, resulting in a sharp increase in CO2 emissions from the construction industry. By 2020, the values with more significant regression coefficients for economic output gradually change to the western regions, led by Xinjiang, Yunnan, Sichuan and Guizhou.
As shown in Figure 5, from 2004 to 2020, the regions where industrial agglomeration has a more significant influence on CO2 emissions remain unchanged and consistently distributed in China’s eastern coastal and northeastern regions. By 2020, the provinces with larger coefficients are mainly located in Jiangsu, Zhejiang and Shanghai, Fujian, Guangdong and the three northeastern provinces, while the provinces with smaller coefficients are primarily located in the western regions, such as Xinjiang, Qinghai, Gansu, and Ningxia. This indicates that the construction industry in the eastern coastal and northeastern regions of China is more prone to agglomeration compared to the central and western regions; and this industry agglomeration is more likely to promote an increase in economic activities and energy demand in the construction industry, thus leading to the accelerated growth of CO2 emissions.
As shown in Figure 6, the level of urbanization inhibits the increase in CO2 emissions from the construction industry in each province. In 2004, the inhibition effect was more significant in most of the western provinces. The inhibition effect of urbanization increased over time, and provinces with strong inhibition effect shifted from the west to the eastern coastal and north-eastern regions. By 2020, provinces with strong inhibition effect are distributed among the east, central and north-eastern China, and Xinjiang yielded the smallest absolute regression coefficients. This fully illustrates that the inhibition effect is more significant in regions with a high level of urbanization than in the urbanizing and non-urbanized regions (Zhang et al., 2021). The regression coefficients are the smallest in Xinjiang.
As shown in Figure 7, from 2004 to 2020, areas where labor productivity has less influence on CO2 emissions gradually shifted to central and western China. In 2020, provinces with large absolute values of coefficients were mainly distributed in the eastern coastal areas, including Shanghai, Zhejiang, Fujian and other regions. In contrast, provinces with small absolute values of coefficients are concentrated in the central and western regions. The influence of labor productivity on CO2 emissions in eastern provinces is greater than that in central and western provinces. In recent years, the western region has paid attention to the introduction of excellent talents, promoting the increase in well-educated workforce. As a result, the labor productivity of many western provinces has exceeds that of some eastern provinces. This also implies that the improvement in production efficiency will gradually weaken the role of emission reductions in the construction industry in the central and western provinces.
As shown in Figure 8, energy efficiency suppresses CO2 emissions from the construction industry in each province, and the influence of technological progress on CO2 emissions is relatively weak and unstable compared to the other variables. With its more significant inhibition effect shifting from the north of Qinling-Huaihe line to western China. From 2020, the provinces where energy efficiency have considerable influence on CO2 emissions are Xinjiang, Gansu, Qinghai, Sichuan and Yunnan, which are located in central and western China. The main reason is that carbon emissions in less developed regions are vulnerable to technological advances (Du et al., 2017). The progress of energy efficiency technologies can contribute well to carbon emission reduction, while developed regions with higher technology levels and complex technological innovation are prone to encounter technical bottlenecks, making it challenging to improve energy efficiency further. This weakens its potential for CO2 emission reduction in the construction industry.
5 Discussion
5.1 Implications for theory
This paper provides a new perspective on the spatial and temporal analysis of CO2 emissions from the construction industry in China. Existing studies mainly use SDA (Shi et al., 2017), IDA (Gong and Song, 2015) or STIRPAT combined with panel regression (Zhang et al., 2021), which ignores the spatiotemporal heterogeneity in the degree of influence of different factors. This study investigates both the spatial and temporal non-stationarity of the influencing factors through GTWR. In order to make a more timely and in-depth study, this paper improves the simplified LCA method considering the regional differences of CO2 emission coefficients of electricity and heat, and estimates the CO2 emission of construction industry in China. Results show that indirect CO2 emissions account for about 90% of the total CO2 emissions from the construction industry in China, which is consistent to the results in Du et al. (2018), Feng and Wang (2015). Although we take into account regional differences in CO2 emission efficient from electricity and heat generation, they do not have a significant influence on the final results. Our work found a 57.87% reduction in the carbon intensity of the construction industry through the calculation of 2020 data. In this paper, we found a 57.87% decrease in carbon emission intensity in 2020, which is similar to the result of Du et al. (2019a) using system dynamics (SD) model to predict the optimal portfolio reduction. This indicates that the carbon emission reduction in China’s construction industry is moving towards the optimal direction in recent years. The paper also utilizes global Moran’s
5.2 Implications for practice
Based on the above results and discussions, we can conclude that CO2 emissions from the construction industry have obvious spatial effects, so this paper formulates emission reduction policies based on the spatial and temporal characteristics of the factors influencing CO2 emissions in each region.
Economic output is the most crucial reason for the increase in CO2 emissions from the construction industry in each region. However, the current extensive development model of the construction industry still exists; therefore, the government should set reasonable carbon emission reduction targets for each region according to local conditions, and synergistic emission reduction plans can be developed between neighboring provinces. First of all, the economically developed eastern provinces have a large volume of CO2 emissions from the construction industry and should take on more CO2 reduction tasks. At the same time, the central and western regions should actively promote the transformation to a low-carbon economy. Second, a fair national carbon trading market and the legal system related to green buildings should be established and improved. The government should vigorously promote the low-carbon, green and high-quality development of the construction industry, and find a path for the coordinated development between the economic output of the construction industry and CO2 emissions.
The government should promote the construction of a new urbanization model with a focus on green and high-quality development, and different regions should adhere to different urbanization strategies. Eastern regions should accelerate the coordination of urbanization development levels in central and western regions and jointly promote the green transformation of regional urbanization; central and western regions should continue to accelerate the urbanization of central cities (Li L. et al., 2020) and encourage the transfer of large and medium-sized cities to smaller cities in some regions, to form a mutually beneficial and win-win high-quality development model in the region and jointly curb the generation of CO2 in the construction industry.
The emission reduction effect of energy efficiency is relatively weak and unstable. To achieve the emission reduction target of CO2 emissions from the construction industry, it is necessary to improve energy efficiency while adjusting the industrial agglomeration pattern. Firstly, technological exchanges and cooperation across regions should be strengthened, promoting the technological achievements relating to energy efficiency and emission reduction from the east regions to the central and western regions. The eastern regions should increase investment in science and technology to achieve more technical breakthroughs on energy efficiency and emission reduction technologies while actively introducing advanced technologies from abroad. Secondly, the government should promote the active development of clean energy sources such as nuclear power, wind power, solar energy, tidal energy and green building materials such as eco-cement, fiber-reinforced composite materials and new green wall materials by relying on the favorable resources of each region.
Increased labor productivity plays an essential role in achieving carbon emission reduction targets. The government should raise environmental awareness among employees of construction companies at all levels, continue to strengthen policies for the introduction of construction talent in central and western regions, systematically train highly educated personnel in skill levels, and promote highly educated personnel to work on the front line as soon as possible; eastern regions should improve the overall quality of their construction teams to prevent the emergence of a general ageing construction workforce, further enhance labor productivity in the construction industry, and promote regional carbon emission reduction.
6 Conclusion and limitations
6.1 Conclusion
This paper studies the spatial and temporal characteristics of CO2 emissions from the construction industry in China at the provincial level, and investigates the mechanisms of different factors influencing CO2 emissions from the perspective of spatial and temporal divergence based on the GTWR model. The findings of the study are as follows.
CO2 emissions from the construction industry in China showed a trend of first increasing and then decreasing. It grew rapidly from 576.5 Mt in 2004–3,230 Mt in 2012, and then gradually decreased to 1998.51 Mt in 2020. After 2008, indirect CO2 emissions account for more than 90% of total CO2 emissions. Compared to 2005, the carbon intensity of the construction industry decreased by 57.87% in 2020. In terms of the spatial pattern, the empirical results show that there is a strong global positive correlation of CO2 emissions from the construction industry in China during most of the concerned period. In terms of the standard deviation ellipse, the spatial distribution of CO2 emissions from the construction industry in China shows a northeast-southwest pattern. The combination of the standard deviation of the long and short axes leads to a spatial polarization of CO2 emissions in the northeast-southwest direction, and the center of gravity gradually shifts from central China to the southwest.
Due to the spatial and temporal heterogeneity of the different factors influencing provincial CO2 emissions from the construction industry, the estimates from the GTWR analysis are more accurate than the classical econometric models. The regression results show that significant non-uniform linkage localization and spatial heterogeneity exist in the influence of various factors on CO2 emissions from the construction industry. Economic output is the dominant factor, and its degree of influence strengthens before weakening in time and it increases spatially from east to west. Industrial agglomeration is the second most important factor, and its degree of influence weakens before strengthening in time and it decreases spatially from east to west. The level of urbanization is the most important inhibiting factor in the increase of CO2 emissions from the construction industry, and its degree of influence strengthens before weakening in time and it decreases spatially from east to west. Production efficiency is the second most important inhibitor, with its influence decreasing in time and then increasing in space from southeast to northwest. Energy efficiency is the least essential inhibitor with its influence increasing in time and decreasing in space from northeast to southwest.
6.2 Limitations
Given the above studies, there are still some limitations in this paper. Firstly, we have not considered how the CO2 emission coefficients for each energy source change with technological advances. Secondly, due to data limitations, this paper has adopted a simplified LCA model and lacks an assessment of the whole life cycle of the construction industry at stage 6. Thirdly, this paper has not quantified the differences that exist in CO2 emissions from the construction industry. Future research can be improved as follows: firstly, the scope of activities in the six stages of the construction industry can be delineated in detail, and CO2 emissions can be accurately assessed taking into coefficient the changes in the emission factors of each energy source; then the Thiel index and Gini coefficient can be used to quantify the differences in CO2 emissions in the construction industry in each region, and on the basis of the clarification of regional differences, a more accurate assessment of CO2 emissions in the construction industry can be made in order to achieve the goal of “carbon peaking and carbon neutrality” as soon as possible. On the basis of clear regional differences, a more comprehensive regional carbon reduction policy for the construction industry will be formulated in order to achieve the goal of carbon peaking and carbon neutral” as soon as possible.
Data availability statement
Publicly available datasets were analyzed in this study. This data can be found here: http://www.stats.gov.cn/.
Author contributions
The experiments and paper writing for this study were done by TL, HG provided the theoretical support. JY collected the data needed for the study.
Funding
This study was supported by a grant from the National Natural Science Foundation of China (Grant No. 42177336).
Conflict of interest
The authors declare that the research was conducted in the absence of any commercial or financial relationships that could be construed as a potential conflict of interest.
Publisher’s note
All claims expressed in this article are solely those of the authors and do not necessarily represent those of their affiliated organizations, or those of the publisher, the editors and the reviewers. Any product that may be evaluated in this article, or claim that may be made by its manufacturer, is not guaranteed or endorsed by the publisher.
Abbreviations
AMDI, arithmetic mean divisor index; Co2, carbon dioxide; GDIM, generalized dividing index method; GTWR, geographically and temporally weighted regression; GWR, geographically weighted regression; IDA, index decomposition analysis; OLS, ordinary least squares; LCA, life cycle assessment; LMDI, logarithmic mean divisia index; RSS, residual sum of squares; SDA, structural decomposition analysis; SA, sensitivity analysis; VIF, variance inflation factor; SD, system dynamics; SDM, spatial Durbin model; TWR, time weighted regression.
References
Naughton, B. (2009). Understanding the Chinese stimulus package, 1–12. China Leadership Monitor. Available at: https://www.renrendoc.com/
Chen, J., Shen, L., Shi, Q., Hong, J., and Ochoa, J. J. (2019a). The effect of production structure on the total CO2 emissions intensity in the Chinese construction industry. J. Clean. Prod. 213, 1087–1095. doi:10.1016/j.jclepro.2018.12.203
Chen, J., Shen, L., Song, X., Shi, Q., and Li, S. (2017). An empirical study on the CO2 emissions in the Chinese construction industry. J. Clean. Prod. 168, 645–654. doi:10.1016/j.jclepro.2017.09.072
Chen, J., Shi, Q., Shen, L., Huang, Y., and Wu, Y. (2019b). What makes the difference in construction carbon emissions between China and USA? Sustain. Cities Soc. 44, 604–613. doi:10.1016/j.scs.2018.10.017
Chen, J., Shi, Q., and Zhang, W. (2022). Structural path and sensitivity analysis of the CO2 emissions in the construction industry. Environ. Impact Assess. Rev. 92, 106679. doi:10.1016/j.eiar.2021.106679
Chi, Y., Liu, Z., Wang, X., Zhang, Y., and Wei, F. (2021). Provincial CO2 emission measurement and analysis of the construction industry under China’s carbon neutrality target. Sustain. Switz. 13, 1876–1915. doi:10.3390/su13041876
Chuai, X., Huang, X., Lu, Q., Zhang, M., Zhao, R., and Lu, J. (2015). Spatiotemporal changes of built-up land expansion and carbon emissions caused by the Chinese construction industry. Environ. Sci. Technol. 49, 13021–13030. doi:10.1021/acs.est.5b01732
Cong, X., Zhao, M., and Li, L. (2015). Analysis of carbon dioxide emissions of buildings in different regions of China based on STIRPAT model. Procedia Eng. 121, 645–652. doi:10.1016/j.proeng.2015.08.1057
Du, Q., Lu, X., Li, Y., Wu, M., Bai, L., and Yu, M. (2018). Carbon emissions in China’s construction industry: Calculations, factors and regions. Int. J. Environ. Res. Public Health 15, 1220. doi:10.3390/ijerph15061220
Du, Q., Shao, L., Zhou, J., Huang, N., Bao, T., and Hao, C. (2019a). Dynamics and scenarios of carbon emissions in China’s construction industry. Sustain. Cities Soc. 48, 101556. doi:10.1016/j.scs.2019.101556
Du, Q., Wu, M., Wang, N., and Bai, L. (2017). Spatiotemporal characteristics and influencing factors of China’s construction industry carbon intensity. Pol. J. Environ. Stud. 26, 2507–2521. doi:10.15244/pjoes/70894
Du, Q., Zhou, J., Pan, T., Sun, Q., and Wu, M. (2019b). Relationship of carbon emissions and economic growth in China’s construction industry. J. Clean. Prod. 220, 99–109. doi:10.1016/j.jclepro.2019.02.123
Fan, J., and Zhou, L. (2019). Spatiotemporal distribution and provincial contribution decomposition of carbon emissions for the construction industry in China. Resour. Sci. 41, 897–907. doi:10.18402/resci.2019.05.07
Feng, B., and Wang, X. (2015). Research on Carbon Decoupling Effect and Influence Factors of Provincial Construction Industry in China. China Population Resources and Environment, 28. doi:10.3969/j.issn.1002-2104.2015.04.004
Gong, Y., and Song, D. (2015). Life cycle building carbon emissions assessment and driving factors decomposition analysis based on LMDI-A case study of Wuhan city in China. Sustain. Switz. 7, 16670–16686. doi:10.3390/su71215838
He, Z., Xu, S., Shen, W., Long, R., and Chen, H. (2017). Impact of urbanization on energy related CO2 emission at different development levels: Regional difference in China based on panel estimation. J. Clean. Prod. 140, 1719–1730. doi:10.1016/j.jclepro.2016.08.155
Hu, Y., and Chu, D. (2015). Disconnect analysis between CO2 emission output value and energy consumption of China construction. China Population Resources and Environment, 50.
Huang, B., Wu, B., and Barry, M. (2010). Geographically and temporally weighted regression for modeling spatio-temporal variation in house prices. Int. J. Geogr. Inf. Sci. 24, 383–401. doi:10.1080/13658810802672469
Hung, C. C. W., Hsu, S. C., and Cheng, K. L. (2019). Quantifying city-scale carbon emissions of the construction sector based on multi-regional input-output analysis. Resour. Conserv. Recycl. 149, 75–85. doi:10.1016/j.resconrec.2019.05.013
Jiang, R., and Li, R. (2017). Decomposition and decoupling analysis of life-cycle carbon emission in China’s building sector. Sustain. Switz. 9, 793. doi:10.3390/su9050793
Lai, X., Lu, C., and Liu, J. (2019). A synthesized factor analysis on energy consumption, economy growth, and carbon emission of construction industry in China. Environ. Sci. Pollut. Res. 26, 13896–13905. doi:10.1007/s11356-019-04335-7
Li, B., Han, S., Wang, Y., Li, J., and Wang, Y. (2020a). Feasibility assessment of the carbon emissions peak in China’s construction industry: Factor decomposition and peak forecast. Sci. Total Environ. 706, 135716. doi:10.1016/j.scitotenv.2019.135716
Li, D., Huang, G., Zhang, G., and Wang, J. (2020b). Driving factors of total carbon emissions from the construction industry in Jiangsu Province, China. J. Clean. Prod. 276, 123179. doi:10.1016/j.jclepro.2020.123179
Li, F., and Chen, J. (2020). Which provinces should pay more attention to CO2 emissions in China’s construction industry? IOP Conf. Ser. Mat. Sci. Eng. 730, 012059. doi:10.1088/1757-899X/730/1/012059
Li, H., Mu, H., Zhang, M., and Gui, S. (2012). Analysis of regional difference on impact factors of China’s energy - related CO2 emissions. Energy 39, 319–326. doi:10.1016/j.energy.2012.01.008
Li, L., Cai, Y., and Liu, L. (2020c). Research on the effect of urbanization on China’s carbon emission efficiency. Sustain. Switz. 12, 163. doi:10.3390/SU12010163
Li, R., and Jiang, R. (2017). Moving low-carbon construction industry in Jiangsu Province: Evidence from decomposition and decoupling models. Sustain. Switz. 9, 1013. doi:10.3390/su9061013
Li, S., Wu, Q., Zheng, Y., and Sun, Q. (2021). Study on the spatial association and influencing factors of carbon emissions from the Chinese construction industry. Sustain. Switz. 13, 1728–1819. doi:10.3390/su13041728
Li, Y., Zhang, H., Gu, J., Qian, X., Yin, Y., et al. (2016). Effects of adding different surfactants on antibiotic resistance genes and intI1 during chicken manure composting. Bioresour. Technol. 38, 545–551. doi:10.1016/j.biortech.2016.06.117
Lin, B., and Liu, H. (2015). CO2 mitigation potential in China’s building construction industry: A comparison of energy performance. Build. Environ. 94, 239–251. doi:10.1016/j.buildenv.2015.08.013
Liu, H., and Lin, B. (2017). Energy substitution, efficiency, and the effects of carbon taxation: Evidence from China’s building construction industry. J. Clean. Prod. 141, 1134–1144. doi:10.1016/j.jclepro.2016.09.119
Liu, X., and Chen, W. (2016). Dynamic evolution of spatial disparity of energy carbon emissions in Xinjiang based on ESDA-GIS. Arid. Land Geogr., 678–685. doi:10.13826/j.cnki.cn65-1103/x.2016.03.027
Liu, Y., Wang, J., Wang, X., Wu, H., Guo, F., and Song, Y. (2022). A study of CO2 emissions in China’s domestic construction industry based on non-competitive input-output. Sustain. Prod. Consum. 32, 743–754. doi:10.1016/j.spc.2022.05.024
Lu, N., Feng, S., Liu, Z., Wang, W., Lu, H., and Wang, M. (2020). The determinants of carbon emissions in the Chinese construction industry: A spatial analysis. Sustain. Switz. 12, 1428. doi:10.3390/su12041428
Lu, Y., Cui, P., and Li, D. (2016). Carbon emissions and policies in China’s building and construction industry: Evidence from 1994 to 2012. Build. Environ. 95, 94–103. doi:10.1016/j.buildenv.2015.09.011
Ma, M., Ma, X., Cai, W., and Cai, W. (2020). Low carbon roadmap of residential building sector in China: Historical mitigation and prospective peak. Appl. Energy 273, 115247. doi:10.1016/j.apenergy.2020.115247
Ma, W., Tian, W., Zhou, Q., and Miao, Q. (2021). Analysis on the temporal and spatial heterogeneity of factors affecting urbanization development based on the GTWR model: Evidence from the yangtze river economic belt. Complexity 2021, 1–11. doi:10.1155/2021/7557346
Ma, X., Wang, C., Dong, B., Gu, G., Chen, R., Li, Y., et al. (2019). Carbon emissions from energy consumption in China: Its measurement and driving factors. Sci. Total Environ. 648, 1411–1420. doi:10.1016/j.scitotenv.2018.08.183
Normile, D. (2020). China’s bold climate pledge earns praise-but is it feasible?. Science 370, 17–18. doi:10.1126/science.370.6512.17
Onat, N. C., Kucukvar, M., and Tatari, O. (2014). Scope-based carbon footprint analysis of U.S. residential and commercial buildings: An input-output hybrid life cycle assessment approach. Build. Environ. 72, 53–62. doi:10.1016/j.buildenv.2013.10.009
Peng, J. J. (2019). Factors affecting carbon emissions in the construction industry based on STIRPAT model: Taking henan province of China as an example. Nat. Environ. Pollut. Technol. 18, 1035. Available at: http://www.neptjournal.com
Qi, S., and Zhang, Y. (2013). Research on the influencing factors and reduction strategies of carbon emission of construction industry in China. Soft Sci. 27, 39.
Shang, M., Dong, R., Fu, Y., and Hao, W. (2018). Research on carbon emission driving factors of China’s provincial construction industry. IOP Conf. Ser. Earth Environ. Sci. 128, 012148. doi:10.1088/1755-1315/128/1/012148
Shen, Y., Wang, C. C., Gao, C., and Ding, L. (2020). Spatio-temporal distribution and its influencing factors of carbon emissions in economic zone of Zhejiang Bay Area based on urbanization. J. Nat. Resour. 35, 329–342. doi:10.31497/zrzyxb.20200207
Shi, Q., Chen, J., and Shen, L. (2017). Driving factors of the changes in the carbon emissions in the Chinese construction industry. J. Clean. Prod. 166, 615–627. doi:10.1016/j.jclepro.2017.08.056
Shi, Q., Ren, H., Cai, W., and Gao, J. (2020). How to set the proper CO2 reduction targets for the provincial building sector of China? Sustain. Switz. 12, 10432–10522. doi:10.3390/su122410432
Mallapaty, S. (2020). How China could be carbon neutral by mid-century. Nature 586, 482–483. doi:10.1038/d41586-020-02927-9
Thomas Dietz, E. A. R. (1994). Rethinking the environmental impacts of population, affluence and technology. Hum. Ecol. Rev. 1, 277–300. doi:10.2307/24706840
Wang, J., Song, X., and Chen, K. (2020a). Which influencing factors cause CO2 emissions differences in China’s provincial construction industry: Empirical analysis from a quantile regression model. Pol. J. Environ. Stud. 29, 331–347. doi:10.15244/pjoes/105239
Wang, J., Wang, Z., Peng, S., Li, C., and Wei, L. (2020b). Tracing CO2 emissions of China’s construction sector. J. Clean. Prod. 275, 124165. doi:10.1016/j.jclepro.2020.124165
Wang, M., and Feng, C. (2018). Exploring the driving forces of energy-related CO2 emissions in China’s construction industry by utilizing production-theoretical decomposition analysis. J. Clean. Prod. 202, 710–719. doi:10.1016/j.jclepro.2018.08.152
Wang, Y., Chen, W., Kang, Y., Li, W., and Guo, F. (2018). Spatial correlation of factors affecting CO2 emission at provincial level in China: A geographically weighted regression approach. J. Clean. Prod. 184, 929–937. doi:10.1016/j.jclepro.2018.03.002
Wang, Y., and Zhao, T. (2018). Impacts of urbanization-related factors on CO2 emissions: Evidence from China’s three regions with varied urbanization levels. Atmos. Pollut. Res. 9, 15–26. doi:10.1016/j.apr.2017.06.002
Wang, Z., Zhou, Y., Zhao, N., Wang, T., and Zhang, Z. (2022). Spatial correlation network and driving effect of carbon emission intensity in China’s construction industry. Buildings 12, 201. doi:10.3390/buildings12020201
Wen, Q., Chen, Y., Hong, J., Chen, Y., Ni, D., and Shen, Q. (2020). Spillover effect of technological innovation on CO2 emissions in China’s construction industry. Build. Environ. 171, 106653. doi:10.1016/j.buildenv.2020.106653
Wu, Y., Chau, K. W., Lu, W., Shen, L., Shuai, C., and Chen, J. (2018). Decoupling relationship between economic output and carbon emission in the Chinese construction industry. Environ. Impact Assess. Rev. 71, 60–69. doi:10.1016/j.eiar.2018.04.001
Yuan, H., Feng, Y., Lee, J., and Liu, H. (2020). The spatio-temporal heterogeneity of financial agglomeration on green development in China cities using GTWR model. Sustain. Switz. 12, 6660. doi:10.3390/su12166660
Zhang, P., Hu, J., Zhao, K., Chen, H., Zhao, S., and Li, W. (2022). Dynamics and decoupling analysis of carbon emissions from construction industry in China. Buildings 12, 257–328. doi:10.3390/buildings12030257
Zhang, S., Li, Z., Ning, X., and Li, L. (2021). Gauging the impacts of urbanization on CO2 emissions from the construction industry: Evidence from China. J. Environ. Manage. 288, 112440. doi:10.1016/j.jenvman.2021.112440
Zhang, T., Yang, J., and Sheng, P. (2016). The impacts and channels of urbanization on carbon dioxide emissions in China. China Popul. Resour. Environ., 47.
Zhang, X., and Wang, F. (2016a). Hybrid input-output analysis for life-cycle energy consumption and carbon emissions of China’s building sector. Build. Environ. 104, 188–197. doi:10.1016/j.buildenv.2016.05.018
Zhang, Y., and Lu, X. (2015). Regional carbon dioxide reduction on interaction between industrial agglomeration and technology transaction: On provincial panel data. Finance Trade Res. 26, 33. doi:10.19337/j.cnki.34-1093/f.2015.05.005
Zhang, Z., and Liu, R. (2013). Carbon emissions in the construction sector based on input-output analyses. J. Tsinghua Univ. Sci. Technol. 53, 53. doi:10.16511/j.cnki.qhdxxb.2013.01.007
Zhang, Z., and Wang, B. (2016b). Research on the life-cycle CO2 emission of China’s construction sector. Energy Build. 112, 244–255. doi:10.1016/j.enbuild.2015.12.026
Keywords: CO2 emission, construction industry, LCA, GTWR, spatial -temporal heterogeneity, influencing factor
Citation: Li T, Gao H and Yu J (2022) Analysis of the spatial and temporal heterogeneity of factors influencing CO2 emissions in China’s construction industry based on the geographically and temporally weighted regression model: Evidence from 30 provinces in China. Front. Environ. Sci. 10:1057387. doi: 10.3389/fenvs.2022.1057387
Received: 29 September 2022; Accepted: 28 October 2022;
Published: 10 November 2022.
Edited by:
Irfan Ullah, Nanjing University of Information Science and Technology, ChinaReviewed by:
Muhammad Zeeshan, Liaoning Technical University, ChinaZeeshan Ahmed, University of Lahore, Pakistan
Alam Rehman, National University of Modern Languages, Pakistan
Copyright © 2022 Li, Gao and Yu. This is an open-access article distributed under the terms of the Creative Commons Attribution License (CC BY). The use, distribution or reproduction in other forums is permitted, provided the original author(s) and the copyright owner(s) are credited and that the original publication in this journal is cited, in accordance with accepted academic practice. No use, distribution or reproduction is permitted which does not comply with these terms.
*Correspondence: Haidong Gao, aGRnYW9AbXNuLmNu