 Yanan Zhao
 Zhili Li1
 Zhe Cao
 Hongmei Wang
- 1School of Agriculture, Ningxia University, Yinchuan, China
- 2School of Geography and Planning, Ningxia University, Yinchuan, China
- 3Key Laboratory for Restoration and Reconstruction of Degraded Ecosystems in Northwestern China of Ministry of Education, Ningxia University, Yinchuan, China
Nitrogen is the most important driving factor in primary production and decomposition in arid and semi-arid ecosystems. The effects of shrub encroachment on nitrogen cycling have been investigated at the site scale but seldomly conducted at the landscape scale. Here, we selected 43 shrubland sites distributing across 3000 km2 area in temperate desert grassland in eastern Yanchi County of Ningxia Hui Autonomous. We investigated the spatial heterogeneity and driving factors of soil total nitrogen (STN) at the landscape scale by using geostatistical analysis and the geographical detector method. Our results showed that the average soil total nitrogen decreased in the order of 0–5 cm (0.21 g kg−1) > 5–15 cm (0.19 g kg−1) > 15–40 cm (0.18 g kg−1). Geostatistical analysis showed that soil total nitrogen exhibited the strong spatial autocorrelation in the 0–5 and 5–15 cm soil layers and the moderate spatial autocorrelation in the 15–40 cm soil layer. Furthermore, the geographic detector method indicated that soil physicochemical properties exhibited the stronger effects than these of topographic and vegetation biomass in determining the spatial distribution of soil total nitrogen. Specifically, soil water content in the 0–20 cm soil layer explained 35% of variation in soil total nitrogen spatial pattern in the 0–5 cm soil layer, while soil organic carbon content in the 15–40 cm soil layer explained 64% and 45% of variation in soil total nitrogen spatial patterns in the 5–15 cm and 15–40 cm soil layers, respectively. It was concluded that soil water content and organic carbon content primarily drove the formation of soil total nitrogen spatial heterogeneity in shrubland at the landscape scale, indicating that anthropogenic shrub encroachment evidently affected soil water content and redistribution in dryland.
1 Introduction
Shrub encroachment occurs widely in 10%–20% of arid and semi-arid grassland ecosystems, which is usually accompanied by gradual and irreversible changes in plant community composition (Van Auken, 2009; Eldridge et al., 2011; D’Odorico et al., 2012; Nackley et al., 2017; Bestelmeyer et al., 2018; Travers et al., 2019). This phenomenon can be caused by anthropogenic factors (overgrazing of livestock or reduced fire frequency) and climate change (increased atmospheric carbon dioxide concentration or change in rainfall patterns) (Archer et al., 1995; D’Odorico et al., 2012; Devine et al., 2017; Venter et al., 2018). The microclimate formed in shrubland also promotes the further establishment and expansion of shrub (Thompson et al., 2017). In some regions, shrub encroachment can be consciously implemented to introduce native shrub species to overgrazed desert grassland for ecological and vegetation restoration (Zhao et al., 2018; Zhao et al., 2020; Du et al., 2021). Both natural and anthropogenic shrub encroachment have important and unpredictable effects on grassland ecosystem structure, function, and services (Nackley et al., 2017; Bestelmeyer et al., 2018; Travers et al., 2019; Li et al., 2021; Zhao et al., 2021). For example, the formation of excessive shrub in the temperate desert steppe can significantly deplete soil moisture and decrease herbaceous diversity (Yu et al., 2021; Zhao et al., 2021). Moreover, growth of woody plants is at the expense of herbaceous plants, which reduces the productivity of livestock grazing (cattle, sheep, and horses) (Archer et al., 2017; Pierce et al., 2019). Changes in plant communities also lead to distinctly different ecosystem processes at the structural, morphological, and biological levels and significantly alter nutrient fluxes, spatial distribution, and biogeochemical cycles in arid and semi-arid grassland (Throop and Archer, 2008; Ratajczak et al., 2012; Sala and Maestre, 2014; Bestelmeyer et al., 2018; Stanton et al., 2018; Zhou et al., 2019). Consequently, shrub encroachment has become an important social and ecological issue for land managers (Anadón et al., 2014; Belayneh and Tessema, 2017; Ayalew and Mulualem, 2018).
Nitrogen content alters both abiotic (soil nutrients and pH) and biotic (biomass) composition in soil and significantly influences ecosystem functioning (Turnbull et al., 2010). In arid and semi-arid ecosystems, nitrogen is the most important nutrient influencing soil primary production and decomposition (Gebauer and Ehleringer, 2000). Soil total nitrogen (STN) increase, decrease, or no change has been reported along the transition from grassland to shrubland (Boutton and Liao, 2010; Li et al., 2019; Turpin-Jelfs et al., 2019; Li et al., 2021). In addition, STN responded varyingly to vegetation patches in different geographical regions. In subtropical grassland in New Mexico, shrub encroachment drove STN to accumulate beneath shrub patches but not under grass patches, while STN tended to increase under both grass and shrub patches in shrub encroached Tallgrass Prairie and Mediterranean grassland (Hibbard et al., 2001; Lett et al., 2004; Báez and Collins, 2008; Maestre et al., 2009). The varying STN accumulation speeds under shrub and grass patches should also cause varying levels of STN distribution fragmentation at the regional scale or landscape scale. However, such information has been largely lacking as the majority of studies in STN have been conducted at the small scale or site scale. The enriched knowledge of STN spatial pattern at the landscape scale is essential for us to understand the regional flow of STN over large geographical area (Archer et al., 2017; Ward et al., 2018; Connell et al., 2021).
Shrub invasion can affect a broad spectrum of ecological processes at the landscape scale (Pickett and Cadenasso, 1995; Baveye and Laba, 2015). In terms of vegetation, Zuo et al. (2021) found that shrub invasion simplified community composition and amplified the spatial heterogeneity of vegetation. Regarding soil, Eldridge et al. (2015) found that shrub encroachment changed the spatial pattern of soil infiltration, decreased interstitial infiltration connectivity, and reduced infiltration under shrub patches compared to grass patches. Meanwhile, woody plant encroachment can change soil organic carbon, total nitrogen, total phosphorus, and δ15N within the 1.2 m soil profile at the landscape scale (Zhou et al., 2017a; Zhou et al., 2018a; Zhou et al., 2018b; Zhou et al., 2018c). In the temperate desert steppe, the introduced shrubs accelerated water depletion and drought in soil, resulting in the enhanced spatial heterogeneity and fragmentation of soil moisture in the 0–200 cm soil layer (Zhao et al., 2018; Zhao et al., 2020). Shrub encroachment was also observed to aggravate the spatial heterogeneity and fragmentation of soil organic carbon (SOC) in the soil surface layer (Zhao et al., 2019). However, few studies have been conducted to investigate STN in grassland-shrubland transition, and our understanding of STN spatial pattern in shrub encroached grassland is still largely limited.
Semi-variogram and kriging methods have been frequently used to study spatial autocorrelation and heterogeneity of soil properties at the landscape scale (Western et al., 1998; Maroufpoor et al., 2020). By using these methods, we can predict that spatial pattern of a soil indictor is affected by factors of structure, randomness, or both. However, a major limitation of these two methods is that the interaction between spatial properties cannot be predicted (Western et al., 1998; Yang et al., 2017). To complement this, a new tool, GeoDetector, can be used to not only measure, mine, and exploit spatial heterogeneity but also estimate the degree of interpretation of independent spatial variables and interactions between dependent spatial variables (Wang et al., 2016; Wang and Xu, 2017). Here, all these methods were recruited to analyze and predict the spatial distribution pattern of STN and its corresponding driving factors in grassland-shrubland transition at the landscape scale in desert steppe. Specifically, our objectives were to 1) examine how STN content varied at different soil depths in shrubland; 2) estimate the spatial heterogeneity of STN at different soil depths in shrubland; and 3) determine how topography, vegetation, and soil physicochemical properties determine spatial pattern formation of STN at different soil depths in shrubland.
2 Materials and methods
2.1 Site description
Fieldwork for this study was conducted in eastern Yanchi County of Ningxia Hui Autonomous Region in China (Figure 1; 106°30′-107°39′E, 37°5′−38°10′ N). Situated on a typical desert steppe region on Loess Plateau comprising ≈3,000 km2, eastern Yanchi county ranges in elevations of 1,283 to 1,700 m a.s.l. The mean monthly maximum and minimum temperatures in this region were −6.9°C in January and 23.1°C in July from 1986 to 2017, respectively, with a mean annual temperature of 8.1°C. Mean annual precipitation for the same period was 301.2 mm, with 80% of it being received during from July to September. The mean annual sunshine duration, mean annual frost-free period, and mean annual evaporation between 1986 and 2017 were 2,863 h, 160 days, and 2,139 mm, respectively. Soil types in the study area are identified as the sierozem and aeolian sandy soil, which is described as having a low level of soil fertility with loose structure according to Chinese Soil Taxonomy (Zhao et al., 2018). Vegetation is dominated by several native desert grassland species, such as Agropyron mongolicum, Lespedeza potaninii, Artemisia scoparia, Stipa breviflora, Stipa bungeana, Leymus secalinus, and Pennisetum centrasiaticum. This region has been characterized by low vegetation coverage, land desertification, and soil erosion due to overgrazing over the past decades. As a result, since the 1970s and 1980s, a native xerophytic shrub (Caragana korshinskii) has been introduced to this area for vegetation reconstruction (Zhao et al., 2018; Zhao et al., 2019; Du et al., 2021). Other species including Artemisia ordosica and Medicago sativa have been planted in the area but they occupy very little area. To date, shrub cover in this area has anthropogenically increased to more than 48.5% of the total land area over the past 40 years. These shrubs have formed a large number of grass-shrub mosaics (Zhao et al., 2021).
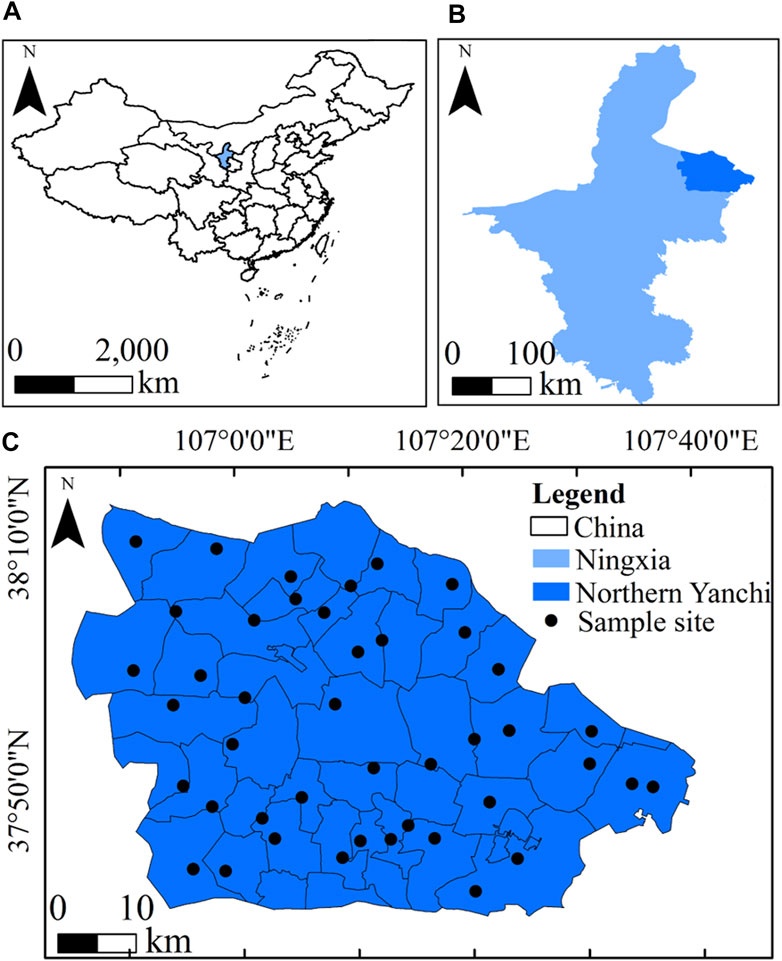
FIGURE 1. Location of the study area and the distribution of sample sites. (A): China; (B): Ningxia; (C): Northern Yanchi County.
2.2 Field sampling and data collection
From July 18th to August 17th in 2017, soil was sampled over the whole region. We selected 43 sites in desert grassland where C. korshinskii were planted (Figure 1). The planting volume, planting interval, and age of C. korshinskii were 1,665–3,330 clusters/hm2, 2–40 m, and 3–29 years, respectively (Zhao et al., 2018). Three representative plots (10 × 10 m for each plot) were randomly and homogeneously assigned in each of 43 sites. Six soil columns (3 columns in each of shrub patches and shrub interspace) with a diameter of 5 cm and a depth of 40 cm (0–5, 5–15, and 15–40 cm soil layers) without the litter layer were collected in a homogeneous manner in each plot. These soil samples (n = 2,322) were then taken to the lab to be homogenized, air-dried, and sieved through with a 2-mm mech to remove gravel and litter for proper STN measurement. STN content was then determined using the Kjeldahl digestion procedure (Bremner and Tabatabai, 1972). The Digital Elevation Model (DEM) data comes from the Geospatial Data Cloud (http://www.gscloud.cn/) with a resolution of 30 m. The elevation, slope, and aspect data of 43 sites were calculated and derived from the DEM data (Supplementary Table S1). Soil organic carbon content, soil water content, and aboveground vegetation biomass data were obtained from Zhao et al. (2018), Zhao et al. (2019), Zhao et al. (2021). It is worth noting that the soil organic carbon, soil moisture, and aboveground vegetation biomass previously examined by Zhao et al. (2018), Zhao et al. (2019), Zhao et al. (2021) were reused as potential STN influencing factors for a different purpose in the present study (Supplementary Table S1).
2.3 Research methods
2.3.1 Descriptive statistics
The datasets of STN in the 0–5, 5–15, and 15–40 cm soil layers were analyzed to determine the classical statistical parameters, i.e., maximum, minimum, mean, median, standard deviation, and coefficient of variation (CV = mean/standard deviation) (Yang et al., 2017). These parameters are generally used to indicate the midpoint and spread of data. The Kolmogorov-Smirnov method, skewness, and kurtosis were used to evaluate the normality of STN datasets. Log10 transformation was performed on non-normally distributed data for normality correction.
2.3.2 Geostatistical statistics
Based on geostatistical analysis and theory of regionalized variables, we used a semi-variogram with a best-fit model for STN to quantify spatial structure to provide parameters for kriging optimal spatial interpolation (Matheron, 1963; Western et al., 2004; Webster et al., 2007; Maroufpoor et al., 2020). Semi-variograms describe the ratio change in STN between sampling sites using the following equation:
where for each site i, Z (xi) and Z (xi + h) are values of Z at locations xi and xi + h, respectively; h is the lag and
The parameters of the best-fitted model based on semi-variance analysis were used in the ordinary kriging method, and the interpolation map was used to test the predicted distribution of STN (Yang et al., 2017). In addition to testing R2 and RSS of the best-fitted model, another way of testing the accuracy of kriging interpolation maps is to calculate the diagnostic statistics of the cross-validation approach. Generally, three statistics: the mean error (ME), the mean square deviation (MSE), and the root-mean-squared error (RMSE) were considered as follows (Webster et al., 2007):
where n is the number of the locations; Pi and Mi are the predicted and measured values at location i, respectively, and δi is the kriging standard error at location i. The model was optimal if these statistics met the following criteria: ME and MSE were close to 0 and RMSE was close to 1 (Webster et al., 2007).
2.3.3 Geographical detector method
The geographical detector method (GDM) is a new statistical method to detect spatial stratified heterogeneity and reveal the corresponding driving factors (Wang et al., 2010). GDM has no linear hypothesis, while its idea assumes that if an independent variable X) has an essential impact on a dependent variable Y), the spatial distribution of that independent variable X) and that dependent variable Y) should be similar (Wang et al., 2010; Wang et al., 2016). Different from traditional methods, GDM can detect the influencing factors (numerical variables or categorical variables) accounting for STN distribution and determine how any of two factors interactively determine STN distribution (Wang and Xu, 2017). GDM consists of four parts: factor detector, ecological detector, risk detector, and interaction detector (Wang and Xu, 2017). As the core part of the GDM, the q-value is used to check the influencing factors and compare the dispersion variance between the observed values of the whole study area along with the strata variables (Wang et al., 2016; Wang and Xu, 2017). The power of influencing factors on STN distribution can be calculated as follows (Wang and Xu, 2017):
Where h = 1, …, L is the number of stratums affecting STN (Y) and its influencing factors(X); Nh and N are the number of units in strata h and all samples in the study area;
Interaction detection was used to test the effect of interaction between different influencing factors (XS). In other words, this method was used to evaluate if the interaction of two factors (independent variables X1 and X2) will enhance or weaken the explanatory power of the dependent variable Y), or if the factor is simply independent of Y (Wang and Xu, 2017). Specifically, we utilized the analysis method described by Wang and Xu (2017), which begins by calculating the q-values of two factors X1 and X2 to generate q (X1) and q (X2) representing that how much variation that X1 and X2 can explain Y. Moreover, the interaction of the two factors yields the q-value: q (X1∩X2). Finally, the values of q (X1), q (X2) and q (X1∩X2) are compared. Using this method, the results of the interaction between the two factors can be divided into five possible relationships (Wang and Xu, 2017).
2.4 Statistical analysis
One-way analysis of variance (ANOVA) and Duncan’s comparisons test (p < 0.05) were used to determine whether the mean of STN significantly differed among different soil layers. We tested the normal distribution of STN in different soil layers using the Kolmogorov-Smirnov test at p = 0.05 significance level. Non-normally distributed STN was log10 transformed to normal distribution in SPSS 21.0 software. Spatial heterogeneity of STN content at different soil depths was then determined by geostatistical methods. The spatial distribution map of STN content in the 0–40 cm soil layer at the landscape scale was determined using the ordinary kriging tool from ArcGIS 10.2 software. To determine the driving factors of the spatial distribution of STN in the 0–40 cm soil layer, the factor detector and interaction detector were used through a geographic detector method (GDM) within Excel-GeoDetector (http://www.geodetector.org) (Wang and Xu, 2017). Since this method requires the independent variables to be numerical variables and the dependent variables to be categorical variables, potential influencing factors (i.e., soil organic carbon content, soil water content, elevation, slope, and vegetation aboveground biomass) were divided into categorical variables by a classification algorithm. In ArcGIS, those potential influencing factors are then subjected to ordinary kriging interpolation and divided by the natural break classification method. Thereafter, the corresponding coordinate information can be obtained by overlapping analysis using the geographic coordinates of 43 sample sites. Finally, STN content in the 0–40 cm soil layer was imported into the GDM (Wang and Xu, 2017) to show the influences of a single factor and interaction of any of two factors on STN distribution.
3 Results
3.1 Descriptive statistics
Descriptive statistics, including overall variability and distribution of STN in the 0–5, 5–15, and 15–40 cm soil layers are presented in Figure 2. The average STN decreased in the order of 0–5 cm (0.21 g kg−1) > 5–15 cm (0.19 g kg−1) > 15–40 cm (0.18 g kg−1) soil layers, though no statistically significant difference was found for STN among these soil layers (p > 0.05). Figure 2 showed that STN had the moderate level of variability in all soil layers, with variation values varying from 24.46% to 46.98%.
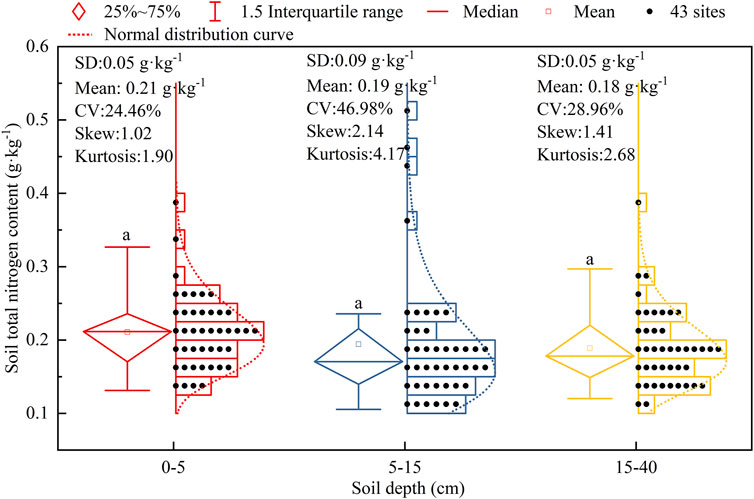
FIGURE 2. Soil total nitrogen content in 0–40 cm soil layers at 43 shrublands. SD: standard deviation; CV: coefficient of variation.
3.2 Geostatistical analysis
The STN content in the 0–5, 5–15, and 15–40 cm soil layers conformed Gaussian, exponential, and spherical models as best-fitted models, respectively (see Table 1 and Figure 3). Each best-fitted model has a large coefficient of determination (R2) of 0.557–0.774 and a small residual sum of squares (RSS) of 0.002–0.011 (Table 1). The results of the cross-validation analysis showed that the mean error and mean standard error were close to 0, while the root-mean squared-error was close to 1 (Table 2). These results indicated that these models fitted well (Table 2). In addition, the structural variance ratios [C/(C0+C)] in the 0–5 and 5–15 cm soil layers were greater than 99.8%, demonstrating the strong spatial autocorrelation. Moreover, the structure variance ratio in the 15–40 cm soil layer was 50.6%, which belonged to the moderate spatial autocorrelation (Table 1). Furthermore, the spatial autocorrelation range (A0) showed an increasing trend as the soil layer became deeper (Table 1).

TABLE 1. Geostatistical model of soil total nitrogen semi-variation and correlation parameters.
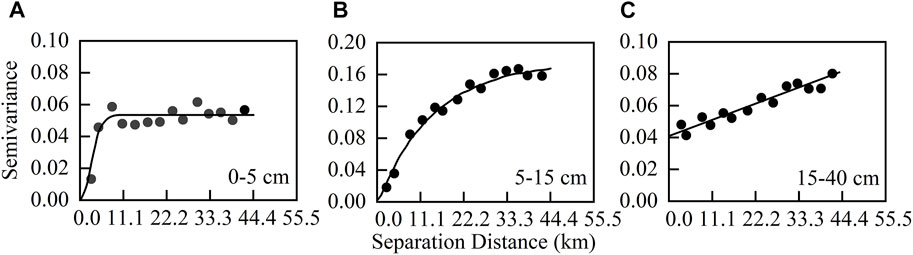
FIGURE 3. γ(h)∼h fitting diagram of soil total nitrogen semi-variation function at 0–40 cm soil layer. (A): 0–5 cm; (B): 5–15 cm; (C): 15–40 cm.

TABLE 2. Evaluation criteria of soil total nitrogen content prediction in 0–40 cm soil layers.
The spatial distribution pattern of STN content was higher in the north than in the south after shrub encroachment in the desert steppe of eastern Ningxia (Figure 4). In the 0–5 cm soil layer, STN distribution was highly fragmented, reflecting in complex spatial distribution exhibiting dense and irregular patches of different sizes. In the 5–15 cm soil layer, STN distribution was also patchy but showed an evident trend that was high in the north and low in the south. In contrast, STN in the 15–40 cm soil layer was mainly distributed in a strip-shaped pattern, as the contour lines here were sparser and smoother than those in other soil layers. The distribution of STN in this soil layer tended to be higher in the north than in the south, confirming the continuity of STN distribution across different soil layers.
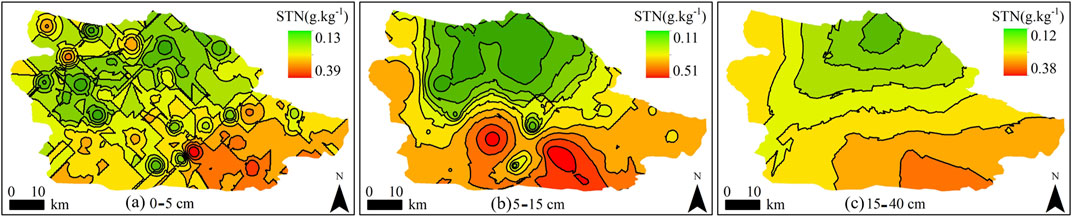
FIGURE 4. Kriging interpolation of soil total nitrogen (STN) in 0–40 cm soil layers (g⋅kg−1). (A): 0–5 cm; (B): 5–15 cm; (C): 15–40 cm.
3.3 Geographical detector method
Nine potential driving factors of STN were analyzed by GDM (Figure 5). The q-value of all driving factors in the 0–5, 5–15, and 15–40 cm soil layers ranged from 0.06 to 0.35, 0.08 to 0.64, and 0.08 to 0.45, respectively. SWC0-20 (q = 0.35), SOC15-40 (q = 0.64), and SOC15-40 (q = 0.45) had the highest q-value than other factors, meaning that they were the major contributors to spatial heterogeneity of STN in the 0–5, 5–15, and 15–40 cm soil layers. The top potential drivers that influenced the spatial distribution of STN in the 0–40 cm soil layer were soil water content (q = 0.35–0.37) and soil organic carbon (q = 0.27–0.64). The q-value of AGB, elevation, aspect, and slope were below 0.23, so these factors had less impact on STN distribution in the shrub-introduced temperate desert steppe.
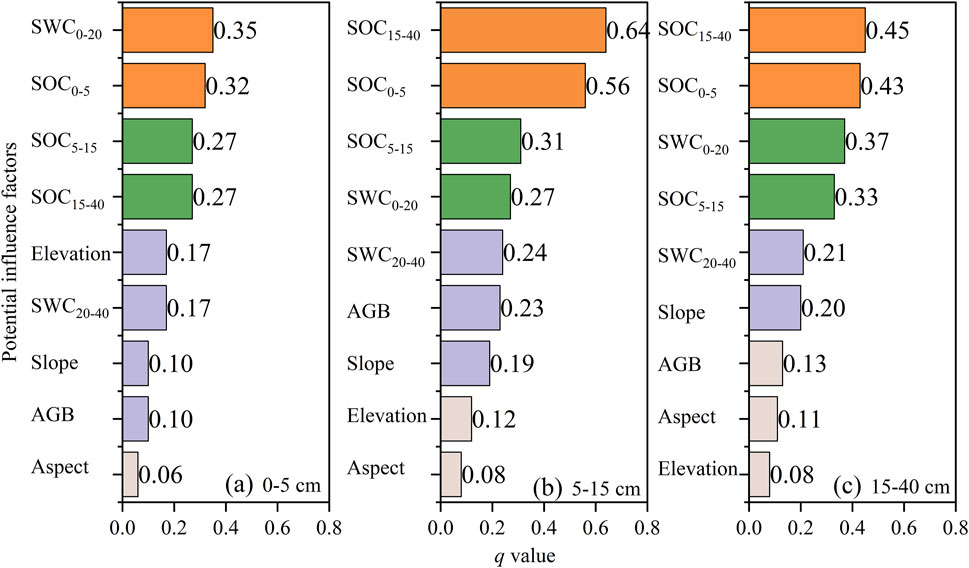
FIGURE 5. The q-value of nine potential driving factors impacting on soil total nitrogen content. (A): 0–5 cm; (B): 5–15 cm; (C): 15–40 cm. SWC0-20: soil water content in 0–20 cm; SWC20-40: soil water content in 20–40 cm; SOC0-5: soil organic carbon content in 0–5 cm; SOC5-15: soil organic carbon content in 5–15 cm; SOC15-40: soil organic carbon content in 15–40 cm; AGB: aboveground vegetation biomass.
The non-linear and double factor enhancements caused by two-way interaction of factors on STN distribution were shown in Table 3. For example, the q-value of elevation in the 0–5 cm soil layer as a single factor was 0.06, but q-value could be larger than 0.46 when elevation interacted with one of other factors. Among all potential factors, the interaction of any two factors displayed the higher q-values than those calculated from a single factor, indicating that spatial distribution of STN in the 0–40 cm soil layer was primarily determined by multiple factors other than any single factor. Not surprisingly, the interaction between aspect and soil organic carbon or soil moisture explained major (q = 0.52–0.99) effect on STN distribution, while aspect itself only explained minor effect (q = 0.08–0.11) on STN distribution. In most cases, aspect showed the higher interpretation rates when it interacted with other factors, indicating that aspect was an important topographic factor that should not be ignored.
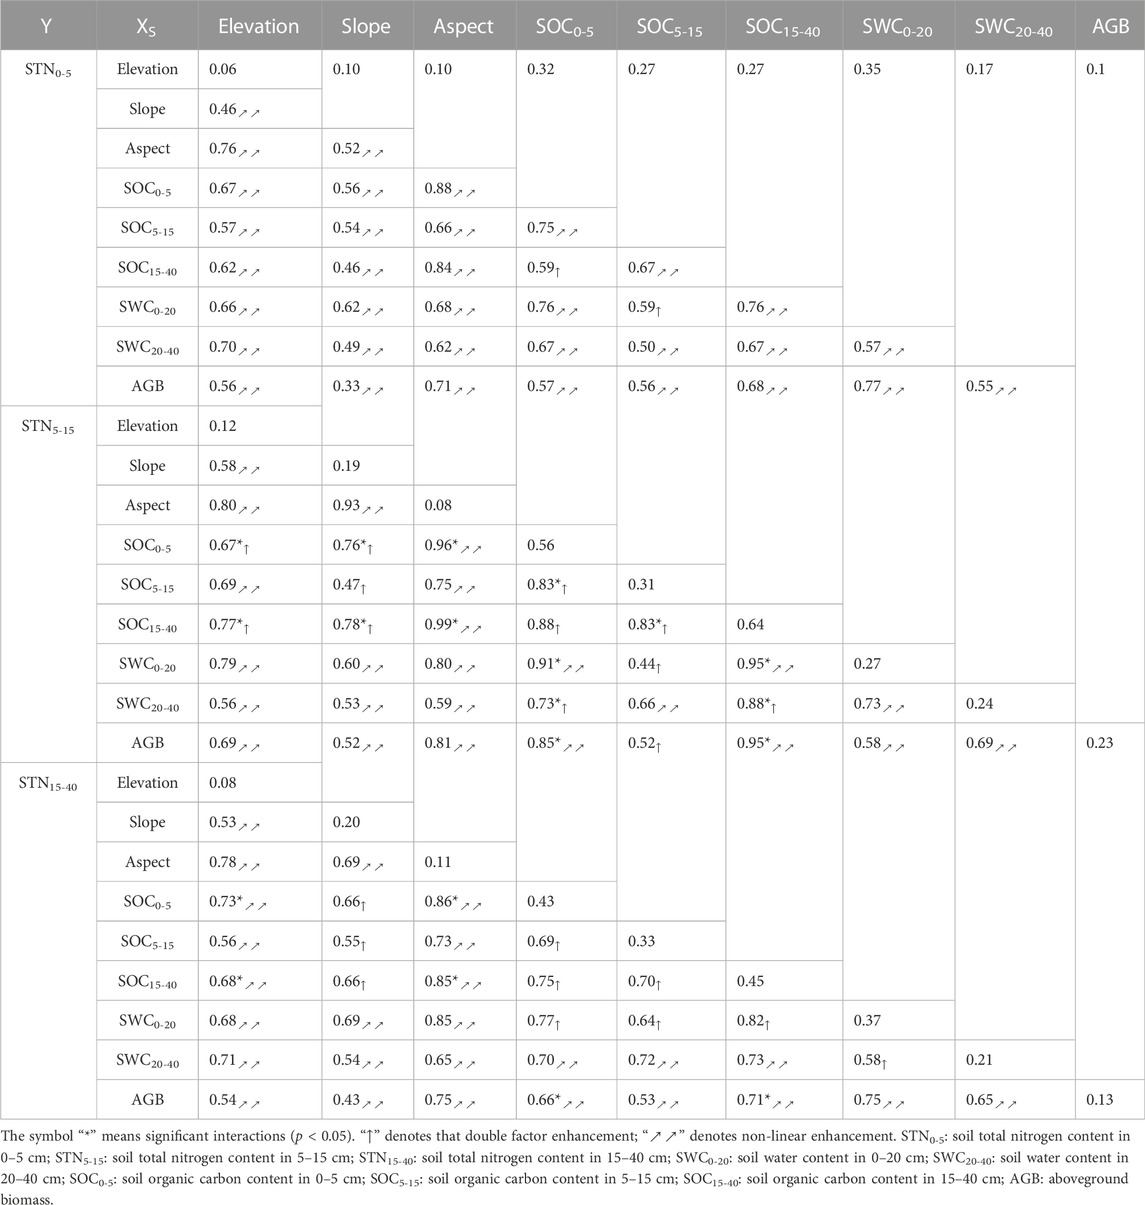
TABLE 3. The q-value of interactions between factors affecting soil total nitrogen distribution.
4 Discussion
Aboveground vegetation can affect spatial heterogeneity of soil properties (Schlesinger et al., 1995; D’Odorico et al., 2010; Pellegrini et al., 2021; Zhou et al., 2021). In grassland-shrubland transition, the aboveground vegetation is swiftly switching from grass to shrub. The current study investigated how invasion of woody vegetation affected spatial heterogeneity of STN in different soil depths in grassland, aiming to enrich our understanding of STN dynamics during such an ecological transition and provide land restoration guidance for land managers.
The STN contents of 43 sites in shrubland in temperate desert steppe decreased along with the increased soil depth after anthropogenic shrub encroachment. This finding is consistent with our expectation that large amount of shrub litter is decomposed in the top soil layer under shrub patches (Van Auken, 2009; Archer et al., 2017; Zhou et al., 2019). Moreover, STN in the 0–5 and 5–15 cm soil layers exhibited the strong spatial autocorrelation (Table 1), which was controlled by structural factors (i.e., meteorology, topography, soil texture) (Zhou et al., 2017b). The surface soil (0–15 cm) is vulnerable to human and animal activities, but this is not the case in the study region after 2003 when this region has been fully enclosed to prohibit human and animal entering (Li et al., 2021). In this area, rainfall is the only water source for soil water supply. In this regard, rainfall became a potential major driver to influence STN (Zhao et al., 2020). The STN in the 15–40 cm layer had the moderate spatial autocorrelation (Table 1), which would be affected by structural and random factors (i.e., microhabitat, soil parent material, texture, or mineralogy, and land management) (Cambardella and Karlen, 1999; D’Odorico et al., 2010; Wang et al., 2009; Liu et al., 2013). Consistent with our findings, other studies have also reported the moderate to strong spatial autocorrelation of STN in the 0–40 cm soil layer (Wang et al., 2009, 2017; Liu et al., 2013). Land use/cover change may be a potential major factor affecting spatial variation of STN, reflecting as transition from desert grassland to shrubland in the present study (Li et al., 2017; Zhao et al., 2017). Our results found that the spatial autocorrelation range of STN increased from 4.12 km in the 0–5 cm soi layer to 45.16 km in the 15–40 cm soi layer, which was evidently smaller than the spatial autocorrelation range of 374–461 km in 382 sampling sites across the Loess Plateau (620,000 km2) (Liu et al., 2013). This is likely due to differences in rainfall, elevation, and slope among different regions, which significantly affect the spatial variation of STN (Liu et al., 2013). A study case in subalpine forest reported a spatial autocorrelation range of 1.08 km in an area of 5.64 km2, with topographic factors and normalized difference vegetation index (NDVI) being the major factors explaining more than 40% of STN variation (Wang et al., 2017). These varying results suggest that the spatial heterogeneity of STN is highly dependent on geographic location, land use type, and study scale.
Soil moisture is an important limiting factor, especially in semi-arid desert steppe ecosystems, as it affects vegetation development, carbon and nitrogen cycling, and microbial processes (Li et al., 2021; Yu et al., 2021; Zhao et al., 2021). Shrub encroachment has negative effects on soil moisture, leading to soil desiccation, herbaceous species reduction, and possible further changes of soil nutrient cycling or availability (Eldridge et al., 2011; Archer et al., 2017; Zhou et al., 2019; Zhao et al., 2020). Soil water and soil organic carbon were found to be the main influencing factors controlling the spatial variability of STN after shrub planting, as suggested by the factor detector in GDM (Figure 5). The strong coupling relationship or interaction between soil organic carbon and soil total nitrogen means that a stable stoichiometric equilibrium exists within the carbon-nitrogen cycle (Wang et al., 2017; Zhou et al., 2018a; Chai et al., 2019). Previous studies have shown that topography, vegetation, and NDVI are the main factors determining the spatial heterogeneity of soil properties (Xin et al., 2016). In our study, topographic factors (elevation, slope, and aspect) and aboveground vegetation biomass were not dominant factors for spatial differentiation of STN in the topsoil (all q were less than 0.20) (Figure 5). Effects of two-way interaction of any two of nine factors were greater than these calculated from any single factor (Table 3). These findings indicated that the spatial pattern of STN after shrub introduction in temperate desert steppe was caused by the combination of multiple factors (Wang et al., 2016; Wang and Xu, 2017). Among them, the interaction between aspect and soil moisture or soil organic carbon greatly enhanced the explanatory power of STN spatial distribution (q > 0.76) (Table 3). This result implied that aspect was an essential factor that should not be ignored when it comes to investigate the effects of spatial drivers on spatial distribution of soil properties at the landscape scale.
5 Conclusion
In this research, data collected in desert steppe ecosystems encroached by shrubs were analyzed to characterize the spatial heterogeneity of STN and determine its driving mechanisms at the landscape scale by using classical statistics, geostatistical analysis, and the geographical detector method. The findings of the study were as follows:
1) The average STN in the 0–5, 5–15, 15–40 cm soil layers ranged from 0.18–0.21 g kg−1. The coefficient of variation indicated that STN showed the moderate variability in all soil layers.
2) The best theoretical models of STN in the 0–5, 5–15, and 15–40 cm soil layers were different. The semi-variance function showed that STN had strong the spatial autocorrelation and small ranges (4.12 km and 14.87 km) in the 0–5 and 5–15 cm soil layers, while this in the 15–40 cm soil layer showed the moderate spatial autocorrelation and a large range (45.16 km).
3) The influence of soil organic carbon and water content on the spatial distribution of STN in different soil layers was greater than that of elevation, slope, aspect, and aboveground vegetation biomass.
Data availability statement
The original contributions presented in the study are included in the article/Supplementary Material, further inquiries can be directed to the corresponding authors.
Author contributions
WM and HW are Co–corresponding authors of this article, other authors have contributed to this article to a certain degree. WM and HW: conceptualization; YZ: methodology; YZ and ZC: investigation; ZL and YZ: writing–original draft preparation; YZ: writing–review and editing; ZC and HW: project administration; HW: funding acquisition. All authors commented on previous versions of the manuscript. All authors read and approved the final manuscript.
Funding
This work was supported by National Natural Science Foundation of China (grant number 31,860,677) and (the Ningxia Higher Education Institutions First-Class Discipline Construction Project) (grant number NXYLXK 2017A01). Author HW has received research support from School of Agriculture Ningxia University.
Acknowledgments
The authors would like to thank Yanchi Sidunzi Ecological Field Station (YSEFS) for their help with the sites. We also thank Yongsheng Zhao for help during the field sampling. The authors would like to thank TopEdit (WWW.topeditsci.com) for its linguistic assistance during the preparation of this manuscript.
Conflict of interest
The authors declare that the research was conducted in the absence of any commercial or financial relationships that could be construed as a potential conflict of interest.
Publisher’s note
All claims expressed in this article are solely those of the authors and do not necessarily represent those of their affiliated organizations, or those of the publisher, the editors and the reviewers. Any product that may be evaluated in this article, or claim that may be made by its manufacturer, is not guaranteed or endorsed by the publisher.
Supplementary material
The Supplementary Material for this article can be found online at: https://www.frontiersin.org/articles/10.3389/fenvs.2022.1058344/full#supplementary-material
References
Anadón, J. D., Sala, O. E., Turner, B. L., and Bennett, E. M. (2014). Effect of woody-plant encroachment on livestock production in North and South America. Proc. Natl. Acad. Sci. U.S.A. 111, 12948–12953. doi:10.1073/pnas.1320585111
Archer, S., Schimel, D. S., and Holland, E. A. (1995). Mechanisms of shrubland expansion: Land use, climate or CO2? Clim. Change 29, 91–99. doi:10.1007/BF01091640
Archer, S. R., Andersen, E. M., Predick, K. I., Schwinning, S., Steidl, R. J., and Woods, S. R. (2017). “Woody plant encroachment: Causes and consequences,” in Rangeland systems. Springer series on environmental management. Editor D. D. Briske (Cham: Springer International Publishing), 25–84. doi:10.1007/978-3-319-46709-2_2
Ayalew, S., and Mulualem, G. (2018). A review on bush encroachment effect on cattle rearing in rangelands. J. Rangel. Sci. 8, 403–415.
Báez, S., and Collins, S. L. (2008). Shrub invasion decreases diversity and alters community stability in northern chihuahuan desert plant communities. PLoS ONE 3, e2332. doi:10.1371/journal.pone.0002332
Baveye, P. C., and Laba, M. (2015). Moving away from the geostatistical lamppost: Why, where, and how does the spatial heterogeneity of soils matter? Ecol. Modell. 298, 24–38. doi:10.1016/j.ecolmodel.2014.03.018
Belayneh, A., and Tessema, Z. K. (2017). Mechanisms of bush encroachment and its inter-connection with rangeland degradation in semi-arid african ecosystems: a review. J. Arid. Land 9, 299–312. doi:10.1007/s40333-016-0023-x
Bestelmeyer, B. T., Peters, D. P. C., Archer, S. R., Browning, D. M., Okin, G. S., Schooley, R. L., et al. (2018). The grassland–shrubland regime shift in the southwestern United States: misconceptions and their implications for management. BioScience 68, 678–690. doi:10.1093/biosci/biy065
Boutton, T. W., and Liao, J. D. (2010). Changes in soil nitrogen storage and δ15N with woody plant encroachment in a subtropical savanna parkland landscape. J. Geophys. Res. 115, G03019. doi:10.1029/2009JG001184
Bremner, J. M., and Tabatabai, M. A. (1972). Use of an ammonia electrode for determination of ammonium in Kjeldahl analysis of soils. Commun. Soil Sci. Plant Anal. 3, 159–165. doi:10.1080/00103627209366361
Cambardella, C. A., and Karlen, D. L. (1999). Spatial analysis of soil fertility parameters. Precis. Agric. 1, 5–14. doi:10.1023/A:1009925919134
Cambardella, C. A., Moorman, T. B., Novak, J. M., Parkin, T. B., Karlen, D. L., Turco, R. F., et al. (1994). Field-scale variability of soil properties in central Iowa soils. Soil Sci. Soc. Am. J. 58, 1501–1511. doi:10.2136/sssaj1994.03615995005800050033x
Chai, Q., Ma, Z., An, Q., Wu, G., Chang, X., Zheng, J., et al. (2019). Does Caragana korshinskii plantation increase soil carbon continuously in a water-limited landscape on the Loess Plateau, China? Land Degrad. Dev. 30, 1691–1698. doi:10.1002/ldr.3373
Connell, R. K., O’Connor, R. C., Nippert, J. B., and Blair, J. M. (2021). Spatial variation in soil microbial processes as a result of woody encroachment depends on shrub size in tallgrass prairie. Plant Soil 460, 359–373. doi:10.1007/s11104-020-04813-9
D’Odorico, P., Fuentes, J. D., Pockman, W. T., Collins, S. L., He, Y., Medeiros, J. S., et al. (2010). Positive feedback between microclimate and shrub encroachment in the northern Chihuahuan desert. Ecosphere 1, 1–11. doi:10.1890/ES10-00073.1
D’Odorico, P., Okin, G. S., and Bestelmeyer, B. T. (2012). A synthetic review of feedbacks and drivers of shrub encroachment in arid grasslands. Ecohydrol 5, 520–530. doi:10.1002/eco.259
Devine, A. P., McDonald, R. A., Quaife, T., and Maclean, I. M. D. (2017). Determinants of woody encroachment and cover in African savannas. Oecologia 183, 939–951. doi:10.1007/s00442-017-3807-6
Du, L., Zeng, Y., Ma, L., Qiao, C., Wu, H., Su, Z., et al. (2021). Effects of anthropogenic revegetation on the water and carbon cycles of a desert steppe ecosystem. Agric Meteorol 300, 108339. doi:10.1016/j.agrformet.2021.108339
Eldridge, D. J., Bowker, M. A., Maestre, F. T., Roger, E., Reynolds, J. F., and Whitford, W. G. (2011). Impacts of shrub encroachment on ecosystem structure and functioning: towards a global synthesis: Synthesizing shrub encroachment effects. Ecol. Lett. 14, 709–722. doi:10.1111/j.1461-0248.2011.01630.x
Eldridge, D. J., Wang, L., and Ruiz-Colmenero, M. (2015). Shrub encroachment alters the spatial patterns of infiltration. Ecohydrol 8, 83–93. doi:10.1002/eco.1490
Gebauer, R. L. E., and Ehleringer, J. R. (2000). Water and nitrogen uptake patterns following moisture pulses in a cold desert community. Ecology 81, 1415–1424. doi:10.2307/177218
Goovaerts, P. (1999). Geostatistics in soil science: state-of-the-art and perspectives. Geoderma 89, 1–45. doi:10.1016/S0016-7061(98)00078-0
Hibbard, K. A., Archer, S., Schimel, D. S., and Valentine, D. W. (2001). Biogeochemical changes accompanying woody plant encroachment in a subtropical savanna. Ecology 82, 1999–2011. doi:10.2307/2680064
Lett, M. S., Knapp, A. K., Briggs, J. M., and Blair, J. M. (2004). Influence of shrub encroachment on aboveground net primary productivity and carbon and nitrogen pools in a mesic grassland. Can. J. Bot. 24, 1363–1370. doi:10.1139/b04-088
Li, Z., Liu, C., Dong, Y., Chang, X., Nie, X., Liu, L., et al. (2017). Response of soil organic carbon and nitrogen stocks to soil erosion and land use types in the Loess hilly–gully region of China. Soil Tillage Res. 166, 1–9. doi:10.1016/j.still.2016.10.004
Li, H., Shen, H., Zhou, L., Zhu, Y., Chen, L., Hu, H., et al. (2019). Shrub encroachment increases soil carbon and nitrogen stocks in temperate grasslands in China. Land Degrad. Dev. 30, 756–767. doi:10.1002/ldr.3259
Li, Z., Wang, H., Sun, Z., Zhao, Y., and Li, X. (2021). Responses of soil nitrogen to the transition from desert grassland to shrubland in eastern Ningxia, China. Chin. J. Appl. Ecol. 32, 1230–1240. doi:10.13287/j.1001-9332.202104.008
Liu, Z. P., Shao, M. A., and Wang, Y. Q. (2013). Spatial patterns of soil total nitrogen and soil total phosphorus across the entire Loess Plateau region of China. Geoderma 197–198, 67–78. doi:10.1016/j.geoderma.2012.12.011
Maestre, F. T., Bowker, M. A., Puche, M. D., Belén Hinojosa, M., Martínez, I., García-Palacios, P., et al. (2009). Shrub encroachment can reverse desertification in semi-arid Mediterranean grasslands. Ecol. Lett. 12, 930–941. doi:10.1111/j.1461-0248.2009.01352.x
Maroufpoor, S., Bozorg-Haddad, O., and Chu, X. (2020). “Geostatistics,” in Handbook of probabilistic models (Elsevier), 229–242. doi:10.1016/B978-0-12-816514-0.00009-6
Matheron, G. (1963). Principles of geostatistics. Econ. Geol. 58, 1246–1266. doi:10.2113/gsecongeo.58.8.1246
Nackley, L. L., West, A. G., Skowno, A. L., and Bond, W. J. (2017). The nebulous ecology of native invasions. Trends Ecol. Evol. 32, 814–824. doi:10.1016/j.tree.2017.08.003
Pellegrini, E., Boscutti, F., Alberti, G., Casolo, V., Contin, M., and De Nobili, M. (2021). Stand age, degree of encroachment and soil characteristics modulate changes of C and N cycles in dry grassland soils invaded by the N2-fixing shrub Amorpha fruticosa. Sci. Total Environ. 792, 148295. doi:10.1016/j.scitotenv.2021.148295
Pickett, S. T. A., and Cadenasso, M. L. (1995). Landscape ecology: spatial heterogeneity in ecological systems. Science 269, 331–334. doi:10.1126/science.269.5222.331
Pierce, N. A., Archer, S. R., Bestelmeyer, B. T., and James, D. K. (2019). Grass-shrub competition in arid lands: an overlooked driver in grassland–shrubland state transition? Ecosystems 22, 619–628. doi:10.1007/s10021-018-0290-9
Ratajczak, Z., Nippert, J. B., and Collins, S. L. (2012). Woody encroachment decreases diversity across North American grasslands and savannas. Ecology 93, 697–703. doi:10.1890/11-1199.1
Sala, O. E., and Maestre, F. T. (2014). Grass-woodland transitions: determinants and consequences for ecosystem functioning and provisioning of services. J. Ecol. 102, 1357–1362. doi:10.1111/1365-2745.12326
Schlesinger, W. H., Raikes, J. A., Hartley, A. E., and Cross, A. F. (1995). On the spatial pattern of soil nutrients in desert ecosystems: ecological archives e077-002. Ecology 77, 364–374. doi:10.2307/2265615
Stanton, R. A., Boone, W. W., Soto-Shoender, J., Fletcher, R. J., Blaum, N., and McCleery, R. A. (2018). Shrub encroachment and vertebrate diversity: A global meta-analysis. Glob. Ecol. Biogeogr. 27, 368–379. doi:10.1111/geb.12675
Thompson, J. A., Zinnert, J. C., and Young, D. R. (2017). Immediate effects of microclimate modification enhance native shrub encroachment. Ecosphere 8, e01687. doi:10.1002/ecs2.1687
Throop, H. L., and Archer, S. R. (2008). Shrub (Prosopis velutina) encroachment in a semidesert grassland: spatial-temporal changes in soil organic carbon and nitrogen pools. Glob. Change Biol. 14, 2420–2431. doi:10.1111/j.1365-2486.2008.01650.x
Travers, S. K., Eldridge, D. J., Val, J., and Oliver, I. (2019). Rabbits and livestock grazing alter the structure and composition of mid-storey plants in a wooded dryland. Agric. Ecosyst. Environ. 277, 53–60. doi:10.1016/j.agee.2019.03.003
Turnbull, L., Wainwright, J., Brazier, R. E., and Bol, R. (2010). Biotic and abiotic changes in ecosystem structure over a shrub-encroachment gradient in the southwestern USA. Ecosystems 13, 1239–1255. doi:10.1007/s10021-010-9384-8
Turpin-Jelfs, T., Michaelides, K., Biederman, J. A., and Anesio, A. M. (2019). Soil nitrogen response to shrub encroachment in a degrading semi-arid grassland. Biogeosciences 16, 369–381. doi:10.5194/bg-16-369-2019
Van Auken, O. W. (2009). Causes and consequences of woody plant encroachment into Western North American grasslands. J. Environ. Manage. 90, 2931–2942. doi:10.1016/j.jenvman.2009.04.023
Venter, Z. S., Cramer, M. D., and Hawkins, H.-J. (2018). Drivers of woody plant encroachment over Africa. Nat. Commun. 9, 2272. doi:10.1038/s41467-018-04616-8
Wang, J., and Xu, C. (2017). Geodetector: Principle and prospective. Acta Geogr. Sin. 72, 1116–1134. doi:10.11821/dlxb201701010
Wang, Y., Zhang, X., and Huang, C. (2009). Spatial variability of soil total nitrogen and soil total phosphorus under different land uses in a small watershed on the Loess Plateau, China. Geoderma 150, 141–149. doi:10.1016/j.geoderma.2009.01.021
Wang, J., Li, X., Christakos, G., Liao, Y., Zhang, T., Gu, X., et al. (2010). Geographical detectors-based health risk assessment and its application in the neural tube defects study of the Heshun region, China. Int. J. Geogr. Inf. Sci. 24, 107–127. doi:10.1080/13658810802443457
Wang, J. F., Zhang, T. L., and Fu, B. J. (2016). A measure of spatial stratified heterogeneity. Ecol. Indic. 67, 250–256. doi:10.1016/j.ecolind.2016.02.052
Wang, T., Kang, F., Cheng, X., Han, H., Bai, Y., and Ma, J. (2017). Spatial variability of organic carbon and total nitrogen in the soils of a subalpine forested catchment at Mt. Taiyue, China. CATENA 155, 41–52. doi:10.1016/j.catena.2017.03.004
Ward, D., Trinogga, J., Wiegand, K., du Toit, J., Okubamichael, D., Reinsch, S., et al. (2018). Large shrubs increase soil nutrients in a semi-arid savanna. Geoderma 310, 153–162. doi:10.1016/j.geoderma.2017.09.023
Webster, R., Oliver, M. A., and Oliver, M. (2007). Geostatistics for environmental scientists. 2. ed. Hoboken, NJ: Wiley.
Western, A. W., Blöschl, G., and Grayson, R. B. (1998). Geostatistical characterisation of soil moisture patterns in the Tarrawarra catchment. J. Hydrol. 205, 20–37. doi:10.1016/S0022-1694(97)00142-X
Western, A. W., Zhou, S. L., Grayson, R. B., McMahon, T. A., Blöschl, G., and Wilson, D. J. (2004). Spatial correlation of soil moisture in small catchments and its relationship to dominant spatial hydrological processes. J. Hydrol. 286, 113–134. doi:10.1016/j.jhydrol.2003.09.014
Xin, Z., Qin, Y., and Yu, X. (2016). Spatial variability in soil organic carbon and its influencing factors in a hilly watershed of the Loess Plateau, China. CATENA 137, 660–669. doi:10.1016/j.catena.2015.01.028
Yang, Y., Dou, Y., Liu, D., and An, S. (2017). Spatial pattern and heterogeneity of soil moisture along a transect in a small catchment on the Loess Plateau. J. Hydrol. 550, 466–477. doi:10.1016/j.jhydrol.2017.05.026
Yu, L., Wang, H., Guo, T., Yang, Q., and Sun, Z. (2021). Bistable-state of vegetation shift in the desert grassland-shrubland anthropogenic Mosaic area. Acta Ecol. Sin. 41, 9773–9783. doi:10.5846/stxb202012023080
Zhao, B., Li, Z., Li, P., Xu, G., Gao, H., Cheng, Y., et al. (2017). Spatial distribution of soil organic carbon and its influencing factors under the condition of ecological construction in a hilly-gully watershed of the Loess Plateau, China. Geoderma 296, 10–17. doi:10.1016/j.geoderma.2017.02.010
Zhao, Y., Zhou, Y., and Wang, H. (2018). Spatial heterogeneities of soil water content under anthropogenic introduced shrub (Caragana Korshinskii) encroachment in desert grassland of the eastern Ningxia, China. Chin. J. Appl. Ecol. 29, 3577–3586. doi:10.13287/j.1001-9332.201811.001
Zhao, Y., Du, Y., Ma, Y., Zhao, Y., Zhou, Y., and Wang, H. (2019). Soil organic carbon dynamics and the prediction of their spatial changes in response to anthropogenically introduced shrub encroachment in desert steppe of the Eastern Ningxia, China. Chin. J. Appl. Ecol. 30, 1927–1935. doi:10.13287/j.1001-9332.201906.001
Zhao, Y., Yu, L., Zhou, Y., Ma, Q., and Lu, Q. (2020). Soil moisture dynamics and deficit of desert grassland with anthropogenic introduced shrub encroachment in the eastern Ningxia, China. Acta Ecol. Sin. 40, 1305–1315. doi:10.5846/stxb201812152735
Zhao, Y., Zhao, Y., Wang, H., Ma, Y., and Li, Z. (2021). Response of spatial heterogeneity and threshold value for soil water and aboveground biomass of desert grassland-shrubland anthropogenic transition in desert steppe of Ningxia, China. Sci. Silvae Sin. 57, 1–12. doi:10.11707/j.1001-7488.20211201
Zhou, Y., Boutton, T. W., and Wu, X. B. (2017a). Soil carbon response to woody plant encroachment: Importance of spatial heterogeneity and deep soil storage. J. Ecol. 105, 1738–1749. doi:10.1111/1365-2745.12770
Zhou, Y., Boutton, T. W., Wu, X. B., and Yang, C. (2017b). Spatial heterogeneity of subsurface soil texture drives landscape-scale patterns of woody patches in a subtropical savanna. Landsc. Ecol. 32, 915–929. doi:10.1007/s10980-017-0496-9
Zhou, Y., Boutton, T. W., and Wu, X. B. (2018a). Soil phosphorus does not keep pace with soil carbon and nitrogen accumulation following woody encroachment. Glob. Change Biol. 24, 1992–2007. doi:10.1111/gcb.14048
Zhou, Y., Boutton, T. W., and Wu, X. B. (2018b). Woody plant encroachment amplifies spatial heterogeneity of soil phosphorus to considerable depth. Ecology 99, 136–147. doi:10.1002/ecy.2051
Zhou, Y., Mushinski, R. M., Hyodo, A., Ben Wu, X., and Boutton, T. W. (2018c). Vegetation change alters soil profile δ15N values at the landscape scale. Soil Biol. biochem. 119, 110–120. doi:10.1016/j.soilbio.2018.01.012
Zhou, L., Shen, H., Chen, L., Li, H., Zhang, P., Zhao, X., et al. (2019). Ecological consequences of shrub encroachment in the grasslands of northern China. Landsc. Ecol. 34, 119–130. doi:10.1007/s10980-018-0749-2
Zhou, Y., Taylor, R. J., and Boutton, T. W. (2021). Divergent patterns and spatial heterogeneity of soil nutrients in a complex and dynamic savanna landscape. J. Geophys Res. Biogeosci 126. doi:10.1029/2021JG006575
Keywords: temperate desert steppe, geographic detector method, spatial heterogeneity, nitrogen, landscape scale, anthropogenic shrub encroachment
Citation: Zhao Y, Li Z, Cao Z, Mi W and Wang H (2023) Spatial patterns and drivers of soil total nitrogen in anthropogenic shrub encroachment in desert steppe. Front. Environ. Sci. 10:1058344. doi: 10.3389/fenvs.2022.1058344
Received: 30 September 2022; Accepted: 12 December 2022;
Published: 04 January 2023.
Edited by:
Na Li, Northeast Institute of Geography and Agroecology (CAS), ChinaReviewed by:
Shaokun Wang, Northwest Institute of Eco-Environment and Resources (CAS), ChinaNing Chen, Lanzhou University, China
Copyright © 2023 Zhao, Li, Cao, Mi and Wang. This is an open-access article distributed under the terms of the Creative Commons Attribution License (CC BY). The use, distribution or reproduction in other forums is permitted, provided the original author(s) and the copyright owner(s) are credited and that the original publication in this journal is cited, in accordance with accepted academic practice. No use, distribution or reproduction is permitted which does not comply with these terms.
*Correspondence: Wenbao Mi, bWl3YmFvQG54dS5lZHUuY24=; Hongmei Wang, d2htXzgyNkBueHUuZWR1LmNu