 Cai Li
 Fu-Jun Yue
 Si-Liang Li
 Jin-Feng Ge2
- 1School of Urban and Environment Science, Huaiyin Normal University, Huaian, China
- 2Institute of Surface-Earth System Science, School of Earth System Science, Tianjin University, Tianjin, China
- 3Tianjin Key Laboratory of Earth Critical Zone Science and Sustainable Development in Bohai Rim, Tianjin University, Tianjin, China
- 4Haihe Laboratory of Sustainable Chemical Transformations, Tianjin, China
The nitrogen contamination in rivers has become significant concern in arid and semiarid areas due to water resource shortage and extensive anthropogenic activities in relation to land-use changes in China. As a major nitrogen species, identifying driving factors, transformation and sources of nitrate is crucial for managing nitrogen pollution in rivers. In this study, nitrate sources and transformations were deciphered using physicochemical variables, molecular signature of dissolved organic matter and coupled isotopes of nitrate under different land use types in the Yang River, a typical farming-pastoral ecotone in the semi-arid area of North China. The results of river water showed a significant positive correlation between NO3− concentrations, δ15N-NO3− values and percentage of urban land and cropland, which confirmed the critical role of land use in the variations of riverine nitrate. The correlation between dissolved organic matter composition (aliphatic and lignin-like compounds) and NO3−/Cl− ratios as well as Cl− concentrations verified the effect of agricultural activities on nitrate source and transport. The variation in water chemical variables and dual isotopes of nitrate in river and soil extracts (δ15N-NO3− and δ18O-NO3−) was indicative of the concurrence of in-soil nitrification process and assimilation, whereas denitrification was inhibited under aerobic conditions in the semiarid area. The Bayesian model revealed that about 60% of nitrate was derived from non-point sources (manure, soil organic nitrogen and chemical fertilizer) and 36% from sewage. Although urban is not the major land-use type in the farming-pastoral ecotone, sewage contributed to about 36% of nitrate. The source identification of nitrate stresses the importance of the management of non-point pollution and demand for sewage treatment facilities in the farming-pastoral ecotone. This multiple-tracer approach will help gain deeper insights into nitrogen management in semi-arid areas with extensive human disturbance.
Introduction
Nitrogen contamination of rivers is of major concern since excessive nitrate inputs lead to ecological and human health impacts, such as eutrophication, coastal hypoxia, water acidification, and infant methemoglobinemia (Kendall et al., 2007; Gruber and Galloway, 2008; Shaaban et al., 2022). World large rivers have been polluted by nitrate, such as the Mississippi River, Seine River, Yangtze River, and Yellow River (Panno et al., 2006; Sebilo et al., 2006; Li et al., 2010; Liu et al., 2013). This risk of nitrate pollution tends to be higher in arid and semiarid areas due to the water resource shortage and extensive anthropogenic activities (Sanchez et al., 2017; Gutiérrez et al., 2018). Thus, identifying nitrate sources in rivers under an arid climate is crucial for controlling and mitigating nitrogen pollution.
The natural abundance of δ15N-NO3− and δ18O-NO3− in nitrate has proved to be a powerful tracer of nitrate source in rivers (Panno et al., 2006; Liu et al., 2013; Yi et al., 2020; Schleppi and Wessel, 2021; Zhang et al., 2021). For example, δ15N-NO3− can distinguish ammonium fertilizer (−4‰ − +4‰), soil organic nitrogen (+4‰ − +9‰) and manure and sewage (+5‰ − +25‰), while δ18O-NO3− can differentiate nitrate fertilizer (+17‰ − +25‰), atmospheric precipitation (>+60‰ for denitrifier method) and the nitrate produced from nitrification (−10‰ − +10‰) (Kendall et al., 2007 and references therein). Moreover, lighter N forms (14N and 16O) are preferentially metabolized by microorganisms during nitrate transformation processes. Thus the expected variation patterns in stable isotopes of nitrate can be used to trace the transformation processes. For example, δ15N-NO3− and δ18O-NO3− ratios show a simultaneous increase in the remaining NO3− during the denitrification process, distinguishing between denitrification and dilution (Kendall et al., 2007). However, overlapping different nitrate end-members and isotopic fractionation during transport and transformation processes could raise uncertainty about ascertaining nitrate sources (Mayer et al., 2002; Kendall et al., 2007; Li et al., 2019; Jiang et al., 2021). Additional information such as chemical parameters and land use characteristics is used to enhance the ability to identify nitrate sources (Mayer et al., 2002; Ohte et al., 2010; Taufiq et al., 2019; Chen et al., 2021). Considering the coupling relationship of carbon and nitrogen in ecological systems and the impact of land-use types on organic matter and nitrogen dynamics, an attempt can be made to use the organic-related variables as a tracer of nitrogen cycling.
Prior studies have demonstrated that land use pattern is an important controlling factor of nitrogen cycling. Notably, nitrogen geochemical character exhibits large spatial and temporal variations in semiarid ecosystems due to reactive nitrogen cycling in soil under wet conditions after the long-term dry period (Lohse et al., 2013). Thus, it can be hypothesized that the riverine nitrate concentrations are higher in the wet season than that in the dry season when the soil end-member is the predominant origin of nitrate in the semiarid areas. It is reported that a low level of nitrate concentrations and δ15N-NO3− values are generally observed in the forestland, while a high level of nitrate concentrations and δ15N-NO3− values in the urban and cropland areas (Mayer et al., 2002; Ohte et al., 2010; Jin et al., 2018; Taufiq et al., 2019; Yu et al., 2021). Thus, different land-use types have an individual pattern of nitrate concentrations and isotopic compositions that can be used to trace nitrate origins.
The farming-pastoral ecotone of northern China belongs to semi-arid climates, and it is reported to be an ecologically vulnerable area in China (Chen et al., 2021). Yang River, an important tributary of the upper Haihe River (one of the seven largest rivers in China), is located in the farming-pastoral ecotone of northern China. Previous studies show severe nitrogenous pollution in the aquatic environment of the Yang River (Kong et al., 2021; Yang et al., 2021). However, the identification of nitrate origins is limited in the Yang River. In the present study, an attempt was made to decipher the transformation processes and sources of nitrate in conjunction with the land use effect using a combination of dual isotopes of nitrate and physicochemical variables, DOM (dissolved organic matter) composition of river water, and land use data from the Yang River. The proportional contribution of nitrate source was estimated using the Bayesian model incorporating nitrogen and oxygen isotopic compositions of locally sampled end-members, including industrial wastewater, manure, soil, chemical fertilizer and atmospheric precipitation. This study might provide a new multiple-tracer approach to distinguishing riverine nitrate sources and transformation in a human-disturbed basin under arid regions.
Material and methods
Study area
Yang River is located in the upper Yongding River, which belongs to the Haihe River system, one of the seven largest rivers of China. Its headwater includes the Dongyang River from Inner Mongolia Autonomous Region and the Nanyang River from Shanxi Province, north China. These two headwater rivers merge in Hebei Province and finally drain into the Guanting Reservoir, an alternate drinking water source for Beijing Municipality, the capital of China (Dai et al., 2020).
The studied river is mainly located in Zhangjiakou city, Hebei Province, which is abundant in mineral resources and consequently has many industrial enterprises. It drains an area of 1.5 × 10⁴ km and has a length of about 262 km. The annual average temperature and precipitation are 6.9°C and 397.5 mm, respectively, with rainfall mainly concentrated between June to September (Dai et al., 2020; Yang et al., 2021). This basin has a temperate continental monsoon climate. It belongs to a typical Farming-Pastoral Ecotone, with cropland and grassland as the dominant land cover followed by forest and urban land (Figure 1, Supplementary Table S1). The main fertilizer applied include nitrogen fertilizer (compound fertilizer, ammonium and urea) and phosphate fertilizer (Wang et al., 2020). The average application of nitrogenous fertilizer and compound fertilizer was 4.26 × 10⁴ tons N and 6.10 × 10⁴ tons N in 2019 and 2020 in Zhangjiakou city, respectively (http://tjj.hebei.gov.cn/). The livestock animals in Zhangjiakou city are dominated by cattle and sheep and goats, with about 4.47×10⁵ and 1.67×10⁶ heads, respectively (http://tjj.hebei.gov.cn/).
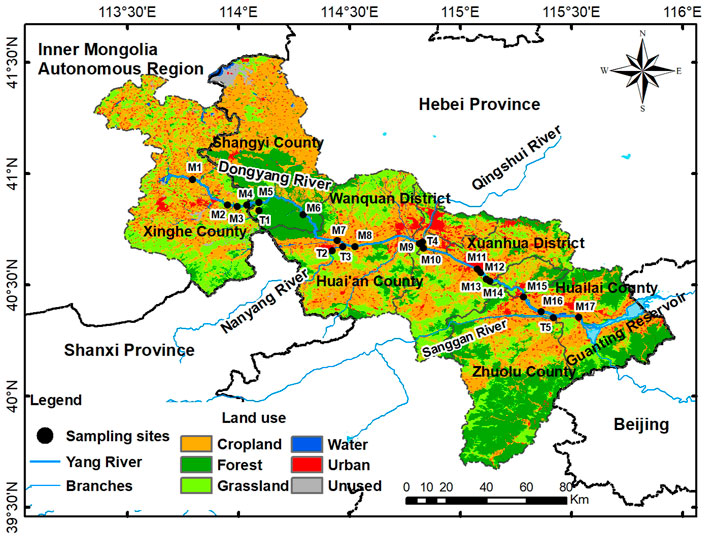
FIGURE 1. Land use types of Yang River and sampling locations in the study area.
Sampling and analyses
River water samples were collected from 17 sampling sites (M1–M17) in the mainstream and five sites (T1–T5) in the tributaries of the Yang River (Figure 1). Three sampling campaigns were conducted in December 2019 July 2020, and April 2021 along the Yang River, corresponding to the dry, wet, and normal seasons. The seasons are divided based on precipitation considering the precipitation of April, July and December accounted for 6%, 24% and 0.5% of annual precipitation, respectively, during the period of 2019 and 2020 (http://tjj.hebei.gov.cn/). Four snow samples were collected in December in the study area. All the water samples were filtered through 0.7-μm glass fiber filters (Whatman GF/F) with pre-combusted for 3 h at 450°C.
The field measurement for river water dissolved oxygen (DO) via a portable multi-parameter meter (WTW Multi 3430 IDS, Germany). An automatic flow analyzer determined the total dissolved nitrogen (TDN) concentrations (mg/L for N) and different forms of DIN concentrations (SKALAR Sans Plus Systems). The detection limit of TDN, NO2−-N, NO3−-N and NH4+-N is 0.02 mg/L, 5 μg/L, 0.01 mg/L and 0.01 mg/L, respectively. Dissolved organic nitrogen (DON) concentration (mg/L for N) was calculated by subtracting DIN from TDN. Chloride concentration was determined by Dionex ion chromatography (Dionex Corp. Sunnyvale, CA, United States) with a precision of ≤5%. A total organic carbon analyzer determined the dissolved organic carbon (DOC) (Aurora 1030W + 1088, OI Analytical, United States). Analytical errors were ≤1.5% for DOC according to triplicate sample measurements. The composition of DOM was analyzed in the wet season based on Fourier transform ion cyclotron resonance mass spectrometry (FT-ICR MS). The detailed analysis method for DOC concentration and DOM composition can be found in our another study (Ge et al., 2022). The nitrogen and oxygen isotopes of nitrate were measured by a bacterial denitrifier method, which reduces NO2−-N and NO3−-N to N2O via a special kind of denitrifying bacteria with a lack of N2O reductase (Sigman et al., 2001; Casciotti et al., 2002). After purification, the nitrogen and oxygen isotopes of N2O were determined by an isotope ratio mass spectrometer (Delta V, Thermo Fisher). The international standards (USGS-32, USGS-34, USGS-35, IAEA-NO3) were used for calibration of the dual isotopes of nitrate (Yue et al., 2020). The delta (δ) notation in parts per thousand (‰) is reported to express the isotopic compositions of nitrate relative to the international standards (VSMOW for δ18O, atmospheric N2 for δ15N).
Eight soil samples (0–10 cm) were collected on the riverbank from cropland (2 samples from site M1, one from M9 and one from M15) and forest and grass land (1 sample from site M6 and three from M2) in July 2020. The nitrate in fresh soil were extracted with 2 M KCl solution in a 1:4 mass ratio (soil: solution) after 1 hour of shaking (Rock et al., 2011). The nitrate concentration of KCl solution was below the detection limit by combusting KCl at 450°C for 4 hours (Wang et al., 2018). The nitrate extracted from soil was determined for dual isotopes of nitrate using the above bacterial denitrifier method. Additionally, some air-dried soil samples were sieved to 100 mesh for measuring the isotope of particle nitrogen in soil using isotope ratio mass spectrometer (Delta V, Thermo Fisher).
Statistical analyses
Based on Landsat Thematic Mapper imagery (30 m resolution), land use types were classified and the percentage of different land-use types was calculated by ArcMap 10.2 (Supplementary Table S1). Five riparian buffer zones of 500 m, 1 km, 3 km, 5 km, and 8 km were extracted to evaluate the influence of land use on the nitrogen source and transformation using Spearman’s correlation coefficients due to the non-normally distribution of data set. After the correlation analysis between nitrogen-related parameters and the percentage of land use in each buffer zone, the significant correlations were observed in 3-km buffer zones with discussed in detail in the below section unless otherwise noted. Linear regression analysis was used for trend analysis among nitrogen-related variables. Kruskal–Wallis non-parametric test (K-W test) was used to test the seasonal and temporal differences in concentrations of different nitrogen species as well as dual isotopes of nitrate. Principal Component Analysis (PCA) can be used to reduce data dimensionality by converting large data sets into several principal components (PCs), which “represent a process influencing the data” (Matiatos, 2016). In this study, four pCs were retained when eigenvalues were greater than 1. The data of TDN concentrations were not included during PCA analysis considered the significant correlation between TDN concentrations and almost all the variables. Of note, two sampling sites (M2 and M14) were excluded from the above correlation and PCA analysis due to their scattered pattern, which might be related to other complicated factors besides land use. The contribution of nitrate sources was estimated by a Bayesian mixing model, which was implemented in a Stable Isotope Analysis in the R (SIAR) package. The details of set-up parameters can be found in previous studies (Parnell et al., 2010; Xia et al., 2017) and our published studies (Li et al., 2019; Yue et al., 2020). The isotopic values of nitrate end-members for the SIAR were listed in Supplementary Table S2. All of the statistical analyses were carried out in R 4.1.2.
Results
Spatio-temporal variations in riverine dissolved nitrogen concentrations
Total dissolved nitrogen (TDN) ranged from 0.59 mg/L to 23.96 mg/L, with a significantly higher average value in the dry season (7.96 ± 5.15 mg/L) than that of the wet season (3.59 ± 2.41 mg/L, p < 0.05, Supplementary Figure S1). About 80% of samples exceed Class V (2 mg/L) based on Chinese quality standards for surface water (GB3838-2002). The high TDN concentrations occurred in sites with more urban distribution and the correlation between dissolved nitrogen and land use types will be presented below.
Among different species of TDN, NO3−-N is the primary form, followed by DON, NH4+-N and NO2−-N. Most samples’ NO3− concentrations accounted for >50% of TDN. The NO3−-N concentrations varied from 0.10 mg/L to 20.61 mg/L, with a significantly higher level in the dry season (6.42 ± 4.39 mg/L) than in two other seasons (Figure 2). A higher level of NO3−-N was found in the lower stream with more cropland and urban land even if no significant difference was found between the upper and lower streams (Figure 2).
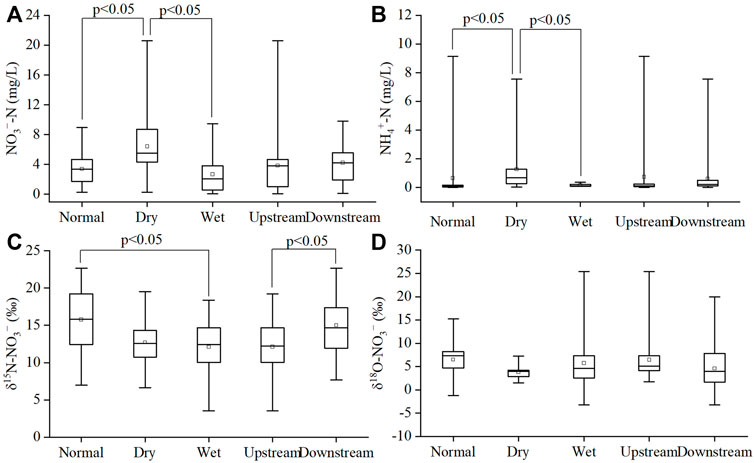
FIGURE 2. Box plot of seasonal and spatial variations in (A) NO3−-N concentrations and (B) NH4+-N concentrations as well as (C) δ15N-NO3− and (D) δ18O-NO3− in the Yang River. Boxplots denote the 25th, 50th and 75th percentiles, respectively, and the whiskers indicate the maximum and minimum values.
The seasonal pattern of NH4+-N concentrations was similar to TDN and NO3−-N, with a significantly higher level in the dry season (1.26 ± 1.80 mg/L) than in normal season (0.65 ± 1.97 mg/L) and wet season (0.17 ± 0.10 mg/L, Figure 2). According to the Chinese quality standard for surface water, several samples had NH4+-N concentrations beyond the Class V (2 mg/L) guideline (GB3838-2002). In contrast, DON concentrations showed a different seasonal pattern, with a significantly higher level in the normal season (1.13 ± 0.62 mg/L) than that of the wet season (0.60 ± 0.36 mg/L) and dry season (0.18 ± 0.18 mg/L, Supplementary Figure S1). The peak concentrations of DON occurred in the site (M11) close to industrial areas and then kept an elevated level in the lower reach with a high proportion of cropland and urban land. Indeed, the downstream had significantly higher DON concentrations than that of upstream (Supplementary Figure S1). NO2−-N was detected in most samples, but it was the lowest among the different nitrogen forms, with most sites having about 1% of TDN. However, several samples in the wet season had NO2−-N concentrations accounting for >5% of TDN. The NO2−-N concentrations showed a significantly spatial difference with a higher level in the downstream than that of upstream (Supplementary Figure S1).
Spatio-temporal variations in dual isotopes of nitrate
The δ15N-NO3− values displayed seasonal changes with a significantly higher mean in the normal season (+15.8 ± 4.3‰) than that of the wet season (+12.1 ± 3.9‰, Figure 2C). However, the dry season did not show a higher δ15N-NO3− value (+12.7 ± 3.2‰) than other seasons when compared with a general pattern of global rivers, which had an about one‰ increase in δ15N-NO3− in dry seasons than different seasons (Matiatos et al., 2021). The δ15N-NO3− values exhibited apparent spatial variations, with a significantly higher level in the lower stream (+15.0 ± 3.9‰) than that of the upper stream (+12.1 ± 4.0‰). The average values of δ18O-NO3− followed the order of normal season > wet season > dry season, but they did not show significant seasonal differences among the three seasons (Figure 2D).
Correlation between nitrogen-related variables
Figure 3 displays the correlation between land use types and the dissolved nitrogen species and dual isotopes of nitrate. A significant positive correlation was observed between the percentage of the urban area and annual mean concentrations of TDN, NO3−-N, DON, Cl− as well as δ15N-NO3− values (Figure 3A). As for the cropland, the percentage of cropland showed a positive correlation with annual mean concentrations of TDN, NO3−-N and δ15N-NO3− values. In contrast, a significant negative correlation was found between the percentage of forest and grassland and annual mean concentrations of TDN, NO3−-N, DON, Cl− as well as δ15N-NO3− values. In the dry season, a positive correlation was observed between concentrations of NO2−-N and NH4+-N as well as NO3−-N, and δ15N-NO3− values were positively correlated with NO3− concentrations and Cl− concentrations (Figure 3B). In the normal season, δ15N-NO3− values were positively correlated with δ18O-NO3− values and DON concentrations, and NO3− concentrations were positively correlated with DON and Cl− concentrations (Figure 3C). In the wet season, a positive correlation was also observed between concentrations of NO2− and NH4+ as well as DO (Figure 3D), which was similar to the dry season.
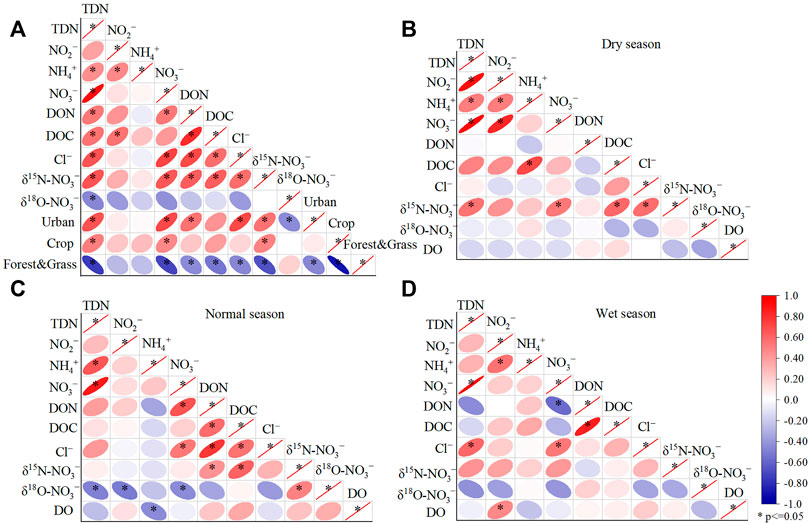
FIGURE 3. (A) Correlations between land use types and arithmetic mean concentrations of nitrogen-related variables during the sampling time in the Yang River; (B–D) Correlations among nitrogen-related variables in different seasons in the Yang River.
Discussion
Driving forces of nitrate pattern
North China is dominated by the service industry, commerce and manufacturing industry, which contribute significant amounts of nitrogenous compounds to rivers (Zhang et al., 2021). Thus, the average NO3−-N concentration in Yang River (4.04 ± 3.42 mg/L) was comparable to the average level of North China (4.74 ± 9.24 mg/L, Zhang et al., 2021) but was much higher than that of South China (1.74 ± 0.5 mg/L, Zhang et al., 2021). Likewise, the average of δ15N-NO3− in Yang River (+13.6 ± 4.2‰) was similar to the average δ15N-NO3− in North China (+12.6‰) but was much higher than that of South China (+8.1‰, Zhang et al., 2021). The higher levels of nitrogen concentration and δ15N-NO3− were also reported in other rivers with more distribution of cropland and urban land (Mayer et al., 2002; Qin et al., 2018; Wong et al., 2018).
To examine the effect of land use type on nitrate pattern, the correlations were analyzed between the riverine dissolved nitrogen concentrations and different land-use shares. There is a significant positive correlation between urban ratios and annual mean concentrations of TDN, DON and NO3−-N as well as δ15N-NO3− values (Figure 3A), which was also reported in other studies (Ohte et al., 2010; Taufiq et al., 2019). The increasing urban area would lead to more domestic and industrial wastewater release, causing elevated nitrogenous concentrations and δ15N-NO3− values. The significant positive correlation between the percentage of urban land and both the DON and DOC concentrations (Figure 3A) also reflected the influence of domestic wastewater on organic matter variations. The negative correlation between forest and grassland area ratios and concentrations of TDN, DON and NO3−-N as well as δ15N-NO3− values (Figure 3A) indicated that the role of forest and grass in nitrogen removal via assimilation or adsorption (Mayer et al., 2002; Ohte et al., 2010; Taufiq et al., 2019). A significant positive correlation was found between the percentage of cropland and TDN concentrations, NO3−-N concentrations and δ15N-NO3− values, indicative of the contribution of agricultural activities to nitrogen variations in the Yang River, which was also reported in other studies (Mayer et al., 2002; Qin et al., 2018; Wong et al., 2018). Overall, the land-use types play an important role in variations of nitrogenous concentrations and δ15N-NO3− values in the Yang River.
The main factors driving the nitrate concentrations were identified using PCA from nitrogen-related variables. The PCA identified four principal components (PC1, PC2, PC3 and PC4) with accounting for 85.8% of the total variance for the nitrogen-related variables in the Yang River (Figure 4). The PC1 explained 47.1% of the variance with the three major land use types included, which suggested that PC1 reflected the effects of land use on nitrate pollution. The PC1 had positive loadings for NO3−-N, DON, DOC, Cl−, δ15N-NO3−, urban ratios and cropland ratios, indicating the nitrate sources from urban and agricultural activities. However, the negative loading for forest and grass areas ratios in the PC1 reflected the role of forest and grassland in water purification as discussed in the above correlation analysis. The PC2 explained 15.5% of the variance, with positive loadings for NH4+-N, NO2−-N and cropland but a negative loading for Cl−. The PC2 did not represent the nitrate source from agricultural activities, otherwise the positive loadings would be observed for both cropland and Cl− since high Cl− concentrations were reported in cropland due to the application of manure or organic fertilizer (Liu et al., 2006). Therefore, the PC2 might suggest the transformation of nitrogen (nitrification process) in the cropland as indicated by the positive loadings for both NH4+ and NO2−, which acted as the reactant and intermediate products of nitrification, respectively. The PC3 explained 13.0% of the variance, with positive loadings for NO2−-N, NH4+-N and forest and grass while a negative loading for cropland and δ18O-NO3−, which suggested the nitrification process in forest and grassland since the nitrification process is closely associated with variations in δ18O-NO3− values, NO2−-N and NH4+-N concentrations. The PC4 explained 10.3% of the variance, with positive loadings for δ15N-NO3−, δ18O-NO3−, DON, DOC and forest and grassland ratios while a negative loading for NO3−-N, which suggested the assimilation process since a simultaneous increase occurred in δ15N-NO3− and δ18O-NO3− while a decrease in NO3−-N concentrations as plants absorbed nitrate. The denitrification is excluded from the above transformation process, which would be discussed in detail in the next section.
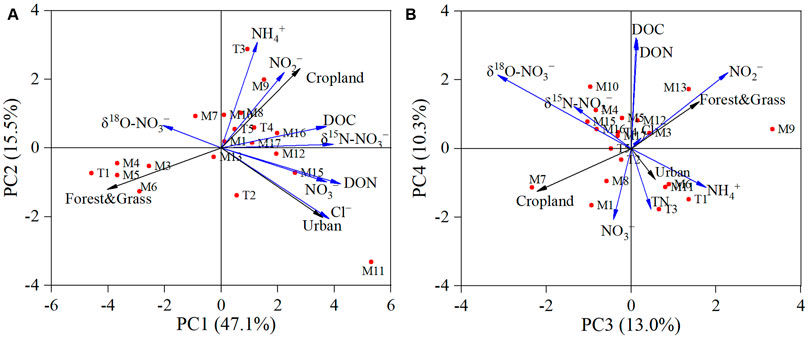
FIGURE 4. (A–B) PCA of arithmetic mean nitrogen-related variables during the sampling time in the Yang River. Arrows represent loadings of each variable with longer arrow indicating larger magnitude of loading.
Transformation of nitrate
Nitrogen transformations, such as nitrification, denitrification and assimilation, may alter the nitrogen concentrations and involve isotopic fractionation in the aquatic system. Thus, it is needed to ascertain the nitrogen transformations before identifying nitrate sources. Nitrification is the oxidation process of ammonium and consequently creates nitrate as products with NO2− as intermediate products under aerobic conditions. δ18O-NO3− can be used as a tracer of nitrification since one oxygen atom of nitrification-derived nitrate is derived from ambient oxygen molecules and the other two oxygen atoms from ambient water molecules (Andersson and Hooper, 1983). Thus, δ18O-NO3− of nitrification can be calculated according to δ18O-O2 (23.5‰, Amberger and Schmidt, 1987) and δ18O of river water in the studied basin (−14.6‰ to −7.2‰, Kong et al., 2021). As a result, the theoretical δ18O-NO3− is estimated to range from −1.9‰ to +3.0‰. About 22% of river water samples fell into this estimated range, indicating that only a part of nitrate was derived from in-stream nitrification with mainly observed in dry and wet seasons based on the δ18O-NO3− values. However, most samples in the Yang River had δ18O-NO3− values higher than the estimated δ18O-NO3−, while they fell into the range of microbial nitrification, characterized by a range of −10‰ to +10‰ (Kendall et al., 2007). This pattern reflected the in-soil nitrification during the movement of nitrate to river, which was similar to another study (Xuan et al., 2022). Moreover, the δ18O-NO3− of soil extracts (−4.6‰ to +8.8‰) covered the range of δ18O-NO3− for most samples of the river water in the studies area (Figure 5), which also verified the critical role of the in-soil nitrification process.
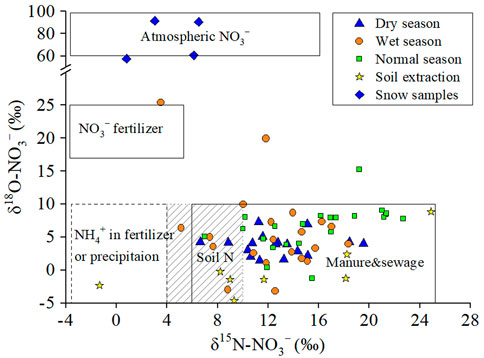
FIGURE 5. Coupled isotopic compositions of nitrate for river water, soil extracts, and snow samples in the Yang River and typical nitrate endmembers (Kendall et al., 2007; Widory et al., 2013).
In addition to δ18O-NO3−, δ15N-NO3− and other variables can also be used to trace the nitrification process. When ammonium is limited, δ15N-NO3− values tend to be close to soil organic nitrogen with depleted 15N/14N ratios (Kendall et al., 2007). In the Yang River, NH4+-N concentrations were much lower in the normal season and wet season than that in the dry season (Figure 2B), which might result from rapid nitrification (Sanchez et al., 2017; Yue et al., 2020). As intermediate products of nitrification, the NO2− concentrations increased with the elevated NH4+ concentrations in the wet season and dry season (Figures 3B,D), corroborating the occurrence of the in-stream nitrification process during these two seasons, which was in line with the above conclusion inferred by δ18O-NO3− variations. Furthermore, the decreasing δ15N-NO3− values with an increasing NO3−/Cl− ratios (Figure 6A) also confirmed the nitrification in the normal season (Jiang et al., 2021). Alternatively, the correlations between δ15N-NO3− and NO3−/Cl− reflected the mixing process between different nitrate sources, discussed in the next section.
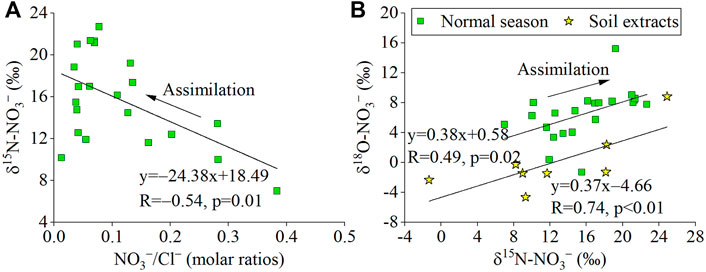
FIGURE 6. (A–B) Relationship between δ15N-NO3− values and NO3−/Cl− ratios as well as δ18O-NO3− values in the normal season of Yang River.
During natural attenuation by denitrification, the residual nitrate is preferentially enriched in 15N and 18O, with a rough ratio of 1.3:1 to 2:1 (Kendall et al., 2007). In this study, a significant positive correlation was found between δ15N-NO3− and δ18O-NO3− in the normal season (Figure 6B), but its ratios (δ15N:δ18O = 3.3, the inverse of slope) fell outside the expected ratios of denitrification. Thus, the denitrification process of surface water is not plausible to occur based on the above variation trend of nitrate isotopes and high DO concentrations (10.26 ± 1.23 mg/L, Supplementary Figure S2). The lack of denitrification in the Yang River is consistent with the study on nitrate transformation of groundwater in the Yang River basin (Yang et al., 2021), which reported the oxic conditions and weak correlation of δ15N-NO3− and δ18O-NO3− in the groundwater of studied area. This is also in accordance with previous studies in the semiarid aquifer systems, where denitrification is inhibited due to the oxic conditions while nitrification is allowed to accumulate nitrate (Sanchez et al., 2017; Gutiérrez et al., 2018; Ma et al., 2021). Although there is a lack of denitrification process in the surface water of Yang River, denitrification process might occur in the sediment. However, the effect of benthic denitrification on overlying water could be negligible since the coupled nitrification–denitrification within sediments would be decreased under the high NO3− concentrations and O2 levels in overlying water column (Rysgaard et al., 1994).
Assimilation might occur in the Yang River given the supersaturated state of DO by photosynthesis at some sampling sites. It is reported that assimilation causes a simultaneous increase of δ15N and δ18O in a 1:1 ratio during NO3− uptake by phytoplankton (Granger et al., 2004). However, the expected isotopic signal of assimilation was not observed as reflected by the scattered trend of δ15N-NO3− and δ18O-NO3− in the wet and dry season. Even if δ15N-NO3− was positively correlated with δ18O-NO3− in the normal season, the slope of δ18O:δ15N (0.38) was much lower than 1 (Figure 6B). The lack of isotopic signal of assimilation might be related to repression of NO3− uptake by elevated NH4+ concentration (>1.5 μmol/L, Montoya et al., 1991). But the NO3− uptake cannot be completely ruled out since the δ15N-NO3− values increased with the decreasing NO3−/Cl− ratios (Figure 6A). Another reason for the weak signal of assimilation might be the concurrence of assimilation and nitrification in soil, where in-soil nitrification result in a much lower enrichment of δ18O-NO3− than δ15N-NO3− as reflected by the soil extracts (δ18O: δ15N = 0.37, Figure 6B).
Qualitative identification of nitrate sources
According to the land use of the studied area (Figure 1), the potential nitrate sources included chemical fertilizer (CF), soil organic nitrogen (SON), manure and sewage. NO3−/Cl− ratios are reported to distinguish nitrate sources (Liu et al., 2006; Xia et al., 2017). Sewage is featured by relatively high NO3−/Cl− ratios and Cl− concentrations, whereas manure is characterized by low NO3−/Cl− ratios and high Cl− concentrations as animal manure has low NO3− and high Cl− concentrations (Liu et al., 2006; Xia et al., 2017). Chemical fertilizer is marked by high NO3−/Cl− ratios and low Cl− concentrations. As shown by the graph of NO3−/Cl− ratios vs Cl− concentrations (Supplementary Figure S3), the Yang River had a mixing of CF, manure and sewage. Rainwater might also contribute nitrate to the river since some samples had low NO3−/Cl− ratios and low Cl− concentrations. The negative correlation of NO3−/Cl− and δ15N-NO3− (Figure 6A) also reflected the mixture between two different nitrate sources, with one source having low δ15N-NO3− values and high NO3−/Cl− (like CF), and the other one having high δ15N-NO3− values and low NO3−/Cl− (like manure).
As plotted in Figure 5, most dual isotopes of nitrate fell into the range of manure, sewage and SON, indicating their dominant contribution to riverine nitrate in the Yang River. Seasonally, the significantly higher δ15N-NO3− values in the normal season were indicative of 15N-enriched origins, i.e., sewage and manure. Spatially, a significantly higher δ15N-NO3− in the lower reach suggested an increasing contribution of sewage and manure, in accordance with the increasing ratios of urban and cropland down the river. The positive correlation of urban (or cropland) ratios and NO3−-N concentrations and δ15N-NO3− values (Figure 3A) also confirmed the influence of sewage and manure. Although one sample fell into the range of synthetic nitrate fertilizer, nitrate fertilizer was not commonly applied in China (<2%, Liu et al., 2013). Moreover, compound fertilizer, ammonium and urea are the main synthetic fertilizer in the study area. Thus, the influence of synthetic fertilizer should be taken into account when considering the wide distribution of cropland in the Yang River and the positive correlation of cropland area and concentrations of TDN and NO3−-N as well as δ15N-NO3− values (Figure 3A). One soil extracts sample fell into the range of ammonium fertilizer, while other soil extracts samples fell into the range of SON and manure, which coincided with the application of animal waste (sheep and cattle) as base fertilizer before planting winter wheat in the study area. Under the semi-arid climate, Yang River is mainly recharged by rainfall during the wet season. Thus, atmospheric precipitation (AP) is a possible nitrate source for the Yang River.
In addition to physicochemical parameters and nitrate isotopes, DOM composition could also be used to trace nitrate source and transformation, given the coupling relationship of carbon and nitrogen in the aquatic environment. It has been reported that DOM molecular signatures are related to land use types with cropland streams enriched in aliphatic and lignin-like compounds (Spencer et al., 2019; Ge et al., 2022). Our another study on molecular signatures of DOM in the Yang River indicated that DOM was predominantly from allochthonous inputs in association with land use types (Ge et al., 2022). Generally, the relative abundance of lignin-like compounds ranged from 77.5% to 90.5%, with high abundance found in cropland dominated sites in the study area. The relative abundance of aliphatic compounds ranged from 1.9% to 14.6%, with high abundance found in urban area (Ge et al., 2022). Correspondingly, the relative abundances of aliphatic compounds were positively correlated with Cl− concentrations and negatively correlated with NO3−/Cl− ratios (Figures 7A,B), which might reflect the mixing process of different nitrate sources, one was manure with high Cl− concentrations and low NO3−/Cl− ratios and the other one was synthetic fertilizer with a contrast pattern (Liu et al., 2006). Livestock farming is relatively developed in the Yang River and animal manure could contribute to DOM and then be degraded to inorganic nitrogen via mineralization and nitrification. The relative abundances of lignin were negatively correlated with Cl− concentrations and positively correlated with NO3−/Cl− ratios (Figures 7C,D), indicating the transport of synthetic fertilizer-derived nitrate along with lignin when considering the lignin as a refractory component and terrestrial tracer (Kirk and Farrell, 1987; Ni et al., 2020a; 2020b). To sum up, a suite of water chemical parameters, DOM composition and nitrate isotopes confirmed the inputs of manure, sewage, SON, CF and AP for riverine nitrate in the Yang River.
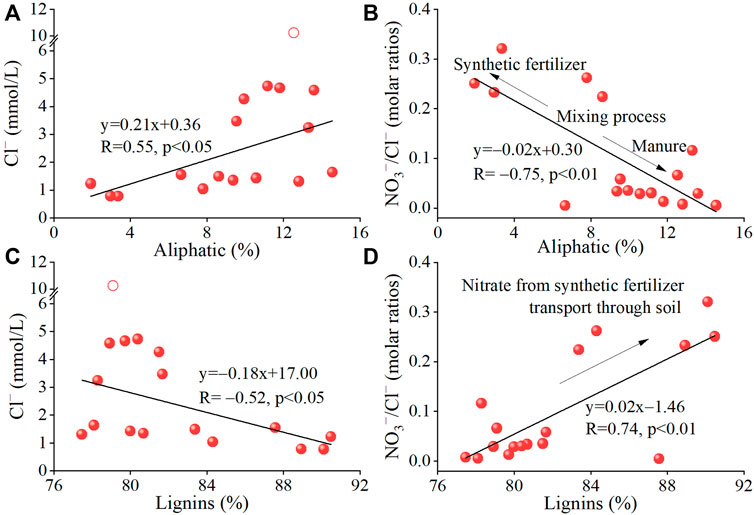
FIGURE 7. (A–B) Relationship between relative abundances of aliphatic and Cl− concentrations as well as NO3−/Cl− ratios; (C–D) Relationship between relative abundances of lignin and Cl− concentrations as well as NO3−/Cl− ratios in the wet season along the mainstream of Yang River. In Figures 7A,B, one sample (M11) was not included due to its deviation, which might be related to its proximity to the sewage outlet.
Spatio-temporal proportional contributions of nitrate sources
The SIAR model estimated the proportional contribution of the nitrate sources aforementioned. The nitrate sources’ mean probability estimate (MPE) was plotted in Figure 8. As shown by the mixing model outputs, sewage was the dominant nitrate source (36% ± 20%). Manure, SON and CF contribution were intermediate (26% ± 17%, 19% ± 14%, 15% ± 11%), and AP contributed the least (4% ± 5%). This result agreed with the estimation of the whole Haihe River basin with manure and sewage, SON, CF and AP accounting for 39%–97%, 0%–44%, 0%–16% and 0%–12%, respectively (Zhang et al., 2021).
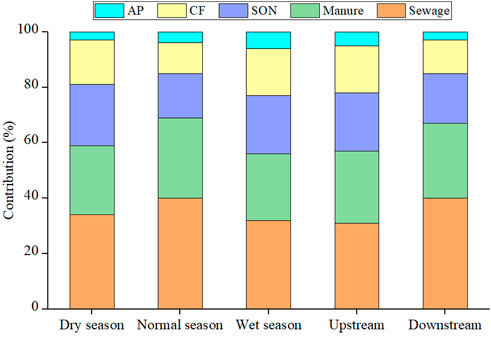
FIGURE 8. The mean proportional contribution of the nitrate sources in the Yang River.
Overall, the proportion of nitrate sources varied seasonally and temporally. Sewage and manure contributed the most in the normal season (41% ± 21%, 29% ± 19%) relative to the other two seasons (Figure 8). The pattern of higher sewage and manure contribution in the normal season (spring) was similar to another study, which indicated that sewage and manure was frozen and trapped in riverbanks in winter while it turned to melt and enter the river in spring (Jiang et al., 2021). For another reason, animal waste (sheep and cattle) was used in winter as base fertilizer in the study area, and this organic fertilizer could be nitrified in the following spring. Consequently, the nitrification-derived nitrate would be leached to river water during irrigation and rainfall events in spring. The elevated δ15N-NO3− values with increasing cropland area (Figure 3) confirmed the livestock manure as a kind of organic fertilizer during agricultural activities in the Yang River basin. Spatially, the higher proportion of sewage was found in the downstream of Yang River, which has more urban area than the upper stream (Figure 8).
Compared with the wide distribution of cropland, CF only contributed 15% of nitrate, which might be related to China’s action of zero growth in chemical fertilizer by 2020 (MARC, 2015) and natural attenuation such as in situ and riparian attenuation as well as nitrate infiltration into groundwater. Nitrate attenuation via denitrification can be excluded, as discussed before, in the semi-arid area. Thus, the nitrogen attenuation via biological assimilation could be one reason for the low contribution of CF relative to the extensive distribution of cropland when considering the negative correlation between nitrate concentrations and forest and grassland area (Figure 3A). Nitrate infiltration to groundwater could also be an important cause, as reflected by the lower riverine NO3−-N concentrations in Yang River (4.04 mg/L) relative to groundwater with an average of 6.15 mg/L during our sampling periods (Yang et al., 2021). Although CF contributed less, the non-point sources (manure, SON and CF) accounted for 60% of nitrate. Thus, the non-point sources should be paid more attention to management of nitrogen pollution.
The contribution of AP was the lowest, which was comparable to other reports (Matiatos, 2016; Yi et al., 2020; Jiang et al., 2021). The AP contribution was slightly higher in the normal and wet seasons than in the dry season. However, the seasonal difference was not significant. A spatial variation occurred in the Yang River, with a higher proportion in the upper stream than in the lower stream. The upper stream has more forest and grassland cover distribution, which might increase input from atmospheric NO3− due to the interception of wet deposition by forest and grass.
Conclusion
The driving forces, transformations and sources of nitrate were identified using physicochemical variables, DOM composition and nitrate isotopes in the Yang River, a typical farming-pastoral ecotone in the semi-arid area. The results indicated that various patterns of nitrate concentrations and nitrogen isotopic compositions were significantly affected by the cropland and urban land in the Yang River. The relationship between DOM composition (aliphatic and lignin) and NO3−/Cl− ratios as well as Cl− concentrations confirmed the influence of agricultural activities. Nitrate was produced via nitrification process mainly before being transported to the river with occurrence of assimilation to some extent, whereas denitrification was inhibited due to the oxic conditions in the semi-arid basin. The outputs of the SIAR model indicated that non-point sources (manure, SON and CF) contributed the most of nitrate (60%), followed by sewage and AP in the study basin. Because nitrate attenuation via denitrification is limited in the semi-arid area, the control and management of nitrogen contamination turn out to be particularly important for water quality improvement, especially for non-point source. Even though urban land is not the primary land-use type, sewage contributed to about one-third of nitrate, reflecting the urgency of more sewage treatment plants in the farming-pastoral ecotone. The multiple-tracer approach proves helpful in identifying nitrate fate using a combination of physicochemical parameters, DOM composition and nitrate isotopes.
Data availability statement
The data analyzed in this study is subject to the following licenses/restrictions: dataset can be available on the require to the corresponding author. Requests to access these datasets should be directed to Cai Li, cai_li@hytc.edu.cn.
Author contributions
Methodology: CL and F-JY. Sample collection and formal analysis: CL, YQ, J-FG and S-NC. Writing—original draft: CL and F-JY. Writing—review and editing: CL, F-JY, S-LL and YQ.
Funding
This work is financially supported by the National Natural Science Foundation of China (Grant No. 41907271, 41925002, 42073076) and the funding from the Haihe Laboratory of Sustainable Chemical Transformations of Tianjin.
Conflict of interest
The authors declare that the research was conducted in the absence of any commercial or financial relationships that could be construed as a potential conflict of interest.
Publisher’s note
All claims expressed in this article are solely those of the authors and do not necessarily represent those of their affiliated organizations, or those of the publisher, the editors and the reviewers. Any product that may be evaluated in this article, or claim that may be made by its manufacturer, is not guaranteed or endorsed by the publisher.
Supplementary material
The Supplementary Material for this article can be found online at: https://www.frontiersin.org/articles/10.3389/fenvs.2022.1061857/full#supplementary-material
References
Amberger, A., and Schmidt, H. L. (1987). Natürliche Isotopengehalte von Nitrat als Indikatoren für dessen Herkunft. Geochim. Cosmochim. Acta 51 (10), 2699–2705. doi:10.1016/0016-7037(87)90150-5
Andersson, K. K., and Hooper, A. B. (1983). O2 and H2O are each the source of one O in NO2− produced from NH3 by nitrosomonas: 15N-NMR evidence. FEBS Lett. 164 (2), 236–240. doi:10.1016/0014-5793(83)80292-0
Casciotti, K. L., Sigman, D. M., Hastings, M. G., Böhlke, J. K., and Hilkert, A. (2002). Measurement of the oxygen isotopic composition of nitrate in seawater and freshwater using the denitrifier method. Anal. Chem. 74 (19), 4905–4912. doi:10.1021/ac020113w
Chen, X., An, P., Laakso, K., Arturo Sanchez-Azofeifa, G., Wang, F., Zhang, G., et al. (2021). Satellite-based observations of the green depressing cropping system in a farming-pastoral ecotone of northern China. Int. J. Appl. Earth Obs. Geoinf. 98, 102312. doi:10.1016/j.jag.2021.102312
Dai, D., Xu, X., Sun, M., Hao, C., Lv, X., and Lei, K. (2020). Decrease of both river flow and quality aggravates water crisis in North China: A typical example of the upper Yongding River watershed. Environ. Monit. Assess. 192 (7), 421. doi:10.1007/s10661-020-08371-6
Ge, J., Qi, Y., Li, C., Ma, J., Yi, Y., Hu, Q., et al. (2022). Fluorescence and molecular signatures of dissolved organic matter to monitor and assess its multiple sources from a polluted river in the farming-pastoral ecotone of northern China. Sci. Total Environ. 154575, 154575. doi:10.1016/j.scitotenv.2022.154575
Granger, J., Sigman, D. M., Needoba, J. A., and Harrison, P. J. (2004). Coupled nitrogen and oxygen isotope fractionation of nitrate during assimilation by cultures of marine phytoplankton. Limnol. Oceanogr. 49 (5), 1763–1773. doi:10.4319/lo.2004.49.5.1763
Gruber, N., and Galloway, J. N. (2008). An Earth-system perspective of the global nitrogen cycle. Nature 451 (7176), 293–296. doi:10.1038/nature06592
Gutiérrez, M., Biagioni, R. N., Alarcón-Herrera, M. T., and Rivas-Lucero, B. A. (2018). An overview of nitrate sources and operating processes in arid and semiarid aquifer systems. Sci. Total Environ. 624, 1513–1522. doi:10.1016/j.scitotenv.2017.12.252
Jiang, H., Zhang, Q., Liu, W., Zhang, J., Pan, K., Zhao, T., et al. (2021). Isotopic compositions reveal the driving forces of high nitrate level in an urban river: Implications for pollution control. J. Clean. Prod. 298, 126693. doi:10.1016/j.jclepro.2021.126693
Jin, Z., Zheng, Q., Zhu, C., Wang, Y., Cen, J., and Li, F. (2018). Contribution of nitrate sources in surface water in multiple land use areas by combining isotopes and a Bayesian isotope mixing model. Appl. Geochem. 93, 10–19. doi:10.1016/j.apgeochem.2018.03.014
Kendall, C., Elliott, E. M., and Wankel, S. D. (2007). “Tracing anthropogenic inputs of nitrogen to ecosystems,” in In: Stable isotopes in ecology and environmental science. Editors R. H. Michener, and K. Lajtha (New Jersey: Black well Publishing), 375–450.
Kirk, T. K., and Farrell, R. L. (1987). Enzymatic "combustion": The microbial degradation of lignin. Annu. Rev. Microbiol. 41, 465–501. doi:10.1146/annurev.mi.41.100187.002341
Kong, X. L., Yang, Y. H., Cao, B., Wang, Y. X., Pei, H. W., and Shen, Y. J. (2021). Hydrochemical characteristics and factors of surface water and groundwater in the upper Yongding River basin. Environ. Sci. 42 (9), 4202–4210. (In Chinese). doi:10.13227/j.hjkx.202012227
Li, C., Li, S. L., Yue, F. J., Liu, J., Zhong, J., Yan, Z. F., et al. (2019). Identification of sources and transformations of nitrate in the Xijiang River using nitrate isotopes and Bayesian model. Sci. Total Environ. 646, 801–810. doi:10.1016/j.scitotenv.2018.07.345
Li, S. L., Liu, C. Q., Li, J., Liu, X. L., Chetelat, B., Wang, B. L., et al. (2010). Assessment of the sources of nitrate in the Changjiang River, China using a nitrogen and oxygen isotopic approach. Environ. Sci. Technol. 44, 1573–1578. doi:10.1021/es902670n
Liu, C. Q., Li, S. L., Lang, Y. C., and Xiao, H. Y. (2006). Using δ15N- and δ18O-values to identify nitrate sources in karst ground water, Guiyang, Southwest China. Environ. Sci. Technol. 40, 6928–6933. doi:10.1021/es0610129
Liu, T., Wang, F., Michalski, G., Xia, X., and Liu, S. (2013). Using 15N, 17O, and 18O to determine nitrate sources in the Yellow River, China. Environ. Sci. Technol. 47 (23), 13412–13421. doi:10.1021/es403357m
Lohse, K. A., Sanderman, J., and Amundson, R. (2013). Identifying sources and processes influencing nitrogen export to a small stream using dual isotopes of nitrate. Water Resour. Res. 49 (9), 5715–5731. doi:10.1002/wrcr.20439
Ma, B., Huang, T., Li, J., Li, Z., Long, Y., Zhang, F., et al. (2021). Tracing nitrate source and transformation in a semiarid loess aquifer with the thick unsaturated zone. Catena 198, 105045. doi:10.1016/j.catena.2020.105045
Marc, (2015). Ministry of agriculture and rural affairs of the people's republic of China. Action Plan Target. Zero Growth Synthetic Fertilizer Use by 2020. Available at: http://www.zzys.moa.gov.cn/gzdt/201503/t20150318_6309945.htm.
Matiatos, I. (2016). Nitrate source identification in groundwater of multiple land-use areas by combining isotopes and multivariate statistical analysis: A case study of asopos basin (central Greece). Sci. Total Environ. 541, 802–814. doi:10.1016/j.scitotenv.2015.09.134
Matiatos, I., Wassenaar, L. I., Monteiro, L. R., Venkiteswaran, J. J., Gooddy, D. C., Boeckx, P., et al. (2021). Global patterns of nitrate isotope composition in rivers and adjacent aquifers reveal reactive nitrogen cascading. Commun. Earth Environ. 2, 52. doi:10.1038/s43247-021-00121-x
Mayer, B., Boyer, E. W., Goodale, C., Jaworski, N. A., van Breemen, N., Howarth, R. W., et al. (2002). Sources of nitrate in rivers draining sixteen watersheds in the northeastern U.S.: Isotopic constraints. Biogeochemistry 57 (1), 171–197. doi:10.1023/A:1015744002496
Montoya, J. P., Korrigan, S. G., and McCarthy, J. J. (1991). Rapid, storm-induced changes in the natural abundance of 15N in a planktonic ecosystem, Chesapeake Bay, USA. Geochim. Cosmochim. Acta 55 (12), 3627–3638. doi:10.1016/0016-7037(91)90060-I
Ni, M. F., Jiang, S. H., and Li, S. Y. (2020a). Spectroscopic indices trace spatiotemporal variability of dissolved organic matter in a river system with Karst characteristic. J. Hydrol. X. 590, 125570. doi:10.1016/j.jhydrol.2020.125570
Ni, M. F., Li, S. Y., Santos, I., Zhang, J., and Luo, J. C. (2020b). Linking riverine partial pressure of carbon dioxide to dissolved organic matter optical properties in a Dry-hot Valley Region. Sci. Total Environ. 704, 135353. doi:10.1016/j.scitotenv.2019.135353
Ohte, N., Tayasu, I., Kohzu, A., Yoshimizu, C., Osaka, K. i., Makabe, A., et al. (2010). Spatial distribution of nitrate sources of rivers in the Lake Biwa watershed, Japan: Controlling factors revealed by nitrogen and oxygen isotope values. Water Resour. Res. 46 (7). doi:10.1029/2009wr007871
Panno, S. V., Hackley, K. C., Kelly, W. R., and Hwang, H. H. (2006). Isotopic evidence of nitrate sources and denitrification in the Mississippi River, Illinois. J. Environ. Qual. 35 (2), 495–504. doi:10.2134/jeq2005.0012
Parnell, A. C., Inger, R., Bearhop, S., and Jackson, A. L. (2010). Source partitioning using stable isotopes: Coping with too much variation. PLoS One 5 (3), e9672. doi:10.1371/journal.pone.0009672
Qin, Y., Zhang, D., and Wang, F. S. (2018). Using nitrogen and oxygen isotopes to access sources and transformations of nitrogen in the Qinhe Basin, North China. Environ. Sci. Pollut. Res. 26 (1), 738–748. doi:10.1007/s11356-018-3660-0
Rock, L., Ellert, B. H., and Mayer, B. (2011). Tracing sources of soil nitrate using the dual isotopic composition of nitrate in 2 M KCl-extracts. Soil Biol. Biochem. 43 (12), 2397–2405. doi:10.1016/j.soilbio.2011.08.016
Rysgaard, S., Risgaard-Petersen, N., Niels Peter, S., and Kim, J., (1994). Oxygen regulation of nitrification and denitrification in sediments. Limnol. Oceanogr. 39, 1643–1652. doi:10.4319/lo.1994.39.7.1643
Sanchez, D. A., Szynkiewicz, A., and Faiia, A. M. (2017). Determining sources of nitrate in the semi-arid Rio Grande using nitrogen and oxygen isotopes. Appl. Geochem. 86, 59–69. doi:10.1016/j.apgeochem.2017.09.012
Schleppi, P., and Wessel, W. W. (2021). Experimental design and interpretation of terrestrial ecosystem studies using 15N tracers: Practical and statistical considerations. Front. Environ. Sci. 9, 658779. doi:10.3389/fenvs.2021.658779
Sebilo, M., Billen, G., Mayer, B., Billiou, D., Grably, M., Garnier, J., et al. (2006). Assessing nitrification and denitrification in the seine River and estuary using chemical and isotopic techniques. Ecosystems 9 (4), 564–577. doi:10.1007/s10021-006-0151-9
Shaaban, M., Hatano, R., Martínez-Espinosa, R. M., and Wu, Y. (2022). Editorial: Nitrogen in the environment. Front. Environ. Sci. 9, 829104. doi:10.3389/fenvs.2021.829104
Sigman, D. M., Casciotti, K. L., Andreani, M., Barford, C., Galanter, M., and Böhlke, J. K. (2001). A bacterial method for the nitrogen isotopic analysis of nitrate in seawater and freshwater. Anal. Chem. 73 (17), 4145–4153. doi:10.1021/ac010088e
Spencer, R. G. M., Kellerman, A. M., Podgorski, D. C., Macedo, M. N., Jankowski, K., Nunes, D., et al. (2019). Identifying the molecular signatures of agricultural expansion in Amazonian Headwater Streams. J. Geophys. Res. Biogeosci. 124 (6), 1637–1650. doi:10.1029/2018jg004910
Taufiq, A., Effendi, A. J., Iskandar, I., Hosono, T., and Hutasoit, L. M. (2019). Controlling factors and driving mechanisms of nitrate contamination in groundwater system of Bandung Basin, Indonesia, deduced by combined use of stable isotope ratios, CFC age dating, and socioeconomic parameters. Water Res. 148, 292–305. doi:10.1016/j.watres.2018.10.049
Wang, A., Fang, Y., Chen, D., Phillips, O., Koba, K., Zhu, W., et al. (2018). High nitrogen isotope fractionation of nitrate during denitrification in four forest soils and its implications for denitrification rate estimates. Sci. Total Environ. 633, 1078–1088. doi:10.1016/j.scitotenv.2018.03.261
Wang, Z. H., Ma, Z. C., Zhang, L. J., Ma, W. Q., and Ji, Y. Z. (2020). Fertilization and soil nutrient evolution of vineyards in Hebei and its impact on yield. North. Hortic. (7), 106–115. (in Chinese). doi:10.11937/bfyy.20193214
Widory, D., Petelet-Giraud, E., Brenot, A., Bronders, J., Tirez, K., and Boeckx, P. (2013). Improving the management of nitrate pollution in water by the use of isotope monitoring: The δ15N, δ18O and δ11B triptych. Isot. Environ. Health Stud. 49 (1), 29–47. doi:10.1080/10256016.2012.666540
Wong, W. W., Pottage, J., Warry, F. Y., Reich, P., Roberts, K. L., Grace, M. R., et al. (2018). Stable isotopes of nitrate reveal different nitrogen processing mechanisms in streams across a land use gradient during wet and dry periods. Biogeosciences 15 (13), 3953–3965. doi:10.5194/bg-15-3953-2018
Xia, Y., Li, Y., Zhang, X., and Yan, X. (2017). Nitrate source apportionment using a combined dual isotope, chemical and bacterial property, and Bayesian model approach in river systems. J. Geophys. Res. Biogeosci. 122, 2–14. doi:10.1002/2016JG003447
Xuan, Y., Liu, G., Zhang, Y., and Cao, Y. (2022). Factor affecting nitrate in a mixed land-use watershed of southern China based on dual nitrate isotopes, sources or transformations? J. Hydrol. X. 604, 127220. doi:10.1016/j.jhydrol.2021.127220
Yang, Y., Zhang, T., Zheng, M., Su, J., Sun, Y., and Fu, X. (2021). Spatial distribution characteristics and pollution source analysis of nitrate pollution in groundwater based on hydrochemistry and local stable isotopes. Res. Environ. Sci. 34 (9), 2164–2172. (in Chinese). doi:10.13198/j.issn.1001-6929.2021.05.21
Yi, Q., Zhang, Y., Xie, K., Chen, Q., Zheng, F., Tonina, D., et al. (2020). Tracking nitrogen pollution sources in plain watersheds by combining high-frequency water quality monitoring with tracing dual nitrate isotopes. J. Hydrol. X. 581, 124439. doi:10.1016/j.jhydrol.2019.124439
Yu, J., Zhang, W., Tan, Y., Zong, Z., Hao, Q., Tian, C., et al. (2021). Dual-isotope-based source apportionment of nitrate in 30 rivers draining into the Bohai Sea, north China. Environ. Pollut. 283, 117112. doi:10.1016/j.envpol.2021.117112
Yue, F. J., Li, S. L., Waldron, S., Wang, Z. J., Oliver, D. M., Chen, X., et al. (2020). Rainfall and conduit drainage combine to accelerate nitrate loss from a karst agroecosystem: Insights from stable isotope tracing and high-frequency nitrate sensing. Water Res. 186, 116388. doi:10.1016/j.watres.2020.116388
Keywords: SOURCE apportionment, nitrate isotopes, water chemical variables, DOM composition, land use
Citation: Li C, Yue F-J, Li S-L, Ge J-F, Chen S-N and Qi Y (2022) Land use as a major factor of riverine nitrate in a semi-arid farming-pastoral ecotone: New insights from multiple environmental tracers and molecular signatures of DOM. Front. Environ. Sci. 10:1061857. doi: 10.3389/fenvs.2022.1061857
Received: 05 October 2022; Accepted: 10 November 2022;
Published: 25 November 2022.
Edited by:
Minghua Zhou, Institute of Mountain Hazards and Environment (CAS), ChinaReviewed by:
Bowen Zhang, Lund University, SwedenNi Maofei, Guizhou Minzu University, China
Guoce Xu, Xi’an University of Technology, China
Copyright © 2022 Li, Yue, Li, Ge, Chen and Qi. This is an open-access article distributed under the terms of the Creative Commons Attribution License (CC BY). The use, distribution or reproduction in other forums is permitted, provided the original author(s) and the copyright owner(s) are credited and that the original publication in this journal is cited, in accordance with accepted academic practice. No use, distribution or reproduction is permitted which does not comply with these terms.
*Correspondence: Fu-Jun Yue, ZnVqdW5feXVlQHRqdS5lZHUuY24=