 Rui Zhao
 Jose Luis Gabriel
 Jose Antonio Rodríguez Martín
 Zhe Feng
 Kening Wu
- 1School of Land Science and Technology, China University of Geosciences (Beijing), Beijing, China
- 2Instituto Nacional de Investigación y Tecnología Agraria y Alimentaria (INIA-CSIC), Madrid, Spain
- 3Centro de Estudios e Investigación para la Gestión de Riesgos Agrarios y Medioambientales (CEIGRAM, UPM), Madrid, Spain
- 4Technology innovation center of land engineering, MNR, Beijing, China
- 5Key Laboratory of Land Consolidation, MNR, Beijing, China
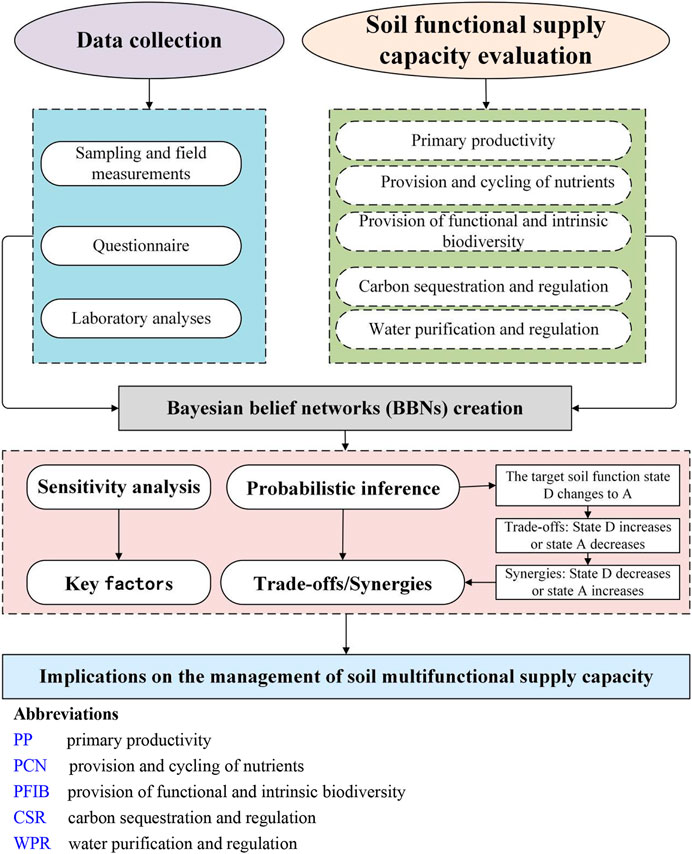
Soil provides a diverse and complex range of ecosystem services. Understanding the trade-offs and synergies among soil functions is foundational for effective soil ecosystem management and human well-being. In contrast, the long-term pursuit of solely productive functions in cultivated land use has resulted in soil degradation and weakened other ecological functions. This study collected soil, topographic landform, climate, and management data from 151 fields in four counties and three climatic zones in China. The Integrated Valuation of Ecosystem Services and Trade-offs (InVEST) model was used to evaluate nutrient retention, water production, and carbon storage, and the market value method was used to evaluate the value of the soil production function. A semi-quantitative model of Bayesian belief networks (BBNs) was used to simulate soil processes, thus revealing factors potentially influencing the supply capacity of five soil functions. Sensitivity analysis was used to identify the key variables influencing soil functional supply, and the probabilistic inference was used to identify interactions among soil’s multiple functions. The main findings were as follows: 1) In four counties, the spatial heterogeneity in the supply of the five soil functions was relatively high. 2) The primary variables influencing the supply of soil’s multiple functions were climatic conditions, management level, carbon storage, soil nutrients, soil biology, soil structure, and topography. 3) Trade-offs existed among primary productivity (PP), water purification and regulation (WPR), and carbon sequestration and regulation (CSR). Moreover, the provision of functional and intrinsic biodiversity (PFIB), WPR, and CSR were synergistic; specifically, the CSR and WPR services synergized with the nutrient provision and cycling (PCN). This research may aid in understanding the supply of, and interactions among soil’s multiple functions, thus aiding in using BBNs to analyze soil ecosystem services. In addition, this study may provide a reference for management decision-making to maximize the overall benefits of soil functions in cultivated land use.
Highlights
1) To model the soil function supply process, a Bayesian belief network was built.
2) Soil supply services have trade-offs with regulating services.
3) The study is beneficial for exploring soil service mechanisms and prudent soil management.
4) Understanding soil biodiversity is extremely important for sustainable agricultural use.
Introduction
To meet the United Nations Sustainable Development Goals (SDGs) and national development strategies, soil use and management can play essential roles (Zhang G. L. et al., 2022). As an important source of ecosystem service diversity, Soil provides beneficial services that support most agro-pastoral production systems (Baveye et al., 2016). Soil function indicates a soil-based ecosystem service that consists of a series of soil processes that support the provision of ecosystem services and contribute to the production of goods and services that are beneficial to human social requirements and the environment (Barrios, 2007; Ghaley et al., 2014). Soil is critical to sustainable development, including fresh water and energy supplies, climate change, biodiversity loss, and food security (Lal et al., 2021). An overemphasis on increasing food production capacity leads to soil overuse, which is detrimental to Soil’s other ecological services (Zhao et al., 2021; Zhao and Wu, 2021). Stakeholders with input regarding how land is managed may have different expectations or needs regarding how well the land performs each soil function (Greiner et al., 2018; Bampa et al., 2019; Schulte et al., 2019), thereby resulting in trade-offs among food production and other ecosystem services. Farmers, for example, may maximize soil productivity (Eliasson et al., 2010; Jafarzadeh et al., 2021) but may unintentionally affect the soil’s purification or regulation functions. Consequently, emphasizing the multifaceted role of Soil in sustainable environmental policy and management is an essential component of sustainable soil management (Adhikari and Hartemink, 2016).
The functions closely associated with agricultural and forestry production, such as primary productivity (PP), provision and cycling of nutrients (PCN), provision of functional and intrinsic biodiversity (PFIB), water purification and regulation (WPR), and carbon sequestration and regulation (CSR), are driven by the concept of functional land management (O'Sullivan et al., 2015). The EU LANDMARK project’s Soil Navigator decision support model is a representative soil function assessment method used in five European countries: Austria, Germany, Denmark, France, and Ireland (Debeljak et al., 2019). As a semi-natural and semi-artificial system, the cultivated soil system is subject to various selection preferences and utilization methods. Interactions among different soil function types occur under specific spatial and temporal conditions, thus resulting in a complex interactive relationship that consists primarily of trade-offs or synergies with mutual gains and losses (Zwetsloot et al., 2021). Because of these trade-offs and synergies, not every soil function can achieve maximum utility simultaneously (Vrebos et al., 2021). Zwetsloot et al. (2021) assessed five soil functions at 94 sites in 13 European countries across five climatic zones for two land use types: cultivated land and grassland. They have confirmed that synergies and trade-offs among soil functions vary by climatic zone and land-use type. Knowledge of the trade-offs and synergies in multiple soil functionalities is critical for providing farmers and policymakers with management options for the sustainable use of cultivated land resources (O'Sullivan et al., 2022).
Soil properties are helpful for assessing the potential of landscapes to provide terrestrial ecosystem services, but they are affected by anthropogenic activities and environmental factors, including landscape attributes (Syrbe and Walz, 2012; Takoutsing et al., 2018). Because of the complexities of soil function supply processes and the difficulty in precise measurement, current research on soil multi-functionality simulates supply and demand for a single soil function or the effects of various factors on specific soil functions (Valujeva et al., 2016). However, studies on soil function’s trade-offs and synergistic effects are uncommon, particularly when more than two soil function models are used. The soil functional models used in recent studies have exhibited data input overlap. For example, four of the five function models have used soil organic matter or soil organic carbon as data inputs (Zwetsloot et al., 2021). Correlations observed among soil functions in the field may also be caused by overlapping indicator data during the evaluation process. Previous studies have widely used predictive analysis (forward reasoning) of Bayesian belief networks (BBNs) (Delen et al., 2020; Vrebos et al., 2021; Peng et al., 2022), whereas dependency and diagnostic analysis (reverse reasoning) have been underutilized. BBNs can link soil and environmental factors to multiple soil functions, visually simulate soil processes, and input various inferential hypotheses, depending on the purpose of the study. The outcomes of process-based models have improved our understanding of the complex potential roles of these soil processes concerning Soil, topographic, and climatic factors (Vrebos et al., 2021).
Consequently, BBNs have a high potential for use in investigating trade-offs and the synergistic effects of soil functions (Landuyt et al., 2016). Changes in network nodes can be easily detected with BBNs, thus revealing the differences in soil functional relationships (Gonzalez-Redin et al., 2016; Feng et al., 2021). Vrebos et al., 2021) used BBNs to model relationships among soil functions at the European scale, primarily by relying on indirect indicators. Such models have been dominated by soil physical and chemical processes, such as nitrogen mineralization, nitrification, and denitrification, while seldom considering soil biological components and activities (Li et al., 2022). The main goal of this research was to identify interaction patterns among functions, incorporating the concept of trade-offs and synergies into evaluating soil multiple functions in China to provide a reference for targeted cultivated land management policies. For this purpose, three specific sub-objectives were defined, based on 151 fields in China, from different climatic zones and soil types. They were: 1) to select network nodes based on soil processes and build a network model of the supply of five soil functions, 2) to identify critical drivers of the formation of soil multifunctional relationships through sensitivity analysis of BBNs, and 3) identify functional trade-offs and synergistic relationships in soils through probabilistic inference.
Materials and methods
Study site and characteristics
The study sites are located in China (Figure 1). We investigated a total of 151 fields with three types of cultivated land use in four specific county-level administrative regions: the China Northeast Black Soil Area, Huang Huaihai Fluvo Aquic Soil Area, Loess Hilly Brown Soil Area, and Jianghuai Hilly Aquorizem Area (dry land, paddy field, and irrigated land). Natural environments, geographical locations, crop types, and soil types vary across these four counties (Table 1). With an average annual precipitation of 550 mm and an average annual temperature of 1.5°C, Hailun County in Heilongjiang Province is at the heart of the Sonnen Plain’s black Soil. It is a grain production center in northeast China. Yixing County, Jiangsu Province, with an average annual temperature of 15.7°C and precipitation of 1200 mm, this area is a commodity food base in the Yangtze River Delta. Wen County, Henan Province, is nationally renowned for its wheat yield of 7500 kg/ha; it has an average annual temperature of 14.4°C and 600 mm of precipitation. Gaoping County, Shanxi Province, with 600 mm of annual precipitation and 10.4°C annual temperature, is the birthplace of Chinese agricultural civilization in the Loess Hills area. Most cultivated land is terraced with rain-fed agriculture. The selection of study areas can reveal the related issues of soil protection and sustainable management and utilization in different climatic regions, different soil types, and different food crops or economic crop regions in China, and provide a scientific basis for promoting the healthy development of soil resources, which is typical and feasible.
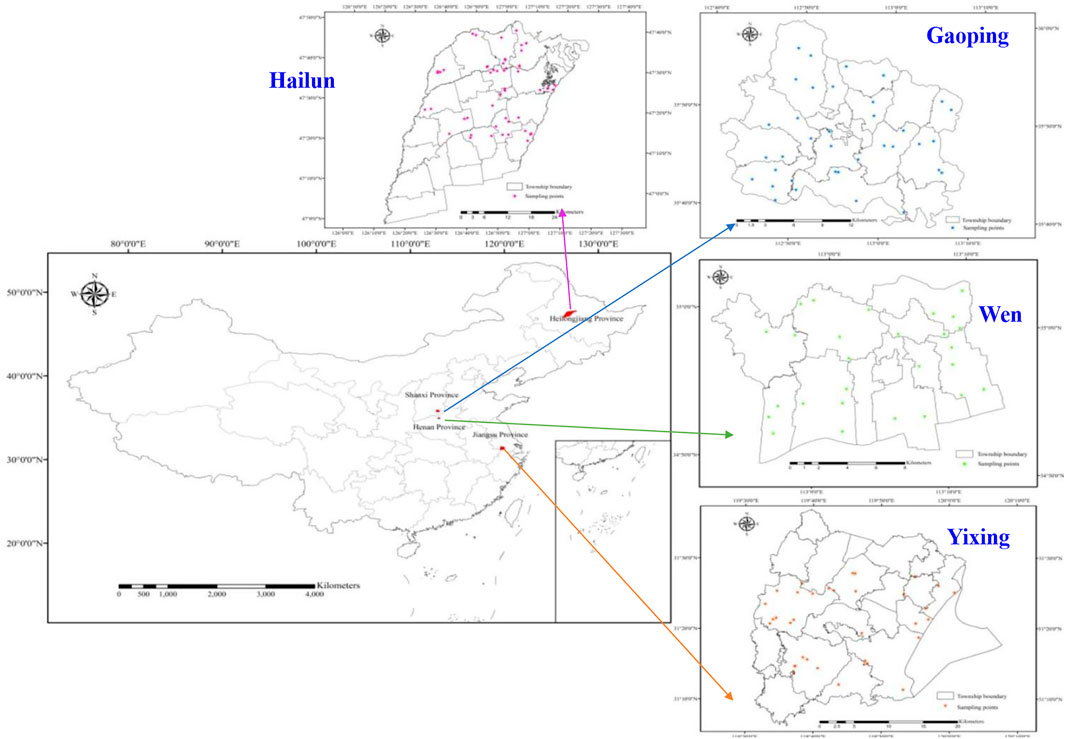
FIGURE 1. Location of the study area and distribution of sampling plots.
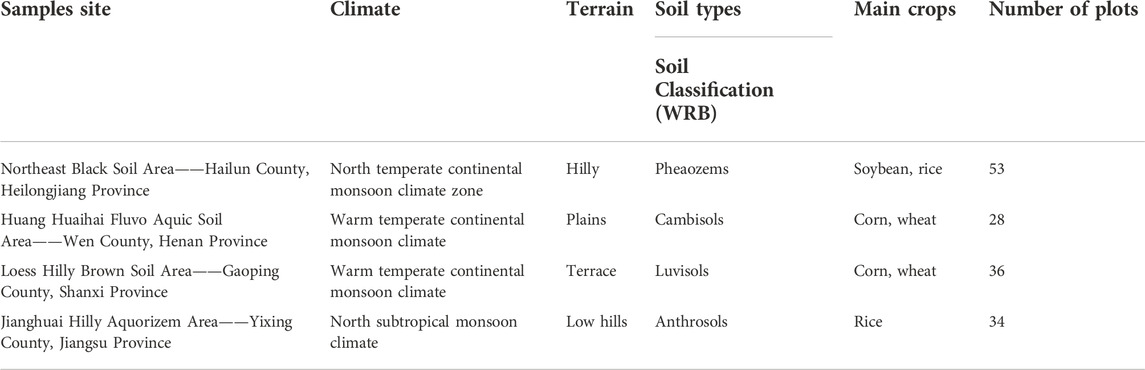
TABLE 1. Representative essential characteristics of sample location.
Sampling and field measurements
The 151 soil samples from georeferenced locations (Figure 1) were collected from the upper 20 cm of Soil from September 2017 to October 2020. We used steel rolling pins to break up the bulk soil samples before mixing them to ensure uniformity and soil purity and the removal of litter and other debris on the soil surface before sampling. A sample of approximately 1 kg was extracted from each mixture with the quartering method. The samples were then sealed in sterile polyethylene bags and stored in a portable refrigerator away from heat and light. The depth of the tillage layer was measured with a drill rod at each soil sampling location. With a rubber hammer and a wooden block, the 15.24 cm diameter cutting ring was pressed down to a depth of 7.62 cm, and the soil surfaces inside were wrapped in plastic wrap to cover the Soil and the cutting ring fully. The cutting ring was filled with 300 ml of water measured with a graduated cylinder, and the water remained inside the ring after the plastic wrap was gently removed. The timer was then started and was not stopped until the soil surface inside flashed to record the time required for the water to penetrate the Soil. The ring-cutting method was used to determine the bulk density of the Soil. A total of 75 g of each Soil retained in the 2-mm sieve was used to determine water-stable aggregates, according to Kemper and Chepil (1965). A questionnaire was also used to poll farmers regarding their fertilizer, crop, irrigation, drainage, and pest control practices (Sandén et al., 2019). Drainage capacity, irrigation conditions, average annual temperature, annual precipitation, field slope, and terrain location were derived from the Natural Resources Bureau’s Gradation on Agriculture Land Quality database and field surveys.
Laboratory analyses
Air-dried soil samples were passed through a 2-mm sieve. Soil particle sizes were determined with a full range laser particle size analyzer (Microtrac S3500), and the clay percentage (below 2 μm), silt content (silt percentage, 2–50 μm), and sand content (sand percentage, 50–2000 μm) were determined. To calculate soil water content, we used the original Soil’s mass loss after drying a constant mass at 105°C. The pH was determined with a 1:2.5 soil-to-distilled-water suspension ratio. Soil organic matter was measured with potassium dichromate oxidation spectrophotometry. The ammonium acetate method was used to determine soil cation exchange capacity (Sumner and Miller, 1996). Soil total nitrogen, phosphorus, available nitrogen, available phosphorus, and available potassium were determined according to Chinese Soil Society guidelines (Lu et al., 2019). To determine dissolved organic carbon, we used the dichromate oxidation method (Jenkinson and Powlson, 1976). The carbon and nitrogen content of soil microbial biomass was determined with the chloroform fumigation–extraction method (Brookes et al., 1985). A CIRAS-2 (PPSystems, Amesbury, United States) portable CO2 analyzer was used to measure soil respiration (soil CO2 flux chamber). The carbon dioxide concentration was measured in g CO2/m/h (Bojarszczuk et al., 2017).
Measurement of multiple soil functions
The multi-functionality of Soil can be viewed as a “trade-offs” black box: although the internal trade-offs among multiple soil functions cannot be directly identified, the external functional products provided by the output of multiple soil functions can easily be depicted (Kearney et al., 2019), and the existence of a variety of functional products often indicates multiple types of soil functions (Jiang et al., 2020).
The Integrated Valuation of Ecosystem Services and Trade-offs (InVEST) model was used to evaluate nutrient retention, water production, and carbon storage in each grid with grid sizes set to 100 m. Then, each sample field was assigned with the point extraction method (Feng et al., 2021). FRAGSTATS software calculated the Shannon Diversity Index as a biodiversity measure (Jiang et al., 2020). The sample field’s central grain crop unit’s production potential value was used to represent the soil’s production function, and the market value method was used to evaluate the value of the soil production function with Eq. 1:
Where V represents the unit production function value of the Soil (CNY, Chinese Yuan), Wi denotes the average production potential of the ith crop (kg/ha), and Yi denotes the market price of the ith crop (CNY/kg).
Because the units and magnitudes of different soil function service values differ, the data needed to be standardized to make the soil function service values in Eq. 2 fall between 0 and 1:
Where SFstdi is the soil function service value after standardization, SFobsi is the value to be assessed, SFmini is the minimum value of each soil function service, and SFmaxi is the maximum value of each soil function service.
Bayesian belief networks (BBNs)
BBNs are probabilistic network models based on Bayesian causal probabilistic inference that reflect the partial state of the corresponding real world and show how these states are related by probabilities (Scrieciu et al., 2021). In BBNs, the variables involved in the research questions are represented by nodes. Each network node corresponds to a variable, which can be discrete, continuous, or logical (true/false). Users can customize the variables’ discrete states and methods (Zhou et al., 2014; Wu et al., 2022). A BBN is a probabilistic graphical network, with each node containing a directed acyclic graph and a conditional probability table. Because BBNs are semi-quantitative, they can learn and infer under limited, incomplete, and uncertain information and can effectively address scientific problems involving uncertainties and human reasoning (Feng et al., 2021). Soil functions are groups of soil processes that emerge from interactions among Soil’s physical, chemical, and biological components (Vogel et al., 2019). Towards cultivated land, agricultural management practices strongly influence the physical, chemical, and biological components of soil ecosystems (Sanaullah et al., 2020). Due to a large number of soil function indicator variables, multivariate analysis is recommended as an effective method and widely used in soil quality or soil function studies (Rezaei et al., 2006; Zuber et al., 2017; Rottler et al., 2019). On the basis of our existing data resources, we selected 37 variables, which also pave the way for the subsequent sensitivity analysis. In this study, the Netica software was used to build BBNs according to soil process principles and multifunctional soil supply, thus demonstrating the interactions among five soil function supply processes. In addition to the five soil functions, 37 variables were chosen to create the BBNs, and the network nodes were discrete, as shown in Table 4 (because of the large number of variables, some nodes were combined). Carbon storage was determined, for example, by bulk density, organic matter, tillage layer depth, and soil texture). Given the model’s accuracy and complexity, each node was assigned one of four states: D (ex poor), C (poor), B (medium), or A (good). The structures of the BBNs (the node settings, the determination of connection and direction) are generated from expert knowledge, previous literature, and the causality among the variables (Vrebos et al., 2021). Probabilistic inference and sensitivity analysis were performed after the BBNs were completed.
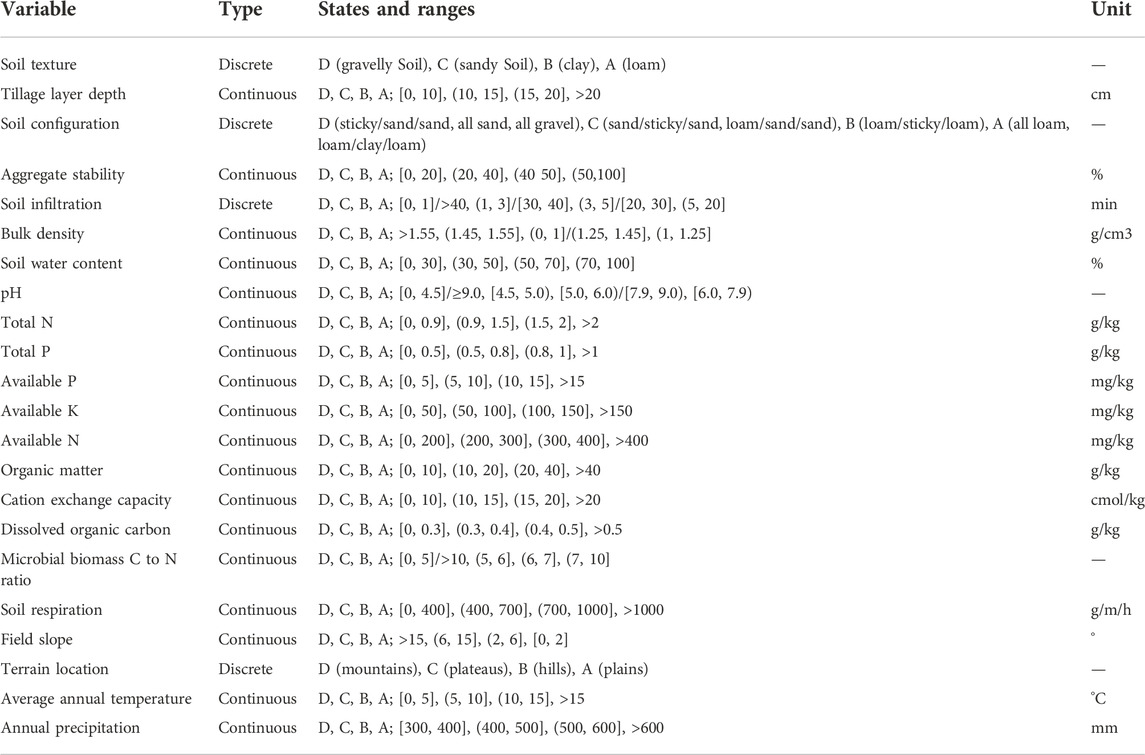
TABLE 4. Description of some network nodes.
Sensitivity analysis
The sensitivity analysis performed by Netica determined the independence and dependence of each node in the network. Variance reduction is the most effective sensitivity indicator because it reflects the influence of a specific variable on the target variable: the more significant the variance reduction, the greater the influence of the input factor.
As a result of the evidence input from node F, the expected value of node Q’s expected variance decreased, thus reducing variance [0, V(Q)] was the variance reduction range. The stronger the interrelationship among node Q and node F when independent, the more significant the variance reduction. The variance reduction was determined as follows.
where Q is the target variable, F is the change variable, q is the state of the target variable, f is the change variable’s state, Xq is the real numerical value corresponding to state q,
Results
The capacity to supply multiple soil functions
A regular pentagon area model indicated soil versatility and the degree of interaction among various functions. The soil function scores of the 151 sample plots in this study (converted to function grades, from A grade = 4 to D grade = 1) did not form a regular pentagon (Figure 2), thus indicating that a trade-off indeed existed among the five functions. When the functional strengths did not differ significantly, the soil’s multi-functionalization and ecosystem stability were most extraordinary (Jiang et al., 2020; Li et al., 2021).
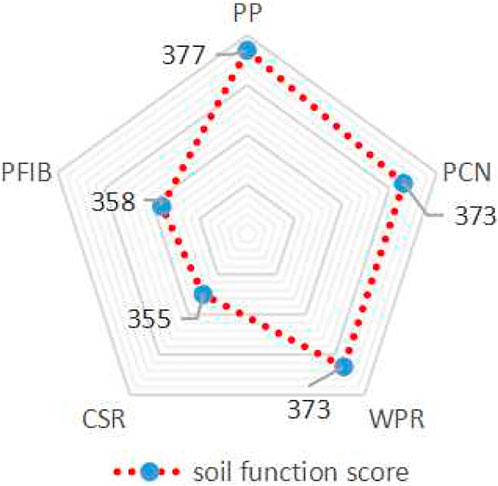
FIGURE 2. Pentagon diagram of Soil multifunction.
We detected that no single field supplied all five soil functions at a high level (such that all five soil functional grades were A simultaneously) and that no single field supplied all five soil functions at a low level (such that all five soil function grades were D simultaneously). According to Figure 3, PP and PCN were frequently supplied at a high grade, owing to the intensive utilization of most arable land plots; WPR, CSR, and PFIB were typically supplied at medium capacity with slight variation in quantity, primarily in Yixing and Hailun paddy fields. The most notable feature was Gaoping’s poor performance in terms of WPR, CSR, and PFIB, which was also associated with a lack of water in farmland (dependent on natural rainfall) and complex terrain. Altitude has also affected soil biodiversity by influencing temperature and precipitation (Kouser et al., 2021). Yixing County had the highest PP and PFIB of the four areas, owing to the county’s favorable climatic conditions, the farming system of three crops per year, and paddy fields being the most common type of cultivated land.
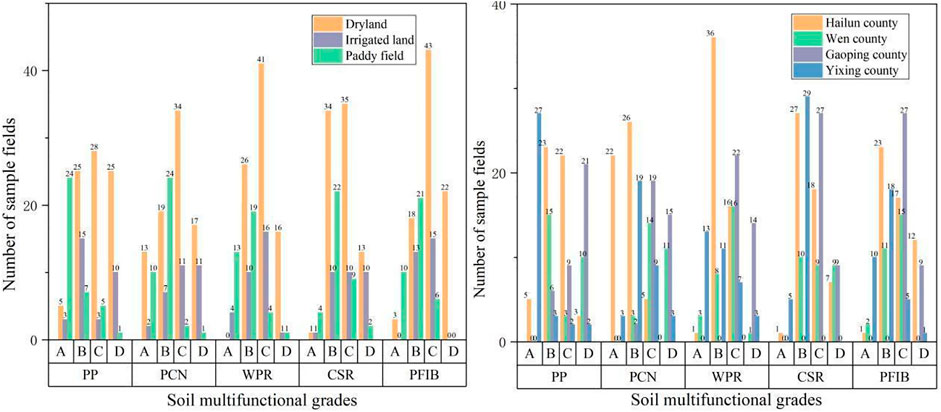
FIGURE 3. Soil multifunctional supply capacity in different land types and counties.
Furthermore, due to the high precipitation in Yixing County, warm and humid weather during the rainy season accelerates litter decomposition, increasing microbial nutrient fixation (Lv et al., 2014; Dou et al., 2022). On the other hand, its soil type was black soil (also referred to Pheaozems), with a relatively high organic carbon content (the mean was 40.94 g/kg); Hailun County had a higher supply capacity for PCN and CSR than the other three counties. Furthermore, the field investigation discovered that most of the sampled fields in Hailun County had adopted measures such as returning straws to the fields and applying organic fertilizers. These measures can increase organisms’ living space, improve the soil’s physical structure, and increase soil fertility (Zhang S. et al., 2022). PP and PFIB supply frequency were higher in paddy fields, and the WPR was higher than in dry land. Because the unique paddy field management system regulates the redox-driven processes that occur in the Soil, affecting the transformation, turnover, and nutrient cycling of soil organic matter (Liu et al., 2021).
Furthermore, rice is almost uniformly planted in paddy fields, and the rice roots can release oxygen into the Soil, creating a unique aerobic microbial habitat in an anoxic rhizosphere environment (Kögel-Knabner et al., 2010). The use of intensive soil management activities that disrupt the structure of the Soil with heavy machinery, causing compaction, i.e., by increasing bulk density, reducing pore space, and breaking up soil aggregates (Rodríguez-Martín et al., 2019), and this is the case of Wen County has the highest mean bulk density at 1.42 g/cm3. The CSR supply capacity is relatively low.
Construction and testing of BBNs
The BBNs structure of the supply of five soil functions comprised 37 nodes and 49 one-way arrows in the networks (Figure 4). All nodes were assigned one of four grades: A (excellent), B (medium), C (poor), or D (ex poor). The node name is at the top of the node hierarchy, followed by the node status, belief bar, and corresponding probability. More than half the farmlands had PP above medium, and 50.7% had PCN below medium, thus indicating that more than half had poor PCN. Only 11.3% of farmlands had a high level of WPR, and only 3.9% and 8.4% of farmlands had good CSR and PFIB regulation, respectively. Notably, only one farmland is located in the mountains and is not suitable for farming, and approximately one-quarter of farmlands have inadequate drainage capacity. Furthermore, 34.8% of farmlands had deplorable irrigation conditions, indicating that most farmland infrastructure was in poor condition and consequently indirectly affected soil multifunctional performance.
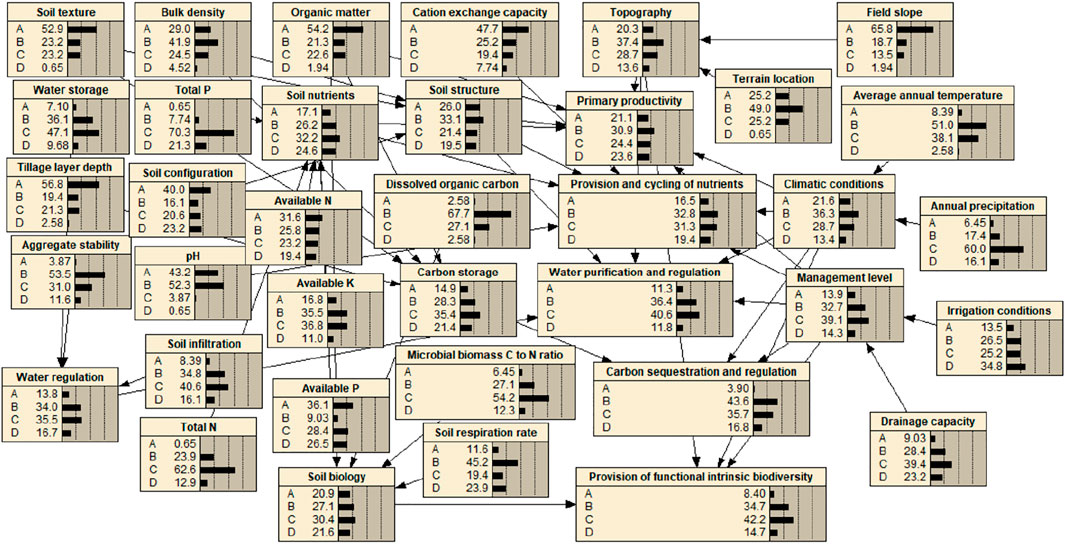
FIGURE 4. The compiled BBN
After the construction of the BBNs, the networks’ accuracy was tested with Netica’s Network Test by Case function, 100 cases were obtained through random sampling with points, which were used to conduct accuracy tests. Five soil function supplies were selected as the nodes to be tested. Netica software was used to compare the generated predictions with the true values in the test case file, and the results are displayed in Table 5. The measures calculated by the Netica include the error rate, logarithmic loss, quadratic loss, and spherical payoff. According to the judgment rule mentioned by Feng et al. (2021) and Sun et al. (2022), the relatively high accuracy of the BBN created in this paper as a whole demonstrates that the BBN is considerably accurate in the simulation of the soil functions supply process and shows strong reliability to conduct the probabilistic inference of each soil function node.
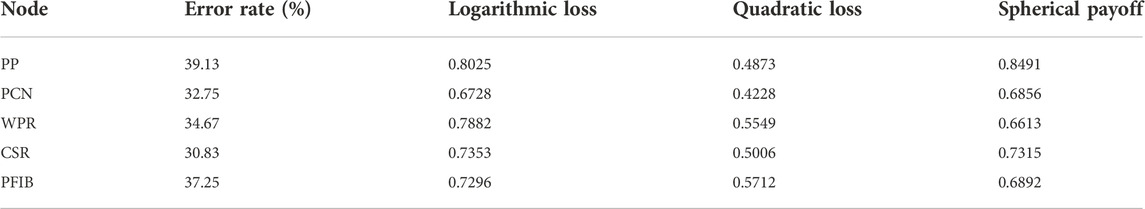
TABLE 5. Results of BBN accuracy evaluation.
Probabilistic inference for every soil function
According to the Bayesian theorem, using conditional probability tables, BBNs can infer unobserved nodes’ posterior probabilities (i.e., conditioned on all current findings). Soil function trade-offs and synergies were determined by entering the findings for one node and recording the updating posterior probabilities of other nodes. First, the PP node states were set to the four known states, namely D = 100%, C = 100%, B = 100%, and A = 100%. The state of each network node was then updated. The posterior probabilities of the four-node states PCN, WPR, CSR, and PFIB were observed and recorded as they changed. Figure 5 depicts how the corresponding posterior probability distributions of the PCN and PFIB nodes changed irregularly and insignificantly as the PP node’s state improved from D to A, making it difficult to identify the relationships among the PP, PCN, and PFIB services. On the other hand, the probabilities of the WPR nodes’ A states decreased, while the probabilities of the CSR nodes’ D states increased. As a result, trade-offs were made between the PP service and the WPR and CSR services.
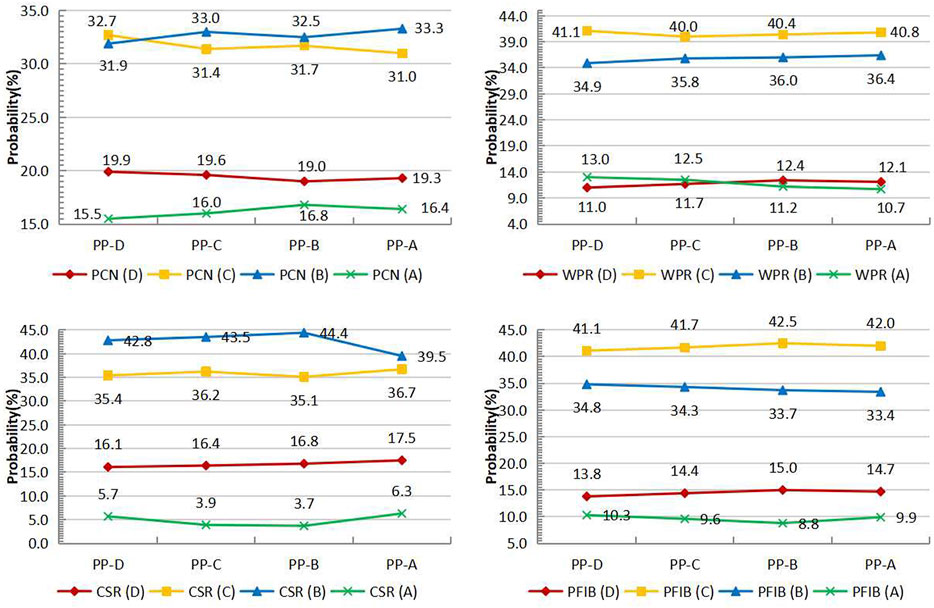
FIGURE 5. Changes in the PCN, WPR, CSR, and PFIB nodes.
Second, the PCN node states were set to four known states, namely D = 100%, C = 100%, B = 100%, and A = 100%. Figure 6 shows that as the PCN node gradually improved from the D state to the A state, the probabilities of the CSR node remaining in the D state decreased. In the case of the WPR node, the likelihood of the A state increased. Consequently, the CSR and WPR services synergized with the PCN service.
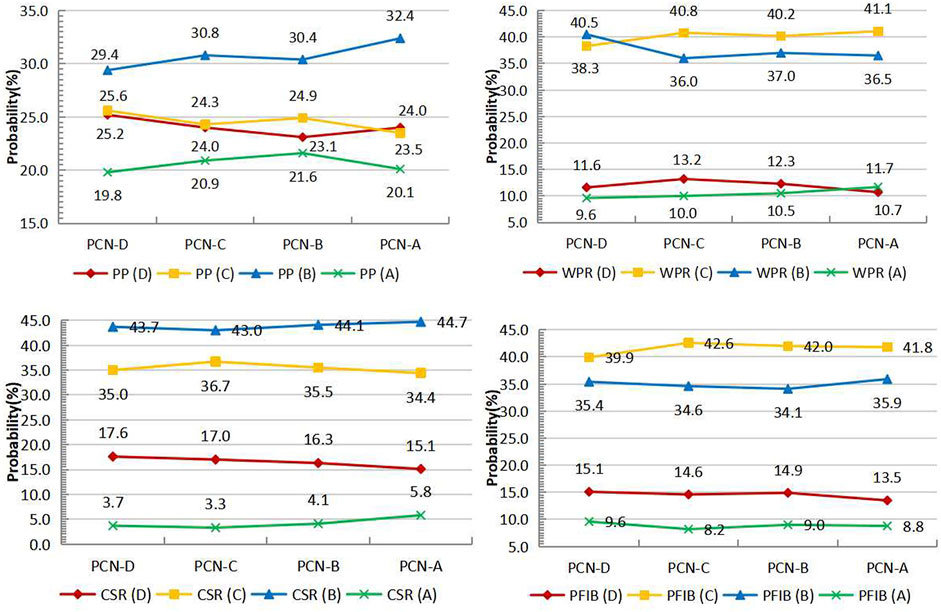
FIGURE 6. Changes in the PP, WPR, CSR, and PFIB nodes.
Third, the WPR node states were set to four known states, namely D = 100%, C = 100%, B = 100%, and A = 100%. Figure 7 shows that the changes in the CSR, PCN and PFIB nodes were similar as the WPR node progressed from the D state to the A state. The probabilities of the A state of the CSR and PFIB showed an increasing trend, whereas the probabilities of the D state in the PCN showed a decreasing trend, and the probabilities of the A state of the PP showed a decreasing trend. Thus, synergies existed among the WPR, CSR, PCN, and PFIB services. A trade-off relationship was observed between the WPR and PP services.
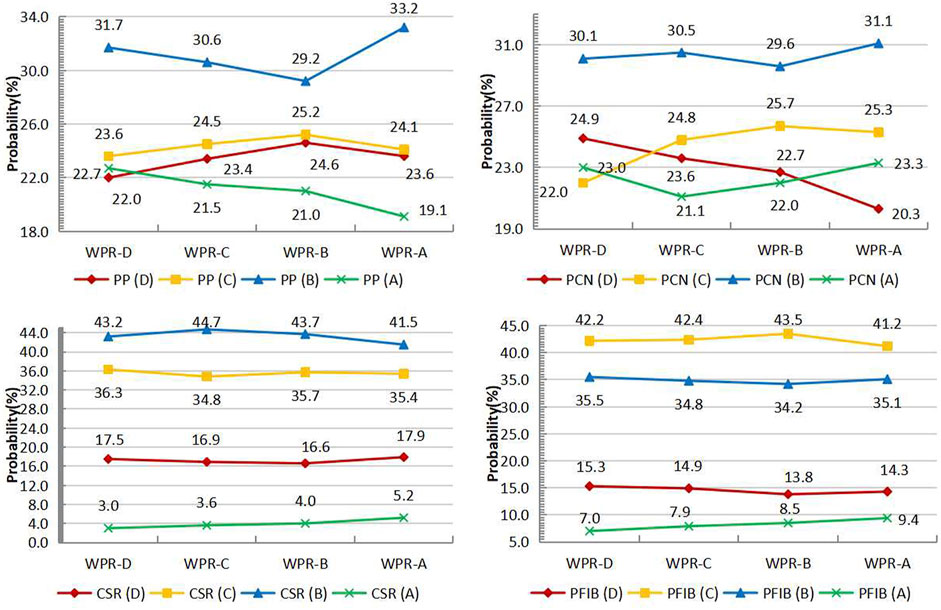
FIGURE 7. Changes in the PP, PCN, CSR, and PFIB nodes.
Fourth, the CSR node states were set to four known states, namely D = 100%, C = 100%, B = 100%, and A = 100%. A line chart is presented in Figure 8. As the CSR node gradually improved from the D state to the A state, the PP node changed in the opposite direction. The probabilities of the A state of the PCN and PFIB nodes showed an increasing trend, whereas the probabilities of the D state showed a decreasing trend in the WPR node. Therefore, trade-offs occurred between CSR and PP services, the CSR service synergized with the PCN, WPR, and PFIB services.
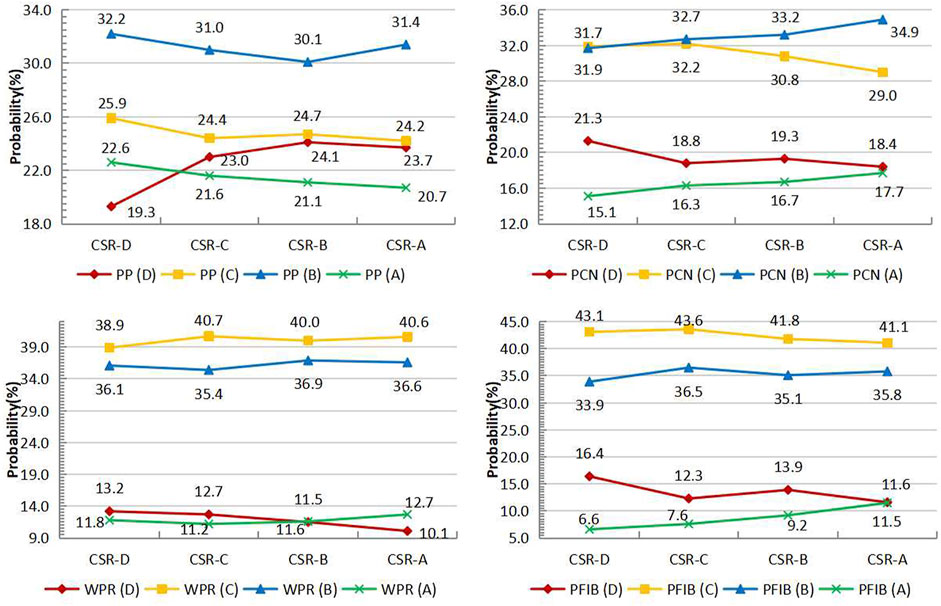
FIGURE 8. Changes in the PP, PCN, WPR, and PFIB nodes.
Finally, the PFIB node states were set to four known values: D = 100%, C = 100%, B = 100%, and A = 100%. Figure 9 depicts the change in the CSR node as the state of the PFIB node gradually improved from the D state to the A state. The probabilities of the CSR node’s D state decreased while the probabilities of the A state increased. Furthermore, the A state of the WPR grew gradually. As a result, trade-offs were observed between the PFIB and PCN services. According to the above analysis, the PFIB service collaborated with the CSR and WPR services.
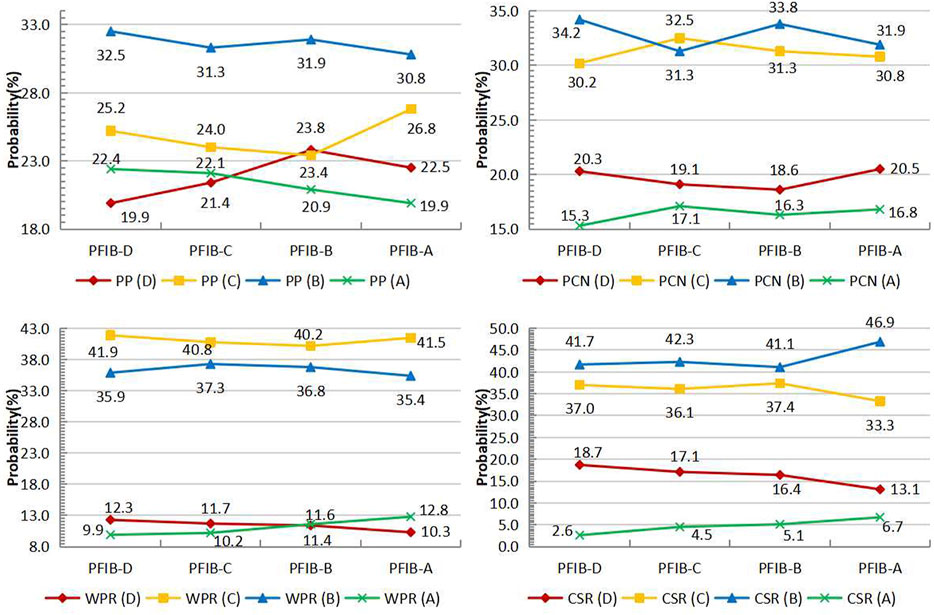
FIGURE 9. Changes in the PP, PCN, WPR, and CSR nodes.
Identification of critical factors
Network sensitivity analysis was performed in Netica with PP, PCN, WPR, CSR, and PFIB as target nodes, and the degree of influence of each node in the network on the target node was identified through variance reduction, thereby identifying the key variables affecting the supply of each soil function. Only the top 15 most influential variables were counted because of the large number of variables. The findings (Figure 10) revealed that the key variables influencing PP included climatic conditions, topography, management level, soil nutrients, and carbon storage; the key variables influencing PCN included soil nutrients, soil structure, management level, climatic conditions, total N, and average annual temperature; the key variables influencing WPR included soil structure, soil infiltration, water storage, aggregate stability, and topography; CSR was influenced by factors including carbon storage, climatic conditions, management level, average annual temperature, and drainage capacity; and PFIB was influenced by factors including soil biology, topography, climatic conditions, average annual temperature, management level, and terrain location. Furthermore, the partial variance reductions among PP, PCN, WPR, CSR, and PFIB were more significant than zero, thus indicating that the five soil functions were correlated because they shared impact factors. However, owing to a large number of related variables in this study and their different effects on the soil functions, it was difficult to determine which factor was most sensitive to soil function supply. For example, soil texture, configuration, and bulk density influenced soil structure. Temperature and precipitation affect soil pedogenesis, affecting the soil’s versatility (Geng et al., 2017). Because the level of land-use management affects soil properties directly or indirectly, we discovered that climatic conditions and management levels are almost simultaneously key variables of soil versatility. Combined with the statistical analysis of soil parameters in Table 2 and Table 3, the pH and bulk density exhibited low variation (CV = 0.14), indicating that the soil pH and bulk density values exhibited low dispersion.
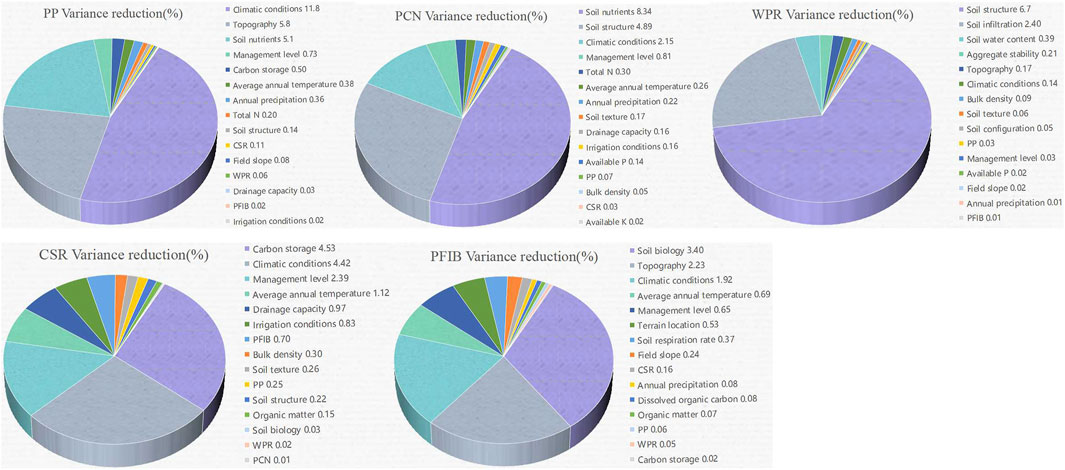
FIGURE 10. Results of BBN sensitivity analysis.
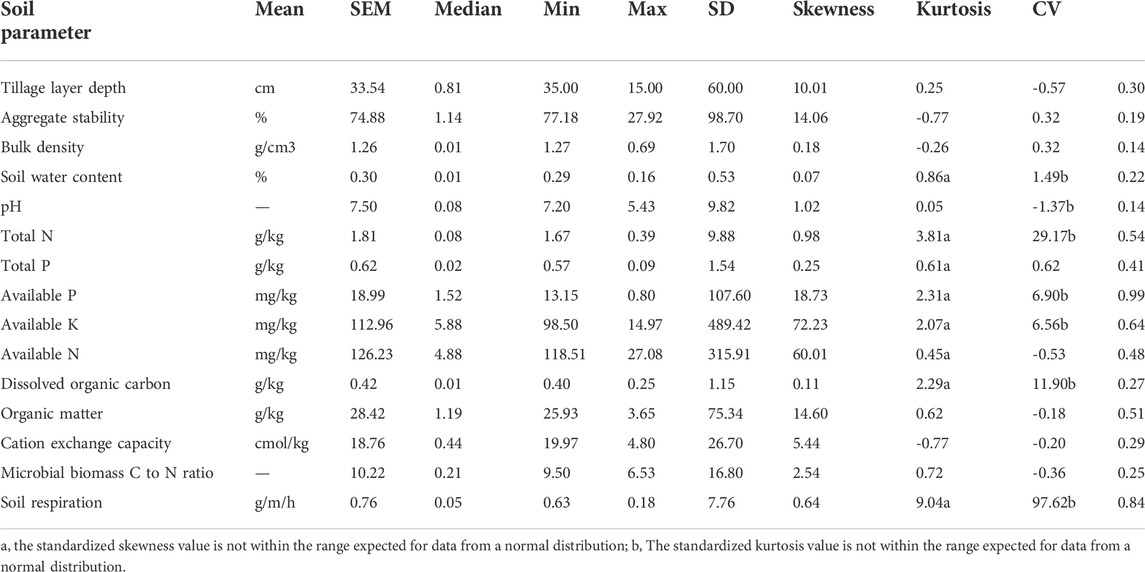
TABLE 2. Summary of the descriptive soil parameters (n = 151).
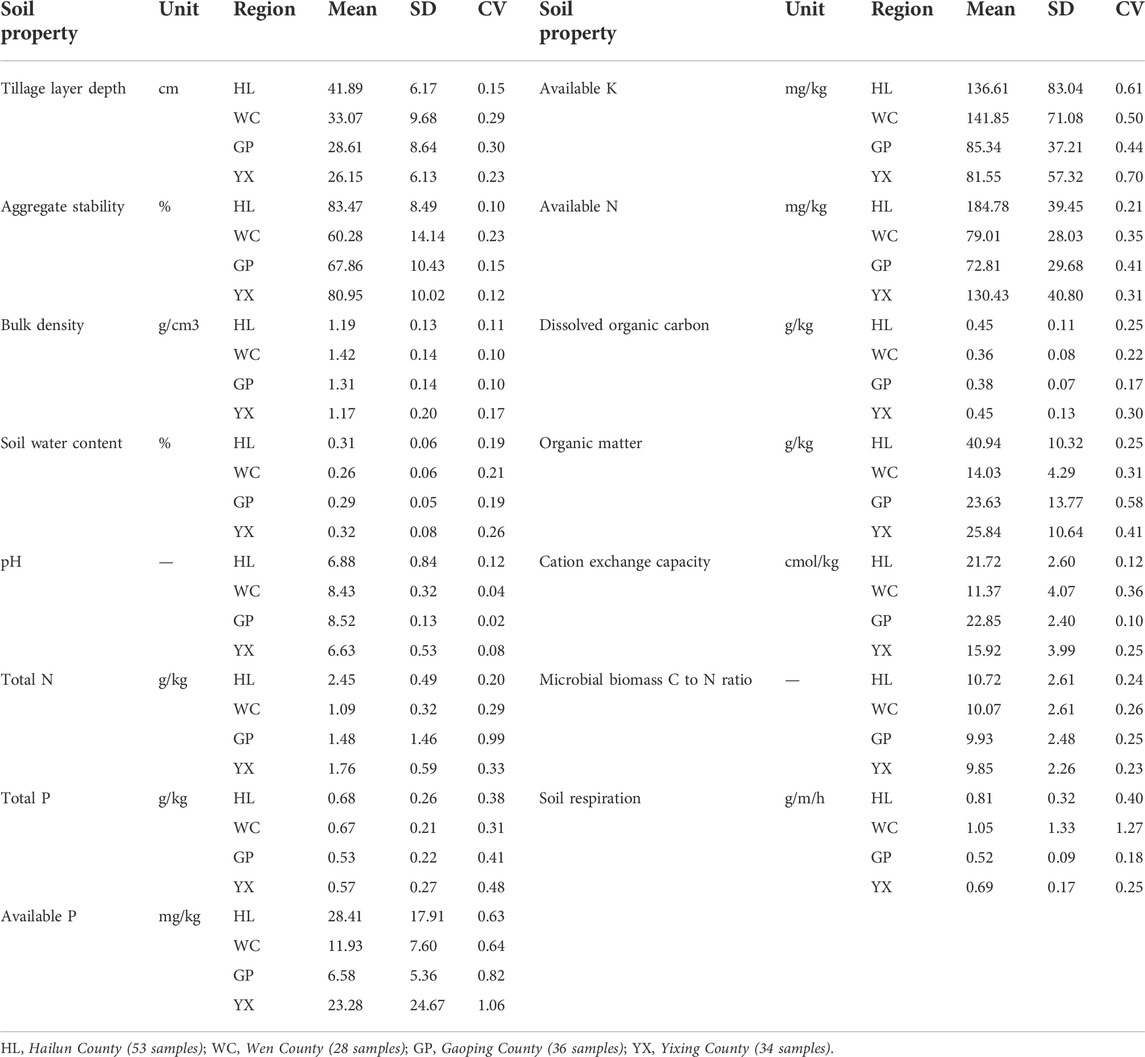
TABLE 3. Descriptive statistics of the soil properties in different regions.
On the other hand, soil respiration and available P were highly variable (CV = 0.84 and 0.99, respectively). The measured bulk density values ranged from 0.69 to 1.70 g/cm3, with a mean value of 1.26 g/cm3. An increase in bulk density is typically associated with a decrease in organic matter and soil moisture content (Nielsen et al., 2014). Thus, the observed difference in soil organic matter and water content could be explained by the higher mean bulk density levels in Wen County compared to other Counties. Soil’s pH directly impacts the formation, transformation, and availability of soil nutrients (Zhang et al., 2019). As a result, their soil nutrient content is relatively high because Helen and Yixing’s average pH values are close to 7 (pH = 6.88 and 6.63, respectively). Because of Soil waterlogging caused by rice cultivation, farmland soil becomes more acidic. Yixing County has the lowest pH mean at 6.63. The pool of biologically available P appears to regulate C and N accumulation in many terrestrial ecosystems (Lloyd et al., 2001). Because farmers in China prefer to apply high-P fertilizers such as diammonium phosphate or compound fertilizers to crops, high concentrations of P and N, P, and K imbalances frequently occur in intensively managed soils, affecting PCN supply capacity. The intensity of respiration can reflect soil organism activity and the intensity of material metabolism (Wang, A., et al., 2023). Given that Helen planting soybeans has a relatively high average value of organic matter and dissolved organic carbon (mean = 40.94 g/kg and 0.45 g/kg, respectively), the cardamom agroforestry system may have the highest soil biodiversity, which may indicate that the microorganisms in the agroforestry system have a relatively better capacity to fix carbon. At the same time, soil respiration varied greatly depending on the plot location’s temperature and moisture (climate conditions) (Gelybó et al., 2022).
Discussion
Trade-offs and synergies among soil multi-functionality
The ability of soils to perform multiple functions simultaneously is called multi-functionality (Creamer et al., 2022). Human demand preferences for soil functions and changes in natural conditions result in soil multifunction trade-offs, mainly when humans prioritize one or more soil functional services (Löbmann et al., 2022). Decision-makers, for example, may attempt to improve intensive cultivated land use while also increasing cultivation income at the expense of decreasing SOC (Fiantis et al., 2022; Gong et al., 2022). Zwetsloot et al. (2021) demonstrated that trade-offs between multiple soil functions are more pronounced in cropland than in grassland. Furthermore, O'Sullivan et al. (2015) highlighted the trade-off between primary productivity and carbon storage in Irish grassland. This trade-off relationship was also discovered in the soil function of cultivated land because the topography is regarded as the primary factor influencing the spatial distribution of both SOC and soil texture (Takoutsing et al., 2018).
As a result, some farmlands with high terrain in Gaoping County perform very poorly regarding CSR and PFIB functions. Furthermore, increasing slope changes soil properties, resulting in changes in land cover and vegetation type (Pham et al., 2018) and crop yield (Ladoni et al., 2016). Witing et al. (2022) identified spatial heterogeneity and climate as critical drivers of synergies and trade-offs between agricultural production, regulation, and maintenance services to achieve landscape-level versatility. We also discovered that climatic conditions, topography, and land management all impact the trade-offs of soil multi-functionality, emphasizing the importance of tailoring sustainable cultivated land management measures to local conditions. A synergistic relationship between Soil regulating services (such as CSR and PFIB) is frequently observed in agro-ecosystems (Li et al., 2022).
In contrast, a trade-off exists between provisioning services (such as PP) and regulating services (such as WPR and CSR), that is, a trade-off between agricultural productivity improvement and the sustainability of ecological services (Zhong et al., 2020), which is consistent with our results. The critical role of soil carbon components in both functions explains the synergistic relationship between soil biodiversity and carbon storage (Van Leeuwen et al., 2019; Zwetsloot et al., 2021). An increase in PP is accompanied by a loss of performance for other soil functions, and Vrebos et al. (2021) also observed lower performance of other soil functions in areas with the highest PP. Because soil functions have synergies and trade-offs, maximizing the supply of all five soil functions simultaneously is difficult. None of the 151 fields in this study could provide all five soil functions simultaneously at a high level. Soil function supply varies primarily due to environmental and management factors and maximization of individual soil functions clearly shows different effects on other soil functions, as well as changes over time in response to policy interventions and environmental changes (Dade et al., 2019). It should be noted that the BBNs include multiple indicators for each soil function and may not provide accurate predictive information about the soil multi-functionality relationship. In the future, we propose using fewer indicators for soil multifunctional sensitivity analysis and re-validating the relationship between soil multi-functionality in a larger study area.
Multifunctional regulation of cultivated land soil for farmers
Farmers and farm owners are the primary subjects of cultivated land soil function regulation at the field scale, and their land management practices directly impact soil function provision (Tesfaye et al., 2022). They may seek to raise the carbon content of their soils to levels deemed sufficient to support soil structure, nutrient cycling, and primary production at the field scale (Eliasson et al., 2010). Farmers’ most commonly used soil inputs are mineral fertilizers, organic materials, pesticides, and water (Singh et al., 2020). These practices were highly successful in increasing output and being economically appealing, but at the expense of environmental quality, increasing pollution, decreasing biodiversity, and other resources such as water and fossil fuels (Keesstra et al., 2016; O'Sullivan et al., 2015). Soil compaction and loss of soil structure have resulted in a high soil bulk density in Wen County as a result of the use of heavy machinery during the annual cultivation period. Daddow, 1983) showed that bulk density values greater than 1.63 g/cm3 inhibit root growth in coarse loamy soils. The majority of fields in Gaoping County do not have access to irrigation. Farmers directly respond to reduced water constraints by applying higher mineral and organic fertilizer doses. The multi-functionality of soil is significantly impacted at the field level by organic soil management (fallow, no-till, cover crops, organic fertilizers, organic additions, and agrochemicals) (Gabriel et al., 2012). It is worth noting that the various effects of soil management measures should be considered under various climatic conditions. For example, no-tillage combined with straw mulching in arid areas reduces mechanical interference while increasing soil water and crop yield by about 7.3%. Long-term no-tillage in sticky soils can cause soil stiffness and poor drainage (Pittelkow et al., 2015). As a result, some fields in Hailun and Yixing County are ineligible for no-tillage. Nutrient cycling can be aided by crop residue management and fertilization timing (inputs) (Wang et al., 2018). Livestock manure application to dryland cropping systems can improve soil biological activity and physical properties affecting water infiltration and retention (Rayne and Aula, 2020). However, it can also contribute to increased soil P if applied at levels higher than crop needs (Calderón et al., 2018). Based on this, we suggest that Hailun County adopts the method of mixing livestock manure with straw, and Gaoping County adopts the method of returning straw to the field to improve soil conditions. Adding perennial forages to dry land cropping systems has increased soil C and improved structural-related properties (Duchene et al., 2019; Wachter et al., 2019). Short-term manure nitrogen can improve soil microbial community structure and diversity in a double-cropping paddy field (Tang et al., 2020). Cover crops have been proposed as a cost-effective method of maintaining Soil and water quality without reducing harvested agricultural products on irrigated lands (Gabriel and Quemada, 2011; Gabriel et al., 2021). In the short term, alternative soil management practices that promote soil-based ecosystem services rather than food production benefit society rather than farmers. As a result, innovative governance strategies are needed to help farmers perceive the ecological function of farmland and understand the benefits more intuitively (Struik and Kuyper, 2017).
It is worth noting that our study was carried out at the field scale, and the main body of soil multifunctional regulation was small farmers. It aimed to provide a reference for optimizing field management measures, changing soil dynamic properties, and maximizing soil functions. At the county or provincial scale at larger scale, it is still necessary to consider the characteristic attributes of cultivated land, such as field uniformity and road accessibility, in order to implement the policy requirements of a larger spatial scale and administrative level.
Understanding and managing soil biodiversity
Soil biodiversity is essential for controlling pest outbreaks, nutrient cycling, carbon sequestration, soil formation, pollution decontamination and bioremediation, food production, and water purification (Underwood et al., 2011). Most agricultural systems’ biodiversity resides in Soil (Brussaard et al., 2007). Many measures or facts that violate traditional biodiversity protection, such as the use of chemical fertilizers and pesticides, and soil disturbance caused by cultivation, must be included in the human management of cultivated land (Wang, 2022). Tillage practices are inadequate for soil worms but good for soil accessibility to roots, weed control, and increased crop yields (Ahmed and Al-Mutairi, 2022). In particular, intensification of land use, crop rotation and crop species, fertilizers and pH, the type and frequency of periodic tillage, pesticide application, and pollution (eco-toxicological studies) are the main driving forces influencing biodiversity in agricultural soils (Aksoy et al., 2017). We indicate that PFIB is closely related to climatic regions and agricultural management. It has been established that increasing agricultural intensity reduces overall soil biodiversity (Tsiafouli et al., 2015).
On the other hand, loss of soil biodiversity can negatively impact ecosystem functions and services, such as decreased productivity or unbalanced nutrient cycling (Bach et al., 2020). No-tillage and conservation tillage management practices in agro-ecosystems can increase soil biodiversity (microbes and animals) and ecosystem services (Luo et al., 2020). Most of the fields studied are primarily intensive production, and using chemical fertilizers and pesticides encourages nutrient storage while endangering soil biological habitat and decreasing soil nutrient cycling capacity. Many agricultural management practices, such as intensive tillage, fertilization, and pesticide use, have been shown to reduce soil biodiversity (Bender et al., 2016), and the loss of specific species can potentially result in the loss of specific soil functions (Philippot et al., 2013). There is a trade-off between PP, PCN, and PFIB under this condition. Vazquez et al. (2021) demonstrated how PP and PCN significantly reduce soil biodiversity. However, based on data from 151 fields, we cannot clarify the relationship between PP, PCN, and PFIB for cultivated land in China. First, land managers’ needs for each of these soil functions vary greatly; in pursuit of agricultural soil productivity, many chemical inputs and unreasonable management lead to the decline of soil biodiversity.
Additionally, second, organic farming management techniques like reduced soil tillage and the use of cover crops offer food and more stable soil moisture conditions for microbial communities (Campos-Herrera et al., 2019); that is, favorable interactions among multi-trophic organisms in agro-ecosystems can promote soil nutrient cycling and increase crop yield (Lupatini et al., 2019). Sustainable agricultural production aims to create a positive feedback loop in agricultural management and production. The continuous cropping obstacle in Wen County and Gaoping County dryland is a typical negative feedback effect, whereas soybean and corn intercropping in Hailun County is a positive feedback effect. As a result, improving the versatility of soil ecosystems through increased biodiversity necessitates a long-term development perspective (Zhang et al., 2020). Furthermore, there is still much to learn about how PFIB interacts with other soil functions, and the mechanism is not yet fully understood in this study.
Conclusion
The main objective of this research was to attempt, for the first time to identify the fundamental relationship between soil multi-functionality in Chinese farmed land using probabilistic inference of BBNs. In most studies, soil physical and chemical processes have dominated such models, whereas soil biological components and processes have rarely been considered. Our study has shown that cultivated soil’s multifunctions are complex and interconnected, and there will be a trade-off between soil supply and regulation services. Farmers’ soil management practices significantly influence this trade-off effect on cultivated land in stable climatic and topographic conditions. As a result, various soil health management methods such as fallow, no-till, planting cover crops, using organic fertilizers, organic amendments, and agrochemicals should be tailored to the problem under different types of cultivated land use.
This research incorporated the concept of trade-offs and synergies into evaluating multiple soil functions. PP and PCN were frequently supplied at high grade because most cultivated land was intensively used. Using chemical fertilizers and pesticides promotes nutrient storage while endangering soil biological habitat and decreasing soil nutrient cycling capacity. Bayesian belief networks include multiple indicators for each soil function and do not provide accurate information about the relationship between soil multi-functionality. We also showed that climatic conditions and land management significantly influenced the trade-offs of soil multi-functionality. Finally, soil function supply varied primarily due to the environment and management, showing different effects on soil functions and changes over time.
Data availability statement
The original contributions presented in the study are included in the article/Supplementary Material, further inquiries can be directed to the corresponding author.
Author contributions
RZ, ZF, and KW contributed to the conception of the study; RZ, JG, and JR contributed significantly to analysis and manuscript preparation; RZ performed the data analyses and wrote the manuscript; RZ, JG, JR, ZF, and KW helped perform the analysis with constructive discussions.
Funding
This work was supported by the National Natural Science Foundation of China 42171261) and the National Key R&D Program of China (No. 2018YFE0107000).
Acknowledgments
We would like to thank the China Scholarship Council (CSC) and Mitigate+: Research for Low Emissions Food Systems and the Global Research Alliance on Agricultural Greenhouse Gases (GRA) through their CLIFF-GRADS programme for providing financial support for this study.
Conflict of interest
The authors declare that the research was conducted in the absence of any commercial or financial relationships that could be construed as a potential conflict of interest.
Publisher’s note
All claims expressed in this article are solely those of the authors and do not necessarily represent those of their affiliated organizations, or those of the publisher, the editors and the reviewers. Any product that may be evaluated in this article, or claim that may be made by its manufacturer, is not guaranteed or endorsed by the publisher.
Supplementary material
The Supplementary Material for this article can be found online at: https://www.frontiersin.org/articles/10.3389/fenvs.2022.1063907/full#supplementary-material
Abbreviations
PP, primary productivity; PCN, provision and cycling of nutrients; PFIB, provision of functional and intrinsic biodiversity; CSR, carbon sequestration and regulation; WPR, water purification and regulation.
References
Adhikari, K., and Hartemink, A. E. (2016). Linking soils to ecosystem services — a global review. Geoderma 262, 101–111. doi:10.1016/j.geoderma.2015.08.009
Ahmed, N., and Al-Mutairi, K. A. (2022). Earthworms effect on microbial population and soil fertility as well as their interaction with agriculture practices. Sustainability 1414 (1313), 78037803. doi:10.3390/su14137803
Aksoy, E., Louwagie, G., Gardi, C., Gregor, M., Schröder, C., and Löhnertz, M. (2017). Assessing soil biodiversity potentials in Europe. Sci. Total Environ. 589, 236–249. doi:10.1016/j.scitotenv.2017.02.173
Bach, E. M., Ramirez, K. S., Fraser, T. D., and Wall, D. J. (2020). Soil biodiversity integrates solutions for a sustainable future. Sustainability 12, 2662. doi:10.3390/su12072662
Bampa, F., O'Sullivan, L., Madena, K., Sandén, T., Spiegel, H., Henriksen, C. B., et al. (2019). Harvesting European knowledge on soil functions and land management using multi-criteria decision analysis. Soil Use Manag. 35 (1), 6–20. doi:10.1111/sum.12506
Barrios, E. (2007). Soil biota, ecosystem services and land productivity. Ecol. Econ. 64 (2), 269–285. doi:10.1016/j.ecolecon.2007.03.004
Baveye, P. C., Baveye, J., and Gowdy, J. (2016). Soil "ecosystem" services and natural capital: Critical appraisal of research on uncertain ground. Front. Environ. Sci. 4, 41. doi:10.3389/fenvs.2016.00041
Bender, S. F., Wagg, C., and van der Heijden, M. G. A. (2016). An underground revolution: Biodiversity and soil ecological engineering for agricultural sustainability. Trends Ecol. Evol. 31, 440–452. doi:10.1016/j.tree.2016.02.016
Bojarszczuk, J., Księżak, J., and Gałązka, A. (2017). Soil respiration depending on different agricultural practices before maize sowing. Plant Soil Environ. 63 (10), 435–441. doi:10.17221/597/2017-PSE
Brookes, P., Landman, A., Pruden, G., and Jenkinson, D. (1985). Chloroform fumigation and the release of soil nitrogen: A rapid direct extraction method to measure microbial biomass nitrogen in soil. Soil Biol. Biochem. 17 (6), 837–842. doi:10.1016/0038-0717(85)90144-0
Brussaard, L., de Ruiter, P. C., and Brown, G. G. (2007). Soil biodiversity for agricultural sustainability. Agric. Ecosyst. Environ. 121, 233–244. doi:10.1016/j.agee.2006.12.013
CalderÓN, F. J., Vigil, M. F., and Benjamin, J. (2018). Compost input effect on dryland wheat and forage yields and soil quality. Pedosphere 28 (3), 451–462. doi:10.1016/S1002-0160(17)60368-0
Campos-Herrera, R., Blanco-Pérez, R., Bueno-Pallero, F. Á., Duarte, A., Nolasco, G., Sommer, R. J., et al. (2019). Vegetation drives assemblages of entomopathogenic nematodes and other soil organisms: Evidence from the Algarve, Portugal. Soil Biol. Biochem. 128, 150–163. doi:10.1016/j.soilbio.2018.10.019
Creamer, R., Barel, J., Bongiorno, G., and Zwetsloot, M. (2022). The life of soils: Integrating the who and how of multifunctionality. Soil Biol. Biochem. 166, 108561. doi:10.1016/j.soilbio.2022.108561
Daddow, R. L. (1983). Growth-limiting soil bulk densities as influenced by soil texture Watershed Systems Development Group. Fort Collins: USDA Forest Service.
Dade, M. C., Mitchell, M. G., McAlpine, C. A., and Rhodes, J. R. (2019). Assessing ecosystem service trade-offs and synergies: The need for a more mechanistic approach. Ambio 48, 1116–1128. doi:10.1007/s13280-018-1127-7
Debeljak, M., Trajanov, A., Kuzmanovski, V., Schröder, J., Sandén, T., Spiegel, H., et al. (2019). A field-scale decision support system for assessment and management of soil functions. Front. Environ. Sci. 7, 115. doi:10.3389/fenvs.2019.00115
Delen, D., Topuz, K., and Eryarsoy, E. (2020). Development of a Bayesian Belief Network-based DSS for predicting and understanding freshmen student attrition. Eur. J. Oper. Res. 281 (3), 575–587. doi:10.1016/j.ejor.2019.03.037
Dou, W., Xiao, B., Wang, Y., and Kidron, G. J. (2022). Contributions of three types of biocrusts to soil carbon stock and annual efflux in a small watershed of Northern Chinese Loess Plateau. Appl. Soil Ecol. 179, 104596. doi:10.1016/j.apsoil.2022.104596
Duchene, O., Celette, F., Ryan, M. R., DeHaan, L. R., Crews, T. E., and David, C. (2019). Integrating multipurpose perennial grains crops in Western European farming systems. Agric. Ecosyst. Environ. 284, 106591. doi:10.1016/j.agee.2019.106591
Eliasson, Å., Jones, R., Nachtergaele, F., Rossiter, D., Terres, J.-M., Van Orshoven, J., et al. (2010). Common criteria for the redefinition of intermediate less favoured areas in the European union. Environ. Sci. Policy 13 (8), 766–777. doi:10.1016/j.envsci.2010.08.003
Feng, Z., Jin, X., Chen, T., and Wu, J. (2021). Understanding trade-offs and synergies of ecosystem services to support the decision-making in the Beijing–Tianjin–Hebei region. Land Use Policy 106, 105446. doi:10.1016/j.landusepol.2021.105446
Fiantis, D., Rudiyanto, , Ginting, F. I., Utami, S. R., Sukarman, , Anda, M., et al. (2022). Sustaining the productivity and ecosystem services of soils in Indonesia, Geoderma Reg. 28, e00488. doi:10.1016/j.geodrs.2022.e00488
Gabriel, J. L., Quemada, M., and González, J. I. (2021). Cover crops reduce soil resistance to penetration by preserving soil surface water content. Geoderma. 386, 114911. doi:10.1016/j.geoderma.2020.114911
Gabriel, J. L., Muñoz-Carpena, R., and Quemada, M. (2012). The role of cover crops in irrigated systems: Water balance, nitrate leaching and soil mineral nitrogen accumulation. Agric. Ecosyst. Environ. 155, 50–61. doi:10.1016/j.agee.2012.03.021
Gabriel, J. L., and Quemada, M. (2011). Replacing bare fallow with cover crops in a maize cropping system: Yield, N uptake and fertiliser fate. Eur. J. Agron. 34 (3), 133–143. doi:10.1016/j.eja.2010.11.006
Gelybó, G., Barcza, Z., Dencső, M., Potyó, I., Kása, I., Horel, Á., et al. (2022). Effect of tillage and crop type on soil respiration in a long-term field experiment on chernozem soil under temperate climate. Soil Tillage Res. 216, 105239. doi:10.1016/j.still.2021.105239
Geng, Y., Baumann, F., Song, C., Zhang, M., Shi, Y., Kühn, P., et al. (2017). Increasing temperature reduces the coupling between available nitrogen and phosphorus in soils of Chinese grasslands. Sci. Rep. 7, 43524. doi:10.1038/srep43524
Ghaley, B. B., Porter, J. R., and Sandhu, H. S. (2014). Soil-based ecosystem services: A synthesis of nutrient cycling and carbon sequestration assessment methods. Int. J. Biodivers. Sci. Ecosyst. Serv. Manag. 10 (3), 177–186. doi:10.1080/21513732.2014.926990
Gong, S., Hodgson, J. A., Tscharntke, T., Liu, Y., van der Werf, W., Batáry, P., et al. (2022). Biodiversity and yield trade-offs for organic farming. Ecol. Lett. 25, 1699–1710. doi:10.1111/ele.14017
Gonzalez-Redin, J., Luque, S., Poggio, L., Smith, R., and Gimona, A. (2016). Spatial Bayesian belief networks as a planning decision tool for mapping ecosystem services trade-offs on forested landscapes. Environ. Res. 144, 15–26. doi:10.1016/j.envres.2015.11.009
Greiner, L., Nussbaum, M., Papritz, A., Fraefel, M., Zimmermann, S., Schwab, P., et al. (2018). Assessment of soil multi-functionality to support the sustainable use of soil resources on the Swiss Plateau. Geoderma Reg. 14, e00181. doi:10.1016/j.geodrs.2018.e00181
Jafarzadeh, A. A., Mahdavi, A., Shamsi, S. R. F., and Yousefpour, R. (2021). Assessing synergies and trade-offs between ecosystem services in forest landscape management. Land Use Policy 111, 105741. doi:10.1016/j.landusepol.2021.105741
Jenkinson, D. S., and Powlson, D. S. (1976). The effects of biocidal treatments on metabolism in soil—I. Fumigation with chloroform. Soil Biol. Biochem. 8 (3), 167–177. doi:10.1016/0038-0717(76)90001-8
Jiang, G., Wang, M., Qu, Y., Zhou, D., and Ma, W. (2020). Towards cultivated land multifunction assessment in China: Applying the "influencing factors-functions-products-demands" integrated framework. Land Use Policy 99, 104982. doi:10.1016/j.landusepol.2020.104982
Kearney, S. P., Fonte, S. J., García, E., Siles, P., Chan, K., and Smukler, S. M. (2019). Evaluating ecosystem service trade-offs and synergies from slash-and-mulch agroforestry systems in El Salvador. Ecol. Indic. 105, 264–278. doi:10.1016/j.ecolind.2017.08.032
Keesstra, S. D., Bouma, J., Wallinga, J., Tittonell, P., Smith, P., Cerdà, A., et al. (2016). The significance of soils and soil science towards realization of the United Nations Sustainable Development Goals. Soil 2 (2), 111–128. doi:10.5194/soil-2-111-2016
Kemper, W. D., and Chepil, W. S. (1965). “Size distribution of aggregates,” in Methods of soil analysis. Editor C. A. Black, 9, 499–510. doi:10.2134/agronmonogr9.1.c39
Kögel-Knabner, I., Amelung, W., Cao, Z., Fiedler, S., Frenzel, P., Jahn, R., et al. (2010). Biogeochemistry of paddy soils. Geoderma 157 (1-2), 1–14. doi:10.1016/j.geoderma.2010.03.009
Kouser, Y., Shah, A. A., and Rasmann, S. (2021). The functional role and diversity of soil nematodes are stronger at high elevation in the lesser Himalayan Mountain ranges. Ecol. Evol. 11, 13793–13804. doi:10.1002/ece3.8061
Ladoni, M., Basir, A., Robertson, P. G., and Kravchenko, A. N. (2016). Scaling-up: Cover crops differentially influence soil carbon in agricultural fields with diverse topography. Agric. Ecosyst. Environ. 225, 93–103. doi:10.1016/j.agee.2016.03.021
Lal, R., Bouma, J., Brevik, E., Dawson, L., Field, D. J., Glaser, B., et al. (2021). Soils and sustainable development goals of the united Nations: An international union of soil sciences perspective. Geoderma Reg. 25, e00398. doi:10.1016/j.geodrs.2021.e00398
Landuyt, D., Broekx, S., and Goethals, P. L. M. (2016). Bayesian belief networks to analyse trade-offs among ecosystem services at the regional scale. Ecol. Indic. 71, 327–335. doi:10.1016/j.ecolind.2016.07.015
Li, X., Lv, X., Yin, R., Fang, B., and Jin, T. (2021). Spatial equilibrium state and its time evolution of the multi-functionalization of regional land use in the eastern China. Pol. J. Environ. Stud. 30, 2827–2841. doi:10.15244/pjoes/128538
Li, Y. Z., Zhang, J. Z., Jia, J. Y., Fan, F., Zhang, F. S., and Zhang, J. L. (2022). Research progresses on farmland soil ecosystem multifunctionality. Acta Pedol. Sin. 1-15. Availableat: https://kns.cnki.net/kcms/detail/32.1119.P.20220121.0822.002.html.
Liu, Y., Ge, T., van Groenigen, K. J., Yang, Y., Wang, P., Cheng, K., et al. (2021). Rice paddy soils are a quantitatively important carbon store according to a global synthesis. Commun. Earth Environ. 2, 154. doi:10.1038/s43247-021-00229-0
Lloyd, J., Bird, M., Veenendaal, E., and Kruijt, B. (2001). Should phosphorus availability be constraining moist tropical forest responses to increasing CO2 concentrations? Glob. Biogeochem. cycles Clim. Syst., 95–114. doi:10.1016/B978-012631260-7/50010-8
Löbmann, M. T., Maring, L., Prokop, G., Brils, J., Bender, J., Bispo, A., et al. (2022). Systems knowledge for sustainable soil and land management. Sci. Total Environ. 822, 153389. doi:10.1016/j.scitotenv.2022.153389
Lu, N., Xu, X., Wang, P., Zhang, P., Ji, B., and Wang, X. (2019). Succession in arbuscular mycorrhizal fungi can be attributed to a chronosequence of Cunninghamia lanceolata. Sci. Rep. 9 (1), 18057. doi:10.1038/s41598-019-54452-z
Luo, Y., Iqbal, A., He, L., Zhao, Q., Wei, S., Ali, I., et al. (2020). Long-term No-tillage and straw retention management enhances soil bacterial community diversity and soil properties in southern China. Agronomy 10 (9), 1233. doi:10.3390/agronomy10091233
Lupatini, M., Korthals, G. W., Roesch, L. F. W., and Kuramae, E. E. (2019). Long-term farming systems modulate multi-trophic responses. Sci. Total Environ. 646, 480–490. doi:10.1016/j.scitotenv.2018.07.323
Lv, Y., Wang, C., Jia, Y., Wang, W., Ma, X., Du, J., et al. (2014). Effects of sulfuric, nitric, and mixed acid rain on litter decomposition, soil microbial biomass, and enzyme activities in subtropical forests of China. Appl. Soil Ecol. 79, 1–9. doi:10.1016/j.apsoil.2013.12.002
Nielsen, U. N., Ayres, E., Wall, D. H., Li, G., Bardgett, R. D., Wu, T., et al. (2014). Global-scale patterns of assemblage structure of soil nematodes in relation to climate and ecosystem properties. Glob. Ecol. Biogeogr. 23, 968–978. doi:10.1111/geb.12177
O'Sullivan, L., Creamer, R. E., Fealy, R., Lanigan, G., Simo, I., Fenton, O., et al. (2015). Functional land management for managing soil functions: A case-study of the trade-off between primary productivity and carbon storage in response to the intervention of drainage systems in Ireland. Land Use Policy 47, 42–54. doi:10.1016/j.landusepol.2015.03.007
O’Sullivan, L., Leeuwis, C., de Vries, L., Wall, D. P., Heidkroß, T., Madena, K., et al. (2022). Trust versus content in multi-functional land management: Assessing soil function messaging in agricultural networks. Environ. Manage. 69 (6), 1167–1185. doi:10.1007/s00267-022-01647-2
Peng, L., Chen, T., Deng, W., and Liu, Y. (2022). Exploring ecosystem services trade-offs using the bayesian belief network model for ecological restoration decision-making: A case study in guizhou Province, China. Ecol. Indic. 135, 108569. doi:10.1016/j.ecolind.2022.108569
Pham, T. G., Nguyen, H. T., Kappas, M. J. I. S., and Research, W. C. (2018). Assessment of soil quality indicators under different agricultural land uses and topographic aspects in Central Vietnam. Int. Soil Water Conservation Res. 6 (4), 280–288. doi:10.1016/j.iswcr.2018.08.001
Philippot, L., Spor, A., Hénault, C., Bru, D., Bizouard, F., Jones, C. M., et al. (2013). Loss in microbial diversity affects nitrogen cycling in soil. ISME J. 7, 1609–1619. doi:10.1038/ismej.2013.34
Pittelkow, C. M., Liang, X., Linquist, B. A., van Groenigen, K. J., Lee, J., Lundy, M. E., et al. (2015). Productivity limits and potentials of the principles of conservation agriculture. Nature 517 (7534), 365–368. doi:10.1038/nature13809
Rayne, N., and Aula, L. (2020). Livestock manure and the impacts on soil health: A review. Soil Syst. 4 (4), 64. doi:10.3390/soilsystems4040064
Rezaei, S. A., Gilkes, R. J., and Andrews, S. S. (2006). A minimum data set for assessing soil quality in rangelands. Geoderma 136 (1-2), 229–234. doi:10.1016/j.geoderma.2006.03.021
Rodríguez-Martín, J. A., Álvaro-Fuentes, J., Gabriel, J. L., Gutiérrez, C., Nanos, N., Escuer, M., et al. (2019). Soil organic carbon stock on the Majorca Island: Temporal change in agricultural soil over the last 10 years. CATENA 181, 104087. doi:10.1016/j.catena.2019.104087
Rottler, C. M., Steiner, J. L., Brown, D. P., and Duke, S. E. (2019). Agricultural management effects on soil health across the US Southern Great Plains. J. Soil Water Conservation 74 (5), 419–425. doi:10.2489/jswc.74.5.419
Sanaullah, M., Usman, M., Wakeel, A., Cheema, S. A., Ashraf, I., and Farooq, M. (2020). Terrestrial ecosystem functioning affected by agricultural management systems: A review. Soil Tillage Res. 196, 104464. doi:10.1016/j.still.2019.104464
Sandén, T., Trajanov, A., Spiegel, H., Kuzmanovski, V., Saby, N., Picaud, C., et al. (2019). Development of an agricultural primary productivity decision support model: A case study in France. Front. Environ. Sci. 58. doi:10.3389/fenvs.2019.00058
Schulte, R. P. O., O'Sullivan, L., Vrebos, D., Bampa, F., Jones, A., and Staes, J. (2019). Demands on land: Mapping competing societal expectations for the functionality of agricultural soils in Europe. Environ. Sci. Policy 100, 113–125. doi:10.1016/j.envsci.2019.06.011
Scrieciu, A., Pagano, A., Coletta, V. R., Fratino, U., and Giordano, R. (2021). Bayesian belief networks for integrating scientific and stakeholders' knowledge to support nature-based solution implementation. Front. Earth Sci. (Lausanne). 505. doi:10.3389/feart.2021.674618
Singh, T. B., Ali, A., Prasad, M., Yadav, A., Shrivastav, P., Goyal, D., et al. (2020). “Role of organic fertilizers in improving soil fertility,” in Contaminants in agriculture. Editors M. Naeem, A. Ansari, and S. Gill (Cham: Springer). doi:10.1007/978-3-030-41552-5_3
Struik, P. C., and Kuyper, T. W. (2017). Sustainable intensification in agriculture: The richer shade of green. A review. Agron. Sustain. Dev. 37, 39. doi:10.1007/s13593-017-0445-7
Sumner, M. E., and Miller, W. P. (1996). Cation exchange capacity and exchange coefficients. Methods soil analysis Part 3 Chem. methods 5, 1201–1229. doi:10.2136/sssabookser5.3.c40
Sun, X., Ye, D., Shan, R., Peng, Q., Zhao, Z., and Sun, J. (2022). Effect of physical geographic and socioeconomic processes on interactions among ecosystem services based on machine learning. J. Clean. Prod. 359, 131976. doi:10.1016/j.jclepro.2022.131976
Syrbe, R. U., and Walz, U. (2012). Spatial indicators for the assessment of ecosystem services: Providing, benefiting and connecting areas and landscape metrics. Ecol. Indic. 21, 80–88. doi:10.1016/j.ecolind.2012.02.013
Takoutsing, B., Weber, J. C., Martín, J. A. R., Shepherd, K., Aynekulu, E., and Sila, A. (2018). An assessment of the variation of soil properties with landscape attributes in the highlands of Cameroon. Land Degrad. Dev. 29 (8), 2496–2505. doi:10.1002/ldr.3075
Tang, H., Li, C., Xiao, X., Shi, L., Cheng, K., Wen, L., et al. (2020). Effects of short-term manure nitrogen input on soil microbial community structure and diversity in a double-cropping paddy field of southern China. Sci. Rep. 10 (1), 13540. doi:10.1038/s41598-020-70612-y
Tesfaye, B., Lengoiboni, M., Zevenbergen, J., and Simane, B. J. L. (2022). Land preservation uptakes in the escarpments of north-eastern Ethiopia: Drivers, sustainability, and constraints. Land 11 (5), 676. doi:10.3390/land11050676
Tsiafouli, M. A., Thébault, E., Sgardelis, S. P., de Ruiter, P. C., van der Putten, W. H., Birkhofer, K., et al. (2015). Intensive agriculture reduces soil biodiversity across Europe. Glob. Chang. Biol. 21 (2), 973–985. doi:10.1111/gcb.12752
Underwood, T., McCullum-Gomez, C., Harmon, A., and Roberts, S. (2011). Organic agriculture supports biodiversity and sustainable food production. J. Hunger Environ. Nutr. 6 (4), 398–423. doi:10.1080/19320248.2011.627301
Valujeva, K., O'Sullivan, L., Gutzler, C., Fealy, R., and Schulte, R. P. O. (2016). The challenge of managing soil functions at multiple scales: An optimisation study of the synergistic and antagonistic trade-offs between soil functions in Ireland. Land Use Policy 58, 335–347. doi:10.1016/j.landusepol.2016.07.028
Van Leeuwen, J. P., Creamer, R. E., Cluzeau, D., Debeljak, M., Gatti, F., Henriksen, C. B., et al. (2019). Modeling of soil functions for assessing soil quality: Soil biodiversity and habitat provisioning. Front. Environ. Sci. 7, 113. doi:10.3389/fenvs.2019.00113
Vazquez, C., de Goede, R. G. M., Rutgers, M., de Koeijer, T. J., and Creamer, R. E. (2021). Assessing multifunctionality of agricultural soils: Reducing the biodiversity trade-off. Eur. J. Soil Sci. 72 (4), 1624–1639. doi:10.1111/ejss.13019
Vogel, H. J., Eberhardt, E., Franko, U., Lang, B., Ließ, M., Weller, U., et al. (2019). Quantitative evaluation of soil functions: Potential and state. Front. Environ. Sci. 164. doi:10.3389/fenvs.2019.00164
Vrebos, D., Jones, A., Lugato, E., O'Sullivan, L., Schulte, R., Staes, J., et al. (2021). Spatial evaluation and trade-off analysis of soil functions through Bayesian networks. Eur. J. Soil Sci. 72 (4), 1575–1589. doi:10.1111/ejss.13039
Wachter, J. M., Painter, K. M., Carpenter-Boggs, L. A., Huggins, D. R., and Reganold, J. P. (2019). Productivity, economic performance, and soil quality of conventional, mixed, and organic dryland farming systems in eastern Washington State. Agric. Ecosyst. Environ. 286, 106665. doi:10.1016/j.agee.2019.106665
Wang, A., Liu, S., Xie, J., Ouyang, W., He, M., Lin, C., et al. (2023). Response of soil microbial activities and ammonia oxidation potential to environmental factors in a typical antimony mining area. J. Environ. Sci. 127, 767–779. doi:10.1016/j.jes.2022.07.003
Wang, M., Pendall, E., Fang, C., Li, B., and Nie, M. (2018). A global perspective on agroecosystem nitrogen cycles after returning crop residue. Agric. Ecosyst. Environ. 266, 49–54. doi:10.1016/j.agee.2018.07.019
Wang, X. (2022). Managing land carrying capacity: Key to achieving sustainable production systems for food security. Land 11 (4), 484. doi:10.3390/land11040484
Witing, F., Forio, M. A. E., Burdon, F. J., Mckie, B., Goethals, P., Strauch, M., et al. (2022). Riparian reforestation on the landscape scale: Navigating trade-offs among agricultural production, ecosystem functioning and biodiversity. J. Appl. Ecol. 59, 1456–1471. doi:10.1111/1365-2664.14176
Wu, J., Jin, X., Wang, H., and Feng, Z. (2022). Evaluating the supply-demand balance of cultural ecosystem services with budget expectation in Shenzhen, China. Ecol. Indic. 142, 109165. doi:10.1016/j.ecolind.2022.109165
Zhang, G. L., Wu, H., Shi, Z., Yan, X., and Shen, R. (2022a). Priorities of soil research and soil management in China in the coming decade. Geoderma Reg. 29, e00537. doi:10.1016/j.geodrs.2022.e00537
Zhang, J. L., Zhang, J. Z., Shen, J. B., Tian, J., Jin, K., and Zhang, F. S. (2020). Soil health and agriculture green Development: Opportunities and challenge. Acta Pedol. Sin. 57, 783–796. doi:10.11766/trxb202002220064
Zhang, S., Zhao, R., Wu, K., Huang, Q., and Kang, L. (2022b). Effects of the rapid construction of a high-quality plough layer based on woody peat in a newly reclaimed cultivated land area. Agriculture 12 (1), 31. doi:10.3390/agriculture12010031
Zhang, Y. Y., Wu, W., and Liu, H. (2019). Factors affecting variations of soil pH in different horizons in hilly regions. PLOS One 14 (6), e0218563. doi:10.1371/journal.pone.0218563
Zhao, R., Li, J., Wu, K., and Kang, L. (2021). Cultivated land use zoning based on soil function evaluation from the perspective of black soil protection. Land 10 (6), 605. doi:10.3390/land10060605
Zhao, R., and Wu, K. (2021). Soil health evaluation of farmland based on functional soil management—a case study of yixing city, Jiangsu Province, China. Agriculture 11 (7), 583. doi:10.3390/agriculture11070583
Zhong, L., Wang, J., Zhang, X., and Ying, L. (2020). Effects of agricultural land consolidation on ecosystem services: Tradeoffs and synergies. J. Clean. Prod. 264, 121412. doi:10.1016/j.jclepro.2020.121412
Zhou, Y., Fenton, N., and Neil, M. (2014). Bayesian network approach to multinomial parameter learning using data and expert judgments. Int. J. Approx. Reason. 55 (5), 1252–1268. doi:10.1016/j.ijar.2014.02.008
Zuber, S. M., Behnke, G. D., Nafziger, E. D., and Villamil, M. B. (2017). Multivariate assessment of soil quality indicators for crop rotation and tillage in Illinois. Soil Tillage Res. 174, 147–155. doi:10.1016/j.still.2017.07.007
Keywords: agro-ecosystem, bayesian belief networks, soil ecosystem services, soil parameters, soil multi-functionality
Citation: Zhao R, Gabriel JL, Rodríguez Martín JA, Feng Z and Wu K (2022) Understanding trade-offs and synergies among soil functions to support decision-making for sustainable cultivated land use. Front. Environ. Sci. 10:1063907. doi: 10.3389/fenvs.2022.1063907
Received: 07 October 2022; Accepted: 07 November 2022;
Published: 22 November 2022.
Edited by:
Jeroen Meersmans, University of Liège, BelgiumReviewed by:
Xiaoyin Sun, Qufu Normal University, ChinaTianqian Chen, Beijing Normal University, China
Copyright © 2022 Zhao, Gabriel, Rodríguez Martín, Feng and Wu. This is an open-access article distributed under the terms of the Creative Commons Attribution License (CC BY). The use, distribution or reproduction in other forums is permitted, provided the original author(s) and the copyright owner(s) are credited and that the original publication in this journal is cited, in accordance with accepted academic practice. No use, distribution or reproduction is permitted which does not comply with these terms.
*Correspondence: Kening Wu, d3VrZW5pbmdAY3VnYi5lZHUuY24=