 Bing Wang1
 Mengjie Li
 Lingshan Ni
 Nufang Fang
- 1State Key Laboratory of Soil Erosion and Dryland Farming on the Loess Plateau, Institute of Soil and Water Conservation, Northwest A & F University, Xianyang, China
- 2Institute of Soil and Water Conservation, Chinese Academy of Sciences and Ministry of Water Resources, Xianyang, China
- 3College of Resource and Environment, Northwest A & F University, Xianyang, China
Soil erosion is affected by nature and human activities. Compared with biophysical factors, the effects of socio-economic factors on soil erosion have not been well investigated. Here, taking two prefectures (Yan’an and Qingyang) with different socio-economic conditions and ecological restoration intensity on the Chinese Loess Plateau (CLP) as a case, we combined the Revised Universal Soil Loss Equation (RUSLE), partial least squares structural equation modeling (PLS-SEM), and gray relation analysis to explore the response of soil erosion to socio-economic development. Our results showed that Grain for Green Program (GGP) has effectively controlled soil erosion and increased the vegetation coverage of the study area. For Yan’an, the vegetation coverage was increased by 6.2% and erosion modulus was decreased by 33.9% in 2015 compared with that in 1995. The differences in industrial structure and agricultural input led to different responses of soil erosion to socio-economic development. Economic development and agricultural input accelerated soil erosion in Qingyang but inhibited soil erosion in Yan’an due to different development strategies. Moreover, the increase of the gray relation grade between socio-economic factors and soil erosion in Yan’an indicates that soil erosion is easier to be controlled by the development of the socio-economy. The results indicate that the triple-win situation of economic development, vegetation restoration, and soil conservation can be realized by adjusting the economic structure, strengthening ecological restoration, and agricultural investment. This research emphasizes the important effect of socio-economic development on soil erosion and provides a reference for soil erosion control and ecological restoration for regions suffering from severe soil erosion.
1 Introduction
Soil erosion remains one of the most important environmental problems in the world, which accelerates land degradation, promotes water pollution, and threatens food security, thereby impeding the achievement of sustainable development goals 2.4 and 15.3 of the United Nations (Pradhan et al., 2017; Fu et al., 2019; Wuepper et al., 2020). Compare with socio-economic factors, current researches focus more on the effects of biophysical factors on soil erosion (Luetzenburg et al., 2020; Liang and Fang, 2021). However, with the acceleration of urbanization, the effect of socio-economic factors such as economic development, population, and land use structure on erosion has gradually increased (Panagos et al., 2018). Borrelli et al. (2017) found that human activities and relevant land use changes are the main factors that accelerate global soil erosion. Wuepper et al. (2020) compared the soil erosion rate of different countries and found that agricultural activities are the main driving force of soil erosion acceleration. Therefore, the relationship between socio-economic development and soil erosion deserves further exploration.
In the initial period of social development, urbanization and economic development always rely on secondary industries including mining and construction, which bring enormous destruction on the ecological environment and further accelerate soil erosion (Wang et al., 2018; Jeong and Dorn, 2019). At the same time, the increase in urban population put more pressure on food security, and the expansion of cropland leading to improved agricultural activities change the land use structure and accelerate land degradation (Shi et al., 2020). With the development of urbanization, the government paid more attention to soil conservation and a series of ecological programs have been implemented to control soil erosion (Cao et al., 2021). However, differences in socio-economic conditions led to different effects of soil conservation among regions, and the key socio-economic factors that affect soil erosion have not been well assessed (Zhou et al., 2021).
The Chinese Loess Plateau (CLP) is one of the most severely eroded areas of the world (Xu and Zhang, 2021b). Rapid urbanization and unbalanced socio-economic development have led to deforestation and accelerated soil erosion (Wei et al., 2006). To mitigate the degradation of the environment, the world’s largest ecological restoration program named the Grain for Green Program (GGP) has been implemented on the CLP from 1998 (Bryan et al., 2018). The implication of GGP significantly improved the ecosystem in multiple aspects, and soil erosion has been controlled through the optimization of land use structure (Jin et al., 2021; Zhang et al., 2021). However, the soil conservation effect of GGP was different in each administrative region of CLP, which has gained much attention in recent years (Li et al., 2021; Yang and Zhang, 2021). Sun et al. (2013) found there are significant differences in erosion rates among different prefectures on the CLP. Ning et al. (2021) hold the view that GGP implementation intensity influences soil conservation effects in different counties. These previous studies have focused more on the impact of vegetation restoration project on soil erosion, ignoring the role of potential socio-economic factors, which greatly limited the sustainability of vegetation restoration and soil conservation. Therefore, it is urgent to identify the socio-economic driving forces of soil erosion under the background of GGP and analyze how to coordinate the relationship between socio-economic development and ecological restoration.
To address the problems mentioned above, this work selected Yan’an and Qingyang on the CLP, with different socio-economic development and ecological restoration, as our study area. The effectiveness of GGP and the effects of socio-economic development on soil erosion in different prefectures were evaluated. Specifically, this study aimed to 1) analyze the dynamic changes in land use and soil erosion in different prefectures, 2) quantify the driving effects of socio-economic factors on soil erosion, and 3) clarify the interaction between socio-economic development and ecological restoration.
2 Materials and methods
2.1 Study area
Yan’an and Qingyang prefectures are located in the center of CLP and belong to typical hilly and gully regions (35°15ʹ–37°31ʹN, 106°20ʹ–110°31ʹE). Our study area covers an area of 64,119 km2, with 37,000 km2 of Yan’an and 27,119 km2 of Qingyang. Yan’an is situated in the north of Shaanxi Province and has 13 counties; Qingyang is located in the east of Gansu Province and has 8 counties (Figure 1). The terrain of the study area is high in the north and low in the south, with an average elevation of about 1,300 m. The study area has a semi-arid climate with an annual average temperature of about 9.5°C. The annual average precipitation is about 500 mm, and the rainfall is mainly concentrated from July to September, which accounts for 60%–80% of the total amount.
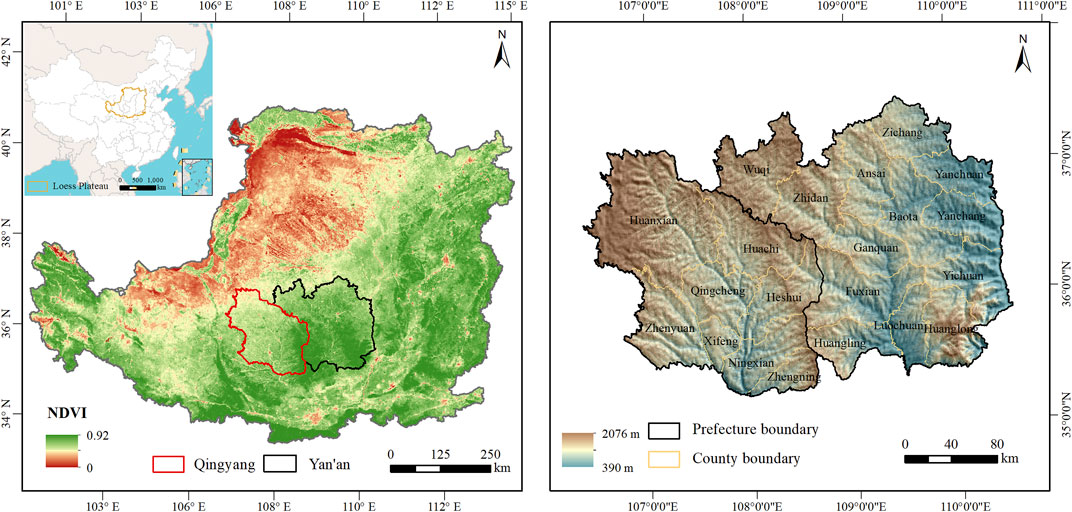
FIGURE 1. Location and digital elevation model (DEM) of the study area.
Yan’an and Qingyang prefectures are geographically adjacent to each other and have similar climate and terrain conditions. Since 1999, GGP has been adopted in Yan’an and Qingyang; as a result, soil erosion has been controlled and the vegetation coverage has improved significantly. However, we found that the effects of GGP have significant differences by analyzing the annual maximum NDVI variations of the two prefectures. Moreover, the socio-economic development of these prefectures has obvious differences. The GDP of Yan’an reached 119.58 billion yuan in 2015, which is nearly twice as high as that of Qingyang (Figure 2).
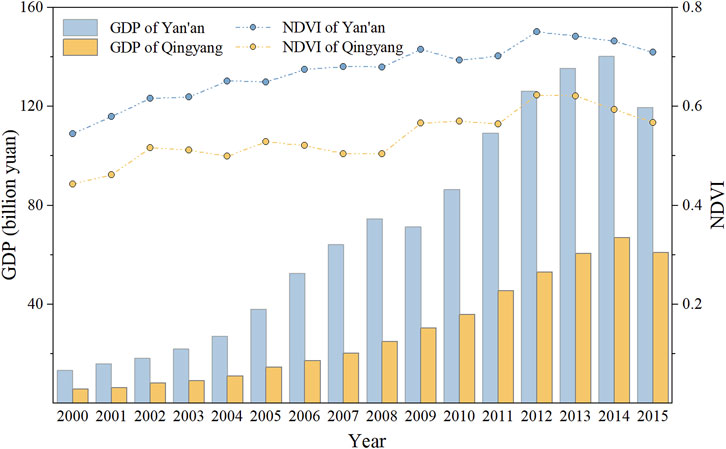
FIGURE 2. Changes in the annual maximum NDVI and GDP of the study area between 2000 and 2015.
2.2 Soil erosion model
The Revised Universal Soil Loss Equation (RUSLE) is one of the most widely adopted models that can represent the effects of climate, soil, topographic, and land use on soil erosion (Ghosal and Das Bhattacharya, 2020; Borrelli et al., 2021). It has been proven to be suitable for CLP and can provide reliable simulation results (Sun et al., 2014; Li et al., 2017). Therefore, the RUSLE was utilized to estimate the annual average erosion modulus of the study area in ArcGIS 10.3. All raster data were resampled to 30 m resolution for calculation. The RUSLE is defined as follows:
where A is the average soil loss (t hm−2 yr−1), R is the rainfall erosivity factor (MJ mm hm−2 h−1 yr−1), K is the soil erodibility factor (t hm2 h hm−2 MJ−1 mm−1), LS is the topographic factor (dimensionless), C is the vegetation coverage and management factor (dimensionless), and P is the support practice factor (dimensionless).
The rainfall erosivity factor (R) is relevant to rainfall amount, duration, and intensity, and it is usually estimated based on precipitation data (Nearing et al., 2017). Given that our study mainly considers the driving effects of socio-economic factors on soil erosion, the grid data of annual average rainfall erosivity in China developed by Xie et al. (2018) were adopted.
where N is the total number of years, m is the total number of days with erosivity rainfall, Pi,k is the daily rainfall for day k in the i-th year (mm), α is a coefficient which is 0.3946 in the warm season (May to September) and 0.3156 in the cold season (September to April).
The soil erodibility factor (K) represents the susceptibility of soil to erosion by rain water and runoff and can be measured on standard plot (Parysow et al., 2003). The K factor is related to the texture, structure, and organic matter content of soil erosion (Sharpley and Williams, 1990). In the present study, we calculated K by using the EPIC equation developed by Williams and Jones. (1984):
where SAN, SIL, and CLA are the sand, silt, and clay fractions (%), respectively; and C is the soil organic carbon content (%).
The effect of slope length and slope gradient on soil erosion is represented by the topographic factor (LS), which can be estimated based on the digital elevation model (DEM) (Hickey et al., 1994). In this study, we calculated LS by the algorithms developed by Liu et al. (1994). All the results were based on DEM (ASTER GDEM) with 30 m resolution (http://www.gscloud.cn):
where γ is the slope length (m), θ is the slope angle (%), and m is a dimensionless constant depending on the slope.
The C factor reflects the effects of vegetation coverage and cropping management measures on soil erosion. It is always related to the fractional vegetation cover (f), which can be calculated by NDVI. In the present study, the NDVI dataset with 30 m resolution was composited by Landsat5 TM and Landsat8 OLI images in the Google Earth Engine system, and the method developed by Cai and Ding. (2000) was adopted to calculate the C factor. The formula is expressed as follows:
where NDVIsoil is the NDVI value for pure bare soil pixel, and NDVImax refers to the NDVI value for regional pure vegetation pixel.
The P factor reflects the ratio of soil loss in specific measures and is the most difficult factor to determine in the RUSLE (Lane et al., 1992). According to previous studies, P is closely related to land use and slope. Thus, we determined this factor based on land use classification map and slope gradient by referencing the method of Sun et al. (2014). Among them, the p-value of water and construction land is 0, the p-value of forest is 0.7, the p-value of grassland is 0.9, the p-value of unused land is 1, and the p values of cropland with slope of 0–15°, 15–25°, and >25° are 0.2, 0.35, and 0.8, respectively.
2.3 Data analysis
2.3.1 Partial least squares structural equation modeling (PLS-SEM)
PLS-SEM is typically used for casual network estimation among latent variables (Grace et al., 2012). The manifest variables can be measured directly, and the latent variables can be expressed by a series of manifest variables. Compared with SEM, PLS-SEM is suitable for small sample sizes and can be used to evaluate the interaction between variables effectively (Shen et al., 2016). It relaxes the assumption of normal distribution and has the ability to solve the model with numerous indicators, which is more appropriate in social science studies (Hair et al., 2019; Wang et al., 2022).
In this work, the driving effects of socio-economic factors on soil erosion during the whole period (1995–2015) were analyzed based on PLS-SEM. The construction and analysis of PLS-SEM were based on Smart-PLS 3.0. Considering the influence factors of soil erosion are various, we selected socio-economic factors based on relevant literature (Du et al., 2011; Wang et al., 2020; Yu et al., 2021a). A total of 12 manifest variables were selected to construct a socio-economic factor system, which includes two economic factors (GDP and GDP per capita), three population factors (total population, rural population, and population density), three land use factors (area of cropland, area of forest and area of construction land), two agricultural input factors (the intensity of fertilization and total power of agricultural machinery), and two agricultural output factors (total grain production and gross agricultural output value) (Table 1). All socio-economic panel data at the county level were collected from Yan’an and Qingyang statistical yearbooks.
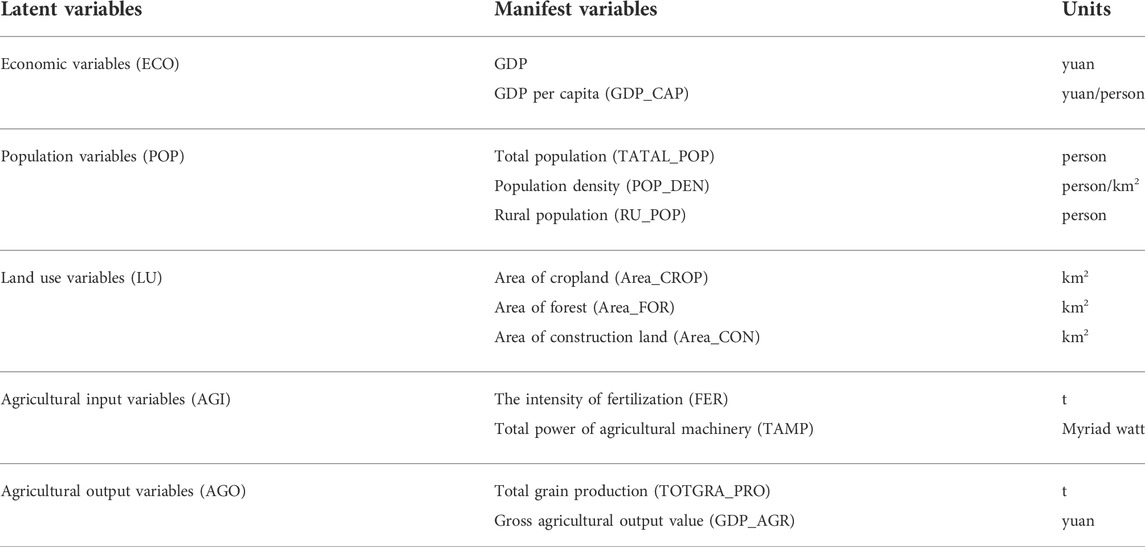
TABLE 1. The details of socio-economic factors system.
The reliability and validity of PLS-SEM were evaluated by the goodness of fit (GOF) in this study. GOF refers to a statistical test that determines how well sample data fits a distribution from a population with a normal distribution, which is required to be better than 0.5. It was calculated as follows (Tenenhaus et al., 2005):
where P is the number of latent variables,
2.3.2 Gray relation analysis
Gray relation analysis, which was developed by Ju-Long. (1982), is a multi-factor statistical method for determining the correlation grade between factors by judging the geometric proximity of different factor sequences. This method has less requirements on sample size and typical probability distribution and is very easy to calculate. The relationship between socio-economic factors and soil erosion is complicated and it contains incomplete information, which actually can be seen as a gray system. In this study, gray relation analysis was used to evaluate gray relation grade (GRG) between socio-economic factors and soil erosion in different periods. The method developed by Winarni and Indratno. (2018) was used to calculate GRG in SPSS 26.0. The steps are as follows: 1) normalize the socio-economic data, 2) reference sequence definition, 3) gray relation coefficient calculation, and 4) gray relation grade calculation.
3 Results
3.1 Spatiotemporal variation in land use and soil erosion of different prefectures
Land use changes in these two prefectures have differences in the past 20 years. As shown in Figure 3A, the cropland area of Yan’an decreased from 11,762 km2 to 9,350 km2 of which 95.8% was converted into forest and grassland. The forest area gained about 1,271 km2 from 1995 to 2015, and the vegetation coverage reached 73.5% in 2015. Compared with Yan’an, the increase of vegetation coverage in Qingyang was not notable (Figure 3B). A total of 1,053 km2 of cropland was estimated to be lost from 1995 to 2015. The forest area only increased by 579 km2, and the vegetation coverage increased to 62.5% in 2015.
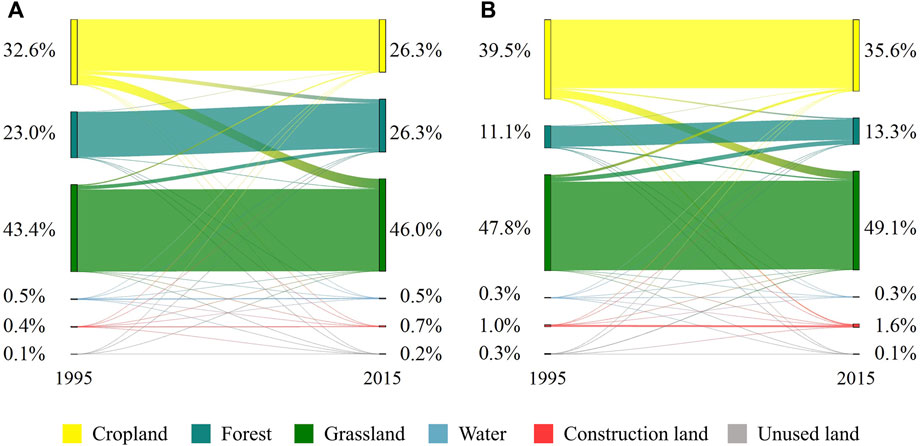
FIGURE 3. Land use change in Yan’an (A) and Qingyang (B) from 1995 to 2015.
According to the Technological Standard of Soil and Water Conservation SL190-2007, soil erosion can be classified into six levels: Slight, mild, moderate, intense, extreme, and severe (Ministry of Water Resources of PR China, 2008). Figures 4A–C illustrates that the annual average erosion modulus of Yan’an decreased by 30.54 t hm−2 yr−1 and reached the minimum of 59.58 t hm−2 yr−1 in 2015. Specifically, the proportion of areas with slight erosion (<10 t hm−2 yr−1) increased by 17.13% and accounted for 38.04% of the total area. At the county level, the annual average erosion modulus decreased most in Yanchang county, which decreased by 63.76 t hm−2 yr−1 in the past 20 years and the erosion modulus decreased by more than 30 t hm−2 yr−1 in 9 counties of Yan’an (Table 2). These results depict that the implementation of GGP has alleviated soil erosion significantly in Yan’an. For Qingyang, the annual average erosion modulus decreased from 75.18 t hm−2 yr−1 to 62.68 t hm−2 yr−1 from 1995 to 2015 (Figures 4D–F). About 28.7% and 33.6% of areas with severe erosion (>150 t hm−2 yr−1) were transformed into areas with moderate and intense erosion. However, the area of slight erosion increased a little. More specifically, only the annual average erosion modulus of Zhengning county decreased by more than 30 t hm−2 yr−1 and the erosion modulus decline in other counties was not obvious (<20 t hm−2 yr−1). In general, the ecological environment of the study area continuously improved during GGP, but Yan’an has gained more remarkable achievements compared with Qingyang.
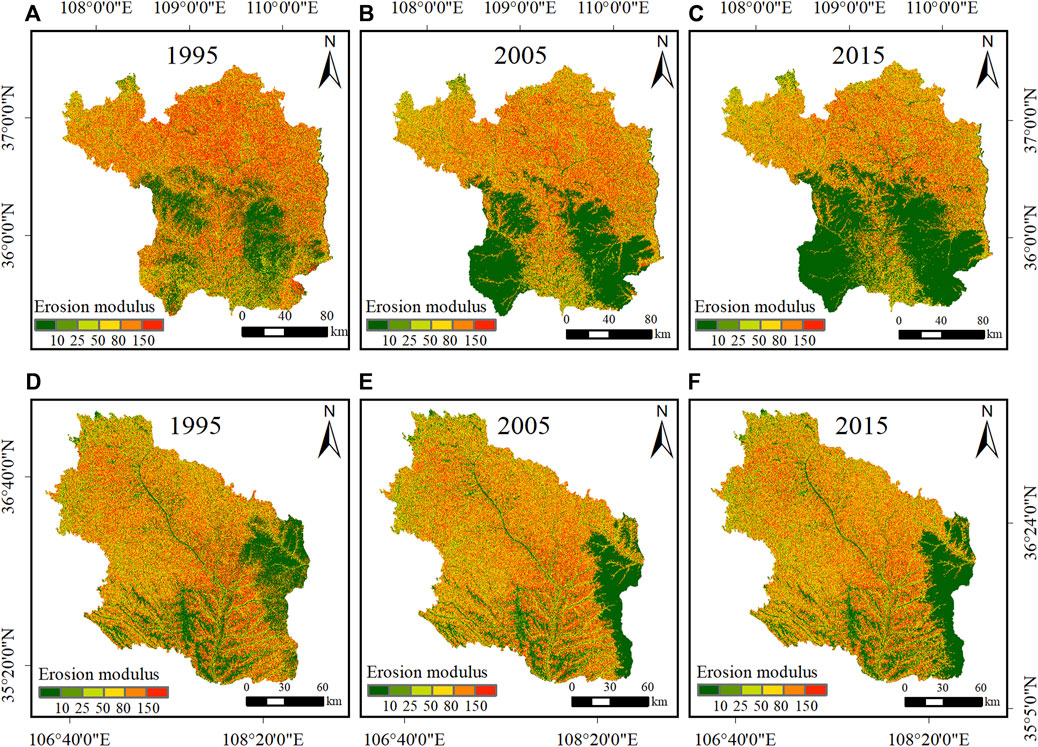
FIGURE 4. Spatial distribution of soil erosion (t·hm−2·yr−1) in Yan’an (A–C) and Qingyang (D–F) in 1995, 2005, and 2015.
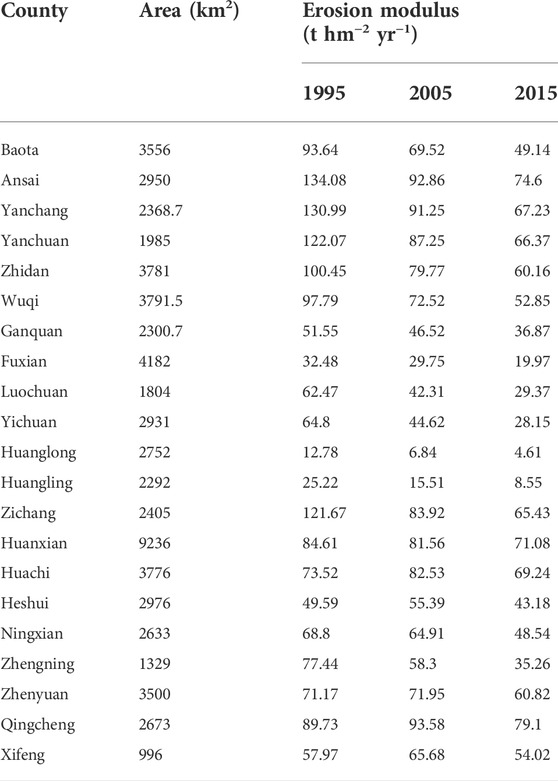
TABLE 2. Erosion modulus of each county from 1995 to 2015.
3.2 Driving effects of socio-economic factors on soil erosion during the whole period
Based on the socio-economic panel data and erosion modulus of Yan’an (n = 65) and Qingyang (n = 40), the PLS-SEM was constructed to analyze the overall driving effect of socio-economic factors on soil erosion from 1995 to 2015. The GOFs of Yan’an and Qingyang are 0.58 and 0.52 (>0.5), respectively. It indicates that all the models are effective and reliable.
As shown in the model of Yan’an in Figure 5A, population variables promoted soil erosion with a path coefficient of 0.376. By contrast, the effects of agricultural input and agricultural output variables were negative with direct effects of −0.063 and −0.071. Economic and Land use variables had significant controlling effects of −0.100 and −0.737 on soil erosion. The path coefficient of Qingyang is presented in Figure 5B and had notable differences compared with Yan’an. Economic variables were important promoting factors with a path coefficient of 0.326, and the promoting effects of agricultural input and population variables were 0.025 and 0.450, respectively. Land use and agricultural output had the highest controlling effect, with path coefficients of −0.760 and −0.562, respectively.
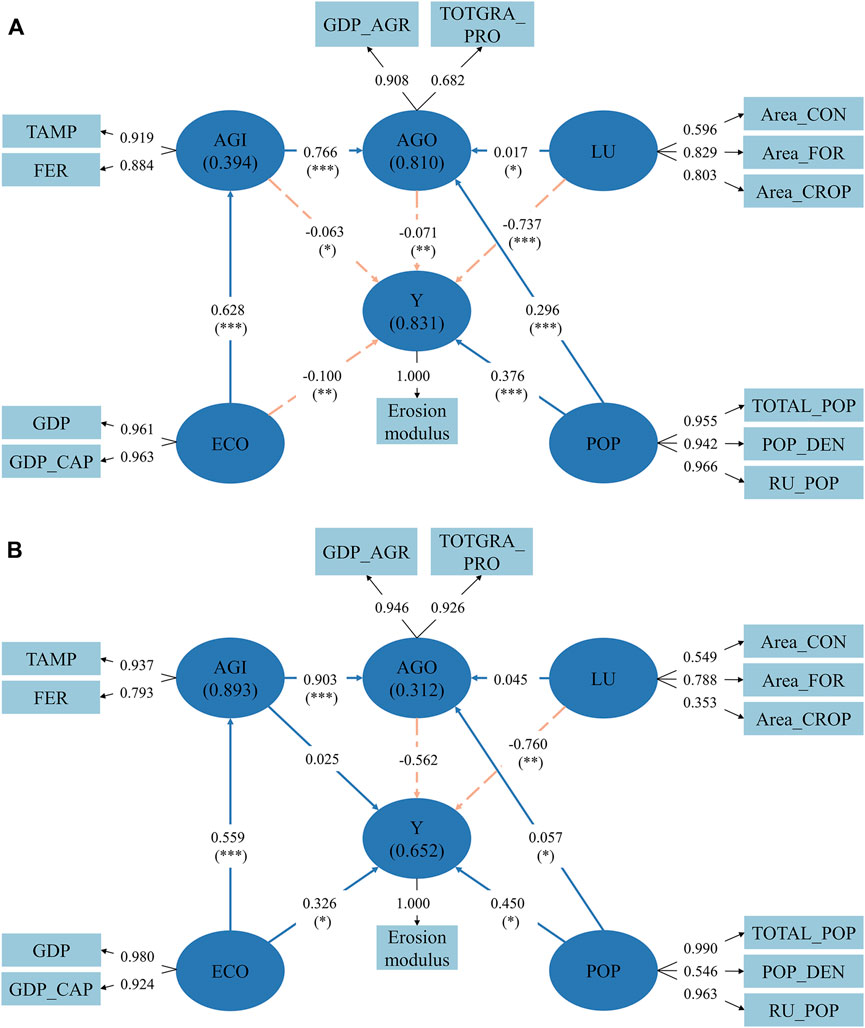
FIGURE 5. Partial least squares structural equation model showing the relationship between socio-economic factors and soil erosion of Yan’an (A) and Qingyang (B). Abbreviations are defined in Table 1. The ellipses represent latent variables and the rectangles represent manifest variables. The lines between latent variables are paths, and the lines from latent variable to manifest variable are loadings. Orange lines indicate negative correlation and blue lines indicate positive correlation. ∗, ∗∗ and ∗∗∗ indicate significance levels of p < 0.05, 0.01, and 0.001, respectively.
3.3 Gray relation grade between socio-economic factors and soil erosion
The gray relation analysis was used to analyze the socio-economic driving effects of soil erosion at different stages based on socio-economic and soil erosion data. The correlations between socio-economic factors and soil erosion were represented by gray relation grade (GRG).
As shown in Figure 6A, soil erosion was significantly affected by socio-economic factors in Yan’an, and the GRG of each factor gradually increased over time. The GRG of agricultural output was higher than the other factors in 1995 and 2005. Population variable was the most important factor over time, indicating that urbanization and population growth are closely related to soil erosion. By contrast, GRG presented a downward trend at all times in Qingyang (Figure 6B). This phenomenon illustrates that socio-economic development has less impact on changes in soil erosion. The contradiction between socio-economic development and soil erosion should be further alleviated.
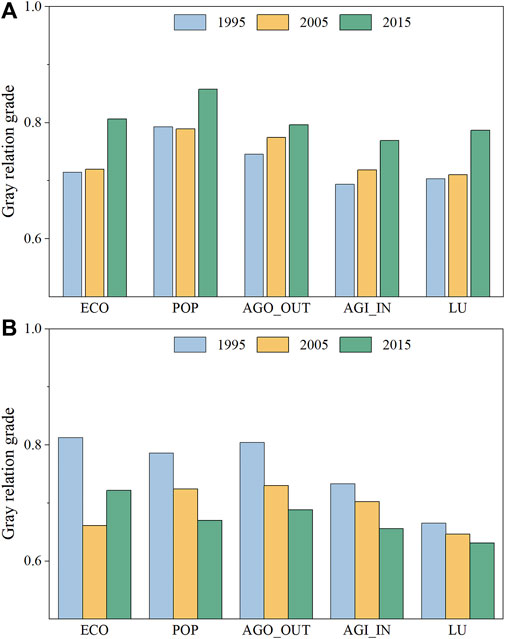
FIGURE 6. Gray relation grade of latent variables in Yan’an (A) and Qingyang (B). ECO, economic development; POP, population; AGO, agricultural output; AGI, agricultural input; LU, land use.
Then we calculated the GRG of manifest variables (Figure 7). For Yan’an, cropland area and rural population were the main factors that affected soil erosion. More specifically, the GRG of the cropland area increased from 0.85 to 0.89 after 20 years, and the GRG of rural population reached 0.82 in 2015. This finding indicates that GGP has a great impact on soil erosion by influencing cropland area and rural population. Conversely, for Qingyang, the GRG of most manifest variables decreased over time. The rural population had the highest GRG among these factors, indicating that it had a great impact on soil erosion, but the influence degree gradually decreased. The GRG of the total power of agricultural machinery slightly increased over 20 years, indicating that the development of agricultural technology could effectively influence soil erosion.
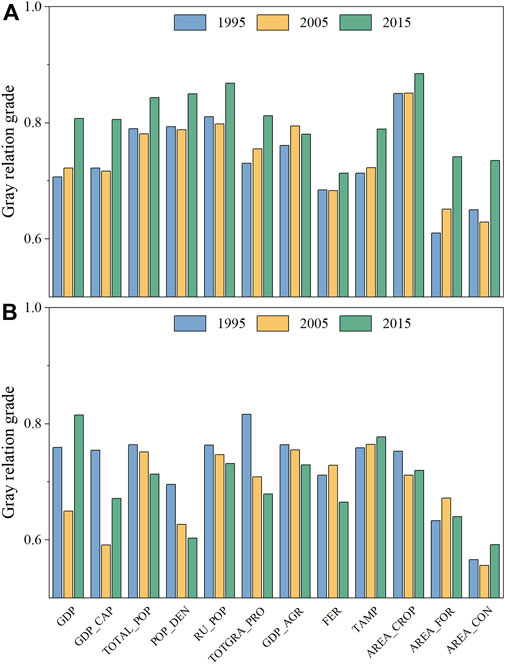
FIGURE 7. Gray relation grade of manifest variables in Yan’an (A) and Qingyang (B). Abbreviations are defined in Table 1.
4 Discussion
4.1 Driving effect of economic development on soil erosion
Based on the PLS-SEM results, the driving effect of each socio-economic factor on soil erosion varies between prefectures. Economic development is one of the key factors, and its impact on soil erosion has two sides (Vanwalleghem et al., 2017). On the one hand, economic development could increase the investment ability of soil conservation, but on the other, economic development is usually at the expense of resource consumption and ecological interference (Ekeocha, 2021). The final effect of economic development on soil erosion always depends on the trade-off between ecosystem damage and protection (Odongo et al., 2014; Vávra et al., 2019).
At the beginning of development, economic growth mainly relies on agricultural development, which comes at the cost of deforestation, land degradation, and soil erosion increase significantly (Ping et al., 2013; Eekhout and de Vente, 2022). After long-term development, the economic structure of Yan’an was dominated by secondary and tertiary industries, and the economic development could provide more financial support for ecological restoration and soil conservation (with a path coefficient of −0.100 in the whole period). However, the economic development of Qingyang still highly depended on agriculture and industry, the achievements of GGP were difficult to maintain under deeper land degradation, and socio-economic development accelerated soil erosion instead (with a path coefficient of 0.326 in the whole period) (Lu et al., 2019; Wang et al., 2019). Our results further confirm that scientific economic development strategy is the foundation for ecological restoration.
4.2 Gray relation grade evolution in different prefectures
From 1995 to 2015, GRG varied in different prefectures. Before the implementation of GGP, the influences of socio-economic factors on soil erosion in the two prefectures were similar and the GRG of each factor was close. Agricultural output had the highest GRG, which may be related to that agriculture was the leading industry in these two prefectures (Yu et al., 2021c). The development of agriculture came at the expense of the ecological environment, and agricultural output was the most important socio-economic factor contributing to the acceleration of soil erosion (Wang et al., 2016).
With the development of agricultural technology, inputs of fertilizer and agricultural machinery could help to improve soil fertility and grain yield production of cropland (Rasmussen et al., 2018). Meanwhile, the decrease in the cropland area reduces the risk of erosion occurrence (Yu et al., 2021b). The GRG of agricultural input increased from 0.696 to 0.769 in Yan’an and the proportion of the primary industry has declined, the economic structure has become more reasonable. However, the agricultural input has not alleviated soil erosion in Qingyang with GRG decreasing from 0.733 to 0.656. More frequent agricultural cultivation activities caused the disordered expansion of agriculture and difficulty in maintaining the achievement of soil conservation. The downward trend of GRG indicates that socio-economic development has less effect on soil erosion, and the contradiction between them will further deepen in the future.
4.3 Implications
Socio-economic development is the premise of soil conservation, and ecological restoration should be formulated and coordinated with local socio-economic conditions (Barbier, 2010). Although GGP has made great achievements, current policies at the prefecture-level need to be adjusted to realize the coordinated development of the economy and ecology (Zeng et al., 2022). The local government also should actively guide the adjustment of the industrial structure, and the pillar industries need to be adjusted from agriculture to secondary and service industries (Rao et al., 2016). A reasonable industrial structure is a prerequisite for sustainable development (Olawumi and Chan, 2018).
As GGP is a top-down ecological policy, the annual task of GGP is transmitted stepwise from the provincial government and the final strategy always depends on the local government (Xu and Zhang, 2021a). The government should fully consider the local natural conditions and socio-economic development before planning scientific strategies. First, land use structures should be optimized to ensure food security, and farmers’ livelihoods should be guaranteed by developing agricultural technology. Second, slope cropland should be converted to grassland or forest in time and soil conservation engineering, such as check dams and terraces, should be constructed to decrease erosion according to the situation of the regions (Shi et al., 2020). Finally, as the natural condition and resource endowment is similar in the watershed, the ecological restoration project should be implemented based on the natural watershed unit to break the restriction of administrative division.
5 Conclusion
This study constructed a framework by using the RUSLE, PLS-SEM, and grey relation analysis to assess the effectiveness of GGP and evaluate the driving effects of socio-economic factors on soil erosion in Yan’an and Qingyang from 1995 to 2015. The valuable conclusions could be summarized as follows. First, GGP has made great contributions to vegetation restoration and soil erosion control. The annual average erosion modulus decreased by 30.54 t hm−2 yr−1 in Yan’an but 12.5 t hm−2 yr−1 only in Qingyang from 1995 to 2015, which indicates that GGP was more effective in Yan’an. Second, the driving effects of socio-economic factors on soil erosion varied between prefectures. Land use and population have the most positive and negative effects on soil erosion Economic development and agricultural input were promoting factors in Qingyang but controlling factors in Yan’an, and the difference in their effects could be related to the land use pattern and industrial structure of regions. Moreover, the GRG showed an upward trend in Yan’an but the opposite in Qingyang, indicating that the contradiction between socio-economic development and soil erosion will be further alleviated in Yan’an. To ensure coordinated social-economic and ecological construction, the dynamics of socio-economic context should always be considered during large-scale ecological program planning, monitoring, and implementation.
Data availability statement
The raw data supporting the conclusion of this article will be made available by the authors, without undue reservation.
Author contributions
Conceptualization, investigation, methodology, writing-original draft preparation, data collection, visualization, software: BW, HW, DC, and YZ; formal analysis, software: BW, YZ, ML, and YW; writing-review and editing: LN, NF, and YZ; funding acquisition, project administration: LN, NF.
Funding
This work was supported by the National Natural Science Foundation of China (42107361 and 42177335), the Chinese Universities Scientific Fund (2022HXZX002 and 2452020206), and College Students’ Innovative Entrepreneurial Training Plan Program (S202110712299 and S202210712343).
Conflict of interest
The authors declare that the research was conducted in the absence of any commercial or financial relationships that could be construed as a potential conflict of interest.
The handling editor KW declared a shared parent affiliation with the author(s) YZ, LN, and NF at the time of review.
Publisher’s note
All claims expressed in this article are solely those of the authors and do not necessarily represent those of their affiliated organizations, or those of the publisher, the editors and the reviewers. Any product that may be evaluated in this article, or claim that may be made by its manufacturer, is not guaranteed or endorsed by the publisher.
References
Barbier, E. B. (2010). Poverty, development, and environment. Environ. Dev. Econ. 15, 635–660. doi:10.1017/S1355770X1000032X
Borrelli, P., Alewell, C., Alvarez, P., Anache, J. A. A., Baartman, J., Ballabio, C., et al. (2021). Soil erosion modelling: A global review and statistical analysis. Sci. Total Environ. 780, 146494. doi:10.1016/j.scitotenv.2021.146494
Borrelli, P., Robinson, D. A., Fleischer, L. R., Lugato, E., Ballabio, C., Alewell, C., et al. (2017). An assessment of the global impact of 21st century land use change on soil erosion. Nat. Commun. 8, 2013. doi:10.1038/s41467-017-02142-7
Bryan, B. A., Gao, L., Ye, Y., Sun, X., Connor, J. D., Crossman, N. D., et al. (2018). China’s response to a national land-system sustainability emergency. Nature 559, 193–204. doi:10.1038/s41586-018-0280-2
Cai, C. F., and Ding, S. W. (2000). Study of applying USLE and geographical information system IDRISI to predict soil erosion in small watershed. J. Soil Water Conserv. 14, 19–24. doi:10.13870/j.cnki.stbcxb.2000.02.005
Cao, S., Liu, Z., Li, W., and Xian, J. (2021). Balancing ecological conservation with socioeconomic development. Ambio 50, 1117–1122. doi:10.1007/s13280-020-01448-z
Du, J., Shi, C., Fan, X., and Zhou, Y. (2011). Impacts of socio-economic factors on sediment yield in the Upper Yangtze River. J. Geogr. Sci. 21, 359–371. doi:10.1007/s11442-011-0850-9
Eekhout, J. P. C., and de Vente, J. (2022). Global impact of climate change on soil erosion and potential for adaptation through soil conservation. Earth. Sci. Rev. 226, 103921. doi:10.1016/j.earscirev.2022.103921
Ekeocha, D. O. (2021). Urbanization, inequality, economic development and ecological footprint: Searching for turning points and regional homogeneity in Africa. J. Clean. Prod. 291, 125244. doi:10.1016/j.jclepro.2020.125244
Fu, B., Wang, S., Zhang, J., Hou, Z., and Jinghai, L. (2019). Unravelling the complexity in achieving the 17 sustainable-development goals. Natl. Sci. Rev. 6, 386–388. doi:10.1093/nsr/nwz038
Ghosal, K., and Das Bhattacharya, S. (2020). A review of RUSLE model. J. Indian Soc. Remote Sens. 48, 689–707. doi:10.1007/s12524-019-01097-0
Grace, J. B., Schoolmaster, D. R., Guntenspergen, G. R., Little, A. M., Mitchell, B. R., Miller, K. M., et al. (2012). Guidelines for a graph-theoretic implementation of structural equation modeling. Ecosphere 3, art73–44. doi:10.1890/es12-00048.1
Hair, J. F., Risher, J. J., Sarstedt, M., and Ringle, C. M. (2019). When to use and how to report the results of PLS-SEM. Eur. Bus. Rev. 31, 2–24. doi:10.1108/EBR-11-2018-0203
Hickey, R., Smith, A., and Jankowski, P. (1994). Slope length calculations from a DEM within ARC/INFO grid. Comput. Environ. Urban Syst. 18, 365–380. doi:10.1016/0198-9715(94)90017-5
Jeong, A., and Dorn, R. I. (2019). Soil erosion from urbanization processes in the Sonoran Desert, Arizona, USA. Land Degrad. Dev. 30, 226–238. doi:10.1002/ldr.3207
Jin, F., Yang, W., Fu, J., and Li, Z. (2021). Effects of vegetation and climate on the changes of soil erosion in the Loess Plateau of China. Sci. Total Environ. 773, 145514. doi:10.1016/j.scitotenv.2021.145514
Ju-Long, D. (1982). Control problems of grey systems. Syst. Control Lett. 1, 288–294. doi:10.1016/S0167-6911(82)80025-X
Lane, L. J., Renard, K. G., Foster, G. R., and Laflen, J. M. (1992). Development and application of modern soil erosion prediction technology — The usda experience. Soil Res. 30, 893–912. doi:10.1071/SR9920893
Li, P., Mu, X., Holden, J., Wu, Y., Irvine, B., Wang, F., et al. (2017). Comparison of soil erosion models used to study the Chinese Loess Plateau. Earth. Sci. Rev. 170, 17–30. doi:10.1016/j.earscirev.2017.05.005
Li, Q., Shi, X., and Wu, Q. (2021). Effects of China’s ecological restoration on economic development based on Night-Time Light and NDVI data. Environ. Sci. Pollut. Res. 28, 65716–65730. doi:10.1007/s11356-021-15595-7
Liang, S., and Fang, H. (2021). Quantitative analysis of driving factors in soil erosion using geographic detectors in Qiantang River catchment, Southeast China. J. Soils Sediments 21, 134–147. doi:10.1007/s11368-020-02756-3
Liu, B. Y., Nearing, M. A., and Risse, L. M. (1994). Slope gradient effects on soil loss for steep slopes. Trans. ASAE 37, 1835–1840. doi:10.13031/2013.28273
Lu, C., Wang, D., Meng, P., Yang, J., Pang, M., and Wang, L. (2019). Research on resource curse effect of resource-dependent cities: Case study of Qingyang, Jinchang and Baiyin in China. Sustainability 11, 91. doi:10.3390/su11010091
Luetzenburg, G., Bittner, M. J., Calsamiglia, A., Renschler, C. S., Estrany, J., and Poeppl, R. (2020). Climate and land use change effects on soil erosion in two small agricultural catchment systems Fugnitz – Austria, Can Revull – Spain. Sci. Total Environ. 704, 135389. doi:10.1016/j.scitotenv.2019.135389
Ministry of Water Resources of PR China (2008). Standard for classification and gradation of soil erosion SL 190–2007. Beijing: China Waterpower Press.
Nearing, M. A., Yin, S., Borrelli, P., and Polyakov, V. O. (2017). Rainfall erosivity: An historical review. Catena 157, 357–362. doi:10.1016/j.catena.2017.06.004
Ning, J., Zhang, D., and Yu, Q. (2021). Quantifying the efficiency of soil conservation and optimized strategies: A case-study in a hotspot of afforestation in the Loess Plateau. Land Degrad. Dev. 32, 1114–1126. doi:10.1002/ldr.3730
Odongo, V. O., Mulatu, D. W., Muthoni, F. K., Van Oel, P. R., Meins, F. M., Van der Tol, C., et al. (2014). Coupling socio-economic factors and eco-hydrological processes using a cascade-modeling approach. J. Hydrol. X. 518, 49–59. doi:10.1016/j.jhydrol.2014.01.012
Olawumi, T. O., and Chan, D. W. M. (2018). A scientometric review of global research on sustainability and sustainable development. J. Clean. Prod. 183, 231–250. doi:10.1016/j.jclepro.2018.02.162
Panagos, P., Standardi, G., Borrelli, P., Lugato, E., Montanarella, L., and Bosello, F. (2018). Cost of agricultural productivity loss due to soil erosion in the European Union: From direct cost evaluation approaches to the use of macroeconomic models. Land Degrad. Dev. 29, 471–484. doi:10.1002/ldr.2879
Parysow, P., Wang, G., Gertner, G., and Anderson, A. B. (2003). Spatial uncertainty analysis for mapping soil erodibility based on joint sequential simulation. Catena 53, 65–78. doi:10.1016/S0341-8162(02)00198-4
Ping, Z., Anbang, W., Xinbao, Z., and Xiubin, H. (2013). Soil conservation and sustainable eco-environment in the Loess Plateau of China. Environ. Earth Sci. 68, 633–639. doi:10.1007/s12665-012-1766-0
Pradhan, P., Costa, L., Rybski, D., Lucht, W., and Kropp, J. P. (2017). A systematic study of sustainable development goal (SDG) interactions. Earth's. Future 5, 1169–1179. doi:10.1002/2017EF000632
Rao, E., Xiao, Y., Ouyang, Z., and Zheng, H. (2016). Changes in ecosystem service of soil conservation between 2000 and 2010 and its driving factors in southwestern China. Chin. Geogr. Sci. 26, 165–173. doi:10.1007/s11769-015-0759-9
Rasmussen, L. V., Coolsaet, B., Martin, A., Mertz, O., Pascual, U., Corbera, E., et al. (2018). Social-ecological outcomes of agricultural intensification. Nat. Sustain. 1, 275–282. doi:10.1038/s41893-018-0070-8
Sharpley, A. N., and Williams, J. R. (1990). EPIC-Erosion/Productivity impact calculator. I: Model documentation. II: User manual. Tech. Bull. States Dep. Agric. 4 (4), 206–207. doi:10.1001/jama.284.24.3187
Shen, W., Xiao, W., and Wang, X. (2016). Passenger satisfaction evaluation model for urban rail transit: A structural equation modeling based on partial least squares. Transp. Policy (Oxf). 46, 20–31. doi:10.1016/j.tranpol.2015.10.006
Shi, P., Feng, Z., Gao, H., Li, P., Zhang, X., Zhu, T., et al. (2020). Has “grain for green” threaten food security on the Loess Plateau of China? Ecosyst. Health Sustain. 6, 1709560. doi:10.1080/20964129.2019.1709560
Sun, W., Shao, Q., and Liu, J. (2013). Soil erosion and its response to the changes of precipitation and vegetation cover on the Loess Plateau. J. Geogr. Sci. 23, 1091–1106. doi:10.1007/s11442-013-1065-z
Sun, W., Shao, Q., Liu, J., and Zhai, J. (2014). Assessing the effects of land use and topography on soil erosion on the Loess Plateau in China. CATENA 121, 151–163. doi:10.1016/J.CATENA.2014.05.009
Tenenhaus, M., Vinzi, V. E., Chatelin, Y.-M., and Lauro, C. (2005). PLS path modeling. Comput. Stat. Data Anal. 48, 159–205. doi:10.1016/j.csda.2004.03.005
Vanwalleghem, T., Gómez, J. A., Amate, J. I., de Molina, M. G., Vanderlinden, K., Guzmán, G., et al. (2017). Impact of historical land use and soil management change on soil erosion and agricultural sustainability during the Anthropocene. Anthropocene 17, 13–29. doi:10.1016/j.ancene.2017.01.002
Vávra, J., Duží, B., Lapka, M., Cudlínová, E., and Rikoon, J. S. (2019). Socio-economic context of soil erosion: A comparative local stakeholders’ case study from traditional agricultural region in the Czech republic. Land use policy 84, 127–137. doi:10.1016/j.landusepol.2019.03.005
Wang, C., Ma, L., Zhang, Y., Chen, N., and Wang, W. (2022). Spatiotemporal dynamics of wetlands and their driving factors based on PLS-SEM: A case study in wuhan. Sci. Total Environ. 806, 151310. doi:10.1016/j.scitotenv.2021.151310
Wang, J., Liu, Y., and Li, Y. (2019). Ecological restoration under rural restructuring: A case study of yan’an in China’s Loess Plateau. Land use policy 87, 104087. doi:10.1016/j.landusepol.2019.104087
Wang, L., Yan, H., Wang, X. W., Wang, Z., Yu, S. X., Wang, T. W., et al. (2020). The potential for soil erosion control associated with socio-economic development in the hilly red soil region, southern China. Catena 194, 104678. doi:10.1016/j.catena.2020.104678
Wang, L. Y., Xiao, Y., Rao, E. M., Jiang, L., Xiao, Y., and Ouyang, Z. Y. (2018). An assessment of the impact of urbanization on soil erosion in Inner Mongolia. Int. J. Environ. Res. Public Health 15, 550. doi:10.3390/ijerph15030550
Wang, X., Zhao, X., Zhang, Z., Yi, L., Zuo, L., Wen, Q., et al. (2016). Assessment of soil erosion change and its relationships with land use/cover change in China from the end of the 1980s to 2010. Catena 137, 256–268. doi:10.1016/j.catena.2015.10.004
Wei, J., Zhou, J., Tian, J., He, X., and Tang, K. (2006). Decoupling soil erosion and human activities on the Chinese Loess Plateau in the 20th century. Catena 68, 10–15. doi:10.1016/j.catena.2006.04.011
Williams, J. R., Jones, C. A, D. P. T., and P. T. Dyke, (1984). A modeling approach to determining the relationship between erosion and soil productivity. Trans. ASAE 27, 0129–0144. doi:10.13031/2013.32748
Winarni, S., and Indratno, S. W. (2018). Application of multi response optimization with grey relational analysis and fuzzy logic method. J. Phys. Conf. Ser. 948, 012075. doi:10.1088/1742-6596/948/1/012075
Wuepper, D., Borrelli, P., and Finger, R. (2020). Countries and the global rate of soil erosion. Nat. Sustain. 3, 51–55. doi:10.1038/s41893-019-0438-4
Xie, Y., Yue, T., and Liu, B. (2018). Data from: Grid data on average annual rainfall erosivity in China. Digital Soil Conservation Platform of Center for Geodata and Analysis, Faculty of Geographical Science, Beijing Normal University. doi:10.12041/geodata.184104728535228.ver1.db
Xu, X., and Zhang, D. (2021a). Comparing the long-term effects of artificial and natural vegetation restoration strategies: A case-study of wuqi and its adjacent counties in northern China. Land Degrad. Dev. 32, 3930–3945. doi:10.1002/ldr.4018
Xu, X., and Zhang, D. (2021b). Evaluating the effect of ecological policies from the pattern change of persistent green patches–A case study of Yan’an in China’s Loess Plateau. Ecol. Inf. 63, 101305. doi:10.1016/j.ecoinf.2021.101305
Yang, Q., and Zhang, D. (2021). The influence of agricultural industrial policy on non-grain production of cultivated land: A case study of the “one village, one product” strategy implemented in guanzhong plain of China. Land use policy 108, 105579. doi:10.1016/j.landusepol.2021.105579
Yu, S., Wang, F., Qu, M., Yu, B., and Zhao, Z. (2021a). The effect of land use/cover change on soil erosion change by spatial regression in changwu county on the Loess Plateau in China. Forests 12, 1209. doi:10.3390/f12091209
Yu, S., Wang, L., Zhao, J., and Shi, Z. (2021b). Using structural equation modelling to identify regional socio-economic driving forces of soil erosion: A case study of jiangxi Province, southern China. J. Environ. Manage. 279, 111616–111617. doi:10.1016/j.jenvman.2020.111616
Yu, S., Xie, C., Jinsong, Z., Wang, Z., Wang, L., and Shi, Z. (2021c). Socioeconomic development mitigates runoff and sediment yields in a subtropical agricultural watershed in southern China. Environ. Res. Lett. 16, 24053. doi:10.1088/1748-9326/abdd5a
Zeng, Y., Ran, L., Fang, N., Wang, Z., Xu, Z., Lu, X., et al. (2022). How to balance green and grain in marginal mountainous areas? Earth's. Future 10, 1–15. doi:10.1029/2021EF002552
Zhang, J., Wang, N., Wang, Y., Wang, L., Hu, A., Zhang, D., et al. (2021). Responses of soil erosion to land-use changes in the largest tableland of the Loess Plateau. Land Degrad. Dev. 32, 3598–3613. doi:10.1002/ldr.3962
Keywords: soil erosion, Grain for Green Program, socio-economic factor, RUSLE, PLS-SEM
Citation: Wang B, Zeng Y, Li M, Chen D, Wang H, Wang Y, Ni L and Fang N (2022) Evaluation of the driving effects of socio-economic development on soil erosion from the perspective of prefecture-level. Front. Environ. Sci. 10:1066889. doi: 10.3389/fenvs.2022.1066889
Received: 11 October 2022; Accepted: 31 October 2022;
Published: 11 November 2022.
Edited by:
Kaibo Wang, Institute of Earth Environment (CAS), ChinaReviewed by:
Zhihua Shi, Huazhong Agricultural University, ChinaYaojun Liu, Hunan Normal University, China
Qianjin Liu, Linyi University, China
Copyright © 2022 Wang, Zeng, Li, Chen, Wang, Wang, Ni and Fang. This is an open-access article distributed under the terms of the Creative Commons Attribution License (CC BY). The use, distribution or reproduction in other forums is permitted, provided the original author(s) and the copyright owner(s) are credited and that the original publication in this journal is cited, in accordance with accepted academic practice. No use, distribution or reproduction is permitted which does not comply with these terms.
*Correspondence: Yi Zeng, emVuZ3lpQG53YWZ1LmVkdS5jbg==; Lingshan Ni, bHNuaUBtcy5pc3djLmFjLmNu