 Xue Wei
 Liming Liu
 Zheyi Xia
- Department of Land Resources Management, College of Land Science and Technology, China Agricultural University, Beijing, China
Urbanization and cultivated land use coordination is the key to urban‒rural coordinated development, especially in the major grain-producing areas in China, but it is rarely examined. A coordination framework of urbanization and cultivated land use efficiency systematically clarified how to achieve Urbanization and cultivated land use coordination. Taking Hunan Province as an example, this study explored the spatiotemporal evolution of the level of Urbanization and cultivated land use coordination from 2000 to 2018 at the county level, identified current types of Urbanization and cultivated land use coordination and discussed the key optimization measures for different types. The results showed that 1) urban‒rural coordinated development, abstractly represented by the Urbanization and cultivated land use coordination in major grain-producing areas, depends on the intensity of interactions and the level of integration of urbanization and cultivated land use systems. 2) From 2000 to 2018, the level of Urbanization and cultivated land use coordination in Hunan changed from serious maladjustment to great maladjustment to coordination. 3) The current Urbanization and cultivated land use coordination pattern in Hunan Province has a strong spatial differentiation, which can be divided into eight subregions. The key to the coordinated development of each type is to accelerate the flow of elements through deepening reform and innovation mechanisms to complement the shortcomings of development. This study will provide a scientific reference for the effective implementation of regional coordinated development strategies in major food-producing regions.
1 Introduction
With global urbanization and industrialization, drastic changes have occurred in industrial, employment and social structures in urban and rural areas (Dadashpoor and Alidadi, 2017; Quan et al., 2019; Zhou et al., 2020), giving rise to problems such as rural decay, false urbanization and an imbalance in urban‒rural relations (Liu and Li, 2017; Cai et al., 2019; Cai et al., 2021). As one of the fastest growing urbanized countries, China faces even more serious pressures of urban‒rural imbalance (Ji et al., 2019). In response, the Chinese government has successively formulated several major national strategies since the beginning of the new century, such as new-type urbanization, rural revitalization, and urban‒rural integration (Zhang and Lu, 2018). Urban and rural areas are complex territorial systems with complementary structures and coupled functions (Liu et al., 2020; Delgado-Viñas and Gómez-Moreno, 2022). Urban‒rural relationships refer to the interactive symbiotic relationship between urban and rural areas, which cover urban‒rural economic, social, ecological, spatial and humanistic aspects (Zhang and Lu, 2018; Liu et al., 2020). A good urban‒rural relationship plays an important role in the development of cities and villages (Tacoli, 1998; Yang et al., 2021). For example, stronger rural‒urban connectivity is generally associated with higher overall agricultural inputs and yields (Boudet et al., 2020). Urban‒rural coordinated development, which is essentially a stage in the evolution of urban‒rural relationships, is regarded as the optimal state and eventual form of the urban‒rural relationship (Torreggiani et al., 2012; He et al., 2019; Baffoe, 2020). Understanding the variability of contemporary rural‒urban interactions could provide insight into future urban‒rural coordinated development.
Large population but limited cultivated land is the basic national condition of China. In order to respond to the increasing demand, the efficiency of cultivated land use must be improved. The importance of cultivated land in promoting the stable development of rural areas cannot be overstated. As the main livelihood for rural people, cultivated land use (CLU) activities widely exist in rural areas, especially in food-producing areas (Gollin, D. (2010) Cultivated land is an important input into agricultural activities, such as agricultural cultivation, livestock production and NR-based collection. And high CLUE reflects the realization of the value of cultivated land resources in agricultural production (Kuang et al., 2020). Cultivated land is also essential for the sustainable development of urban systems in terms of providing raw materials and agricultural products, especially potential development space (Zhou et al., 2021). Many urban enterprises rely on demand from rural consumers, and access to urban markets and services is often crucial for agricultural producers (Tacoli, C, 1998). Therefore, high cultivated land use efficiency (CLUE) is fundamental for sustainable development in urban and rural regions (Cao and Birchenall, 2013; Liu et al., 2016; Duan et al., 2021). In this respect, urbanization and cultivated land use coordination (UCLUC) have profound implications for coordinated urban‒rural development. However, urbanization characterized by population and industrial agglomeration may have positive or negative effects on the cultivated land use system (Satterthwaite et al., 2010; Oueslati et al., 2019; Boudet et al., 2020), which promotes the heterogeneity and dynamics of UCLUC. Hence, it is necessary to review and clarify the spatiotemporal evolutionary laws of UCLUC, scientifically determine the current situation of UCLUC, and better formulate adaptive policies for regions to promote sustainable development of urban and rural areas.
Scholars in various fields have focused on urban‒rural coordinated development, including its definition (Tacoli, 1998; He, 2018; Baffoe, 2020) and mechanisms (He et al., 2019; Liu et al., 2020), measurement and evaluation methods (Li and Liu, 2021; Yang et al., 2021), effects (Mayer et al., 2016), and optimization strategy (Adugna and Hailemariam, 2011; Ma et al., 2021). The evaluation of urban‒rural relationships has been examined from multiple perspectives, such as urban and rural welfare (Azam, 2019), ecological networks (Xiao et al., 2017), public investment (Calabro and Cassalia, 2018), and tourism relations (Slocum and Curtis, 2017). Most quantitative studies have adopted comprehensive index systems in the evaluation of urban–rural integration. Rao and Gao (2022) proposed a systematic evaluation index system of urban–rural integration from four dimensions of economy, space, society and environment (Rao and Gao, 2022). Wang et al. (2016) evaluated the relationship between urban and rural areas from the perspective of “income-consumption-productivity” (Wang et al., 2016). Shen et al. (2012) applied a set of critical indicators consisting of benefit indicators and fairness indicators to evaluate the contribution of infrastructure projects to coordinated urban–rural development (Shen et al., 2012). In terms of the measurement model of urban‒rural relationships, scholars have mostly adopted the coupling coordination degree model (Song and Tao, 2022), deviation coefficient model (Liu et al., 2017), and decoupling model (Zhu et al., 2020; Cai et al., 2021). Scholars have basically reached a consensus that China’s urban‒rural relations have undergone a gradual shift from separation and opposition to coordination and integration (Yang et al., 2021). These achievements have greatly contributed to integrated urban‒rural development and have laid a solid foundation for our research. However, few studies have explored urban‒rural coordinated development from the perspective of UCLUC, particularly using panel data from major grain-producing regions (Bai et al., 2018).
In this paper, we utilize Hunan Province, one of the major grain-producing areas in China, as the research case. The objectives of this study are to 1) construct a theoretical framework of UCLUC from the perspective of synergy; 2) explore the spatiotemporal evolution of the level of UCLUC from 2000 to 2018 at the county level; and 3) recognize the current subdivisions of UCLUC in Hunan Province and propose optimal recommendations for different types to promote coordinated urban‒rural development. The results can provide a reference for high-quality and sustainable development in major grain-producing areas.
2 Materials and methods
2.1 Study area and data sources
This study takes Hunan Province in China as the research area and counties as the analysis object. Hunan Province is one of the 13 major grain-producing areas in China playing a decisive role in ensuring the effective supply of major agricultural products and one of the key areas to promote the new urbanization strategy (Zhang et al., 2021), which makes it an ideal case area for this study. At present, Hunan Province is still in a stage of rapid development and needs to resolve the conflicts between urbanization and CLU (Luo et al., 2018). The county is the basic unit of China’s administrative structure, and current social problems such as uneven development are mainly reflected at the county scale. In addition, promoting county urbanization to accommodate China’s urban‒rural transition has become a major direction for China’s urbanization (Zhang et al., 2022). The 2000–2018 period is chosen and divided by 2009 and 2013 into three stages to reveal the evolutionary patterns of UCLUC. 2009 was the middle breakpoint of the research period, and 2012 was the starting year when China implemented the new urbanization strategy. After 2012, Hunan Province entered the new-type urbanization stage characterized by coordinated development of the population, industry, space, society, resources, and the environment (Yu, 2021).
The area of cultivated land in Hunan Province was 41,500 km2 in 2018, accounting for 19.59% of the total area (211,800 km2). Hunan’s total population was more than 68 million in 2018, with an urbanization rate of 59.58%, which was a mere 36.22% in 2000. According to the administrative division in 2018, Hunan Province included 122 county-level administrative units composed of 36 districts, 19 county-level cities, 60 counties, and seven autonomous counties, which are referred to as counties (Figure 1).
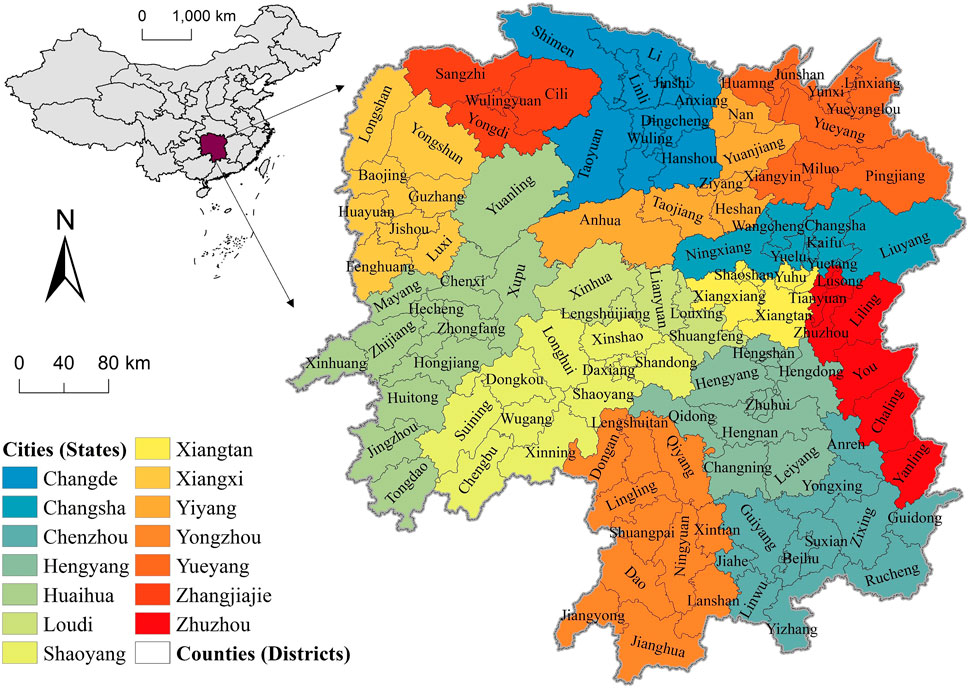
FIGURE 1. Location and administrative division of Hunan Province in China.
The data sources used in this study are as follows: land use raster datasets, including four phases in 2000, 2009, 2013, and 2018, are used to calculate the spatial urbanization level characterized by the proportion of the urban built-up area. The spatial resolution of the land use data in 2000 is 1 km × 1 km, which is from the resources and environmental platform of the Chinese Academy of Sciences (http://www.resdc.cn/), while in the other three phases, it is 30 m × 30 m from the China Land Surveying and Planning Institute (Wei et al., 2022). We use socioeconomic statistical data to measure the urbanization level and CLUE, including the Hunan Statistical Yearbook (2001–2019) and Hunan Rural Statistical Yearbook (2001–2019). The merger and renaming of administrative divisions are identified based on the administrative divisions in 2018 and combined with time-series data. The mean value method and linear trend method are used for interpolation to deal with some missing socioeconomic data (Song and Tao, 2022).
2.2 A theoretical framework of UCLUC
Although systems and the subsystems that compose them vary widely in nature, the synergy theory, founded by Haken (1983), argues that the qualitative changes in the macroscopic structure of systems are similar, or are even the same. When under the action of external energy or the aggregation state of matter reaches a certain critical value, there will be synergy between the subsystems of any complex system, which will change the system from disorder to order and produce a certain stable structure that evolves to a higher development level of the system (Serrano and Fischer, 2007). Synergetic science is widely applicable because it captures the common characteristics of different systems in the critical process and can describe the transition law from disorder to order in combination with the specific phenomena of each system. Synergetic theory is a strong guide to the study of UCLUC. Many scholars hold the view of coordinated urban and rural development. Caffyn and Dahlström (2005) believed that urban-rural dependencies are a way of supporting sustainable, regional growth. And Yang et al. (2021) point out that urban relationships refer to the interactive symbolic relationship between urban and rural areas that interactions with and influences each system. In this study, we refer to the collaboration model proposed by Serrano and Fischer (2007) to explain the mechanisms for implementing UCLUC (Figure 2).
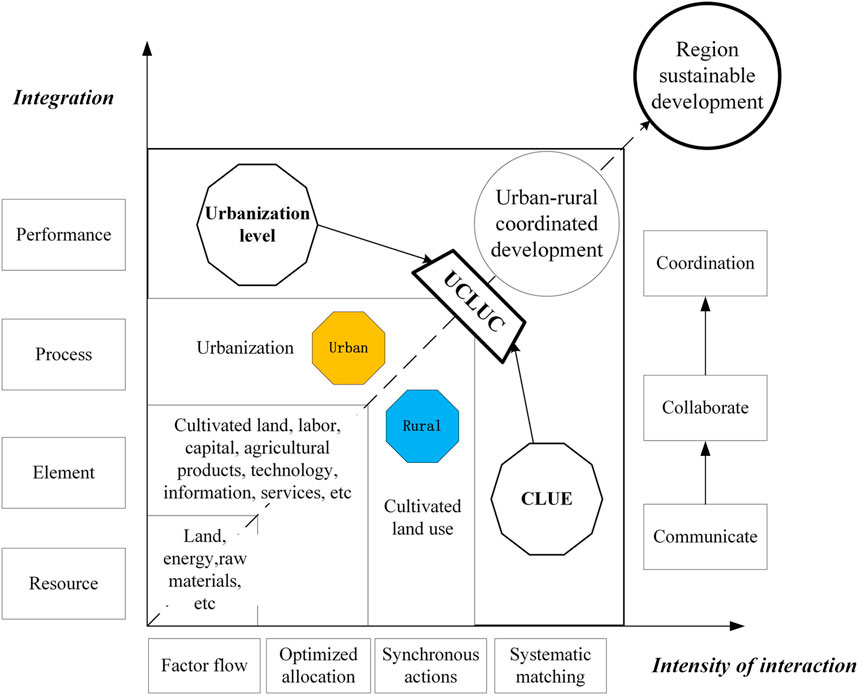
FIGURE 2. Analytical framework of UCLUC.
Regional sustainable development is accompanied by urban‒rural coordinated development (Baffoe et al., 2021), abstractly represented by UCLUC. UCLUC includes two factors: the intensity of interaction and the level of integration, which are represented on the horizontal and vertical axes, respectively. Achieving the integration process includes different stages of the integration of resources, the integration of elements, the integration of processes and finally the integration of performance (Liu, 2018; Yang et al., 2021). Resources are objective natural products, including raw materials, land, water, etc. Elements, the production factors utilized in the process of urbanization and cultivated land use subsystems, are value products transformed by human labor, including tangible (cultivated land, labor, etc.) and intangible (technology, information, etc.) factors. Urbanization and CLU are the main processes in urban‒rural systems that we focus on, and urbanization level and cultivated land use efficiency are the results of subsystem actions. Urban‒rural coordinated development is achieved by different levels of interaction of elements or systems (Yang et al., 2021). These include element flow, optimized allocation, synchronous actions, and the systematic matching of performances (Fang, 2022). The more integrated an urban‒rural system is, the more interactions are necessary or the deeper the intensity of the interactions. The most basic form of interoperation is communication (Boudet et al., 2020; Song and Tao, 2022). The more communication between urban and rural areas, the more activities are executed together and the more aspects need to be coordinated (Tacoli, 1998). The integration process is accumulative: first is resource flow and element optimal allocation to form communication, then comes the integration of processes (urbanization and CLU) to collaboration, and then comes the integration of performances from urbanization and CLUE to firm coordination.
2.3 Estimating the level of urbanization
2.3.1 Developing the urbanization level index
An increasing number of scholars have tended to adopt a comprehensive definition of urbanization to describe the multidimensional characteristics of urbanization (Cai et al., 2021; Yu, 2021). Population, space, economy and society are interrelated and comprehensively reflect the development level of urbanization. Here, we summarize the comprehensive urbanization evaluation system into four aspects, including 10 indices (Table 1). Population urbanization (PU), which mainly reflects the process of a non-agricultural population, is described by PU1-PU3 (Cai et al., 2021). Land urbanization (LU) reflects the process of continuous transformation from agricultural land to urban construction land, described by the proportion of the built-up area (LU1) (Bai et al., 2018; Cai et al., 2021). Economic urbanization (EU) mainly reflects economic development and the non-agricultural transformation of the economic structure, as described by EU1-EU2 (Bai et al., 2018; Yu, 2021). Social urbanization (SU) indicators mainly reflect the social security and lifestyle changes of urbanization, represented by SU1-SU4 (Bai et al., 2018).
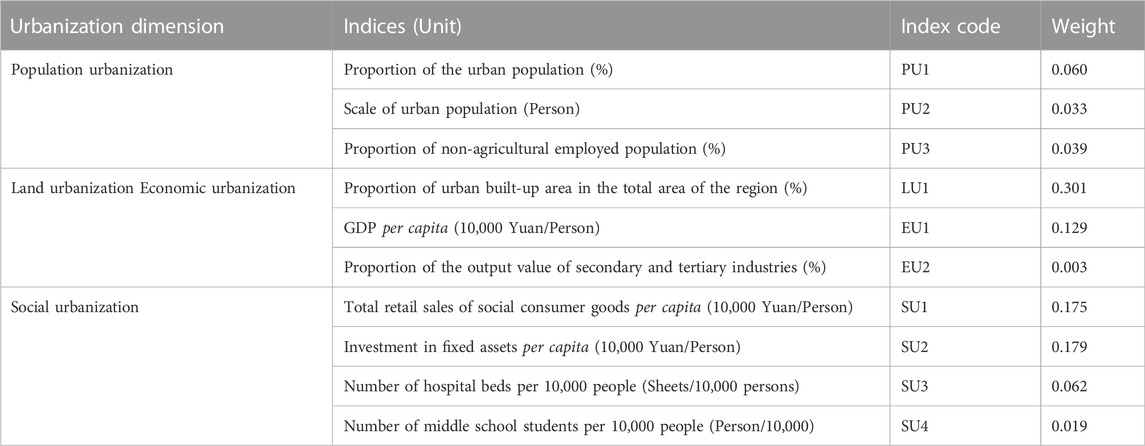
TABLE 1. Evaluation index system and weight of urbanization.
2.3.2 Global entropy weight method
The global entropy weight method (GEWM) is used to measure the weight and dynamically analyze the comprehensive urbanization level in Hunan Province. As one of the commonly used and objective assignment methods, the GEWM achieves the measurement of panel data and overcomes the inconsistency between the measurement results of time series data and cross-sectional data compared with the traditional entropy weight method (Yun and Nam, 2021). First, we introduce time series into the cross-section data to construct the initial global evaluation matrix, which includes 10 indices from 122 counties of Hunan Province for 4 years: 2000, 2009, 2013, and 2018. Second, the regularization formula is used to standardize the indices, and then the weight of each index is calculated according to the entropy weight method. Finally, the linear weighting method is used to calculate the urbanization level.
2.4 Estimating CLUE
2.4.1 Developing the index system of CLUE
Efficiency is a state of resource allocation (Paltasingh et al., 2022). CLUE reflects the ability to use various resources and convert them into economic benefits in the process of CLU, which is affected by inputs and outputs (Kuang et al., 2020). Regarding the measurement of CLUE, two main methods are adopted: single factor productivity and total factor productivity. Although single factor productivity can directly reflect the contribution of this factor to output, it cannot comprehensively consider and control the impact of other factors (Zhao et al., 2021). Therefore, we use the latter. We select four input indicators in the categories of land, labor, and capital, such as cultivated land area, and two expected output indicators in the categories of economic and social benefits (Table 2). These indicators are selected based on their relevance to CLUE reported in recent research (Hou et al., 2019; Zhao and Zhang, 2019; Kuang et al., 2020; Zhao et al., 2021).
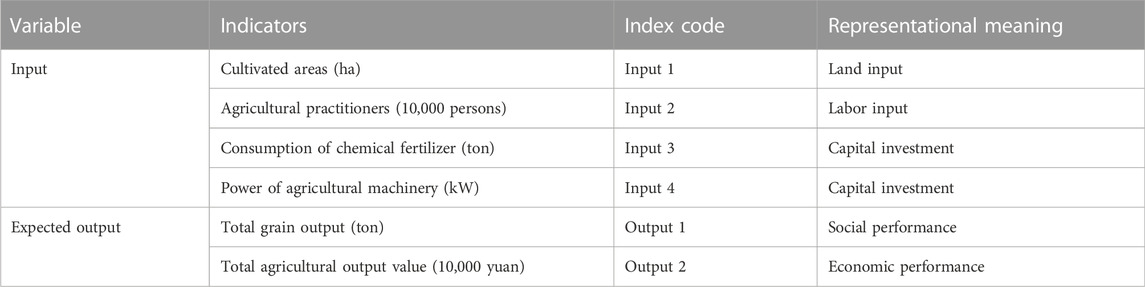
TABLE 2. Evaluation index system of CLUE.
2.4.2 SBM-DEA model
Data envelopment analysis (DEA) is an objective evaluation method based on the relative effectiveness of the production Frontier, which is suitable for multi-input and multioutput efficiency analysis. The best performers have a full efficient status denoted by 1, and usually multiple decision-making units (DMUs) have this “efficient status” from experience, which affects measuring the coordination degree between CLUE and urbanization in our research (Bai et al., 2018). The slack-based model (SBM-DEA) can avoid this situation and discriminate between these efficient DMUs. It first removes the evaluated DMUs from the original production possibility set, then takes the remaining DMUs as samples to construct a new production possibility set and forms a new effective production Frontier; finally, the effectiveness of DEA is determined based on the new Frontier (Tone, 2002). In this study, we use an input-oriented SBM-DEA model under variable returns to scales. The SBM-DEA model can be described as Eq. 1.
where
2.5 Evaluation and grading of UCLUC
2.5.1 Evaluation of UCLUC
In the process of rapid urbanization, there is a deviation opposite to coordination between the improvements of urbanization and CLUE (Liu and Li, 2017), which refers to the quantitative mismatching relationship between systems or internal elements of the system. We use the coefficient of variation (CV) to measure the deviation (Pan and Liu, 2014). First, the annual average growth rate of urbanization (
where
According to the value of the dispersion coefficient, we divide the UCLUC into five levels, including serious imbalance, high imbalance, medium imbalance, mild imbalance, and coordinated development (Table 3).
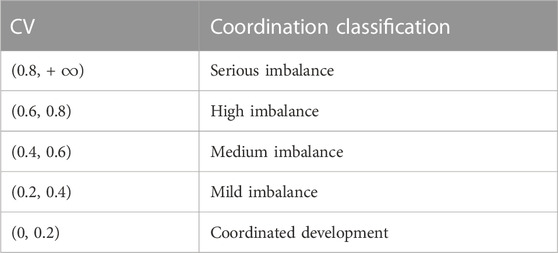
TABLE 3. Coordination classification of UCLUC.
2.5.2 Subdivisions of the UCLUC
The scientific diagnosis of the geographic types of UCLUC and their intrinsic causes are of great relevance for promoting sustainable urban and rural development in the new era. Coordinated development represents “stable growth” and “coordinated development”. Therefore, the main subdivisions of UCLUC depend on three indicators: the CV value, the growth rate of urbanization and CLUE. Here, the three-dimensional magic cube spatial classification method is used to optimize the zoning of UCLUC (Xie et al., 2021). According to the principle of the three-dimensional tesseract, the CV value, the growth rate of the urbanization level and the growth rate of CLUE are set as the X-axis, Y-axis and Z-axis of the tesseract, respectively, to construct a three-dimensional tesseract. Among them, the CV value is still maintained at five levels, as shown before, and the growth rate of the urbanization level and the growth rate of CLUE are divided into two levels of development and lagging with 0 as an interval. As a result, 20 subdivisions of UCLUC exist theoretically (Figure 3).
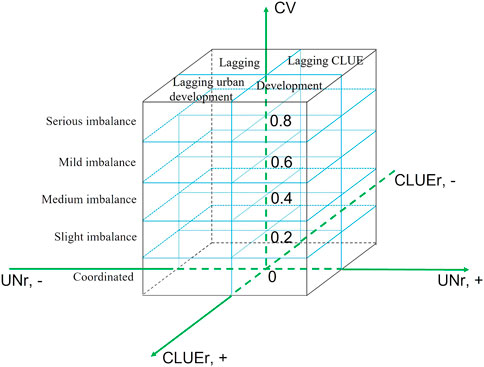
FIGURE 3. Zoning model for different UCLUC types.
3 Results
3.1 Characteristics of urbanization and CLUE
Since the beginning of the new century, the urbanization of Hunan Province has experienced a stage of fast development, rapid development and slow development, and the urbanization subsystem has developed from imbalance to equilibrium (Figure 4A). The urbanization level of Hunan Province steadily increased from 0.131 in 2000 to 0.289 in 2018, with an increase of 0.158 over 18 years and an average annual growth rate of 0.83%. The PU level was the highest in 2009; the SU level was the highest in 2000, 2013, and 2018; and the EU level was the lowest in the whole study period. Specifically, the SU was developing rapidly, reflected in the increase in fixed asset investment (SU2) and healthcare (SU3), while SU4 was in a rapid decline after 2009, which created a highly balanced urbanization state.
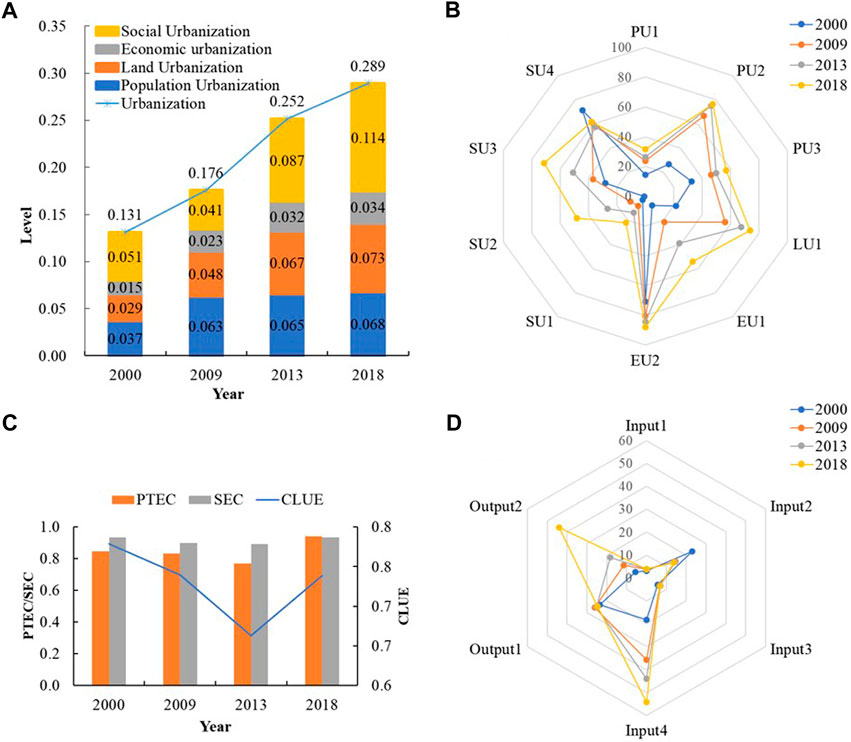
FIGURE 4. Characteristics of urbanization and CLUE in Hunan Province. (A): The characteristics of different urbanization dimensions; (B): The characteristics of urbanization indices; (C): The characteristics of PTE, SEC, CLUE; (D): The characteristics of inputs and outputs of CLUE.
The CLUE in Hunan Province was 0.779, 0.740, 0.663, and 0.739 in 2000, 2009, 2013 and 2018, respectively (Figure 4B), with a decrease of 0.040 over 18 years and an average annual growth rate of -0.22%. There were three evolutionary trends in the six input‒output variables of CLUE in Hunan Province in 2000–2018: the consumption of chemical fertilizer and cultivated land area remained stable; gross agricultural product and total power of machinery experienced rapid increases; and agricultural employees and grain output remained stable (2010–2018) after decreasing and increasing (2000–2009), respectively.
3.2 Temporal–spatial characteristics of UCLUC
3.2.1 Dynamic changes of UCLUC
From 2000 to 2018, the dispersion coefficient between urbanization and CLUE in Hunan Province showed a trend of slight expansion and then significant reduction, which increased from 1.347 in 2009 to 1.634 in 2013 and then decreased significantly to 0.132 in 2018, which was in a state of coordinated development (Table 4). This showed that the situation between urbanization and CLUE changed from serious imbalance to coordinated development.
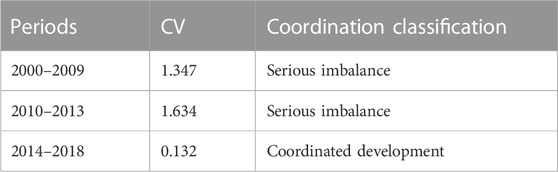
TABLE 4. UCLUC in Hunan Province in different periods.
3.2.2 Spatial patterns of UCLUC
From 2000 to 2009, more than 95% of the counties were in a state of imbalance, and only five counties (i.e., Furong, Hetang, Dingcheng, Wulingyuan, and Heshan) were in a state of coordination (Figure 5 and Table 5). During 2009–2013, only one additional county was in a state of coordination compared to the previous period, but the number of counties with serious imbalances was as high as 109, 1.2 times higher than the previous period. These results are consistent with the analysis results at the provincial scale; that is, the overall degree of coordination in Hunan Province deteriorated from 2009–2013. During 2014–2018, the number of counties with coordinated development significantly increased to 27, and the number of serious imbalance counties dropped sharply to 53. Moreover, the counties with coordinated development were mainly distributed in the northwestern and central regions.
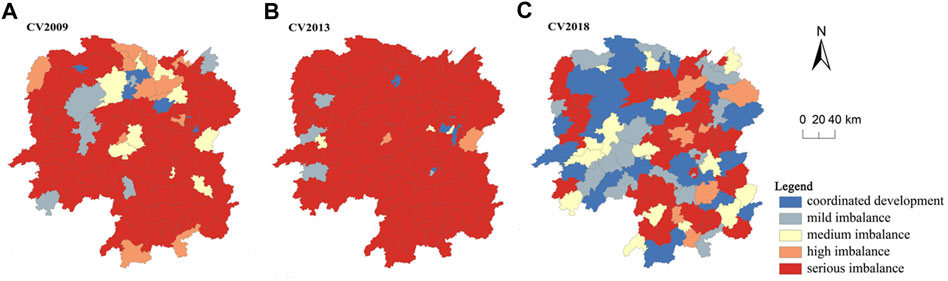
FIGURE 5. Spatial patterns of UCLUC in different periods. (A) Spatial patterns of UCLUC in 2009; (B) Spatial patterns of UCLUC in 2013; (C) Spatial patterns of UCLUC in 2018.
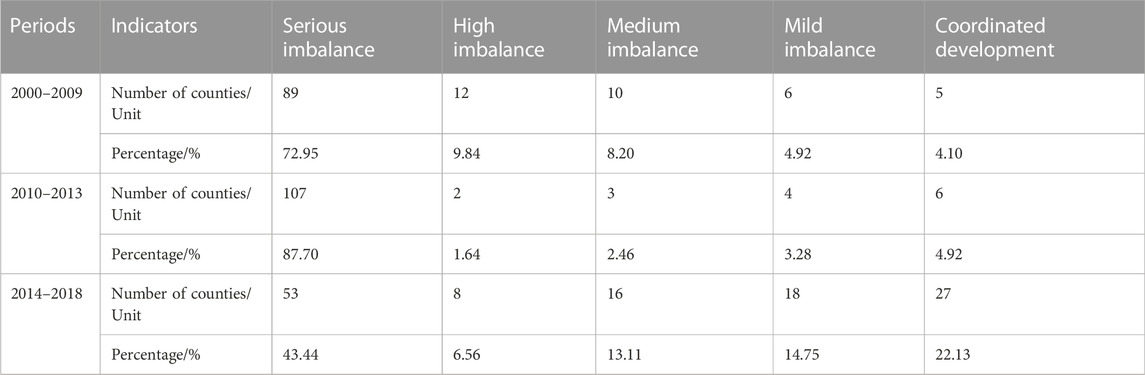
TABLE 5. Statistics of the types of country coordination degrees in different periods.
3.3 Zoning for coordinated development
As previously discovered, UCLUC had obvious spatial variation. According to Section 2.5.2, there were eight types of UCLUC in Hunan Province from 2014–2018 (Figure 6A): serious imbalance of development (Type Ⅰ), high imbalance of development (Type Ⅱ), medium imbalance of development (Type Ⅲ), slight imbalance of development (Type Ⅳ), coordinated development (Type Ⅴ), serious imbalance with lagging CLUE (Type Ⅵ), serious imbalance with lagging urban development (Type Ⅶ), and slight imbalance of lagging (Type Ⅷ). Their geographic location and limiting factors are summarized based on their numerical characteristics (Figure 6).
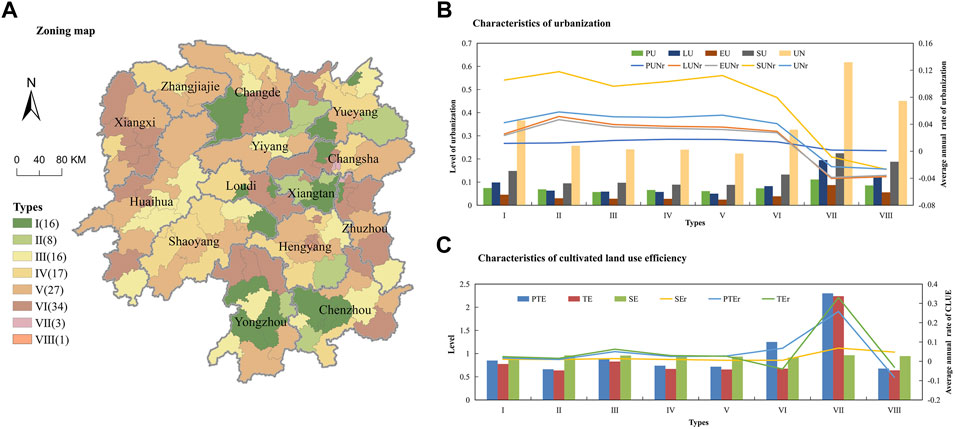
FIGURE 6. Characteristics of different UCLUC types. (A) Zoning map; (B) Characteristics of urbanization in different subdivisions; (C) Characteristics of cultivated land use efficiency in in different subdivisions.
Serious imbalance of development (Type Ⅰ): This type of region is distributed in 16 counties, such as Taoyuan and Guiyang, accounting for 13% of all counties (Figure 6A). The region has an average level of urbanization and an abundance of cultivated land resources, but both urbanization and CLUE are at an increasing stage of development (Figures 6B,C). The lack of synchronization between the growth rate of urbanization and CLUE is the main cause of the serious mismatch in the region. Nevertheless, the disparity coefficient is low (i.e., 0.901). High imbalance of development (Type Ⅱ): This region includes eight counties, including Pingjiang and Xintian, and is mainly located in the more peripheral urban areas and areas with richer arable land resources. Medium imbalance of development (Type Ⅲ): The region includes 16 counties (i.e., Yanling), located in the western ecologically fragile areas and areas dominated by agricultural production, which are of high ecological importance and mostly in restricted development zones, resulting in the average annual growth rate of urbanization development being less than that of CLUE (Table. 6). Slight imbalance of development (Type Ⅳ): This area includes 17 counties, such as Changsha, which is mainly located within the radiation circle of city transportation with richer cultivated land and is farther away from the urban center. The traffic axis drives the movement of various factors, such as population and capital, between urban and rural areas, promoting their joint development (Stastna and Vaishar, 2017). As a result, the degree of incoherence is low (i.e., 0.291). Coordinated development (Type V): There are 27 counties in this type of area, accounting for 22% of all counties. It can be divided into two types of areas: one is the areas with relatively high development intensity around central cities (i.e., Liuyang), and the other is in the areas with richer land resources (i.e., Changde and Huaihua). High imbalance of development (Type VI): This type includes 34 counties, such as Furong and Longshan, which are mainly located in the “Changsha-Zhuzhou-Xiangtan City Group” and the ecologically fragile areas in the northwest (Zou and Wang, 2022). Serious imbalance with lagging urban development (Type Ⅶ): This type of area includes three counties, Tianxin, Yuhua, and Shifeng, which are severely mismatched between different urbanization dimensions and CLUE and are developing slowly. Specifically, only the SU in Shifeng increased, only PU in Tianxin increased, and all dimensions of urbanization in Yuhua decreased (Figure A1). Slight imbalance of lagging (Type Ⅷ): There is only one county (i.e., Yanfeng) of this type, in which cultivated land use and urbanization are in the process of drastic transformation.
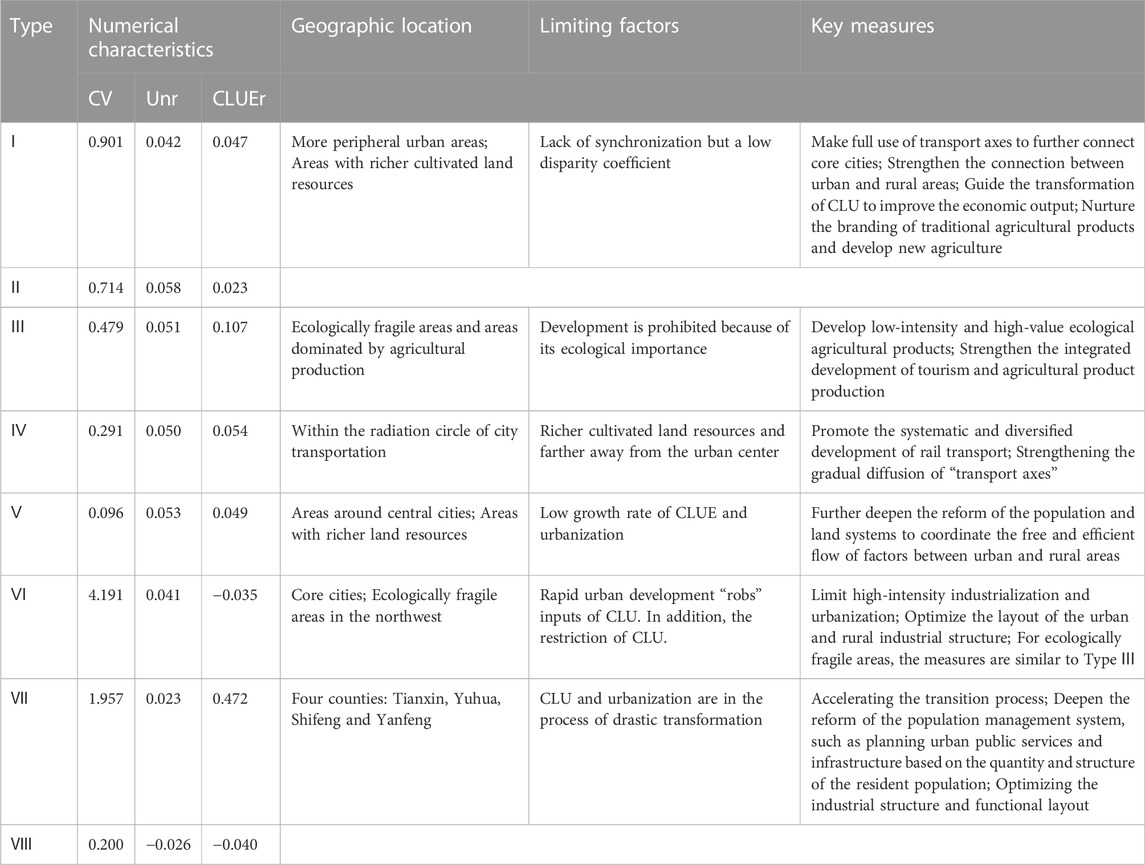
TABLE 6. Geographic location, limiting factors, and key measures of different UCLUC types.
4 Discussion
4.1 Evolution of urbanization, CLUE and UCLUC
Hunan Province is a lens through which to observe China’s urbanization process and CLUE evolution. UCLUC presents a horizontal rugby shape, which is enclosed by a flat S-shaped urbanization curve and a U-shaped CLUE curve, as shown in Figure 7. The overall level of urbanization has been improving with a flat S-shaped curve, which is an objective law verified by many countries (Mulligan, 2013). At the beginning of the new century, China’s guiding ideology was “development is the absolute principle”, and social urbanization lagged seriously. In this context, policymakers in Hunan Province were committed to pursuing economic growth, mainly driven by “land finance” and “migrant worker tide” (Gu and Liu, 2012; Lin et al., 2015), and healthcare, education and employment had to make concessions. In 2009, the development of economic urbanization was seriously impacted by the global financial crisis, and the export-led economy was hit hard in Hunan Province (Mi et al., 2017). Meanwhile, the global financial crisis also created development opportunities; a direct result was that the whole country entered the adaptation period of urbanization transformation. Hunan Province turned to increasing infrastructure construction and stimulating domestic demand to drive economic growth. Meanwhile, disadvantages such as unfairness that had accumulated during rapid urbanization gradually erupted. As a revision, a new urbanization strategy was proposed in 2012, marking China’s entry into the new urbanization stage (2013–2018). Compared with the traditional urbanization model, new urbanization is characterized as “people-oriented” and attaches importance to the quality of urbanization and the governance of the ecological environment (Yu, 2021). With the adjustment of industrial structure and the strategic adjustment of urbanization development direction, Hunan’s economic development recovered from the international financial crisis, and urbanization has tended to be highly balanced while the rate has decreased.
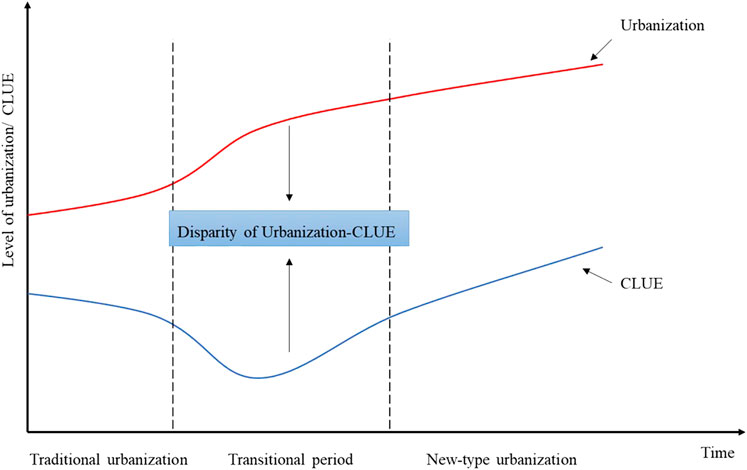
FIGURE 7. Evolution of the level of urbanization and CLUE.
China’s urbanization is known as “urbanization at breakneck speed” in human history, and it has changed CLUE considerably (Hou et al., 2019). There is a substitution effect of technology for rural labor in CLU along with urbanization (Zhao et al., 2021), and it has changed from weak to strong. In the early stage of urbanization, the necessary input elements for farmland production, such as the rural labor force and farmland, are rapidly “absorbed” by cities due for rapid urbanization and industrialization (Zhou et al., 2021), resulting in insufficient farmland use inputs, and abandonment and extensive land use behaviors appear in many areas (Su et al., 2020). As urbanization reaches a certain stage, the central government begins to focus on rural development strategies, to give more attention to the multifunctional value and sustainability of agriculture, and to apply the advanced management experience and technology that has emerged with urbanization to the cultivated land utilization system (Hou et al., 2019). As a result, labor-saving inputs such as machinery and pesticides replace the lost agricultural labor. At the same time, the output is also increasing due to yield-enhancing inputs such as improved seeds and management techniques. In addition, because people’s consumption awareness is also upgrading, the pursuit of green organic food further guides the input reduction and agricultural structural changes (Chang et al., 2018). Therefore, in the later stage of urbanization, the CLUE begins to improve, and the gap between urbanization and CLUE closely narrows.
4.2 Remove institutional barriers and accelerate the flow of factors
The realization of urban‒rural coordinated development is accompanied by the narrowing of the urban‒rural gap. The urban‒rural gap is mainly reflected in the industrial structure and the public facility services that serve the industrial structure (Azam, 2019). The narrowing of the gap between urban and rural public services and industrial sectors mainly relies on the all-around cooperation of the three major changes: labor transfer, technological progress and changes in consumer demand. These three major changes emerge in the long-term interactions of cultivated land, labor force, agricultural products, technology and other factors (Satterthwaite et al., 2010; Hou et al., 2019; Deng et al., 2020). There is a strong link between the three changes, with technological progress facilitating labor migration, labor migration facilitating the upgrading of consumer demand, and technological progress securing the upgrading of consumer demand. In the context of China, this process of interaction is deeply regulated by institutions, including the national development strategy, the household registration system and the land system (Yan et al., 2018). Because CLU systems are artificial–natural systems, the interactions are also related to geographic location and resource endowments (Figure 8). The policy intervention points to the coordinated development of urbanization and CLUE lies in accelerating the urban‒rural flow of factors through policy improvement, promoting the upgrading of the three processes. Specifically, 1) institutional reform and innovation should be deepened to establish and improve a unified urban‒rural element market and a mechanism for integrated development, to promote the free flow of elements (people, land, economy, and industry) in both directions between urban and rural areas and to enhance the allocation efficiency of elements. 2) Moreover, it is suggested to promote regional coordinated development by zoning and classification because of diverse basic conditions and development goals, as well as varying rates of development in different regions. According to their development orientation and comprehensive development level, there are eight coordination types in Huan Province, and different promotion strategies should be adopted for each type.
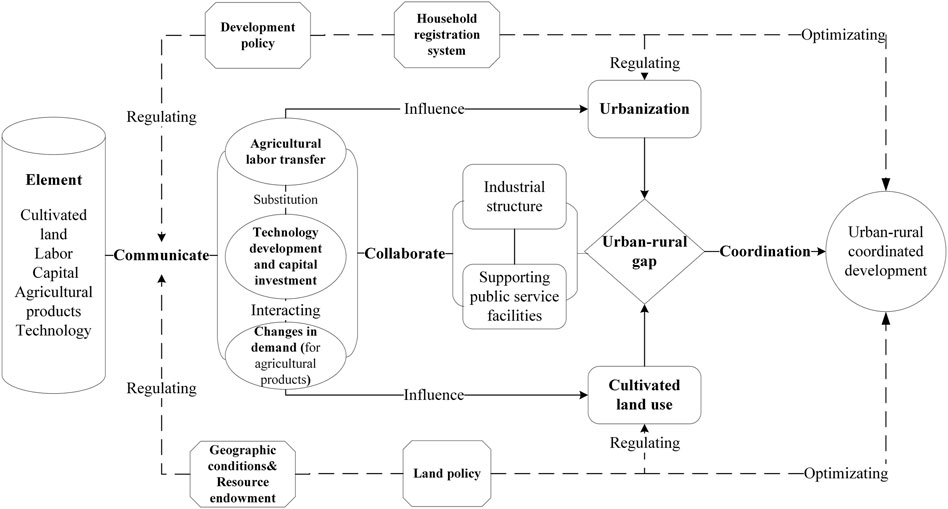
FIGURE 8. Mechanisms for urban‒rural coordinated development from the perspective of urbanization and CLUE coordination.
4.3 Policy guidance for UCLUC zoning management
On this basis of mechanisms for urban‒rural coordinated development, geographic location and limiting factors, adaptive policies for regions to promote sustainable development of urban and rural areas are proposed (Table 6). For the serious imbalance of development (Type Ⅰ) zones, it is important to fully utilize transport axes to further connect core cities, allowing them to gather population and the economy, to highlight core city development characteristics and to promote high-quality urbanization. At the same time, it should make sensible use of cultivated land resources and scientifically guide the transformation of cultivated land use to improve economic output. Specifically, the advantages of land and labor force in rural areas should be utilized fully, the branding of traditional agricultural products should be nurtured, and a combined primary and tertiary industrial chain based on agriculture should be formed, new agriculture such as eco-agriculture and experiential agriculture should be vigorously developed, and the connection between urban and rural areas should be strengthened. In regard to the high imbalance of development (Type Ⅱ) zones, the causes of development dislocation are similar to those of Type I, and the key measures are similar to those of Type I.
To promote UCLUC in the medium imbalance of development (Type III) zones, its rich ecological resource endowment should be utilized to develop low-intensity and high-value ecological agricultural products and to strengthen the integrated development of tourism and agricultural product production to improve comprehensive CLUE while preserving ecological space.
For the slight imbalance of development (Type Ⅳ) zones, the gradual diffusion of “transport axes” into rural areas should be further promoted to improve the efficiency of factor flows and to promote UCLUC in this type of zone. In particular, the construction of urban and rural rail transport should be strengthened, and the systematic and diversified development of rail transport should be promoted (Lu et al., 2019).
For coordinated development (Type V) zones, owing to the location advantage, resources from the countryside provide a good foundation for the development of suburban areas. On the other hand, the capital and technology in cities overflow into rural areas through the trickle-down effect to promote the transformation of cultivated land use from labor-intensive to capital-intensive, which effectively improves CLUE (Zhang et al., 2020). As a result, the region has formed a pattern of coordinated development of urbanization and CLUE. However, the low growth rate of CLUE and urbanization limits its further harmonious development. In the new era, the key to enhancing the UCLUC in this region lies in raising the level of urbanization and CLUE by further deepening the reform of the population and land systems; coordinating the free and efficient flow of people, land, money, industry and other elements between urban and rural areas; improving the efficiency of resource allocation; and finally creating a model for high-level coordinated urban and rural development.
Serious imbalance with lagging CLUE (Type Ⅵ) zones has had a high level of urbanization and a rapid growth rate affected by the radiation of “Changsha-Zhuzhou-Xiangtan City Group” as the leader of economic development in Hunan Province. However, rapid urban development has “robbed” a large amount of cultivated land, rural labor and other resources, leading to a reduction in the input of cultivated land systems, which has led to a slow increase in CLUE (Han et al., 2021). The key to achieving coordinated urban‒rural development in the region lies in regulating urban expansion speed and the structure of the industry to the suitable urbanization stage. Furthermore, the relationship between urban‒rural development should be regulated by optimizing the layout of the urban and rural industrial structure considering that “population is the carrier of other factors” and “people follow industry”. Ecologically fragile areas present a high level of EU and a low level of CLUE due to the restrictions of construction and cultivated land use activities (Zou and Wang, 2022). To promote UCLUC in this region, it should fully utilize its rich ecological resource endowment based on the environmental carrying capacity, insist on protecting the ecological space to develop low-intensity and high-value ecological agricultural products, and strengthen the combination of tourism and ecological agricultural products to improve the comprehensive CLUE. Moreover, the provincial agro-eco-compensation mechanism is recommended to support ecologically fragile areas and narrow the regional development gap.
Type Ⅶ zones are in the transition stage of urbanization from speed to deepening quality, which is characterized by lagging urbanization and serious imbalance. The key to improving UCLUC in this region lies in deepening the reform of the population management system to enhance the inclusiveness of cities for foreign populations (Yang et al., 2019). The quantity and structure of the resident population should be used as the basis for planning urban public services and infrastructure (Wu et al., 2020). Furthermore, the industrial structure and functional layout should be optimized to enhance the city’s innovation capacity and core advantages for speeding up and increasing the quality of urban development. The cause of the development disorder of the slight imbalance of lagging (Type Ⅷ) zones is similar to Type Ⅶ. Therefore, the governance measures are similar to Type Ⅶ; in short, accelerating the transition process.
4.4 Research limitations
In addition to bringing the economic benefits considered in this study, there are certain negative externalities associated with CLU, particularly in ecological terms, such as large amounts of carbon dioxide released (Deng and Gibson, 2019; Kuang et al., 2020). Moreover, the use of green production in agriculture is an inevitable requirement of global modern agricultural development and an important measure to achieve the 2030 sustainable development goal of the United Nations (Xie et al., 2018). Given this, the connotation of CLUE should be expanded, and ecological efficiency indicators should be included to evaluate CLUE in follow-up research.
5 Conclusion
This paper expands on the study of urban‒rural coordinated development from the perspective of urbanization and CLUE coordination and proposes an analytical framework for UCLUC. This study measures Hunan’s UCLUC level based on estimating the level of urbanization and CLUE and explores the spatiotemporal evolution. On this basis, it identifies the types of UCLUC in Hunan Province and finally proposes optimization policy suggestions to promote coordinated urban and rural development for different types of areas. The results show that from 2000 to 2018, the level of UCLUC in Hunan Province changed from serious maladjustment to great maladjustment to coordination, with the level of urbanization rapidly improving and CLUE first decreasing and then increasing. The high-UCLUC areas were mainly in the northwestern regions of Hunan Province. Eight types of UCLUC are identified in Hunan Province. In the future, targeted governance optimization measures should be taken for different types in the new era. In general, it should unify the urban and rural factor markets, promote the free flow and equal exchange of factors, and strengthen the foundation for UCLUC. Moreover, it is necessary to strengthen the construction of infrastructure such as transportation and networks, improve the level of urban and rural public services, and improve the eco-compensation system to promote the harmonious development of urban and rural areas.
Data availability statement
The original contributions presented in the study are included in the article/supplementary material, further inquiries can be directed to the corresponding author.
Author contributions
XW: Conceptualization, Methodology, Validation, Visualization, Writing—original draft. CY: Supervision, Funding acquisition, Formal analysis. LL: Conceptualization, Supervision, Writing-review and editing. ZX: Investigation, Writing-review and editing. All authors reviewed the manuscript.
Funding
This work was supported by the National Natural Science Foundation of China (Grant No. 42001224); and the Fundamental Research Funds for the Central Universities of China (Grant No. 2021TC072).
Conflict of interest
The authors declare that the research was conducted in the absence of any commercial or financial relationships that could be construed as a potential conflict of interest.
Publisher’s note
All claims expressed in this article are solely those of the authors and do not necessarily represent those of their affiliated organizations, or those of the publisher, the editors and the reviewers. Any product that may be evaluated in this article, or claim that may be made by its manufacturer, is not guaranteed or endorsed by the publisher.
References
Adugna, A., and Hailemariam, A. (2011). Rural–urban linkages in Ethiopia: Insuring rural livelihoods and development of urban centers. Netherlands: Springer. doi:10.1007/978-90-481-8918-2_9
Azam, M. (2019). Accounting for growing urban–rural welfare gaps in India. World Dev. 122, 410–432. doi:10.1016/j.worlddev.2019.06.004
Baffoe, G. (2020). Rural–urban studies: A macro analyses of the scholarship terrain. Habitat Int. 98, 102156. doi:10.1016/j.habitatint.2020.102156
Baffoe, G., Zhou, X., Moinuddin, M., Somanje, A. N., Kuriyama, A., Mohan, G., et al. (2021). Urban–rural linkages: Effective solutions for achieving sustainable development in Ghana from an SDG interlinkage perspective. Sustain. Sci. 16 (4), 1341–1362. doi:10.1007/s11625-021-00929-8
Bai, Y., Deng, X., Jiang, S., Zhang, Q., and Wang, Z. (2018). Exploring the relationship between urbanization and urban eco-efficiency: Evidence from prefecture-level cities in China. J. Clean. Prod. 195, 1487–1496. doi:10.1016/j.jclepro.2017.11.115
Boudet, F., MacDonald, G. K., Robinson, B. E., and Samberg, L. H. (2020). Rural–urban connectivity and agricultural land management across the Global South. Glob. Environ. Change 60, 101982. doi:10.1016/j.gloenvcha.2019.101982
Caffyn, A., and Dahlström, M. (2005). Urban–rural interdependencies: Joining up policy in practice. Reg. Stud. 39, 283–296. doi:10.1080/0034340050086580
Cai, Z., Li, W., and Cao, S. (2021). Driving factors for coordinating urbanization with conservation of the ecological environment in China. Ambio 50 (6), 1269–1280. doi:10.1007/s13280-020-01458-x
Cai, Z., Liu, Z., Zuo, S., and Cao, S. (2019). Finding a peaceful road to urbanization in China. Land Use Policy 83, 560–563. doi:10.1016/j.landusepol.2019.02.042
Calabro, F., and Cassalia, G. (2018). “Territorial cohesion: Evaluating the urban–rural linkage through the lens of public investments,” in Smart and sustainable planning for cities and regions, SSPCR 2017 (573-587). 2nd international conference on smart and sustainable planning for cities and regions (SSPCR). Editors A. Bisello, D. Vettorato, P. Laconte, and S. Costa. Reprinted.
Cao, K. H., and Birchenall, J. A. (2013). Agricultural productivity, structural change, and economic growth in post-reform China. J. Dev. Econ. 104, 165–180. doi:10.1016/j.jdeveco.2013.06.001
Chang, X., DeFries, R. S., Liu, L., and Davis, K. (2018). Understanding dietary and staple food transitions in China from multiple scales. PLoS One 13 (4), e0195775. doi:10.1371/journal.pone.0195775
Dadashpoor, H., and Alidadi, M. (2017). Towards decentralization: Spatial changes of employment and population in Tehran Metropolitan Region, Iran. Appl. Geogr. 85, 51–61. doi:10.1016/j.apgeog.2017.05.004
Delgado-Viñas, C., and Gómez-Moreno, M. (2022). The interaction between urban and rural areas: An updated paradigmatic, methodological and bibliographic review. Land 11 (8), 1298. doi:10.3390/land11081298
Deng, X., and Gibson, J. (2019). Improving eco-efficiency for the sustainable agricultural production: A case study in shandong, China. Technol. Forecast. Soc. Change 144, 394–400. doi:10.1016/j.techfore.2018.01.027
Deng, Z., Zhao, Q., and Bao, H. X. H. (2020). The impact of urbanization on farmland productivity: Implications for China’s requisition–compensation balance of farmland policy. Land 9 (9), 311. doi:10.3390/land9090311
Duan, Y. M., Wang, H., Huang, A., Xu, Y. Q., Lu, L. H., and Ji, Z. X. (2021). Identification and spatial-temporal evolution of rural “production-living-ecological” space from the perspective of Villagers’ behavior–A case study of Ertai Town, Zhangjiakou City. Land Use Policy 106, 105457. doi:10.1016/j.landusepol.2021.105457
Fang, C. (2022). Theoretical analysis on the mechanism and evolution law of urban-rural integration development. Acta Geogr. Sin. 77 (04), 759–776. doi:10.11821/dlxb202204001
Gollin, D. (2010). “Agricultural productivity and economic growth,” in Handbook of Agricultural Economics. Editors R. Evenson, and P. Pingali (Elsevier) Edn 1. 4, 3825–3866.
Gu, S., and Liu, J. (2012). Urbanization transition in China: From a factor-driven to an innovation-driven approach. Popul. Res. 36 (06), 3–12. Available at: https://rkyj.ruc.edu.cn/CN/Y2012/V36/I6/3.
Han, Z. W., Jiao, S., Zhang, X., Xie, F., Ran, J., Jin, R., et al. (2021). Seeking sustainable development policies at the municipal level based on the triad of city, economy and environment: Evidence from Hunan province, China. J. Environ. Manag. 290, 112554. doi:10.1016/j.jenvman.2021.112554
He, R. (2018). Urban–rural integration and rural revitalization: Theory, mechanism and implementation. Geogr. Res. 37 (11), 2127–2140. doi:10.11821/dlyj201811001
He, Y., Zhou, G., Tang, C., Fan, S., and Guo, X. (2019). The spatial organization pattern of urban–rural integration in urban agglomerations in China: An agglomeration-diffusion analysis of the population and firms. Habitat Int. 87, 54–65. doi:10.1016/j.habitatint.2019.04.003
Hou, X., Liu, J., Zhang, D., Zhao, M., and Xia, C. (2019). Impact of urbanization on the eco-efficiency of cultivated land utilization: A case study on the yangtze river economic belt, China. J. Clean. Prod. 238, 117916. doi:10.1016/j.jclepro.2019.117916
Ji, X., Ren, J., and Ulgiati, S. (2019). Towards urban–rural sustainable cooperation: Models and policy implication. J. Clean. Prod. 213, 892–898. doi:10.1016/j.jclepro.2018.12.097
Kuang, B., Lu, X., Zhou, M., and Chen, D. (2020). Provincial cultivated land use efficiency in China: Empirical analysis based on the SBM-DEA model with carbon emissions considered. Technol. Forecast. Soc. Change 151, 119874. doi:10.1016/j.techfore.2019.119874
Li, L., and Liu, D. (2021). Exploring the bidirectional relationship between urbanization and rural sustainable development in China since 2000: Panel data analysis of Chinese cities. J. Urban Plan. Dev. 147 (3), 5021024. doi:10.1061/(ASCE)UP.1943-5444.0000721
Lin, X. Q., Wang, Y., Wang, S. J., and Wang, D. (2015). Spatial differences and driving forces of land urbanization in China. J. Geogr. Sci. 25 (5), 545–558. doi:10.1007/s11442-015-1186-7
Liu, G. S., Wang, H. M., Cheng, Y. X., Zheng, B., and Lu, Z. L. (2016). The impact of rural out-migration on arable land use intensity: Evidence from mountain areas in Guangdong, China. Land Use Policy 59, 569–579. doi:10.1016/j.landusepol.2016.10.005
Liu, Y., and Li, Y. (2017). Revitalize the world’s countryside. Nature 548 (7667), 275–277. doi:10.1038/548275a
Liu, Y., and Wen, K. A. (2018). Monolithic low noise and low zero-g offset CMOS/MEMS accelerometer readout scheme. Micromachines 73 (4), 637–650. doi:10.3390/mi9120637
Liu, Y., Zang, Y., and Yang, Y. (2020). China’s rural revitalization and development: Theory, technology and management. J. Geogr. Sci. 30 (12), 1923–1942. doi:10.1007/s11442-020-1819-3
Liu, Y., Zhan, C., Zhang, P., Sun, D., Ma, H., Wang, Z., et al. (2017). MeCP2 regulates PTCH1 expression through DNA methylation in rheumatoid arthritis. Inflammation 39 (8), 1497–1508. doi:10.1007/s10753-017-0591-8
Lu, C., Ren, C., Wang, Z., Zhang, B., Man, W., Yu, H., et al. (2019). Monitoring and assessment of wetland loss and fragmentation in the cross-boundary protected area: A case study of wusuli river basin. Remote Sens. 11 (21), 2581. doi:10.3390/rs11212581
Luo, K. S., Li, B. J., and Moiwo, J. P. (2018). Monitoring land-use/land-cover changes at a provincial large scale using an object-oriented technique and medium-resolution remote-sensing images. Remote Sens. 10 (12), 2012. doi:10.3390/rs10122012
Ma, C., Jiang, Y., and Qi, K. (2021). Investigating the urban–rural integrated town development strategy on the basis of the study of rural forms in Nantong, China. Front. Archit. Res. 10 (1), 190–201. doi:10.1016/j.foar.2020.06.001
Mayer, H., Habersetzer, A., and Meili, R. (2016). Rural–urban linkages and sustainable regional development: The role of entrepreneurs in linking peripheries and centers. Sustainability 8 (8), 745. doi:10.3390/su8080745
Mi, Z. F., Meng, J., Guan, D. B., Shan, Y. L., Song, M. L., Wei, Y. M., et al. (2017). Chinese CO2 emission flows have reversed since the global financial crisis. Nat. Commun. 8, 1712. doi:10.1038/s41467-017-01820-w
Mulligan, G. F. (2013). Revisiting the urbanization curve. Cities 32, 113–122. doi:10.1016/j.cities.2013.03.014
Oueslati, W., Salanie, J., and Wu, J. J. (2019). Urbanization and agricultural productivity: Some lessons from European cities. J. Econ. Geogr. 19 (1), 225–249. doi:10.1093/jeg/lby001
Paltasingh, K. R., Basantaray, A. K., and Jena, P. K. (2022). Land tenure security and farm efficiency in Indian agriculture: Revisiting an old debate. Land Use Policy 114, 105955. doi:10.1016/j.landusepol.2021.105955
Pan, A., and Liu, Y. (2014). The degree of imbalance between population urbanization and land urbanization of Xiangjiang River Basin. Econ. Geogr. 34 (05), 63–68. doi:10.15957/j.cnki.jjdl.2014.05.012
Quan, L., Chen, Y., and Ding, S. (2019). The classification of family livelihood transition stages of migrant workers in the process of new-type urbanization and its application. China Rural. Surv. 40 (05), 17–31.
Rao, C. J., and Gao, Y. (2022). Evaluation mechanism design for the development level of urban-rural integration based on an improved topsis method. Mathematics 10 (3), 380. doi:10.3390/math10030380
Satterthwaite, D., McGranahan, G., and Tacoli, C. (2010). Urbanization and its implications for food and farming. Phil. Trans. R. Soc. B 365 (1554), 2809–2820. doi:10.1098/rstb.2010.0136
Serrano, V., and Fischer, T. (2007). Collaborative innovation in ubiquitous systems. J. Intell. Manuf. 18 (5), 599–615. doi:10.1007/s10845-007-0064-2
Shen, L., Jiang, S., and Yuan, H. (2012). Critical indicators for assessing the contribution of infrastructure projects to coordinated urban–rural development in China. Habitat Int. 36 (2), 237–246. doi:10.1016/j.habitatint.2011.10.003
Slocum, S. L., and Curtis, K. R. (2017). The urban–rural tourism relationship: A case of suburban farm shops. Wallingford: CABI, 82–93. doi:10.1079/9781786390141.0082
Song, M., and Tao, W. (2022). Coupling and coordination analysis of China’s regional urban–rural integration and land-use efficiency. Growth Change 53 (3), 1384–1413. doi:10.1111/grow.12625
Stastna, M., and Vaishar, A. (2017). The relationship between public transport and the progressive development of rural areas. Land Use Policy 67, 107–114. doi:10.1016/j.landusepol.2017.05.022
Su, Y., Qian, K., Lin, L., Wang, K., Guan, T., and Gan, M. Y. (2020). Identifying the driving forces of non-grain production expansion in rural China and its implications for policies on cultivated land protection. Land Use Policy 92, 104435. doi:10.1016/j.landusepol.2019.104435
Tacoli, C. (1998). Rural–urban interactions: A guide to the literature. Environ. Urbanization 10 (1), 147–166. doi:10.1177/095624789801000105
Tone, K. (2002). A slacks-based measure of super-efficiency in data envelopment analysis. Eur. J. Operational Res. 143 (1), 32–41. doi:10.1016/S0377-2217(01)00324-1
Torreggiani, D., Dall Ara, E., and Tassinari, P. (2012). The urban nature of agriculture: Bidirectional trends between city and countryside. Cities 29 (6), 412–416. doi:10.1016/j.cities.2011.12.006
Wang, Y., Liu, Y., Li, Y., and Li, T. (2016). The spatio-temporal patterns of urban–rural development transformation in China since 1990. Habitat Int. 53, 178–187. doi:10.1016/j.habitatint.2015.11.011
Wei, X., Liu, L., Zhang, D., Yuan, C., and Xia, Z. (2022). Performance evaluation on the policy of balancing paddy field occupation and reclamation in Hunan Province. China Land Sci. 36 (01), 57–67. doi:10.11994/zgtdkx.20211227.161139
Wu, Y. Z., Sun, X. F., Sun, L. S., and Choguill, C. L. (2020). Optimizing the governance model of urban villages based on integration of inclusiveness and urban service boundary (USB): A Chinese case study. Cities 96, 102427. doi:10.1016/j.cities.2019.102427
Xiao, L. S., He, Z. C., Wang, Y., and Guo, Q. H. (2017). Understanding urban–rural linkages from an ecological perspective. Int. J. Sustain. Dev. World Ecol. 24 (1), 37–43. doi:10.1080/13504509.2016.1157105
Xie, H., Chen, Q., Wang, W., and He, Y. (2018). Analyzing the green efficiency of arable land use in China. Technol. Forecast. Soc. Change 133, 15–28. doi:10.1016/j.techfore.2018.03.015
Xie, X. T., Li, X. S., Fan, H. P., and He, W. K. (2021). Spatial analysis of production-living-ecological functions and zoning method under symbiosis theory of Henan, China. Environ. Sci. Pollut. Res. 28 (48), 69093–69110. doi:10.1007/s11356-021-15165-x
Yan, J., Chen, H., and Xia, F. (2018). Toward improved land elements for urban–rural integration: A cell concept of an urban–rural mixed community. Habitat Int. 77, 110–120. doi:10.1016/j.habitatint.2018.01.007
Yang, Y., Bao, W., Wang, Y., and Liu, Y. (2021). Measurement of urban–rural integration level and its spatial differentiation in China in the new century. Habitat Int. 117, 102420. doi:10.1016/j.habitatint.2021.102420
Yang, Z., Wang, Y., and Liu, Z. (2019). Improving socially inclusive development in fast urbanized area: Investigate livelihoods of immigrants and non-immigrants in Nansha Special Economic Zone in China. Habitat Int. 86, 10–18. doi:10.1016/j.habitatint.2019.02.005
Yu, B. (2021). Ecological effects of new-type urbanization in China. Renew. Sustain. Energy Rev. 135, 110239. doi:10.1016/j.rser.2020.110239
Yun, B., and Nam, J. (2021). Development of evaluation model of urban growth stage considering the connectivity between core and periphery. J. Urban Plan. Dev. 147 (2), 4021004. doi:10.1061/(ASCE)UP.1943-5444.0000627
Zhang, D. H., Wang, H. Q., and Lou, S. (2021). Research on grain production efficiency in China’s main grain-producing areas from the perspective of grain subsidy. Environ. Technol. Innovation 22, 101530. doi:10.1016/j.eti.2021.101530
Zhang, H., Chen, M. X., and Liang, C. (2022). Urbanization of county in China: Spatial patterns and influencing factors. J. Geogr. Sci. 32 (7), 1241–1260. doi:10.1007/s11442-022-1995-4
Zhang, X., Tan, Y., Hu, Z. H., Wang, C., and Wan, G. H. (2020). The trickle-down effect of fintech development: From the perspective of urbanization. China & World Econ. 28 (1), 23–40. doi:10.1111/cwe.12310
Zhang, Z. H., and Lu, Y. W. (2018). China’s urban–rural relationship: Evolution and prospects. China Agric. Econ. Rev. 10 (2), 260–276. doi:10.1108/CAER-02-2018-0038
Zhao, Q., Bao, H. X. H., and Zhang, Z. (2021). Off-farm employment and agricultural land use efficiency in China. Land Use Policy 101, 105097. doi:10.1016/j.landusepol.2020.105097
Zhao, Q., Zhang, Z., Su, K., Wang, X. W., Hai, P. P., Han, B., et al. (2019). Vitrification freezing of large ovarian tissue in the human body. J. Ovarian Res. 29 (4), 77–86. doi:10.1186/s13048-019-0553-x
Zhou, B. B., Aggarwal, R., Wu, J. G., and Lv, L. G. (2021). Urbanization-associated farmland loss: A macro-micro comparative study in China. Land Use Policy 101, 105228. doi:10.1016/j.landusepol.2020.105228
Zhou, Y., Li, X. H., and Liu, Y. S. (2020). Land use change and driving factors in rural China during the period 1995-2015. Land Use Policy 99, 105048. doi:10.1016/j.landusepol.2020.105048
Zhu, C., Zhang, X., Wang, K., Yuan, S., Yang, L., and Skitmore, M. (2020). Urban–rural construction land transition and its coupling relationship with population flow in China’s urban agglomeration region. Cities 101, 102701. doi:10.1016/j.cities.2020.102701
Keywords: urban-rural development, urbanization, cultivated land use efficiency, spatiotemporal evolution, zoning, China
Citation: Wei X, Liu L, Yuan C and Xia Z (2023) Determining urban‒rural coordinated development in major grain-producing areas based on urbanization and cultivated land use efficiency coordination level: A case study in Hunan Province, China. Front. Environ. Sci. 10:1091898. doi: 10.3389/fenvs.2022.1091898
Received: 07 November 2022; Accepted: 30 November 2022;
Published: 09 January 2023.
Edited by:
Xinli Ke, Huazhong Agricultural University, ChinaReviewed by:
Xiangqin Wei, Aerospace Information Research Institute (CAS), ChinaYuan Li, Zhejiang Gongshang University, China
Copyright © 2023 Wei, Liu, Yuan and Xia. This is an open-access article distributed under the terms of the Creative Commons Attribution License (CC BY). The use, distribution or reproduction in other forums is permitted, provided the original author(s) and the copyright owner(s) are credited and that the original publication in this journal is cited, in accordance with accepted academic practice. No use, distribution or reproduction is permitted which does not comply with these terms.
*Correspondence: Chengcheng Yuan, eWNjQGNhdS5lZHUuY24=