 Qian Tian1
 Yuexing Zhang
- 1School of Accounting, Hebei Finance University, Baoding City, China
- 2PBC School of Finance, Tsinghua University, Beijing, China
- 3Offshore Oil Engineering Co., Ltd., Tianjin City, China
In this paper, we systematically explore the environmental effects of the export tax rebate rate reduction policy using the China Industrial Enterprise Database, the China Industrial Enterprise Pollution Database, and the China Customs Import and Export Database from 2005 to 2013. Our difference-in-difference (DID) estimates show that the reduction in the export tax rebate rate significantly reduces the intensity of corporate soot emissions, and this finding holds after a series of robustness tests. For every 1-unit reduction in export tax rebate rate, industrial exporters’ soot emission intensity decreases by 2.63%. The mechanism analysis shows that the decrease in soot generation, the decrease in coal use intensity, the increase in total amount and efficiency of soot treatment are important channels. Heterogeneity analysis shows that the reduction of export tax rebate rate has a more significant impact on the intensity of soot emissions of high pollution, high energy consumption and resource-based enterprises. This study may provide a reference for other developing countries that also rely on export tax rebates to adjust their policies to combine economic growth with pollution control.
1 Introduction
Since the reform and opening up in 1978, China’s foreign trade has grown rapidly. By the end of the 20th century, China had become an important global trading country and successfully joined the WTO in 2001 (Hu and Tan, 2016; Yu and Luo, 2018; Kong et al., 2021; Xu et al., 2022). Many scholars attribute the growth of China’s exports to China’s export promotion policies, of which the export tax rebate policy is an important one (Chandra and Long, 2013; Lee et al., 2021). The export tax rebate policy is to encourage the development of export trade in China by refunding the VAT and excise tax paid in the domestic production and operation of export goods in accordance with the tax law (Song et al., 2015). Export rebates are often adjusted to promote or discourage the export of certain products. In fact, besides China, countries such as South Korea, Pakistan, Bangladesh, Malaysia, Brazil and Mexico also use export tax rebate policy as an important tool to promote foreign trade (Mah, 2007; Ahmed et al., 2014; Ayob and Freixanet, 2014).
Along with the rapid expansion of foreign trade, the environmental pollution problems caused by export enterprises have become increasingly serious. Many empirical studies have concluded that the emissions of Chinese exports are significant (Peters et al., 2007; Peters and Hertwich, 2008; Weber et al., 2008; Zhang, 2012). Among the various factors that increase trade expansion and related pollution, export tax rebates have played an important role, particularly in highly polluting sectors such as “leather products”, “paper products”, “petroleum and coke products”, “chemical, rubber, and plastic products” and “ferrous metals” (Song et al., 2015).
The Chinese government has long been aware of the need to promote green trade development and has tried to find feasible solutions to improve the quality of trade exports and reduce environmental pollution. In terms of export tax rebate rate policy, as early as 1995, China reduced the export tax rebate rate for coal and industrial products in the hope of improving carbon emissions and environmental pollution. However, in 1998, due to the financial crisis and in order to stimulate trade development, the Chinese government increased the export tax rebate rates for coal, steel, aluminum and some metal raw materials (Jiang and Chen, 2020). In 2005, in order to adjust the product structure of foreign trade and encourage the increase of the proportion of trade exports of environment-friendly enterprises, China reduced the export tax rebate rates of some highly polluting, energy-consuming and resource-based products. At the same time, the export tax rebate rates for IT products and pharmaceutical products were raised to stimulate the trade competitiveness of low energy-consuming and innovative enterprises (Xu, 2018; Braakmann et al., 2020). In 2007, the Chinese central government adjusted the export tax rebate policy again. The purpose of this large-scale policy adjustment is to promote sustainable economic development and environmental protection, and to curb the development of resource-based and highly polluting trade industries. Specifically, the scope of this export tax rebate policy adjustment involves 37% of all goods in the customs, and 553 export tax rebates for highly polluting, energy-consuming and resource-based goods have been cancelled. China’s average export tax rebate rate was reduced by 5.9%, and the export tax rebate rate for highly polluting, energy-consuming and resource-based products, such as part of steel and chemicals, was reduced by 11.1% (Song et al., 2015).
In this paper, we analyze the environmental effects of export tax rebate rate reduction based on the DID method using the China Industrial Enterprise Database, the China Industrial Enterprise Pollution Database, and the China Customs Import and Export Database from 2005 to 2013. The regression results show that the reduction of export tax rebate rate significantly reduces industrial exporters’ soot emissions, and this conclusion still holds after a series of robustness tests. For each 1-unit decrease in export tax rebate rate, industrial exporters’ soot emission intensity decreases by 2.63%. The mechanism analysis shows that the reduction of export rebate rate leads to the reduction of pollution emission, the reduction of coal use intensity, the increase of pollution treatment and the increase of soot treatment per hour, which in turn leads to the reduction of soot emission intensity of industrial enterprises. Heterogeneity analysis shows that the reduction of export tax rebate rate has a more significant impact on the intensity of soot emissions of high pollution, high energy consumption and resource-based enterprises.
To the best of our knowledge, this is the first study that utilizes longitudinal data to empirically examine the impact of export tax rebate reform on industrial exporters’ soot emissions in China. We enrich the existing literature in the following aspects: 1) This study examines the impact of environmental export tax rebate policy on enterprises’ emission behavior at the micro-enterprise level by using unique data on enterprises’ production, export and emission. 2) We innovatively use a comprehensive soot emission indicator as the dependent variable, which is different from previous literature that uses indicators such as carbon dioxide and sulfur dioxide as proxy variables to measure enterprises’ emission. 3) Based on the heterogeneity of the impact of export tax rebate policy on the emission behavior of enterprises with different property rights and industries, this paper further classifies the sample by property nature and industry.
The remainder of this paper is organized as follows. Section 2 presents a review of the existing literature on the subject. Section 3 introduces the data and identification strategy. Section 4 reports the main empirical results. Section 5 presents the discussions. Finally, concluding remarks on policy implications are summarized in Section 6.
2 Literature review
2.1 The impact of export tax rebates on trade
Most of the available literature has concluded that export tax rebate policies have a positive trade promotion effect (Chen et al., 2006; Mah, 2007; An et al., 2017; Bao et al., 2017; Liu and Ge, 2018; Zhang, 2019). Chao et al. (2001) studied the impact of export tax rebates on trade by developing a general equilibrium model using Chinese data from 1985 to 1999 and found that there was a significant export promotion effect of export tax rebates in the short run. Using a partial equilibrium model, Chen et al. (2006) found that export tax rebates increased the output and profits of domestic exporters and that China’s net exports and foreign exchange reserves showed a significant positive relationship with export tax rebate policy. Mah (2007) examined the effectiveness of the tax rebate system in promoting exports in Korea, where the development strategy was often characterized as export-led growth, assuming infinite elasticity of export demand, and found that the tax rebate system contributed significantly to export promotion. Zhang (2019) assessed the impact of export tax rebates on firms’ total factor productivity using a panel of large manufacturing firms in China from 2007–2015 and found that export tax rebates expanded firms’ exports and acted as an alternative financial channel to increase firms’ total factor productivity. Zhang et al. (2022) examined the relationship between export tax rebates and productivity using firm-level data for China from 2000 to 2007. They found that a one-percentage-point reduction in the export tax rebate rate could increase a firm’s total factor productivity (TFP) by about .1 percentage points.
The export tax rebate policy is actually a preferential tax policy to encourage exports. However, the impact of different tax policies on exports is different. Nguyen (2014) found that tariff reductions following 12 bilateral FTAs and one regional FTA between Japan and countries such as Singapore, Mexico, and Malaysia had increased the scale of product exports. Mai and Stoyanov (2015) examined the impact of CUSFTA on Canadian trade flows and found that a .3%–.35% reduction in tariff levels significantly contributed to Canadian trade growth. Sun et al. (2020) combined a multisectoral dynamic computable general equilibrium model with an ecological footprint evaluation and found that energy taxes increased the export of the ecological footprint but reduced its import.
2.2 Environmental impacts of trade
The pollution halo hypothesis and the pollution haven hypothesis are the two representative inconsistent views regarding the impact of trade on the environment. The pollution halo hypothesis suggests that trade will lead to environmental improvement because foreign trade will bring advanced technology and management experience to developing countries, which in turn will improve their production methods and integrated environmental management (Bokpin, 2017; Singhania and Saini, 2021). Tsai (1999) used a partial equilibrium strategic trade framework to show that trade liberalization can improve environmental quality. Antweiler et al. (2001) developed a theoretical model to divide trade’s impact on pollution into scale, technique, and composition effects and then examined this theory using data on sulfur dioxide concentrations. They found that trade liberalization appeared to be good for the environment. Eskeland and Harrison (2003) found that multinational firms were more energy efficient and more likely to adopt clean energy than local firms using data from Mexico, Côte d'Ivoire, Morocco and Venezuela. Asghari (2013) reached similar conclusions using data from the Middle East and North Africa. Xu et al. (2022) analyzed the impact of foreign trade on green total factor energy efficiency in China using panel data for 30 provinces from 2004–2017, and the results of the spatial Durbin model suggested that an increase in imports not only led to economic growth, but also had a positive impact on regional green total factor energy efficiency.
In contrast, according to the pollution haven hypothesis, developed countries will use outward investment to shift their pollution-intensive industries to developing countries with less stringent environmental regulations to avoid the increase in production costs of polluting industries due to stringent environmental regulations in their countries (Acharyya, 2009). Chung (2014) studied the investment and trade data of the industrial sector in Korea and found that polluting industries tend to move to countries with less stringent environmental regulations. Bokpin (2017) used 24 years of panel data (1990–2013) for Africa to investigate the impact of FDI inflows on ecosystems. The combined empirical results showed that increased FDI inflows significantly exacerbated environmental degradation and negatively affected environmental sustainability. Bu et al. (2019) argued that pollution-intensive industries and industries with low levels of environmental protection were more likely to invest in countries or regions with less stringent environmental regulations, and multinational companies with high environmental protection technologies tended to invest in regions with higher environmental regulations, so countries or regions with lax environmental regulations became pollution havens; Zhang (2019) found that trade benefited developed countries, but increased CO2 emissions in developing countries; Tachie et al. (2020) explored the impact of trade openness in developed countries using 18 EU economies. Mean group (MG) and augmented mean group (AMG) results showed that trade openness increases co2 emissions in the EU18. Using a time series dataset for Uruguay from 1980 to 2018, Awosusi et al. (2022) found that trade liberalization had a catalytic effect on CO2 emissions in both the long and short term, and that Uruguay’s economic expansion had worsened environmental quality in both the long and short term.
2.3 Environmental impact of export tax rebates
From the previous literature review, it is clear that export tax rebates affect trade, and trade affects the environment, so changes in export tax rebates may affect the environment. Some scholars believe that the export tax rebate policy can be an important tool for environmental protection. For example, Song et al. (2015) analyzed the effectiveness of export tax rebate adjustments aimed at alleviating environmental pressure in different periods by means of a computable general equilibrium model. They found that before 2003, high polluting sectors enjoyed higher than average export rebates leading to an increase in pollution emissions, and between 2003 and 2010, the export rebate system reduced support for high polluting export sectors leading to a decrease in emissions. Eisenbarth (2017) used a general equilibrium model for empirical testing and found that the VAT rebate rates were set in a way that discouraged exports of water pollution intensive, SO2 intensive and energy intensive products from 2007 on.
Some other scholars argue that changes in export tax rebate refund policies have a limited effect on environmental protection. For example, By applying a CEEPA (China Energy and Environmental Policy Analysis system) model, Fan et al. (2015) simulated the impacts of the cancellation of export rebates on CO2 emissions and socio-economic consequences, and believed that the export tax rebate policy has a limited role in environmental protection and should not be used as an important tool for environmental protection.
Since export tax rebate policy is one kind of tax policy, the analysis of the impact environment of other tax policies can also provide us with some insights. As a representative tax closely related to the environment, scholars have done a lot of research on environmental tax. Most studies have concluded that environmental taxes can improve environmental quality (Sterner, 2007; Wissema and Dellink, 2007; Lin and Li, 2011; Borozan, 2019). Convery et al. (2007) concluded that environmental taxes may generate $13 billion in revenue for the Irish economy and lead to a 90 percent drop in Ireland’s carbon dioxide emissions. Piciu and Trică (2012) examined the environmental tax and CO2 emissions nexus in EU member nations, and found the inverse relationship between environmental taxes and CO2 emissions. He et al. (2019) also found the influential role of environmental taxes in minimizing the CO2 emissions in OECD economies and China. Wolde-Rufael and Mulat-Weldemeskel (2021) assessed the effectiveness of environmental taxes and environmental policy instruments in reducing CO2 emissions in seven emerging economies over the period 1994–2015, and found that strict environmental policies and environmental taxes were effective in reducing CO2 emissions. Based on data from Chinese listed companies from 2010 to 2019, Wang C et al. (2022) developed an evaluation system for corporate green innovation and found that tax incentives promoted corporate green innovation. However, a few studies have concluded that environmental control policies such as environmental taxes are not effective on the environment. Using interprovincial panel data from 2001–2013, Li and Liu (2015) found that the collection of pollution fees may cause an increase in industrial pollution emissions. Wang and Wei (2020) employed the panel smooth transition regression technique and found that stringency environmental policy does not improve environmental quality by reducing CO2 emissions.
A review of the existing literature reveals that there is no consensus on the study of the environmental effects of trade policies. More importantly, empirical studies on the environmental effects of export tax rebate policies are still relatively few, and the existing literature on the environmental effects of export tax rebates mainly focuses on the macro level, lacking firm-level analysis. This paper empirically investigates the impact of export tax rebate policy on the environmental behavior of enterprises, making a marginal contribution to the existing research on the environmental effects of export tax rebate policy.
3 Materials and methods
3.1 Data and variables
Our data were collected from multiple sources. The enterprise-level characteristics were mainly from the China Industrial Enterprise Database (2005–2013), the China Customs Statistics (2005–2013) and the Industrial Enterprise Pollution Emission Database (2005–2013). The China Industrial Enterprise Database records information on the categories, production, and business activities of industrial enterprises above the scale (annual sales of five million RMB before 2011 and 20 million RMB after 2011) (Long et al., 2022). The China Customs Statistics contains the type of ownership of the enterprise, the type of import and export, the HS code, quantity and amount, trade mode and mode of transport of the imported and exported goods, the destination of the exported goods and the place of origin (Bouvet et al., 2017). The Industrial Enterprise Pollution Emissions Database provides information on the output, energy consumption, and pollution emissions of industrial enterprises in China (Zhang et al., 2018).
The purpose of this paper is to examine the impact of export tax rebates on firms’ emission behavior. We matched the China Industrial Enterprise Database, the China Customs Statistics and the Industrial Enterprise Pollution Emission Database using the legal person code and the company name to obtain the category, operation, product exports and pollution information at the enterprise level. The specific matching process is as follows: first, the China Industrial Enterprise Database was processed by referring to (Brandt et al., 2012), deleting samples with total revenue, employment, fixed assets, total sales, R&D expenses, and intermediate inputs less than 0, deleting invalid samples with original value of fixed assets less than net value, missing company name or wrong establishment time, deleting non-manufacturing enterprises, deleting employment enterprises with less than eight persons. After that, the data of previous years were combined to form the panel data of industrial enterprises database. Second, we used a similar approach to construct the panel data of Industrial Enterprise Pollution Emission Database. Third, since the export tax rebate policy targets exporters, we only keep the sample of exporters in the customs database. We matched the codes in the list of commodities for which the export tax rebate rates were adjusted by the Ministry of Finance and the General Administration of Taxation with the Harmonized System (HS) 8-bit code, and the reduction of the export product tax rebate rates was equal to the difference between the rates before and after the export tax rebate reform in 2007. How to convert the product-level tax rebate rate to the firm-level tax rebate rate is the key issue to be considered. In this paper, only the products with the largest company sales are retained in the benchmark regressions, and the difference in company-level tax rates is the difference in the tax rate of the product with the largest company sales value before and after 2007. The change in the firm-level export tax rebate rate in the robustness test was then based on the difference in the export tax rebate rates of multiple products before and after the reform multiplied by the weighted average of the ratio of sales of that product to total sales in 2006. After that, the panel data were formed by removing the duplicate observations at the firm level for each year. Finally, the processed panel data of industrial enterprises database, the China Customs Statistics and the Industrial Enterprise Pollution Emission Database were combined according to the unique identifiers formed by the firm identity information to form the panel data needed for regression analysis.
The explained variable in this paper is the emission behavior of enterprises, which is measured by the intensity of soot emissions from enterprises. The soot emission intensity of an enterprise is equal to the soot emission divided by the total industrial output value of the year. The explanatory variable is
Referring to (Chen, 2020), the control variables in this paper including (1) Stateowned, which takes the value of one if an enterprise is state-owned and 0 if non-state-owned. (2) Firmsize, which is the logarithm of the company’s total assets. (3) Firmage, which is the year of observation minus the year of firm establishment. (4) KL, which is the net value of fixed assets by the number of employees of the firm. (5) LEV, which is a firm’s gearing ratio, is measured by dividing a firm’s total liabilities by its total assets. (6) Provocatory, which indicates whether or not the province or municipality where the company is located has conducted a pilot program to increase its sewage charges, taking a value of one if it does, and 0 otherwise.
Table 1 shows the descriptive statistics of the main variables. The average export tax rebate rate of the sample enterprises decreased by 2.95%, with a maximum decrease of 13%. The share of state-owned enterprises was 10.8%, and the average asset-liability ratio was 55.1%.
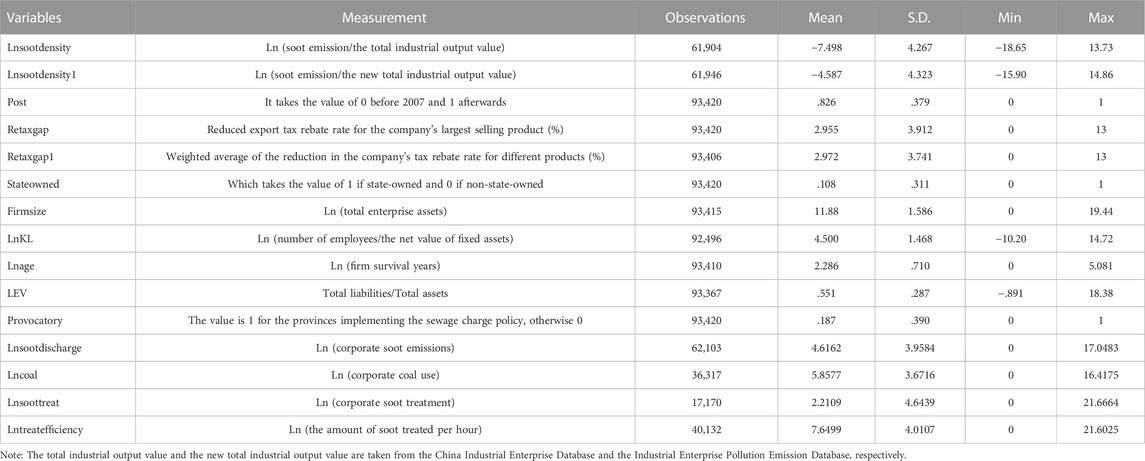
TABLE 1. Descriptive statistics.
The intensity of soot emissions depends mainly on the amount of soot produced and treated. To examine the mediating mechanisms by which export rebates affect firms’ soot emissions, we introduce four mediating variables. Variables that measure soot production include lnsootdischarge (corporate soot emissions) and lncoal (corporate coal use). Variables that measure soot treatment include lnsoottreat (corporate soot treatment) and Lntreatefficiency (treatment efficiency of soot treatment facilities, measured by the amount of soot treated per hour).
3.2 Methods
To effectively address the endogeneity problem, we construct a DID model to identify the impact of declining export tax rebates on the intensity of soot emissions of Chinese enterprises. The formula is as follows:
Here, i represents the enterprise, j represents the industry, k represents the province, and t represents the year. The explanatory variable
In order to analyze the channels through which export tax rebates affect firms’ emission behavior, we examine the relevant mediating variables by drawing on the stepwise test proposed by Baron and Kenny (1986) (Baron RM and Kenny, 1986). The basic steps are as follows: (1) examine the relationship between the main independent variable and the dependent variable, and if the coefficient is significant, proceed to the next step, otherwise stop the test; (2) identify the correlation between the mediating variable and the dependent variable to see whether there is a statistically significant correlation; (3) The dependent variable is regressed on both the independent and mediating variables to test whether the regression coefficients of the mediating variables reach significance levels and whether the regression coefficients of the independent variables decrease. Based on Baron and Kenny’s condition for the mediating effect to hold, the following three equations were developed.
The mediating variables
4 Results
4.1 Baseline regression results
Table 2 reports the results of the baseline regressions on the effects of changes in export tax rebate policy on industrial exporters’ soot emission intensity. The regression results with the inclusion of time fixed effects, province fixed effects, industry fixed effects and firm fixed effects indicate that the reduction in export tax rebate rate has a significant negative impact on the intensity of soot emission intensity of industrial export enterprises, and the results remain robust after gradually adding control variables. The coefficient of the interaction term in column (6) indicates that for every 1-unit decrease in the average export tax rebate rate faced by industrial exporters, the firms’ soot emission intensity decreases by 2.63%.
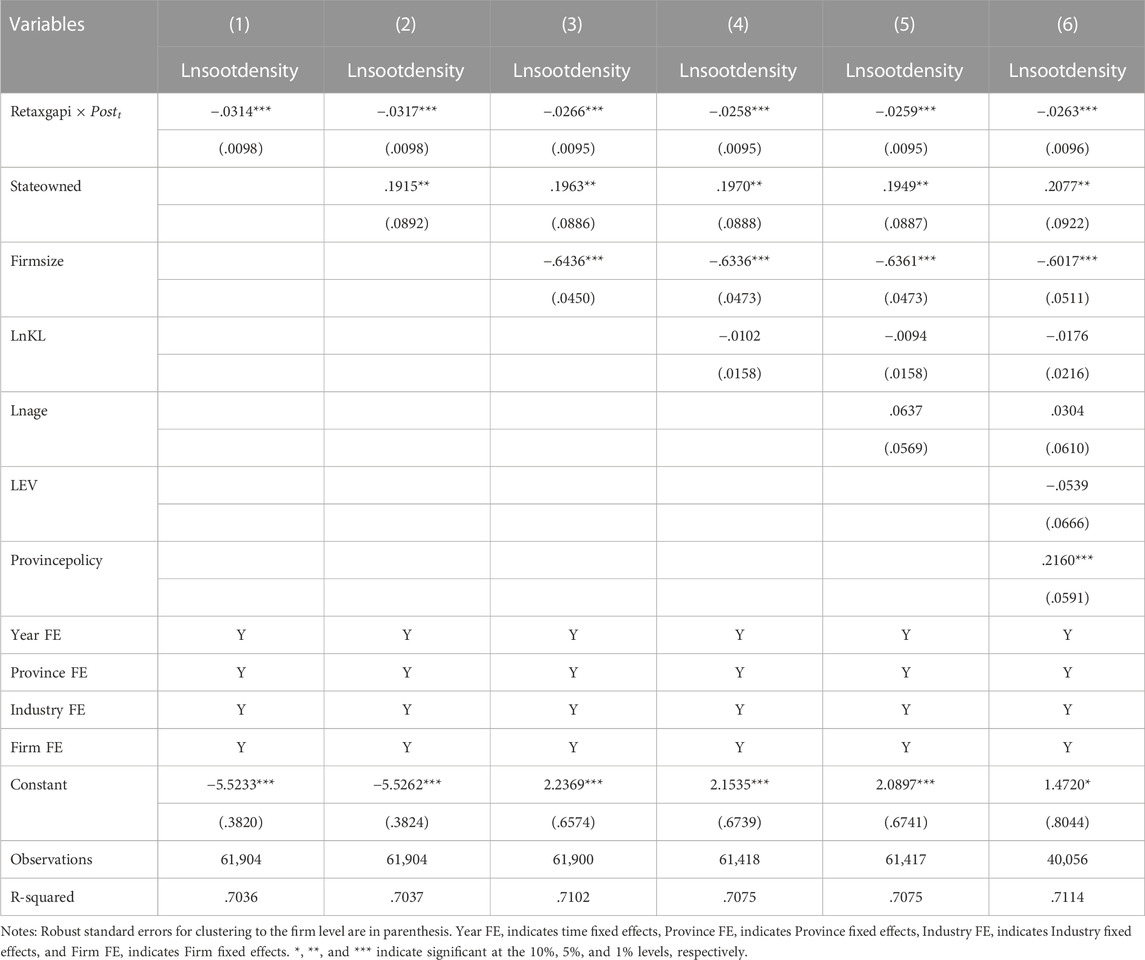
TABLE 2. Impact of the reduction of export tax rebate rate on industrial exporters’ soot emission intensity.
4.2 Robustness tests
4.2.1 Parallel trend test
The central premise of the validity of the DID model is that the parallel trend assumption is satisfied. Although the results in Table 2 show that the reduction in export tax rebate rate significantly reduces the smoke emission intensity of industrial exporters, endogeneity issues such as omitted variables, measurement errors and self-selection by firms cannot be completely excluded. In this paper, the parallel trend hypothesis is that if China does not adjust its export tax rebate policy, the trend of soot emission intensity of firms in the sample will be similar. We use event analysis to test this hypothesis. The equations are as follows:
Where
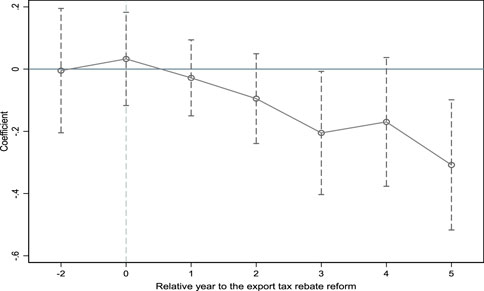
FIGURE 1. Parallel trend test and the dynamic effect analysis of the reduction in export tax rebate rate. Notes: The horizontal coordinates indicate the year relative to the export tax rebate reform in 2007. Specifically, 0 indicates the year in which the export tax rebate reform took place, and 1 indicates the first year of the VAT reform. The vertical coordinate indicates the magnitude of the interaction term coefficient, with the dashed line depicting the 95% confidence interval.
4.2.2 Placebo test
Compared with 2006, in 2007, there were 4498 enterprises whose export tax rebate rates were reduced and 5582 enterprises whose export tax rebate rates did not change. Drawing on (Cai et al., 2016), this paper constructs placebo-tested pseudo-group dummy variables by randomly selecting 4498 firms from 10,380 respondents and setting them as a pseudo-treatment group for export tax rebate rate reduction, and setting the remaining 5882 respondents as a pseudo-control group. Pseudo-cross terms for the grouping dummy variable and the policy implementation time dummy variable are then constructed. Figure 2 reports the kernel densities of the estimated coefficients for the 500 pseudo-treatment groups and the corresponding p-value distributions. Where the x-axis indicates the magnitude of the estimated coefficients of Pseudo-cross terms, the y-axis indicates the magnitude of the density values and p-values, the curve is the kernel density distribution of the estimated coefficients, the blue dots are the p-values of the estimated coefficients, the vertical dashed line is the true estimate of the DID model -1.047, and the horizontal dashed line is the significance level .1. As can be seen from the figure, the estimated coefficients are mostly concentrated around the zero point, and the p-values of most of the estimated coefficients are greater than .1 (insignificant at the 10% level), further demonstrating that the study findings are robust.
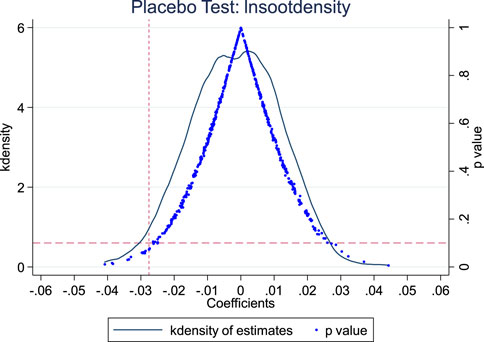
FIGURE 2. Placebo test for export tax rebate reform randomness.
4.2.3 Robustness test—Replacement of explanatory variables
In the baseline regression, the change in the company’s export tax rebate rate is measured by the tax rate of the company’s largest product. In the robustness test, the change in the company’s export tax rebate rate of various products is multiplied by the proportion of sales of various products to total sales in 2006 to obtain the weighted average of the company’s tax rate reduction, i.e., Retaxgap1. Table 3 shows that the regression results of adding time fixed effect, province fixed effect, industry fixed effect and company product fixed effect show that the reduction in export tax rebate rate has a significant negative impact on the company’s smoke emission intensity. The results are still robust after gradually adding control variables. For every 1 unit decrease in the average export tax rebate rate faced by exports at the firm level, the industrial exporters’ soot emission intensity decreases by 3.09%, which is basically consistent with the baseline regression results.
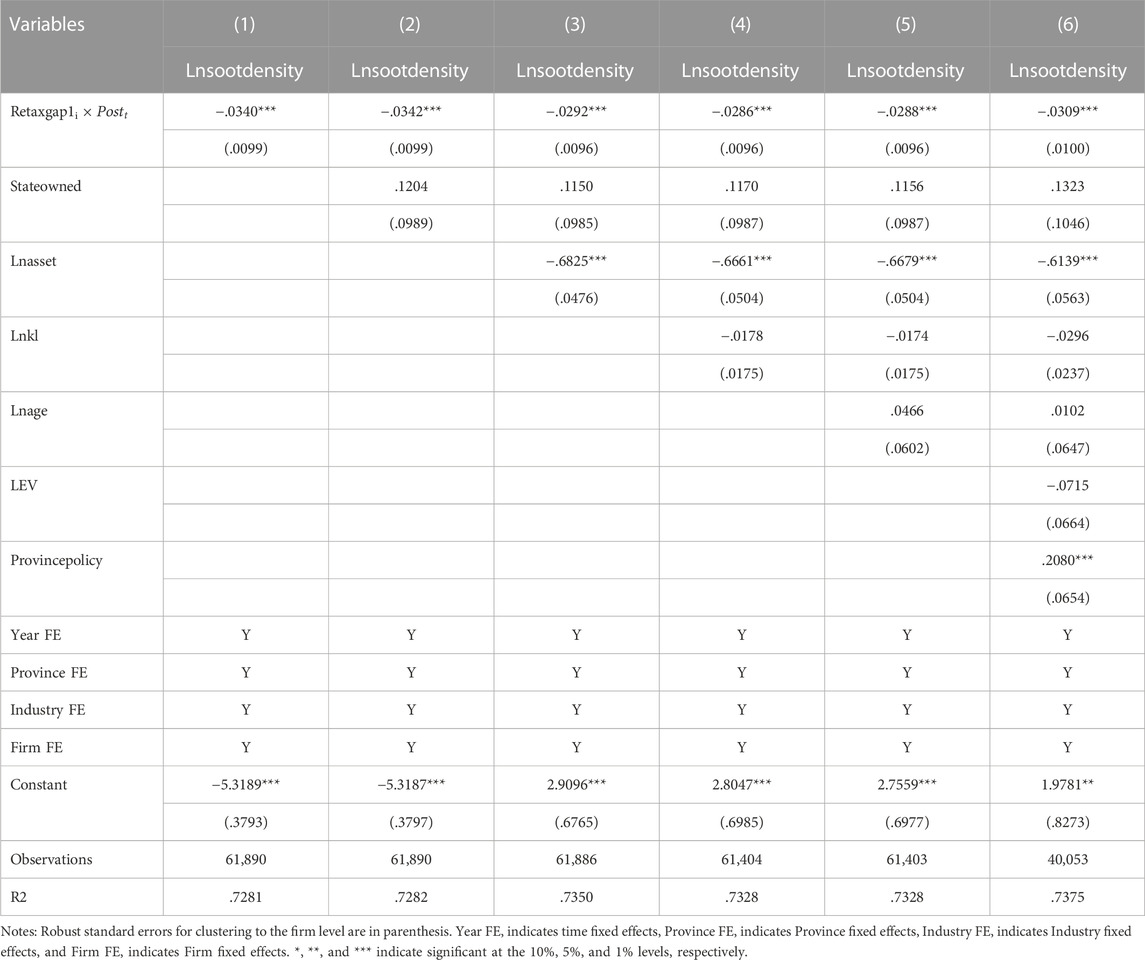
TABLE 3. Impact of export tax rebate rate reduction on the firms’ soot emission intensity (Replace explanatory variables).
4.2.4 Robustness test—Replace the dependent variable
In the previous empirical analysis, the gross industrial output value of enterprises in the formula for calculating the soot emission intensity of enterprises was obtained from the industrial enterprise database. A related concern is that there may be a difference between the gross industrial output value of enterprises in the industrial enterprise database and the pollution database, and this difference may lead to a change in the main empirical findings. In fact, the comparison reveals that the gross industrial output values in the two databases are not exactly the same. To ensure the robustness of the study results, this section uses the gross industrial output value of enterprises in the enterprise pollution database to calculate the intensity of enterprise soot emissions, and the corresponding regression results are reported in Table 4. It can be seen that the reduction of export tax rebate rate has a significant negative effect on enterprise soot emission intensity, and the two ways of calculating enterprise soot emission intensity lead to basically the same conclusion.
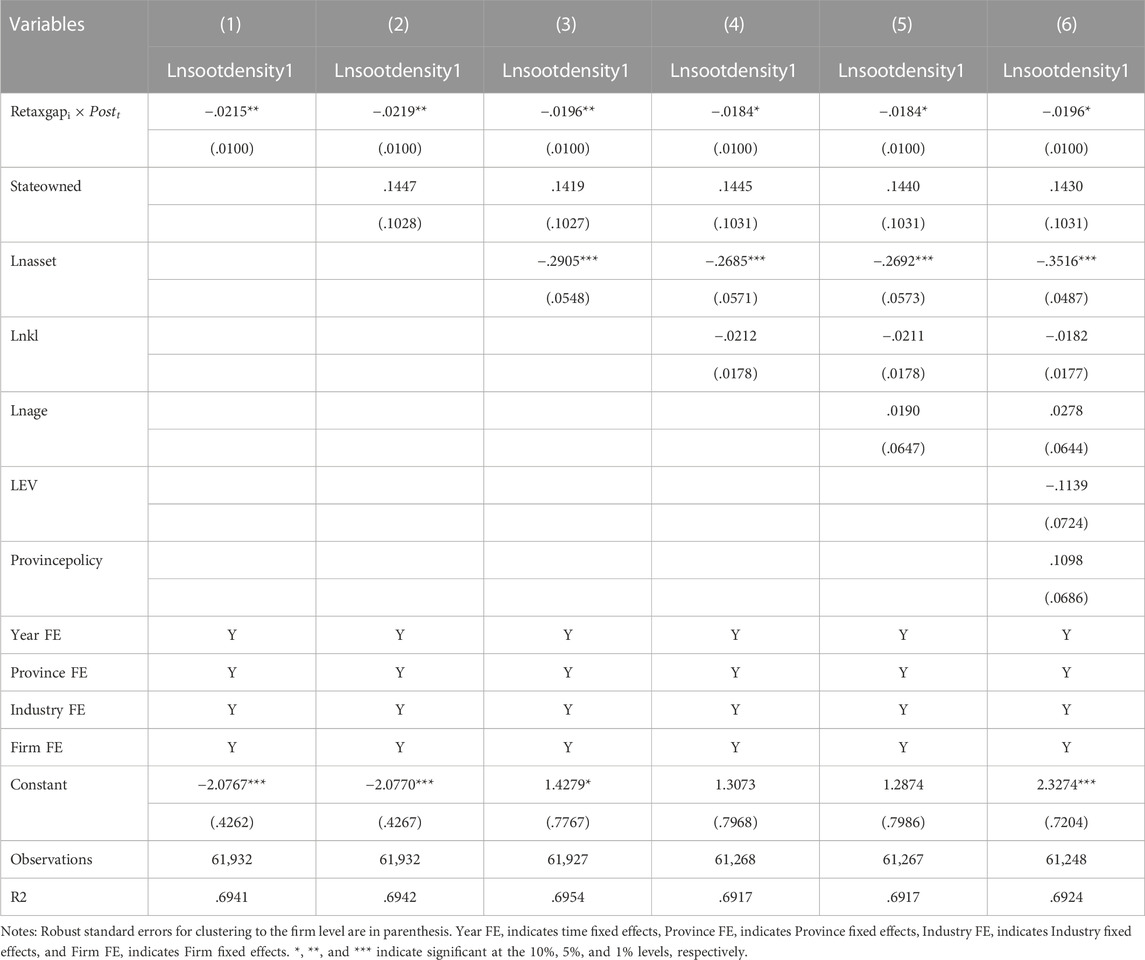
TABLE 4. Impact of export tax rebate rate reduction on the firms’ soot emission intensity (Replace dependent variables).
4.3 Mechanism analysis
In Section 3, we find that a reduction in the export tax rebate rate has a significant negative impact on the intensity of smoke emissions from firms. In this section, we further explore how export tax rebate rate reduction reduces soot emissions intensity. The mechanism test is to investigate whether the export tax rebate rate can reduce enterprise soot emission intensity through the reduction of emissions and the increase of pollution treatment. The empirical results are shown in Table 5.
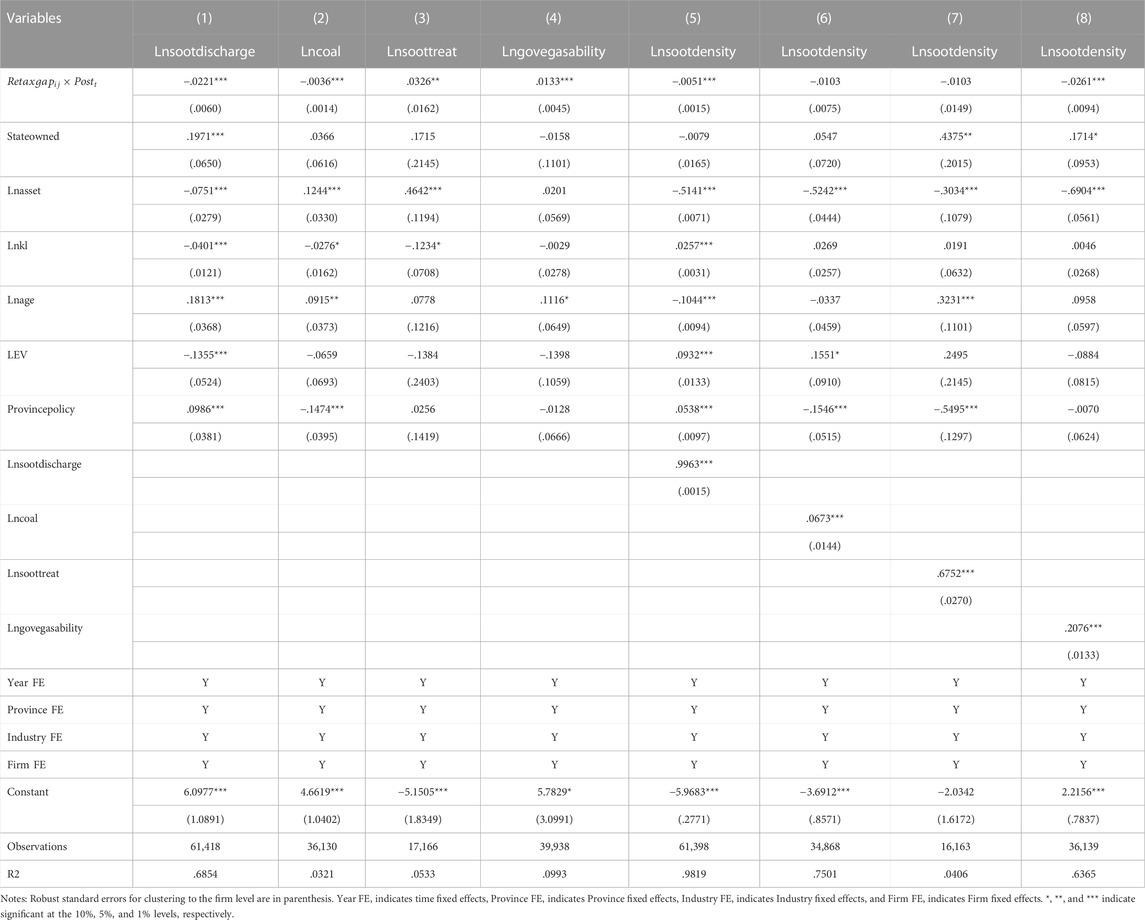
TABLE 5. Mediation mechanism of the effect of export tax rebate rate reduction on the firms’ soot emission intensity.
The coefficients of the interaction terms in columns (1), (2), (3) and (4) of Table 5 indicate that the reduction in the export tax rebate rate leads to a decrease in the amount of soot generated and the amount of coal used by firms, an increase in the amount of soot treated and the amount of soot treated per hour. Columns (5), (6), (7) and (8) report the results with the inclusion of mediating variables, where the values of the coefficients of the interaction terms decrease or are no longer statistically significant, and the coefficients of the mediating variables are significantly positive, indicating that lnsootdischarge, lncoal, lnsoottreat and Lngovegasability are the mediating mechanisms by which the reduction in the export tax rebate rate affects firms’ soot emission intensity.
4.4 Results of the heterogeneity analysis
The heterogeneity estimation results of the impact of export tax rebate rate reduction on soot emission intensity of different types of enterprises are shown in Table 6. Negative results for all interaction terms in each column imply that both state-owned enterprises (SOEs) and non-state-owned enterprises (non-SOEs) reduce their soot emission intensity when the export tax rebate rate is reduced. Specifically, for every 1-unit decrease in the average real export tax rebate rate of enterprises, the soot emission intensity from SOEs decreased by 4.74% and soot emissions from non-SOEs decreased by 2.81%.
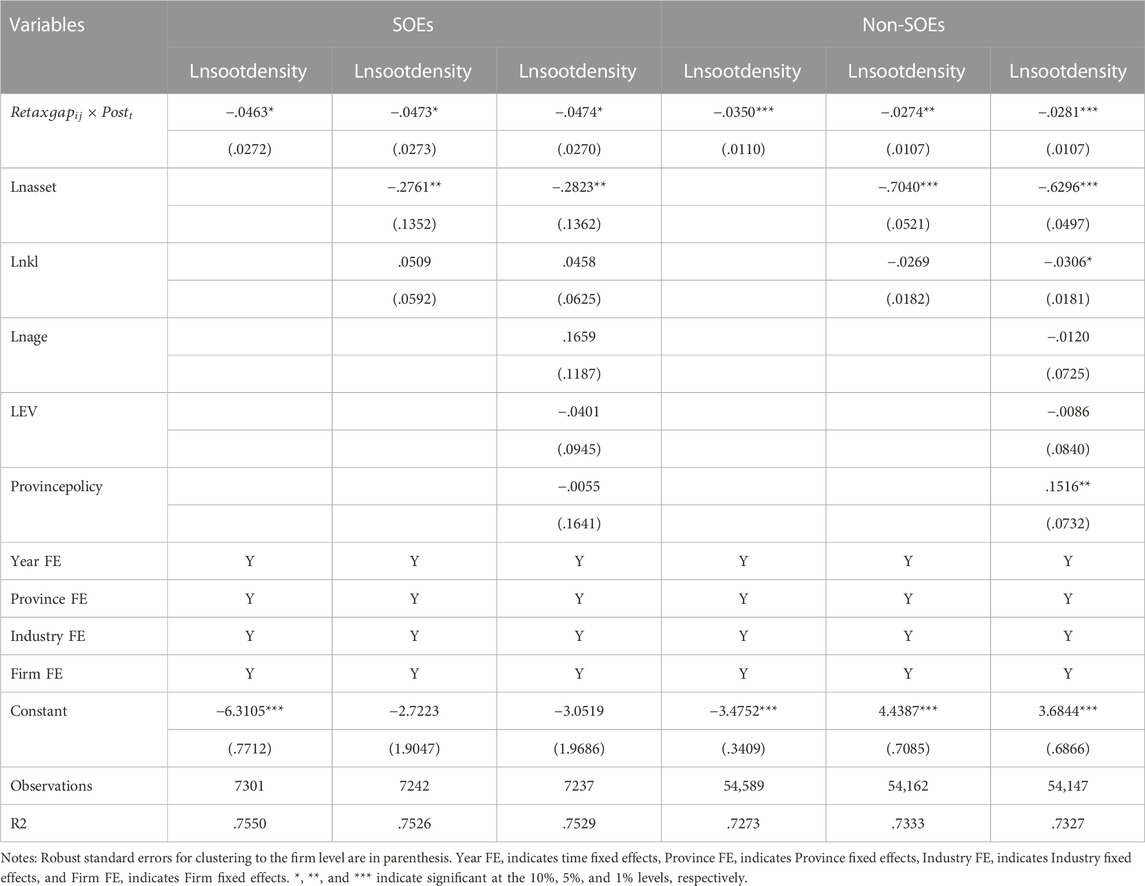
TABLE 6. Effect of lower export tax rebate rate on the intensity of soot emissions from SOEs and non-SOEs.
The regression results of the heterogeneity analysis by industry are presented in Table 7. The reduction of export tax rebate rate significantly reduces the soot emissions of highly polluting, energy-consuming and resource-based (HHR) industries, and has no significant effect on the soot emissions of non-HHR industries. Specifically, for every 1-unit decrease in the average real export tax rebate rate of enterprises, the soot emission intensity from HHR industries decreased by 2.16%.
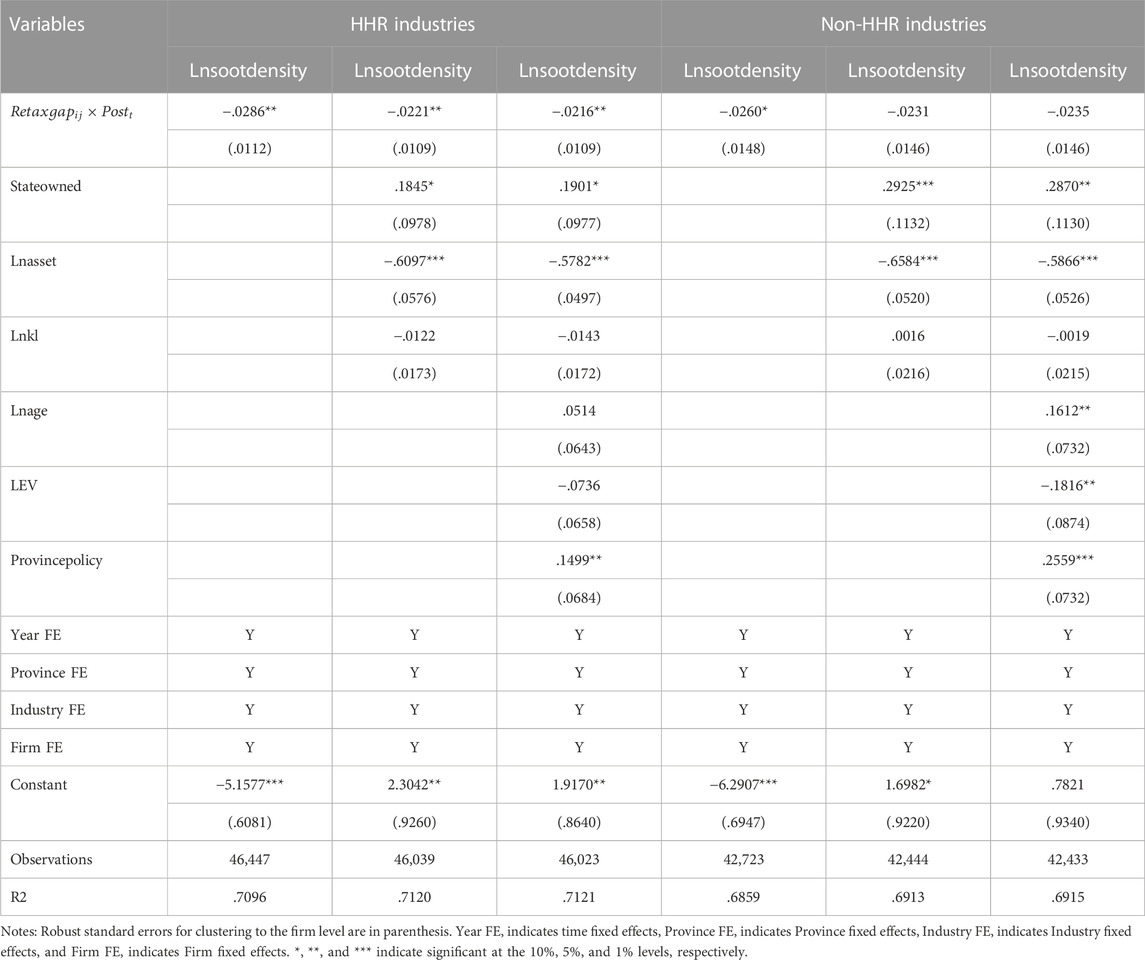
TABLE 7. Effect of lower export tax rebate rate on the intensity of soot emissions from HHR industries and non-HHR industries.
5 Discussion
Many previous studies suggest that export tax rebate policy, which are important policy tools for governments, are often used to stimulate export (Chong'En et al., 2011; Lee et al., 2021) and firm productivity (Zhang, 2019), thereby promoting economic growth (Xu, 2018). Few studies have explored the impact of the export tax rebate policy adjustment that may lead to environmental improvements. In this paper, we systematically explore the environmental effects of the export tax rebate rate reduction policy using three large representative micro data sets in China. We find that the reduction in the export tax rebate rate significantly reduces the intensity of corporate soot emissions, and this finding holds after a series of robustness tests. For every 1-unit reduction in export tax rebate rate, enterprises’ soot emission intensity decreases by 2.63%. Our results are basically consistent with the previous literature. Song et al. (2015) examined the relationship between export tax rebates and pollution emissions in China using a computable general equilibrium model, and found that China’s export tax rebates reduce support for highly polluting export industries and thus led to a reduction in emissions. Fan et al. (2015) used the CEEPA (China Energy and Environmental Policy Analysis system) model to simulate the impact and socioeconomic consequences of eliminating export tax rebates on CO2 emissions. They concluded that the current policy of eliminating export tax rebates for key industries could promote emission reduction, but would have a negative impact on the economy. In contrast to the lack of firm-level analysis of environmental behavior in existing studies, this paper empirically investigates the impact of export tax rebate policy on industrial exporters’ soot emissions, making a marginal contribution to the existing research on the environmental effects of export tax rebate policy.
The mechanism analysis shows that the reduction of emissions and the increase of pollution treatment are important channels. Specifically, we find that export tax rebates reduce the amount of coal used by firms. As a large energy consumer, heavy industrial polluting enterprises in China consume a lot of coal and most of the soot emissions are caused by coal use (Wang et al., 2018; Mengshu et al., 2021; Heerma Van Voss and Rafaty, 2022; Li et al., 2022; Zhao et al., 2023). The reduction in coal use means that from the enterprise level, the reduction of export tax rebate rate will force enterprises to optimize their energy structure, thus alleviating the problem of high percentage of coal use by Chinese industrial enterprises. Our analysis is supported to some extent by the research of Wang and Liang, who argue that the development of environmental regulations in China could further improve energy efficiency and carbon neutrality (Wang and Liang, 2022). In addition, we find that the export rebate enhances the efficiency of soot treatment. The possible reason is that companies increase their investment in environmental equipment or green technology innovation stimulated by the tax policy (Li and Li, 2022; Wang Z et al., 2022).
Heterogeneity analysis shows that the reduction of export tax rebate rate has a more significant impact on the intensity of soot emissions of high pollution, high energy consumption and resource-based enterprises. The main reason is that the adjustment of export tax rebate policy in 2007 is mainly aimed at curbing the development of high pollution, high energy consumption and resource-based industries (Lee et al., 2021). Specifically, the export tax rebate rate for chemical products, some chemicals, some steel and base metals and other products dropped by 11.1% on average (Song et al., 2015).
Our study also has certain limitations. On the one hand, limited by the indicators of the data, we do not have the means to assess all aspects of the changes in export tax rebate policies on firms’ micro-pollution behavior. On the other hand, this study involves a large amount of data on traded products and their corresponding export tax rebate rates. Using the change in export tax rebate rates calculated by the largest traded products of the company and the change in export tax rebate rates calculated by the weighted average of the company’s product shares, the impact of the policy may be somewhat underestimated due to the company’s initiative to adjust its product mix in the face of the reduction in product export tax rebate rates.
6 Conclusion
Using the China Industrial Enterprise Database, China Industrial Enterprise Pollution Database and China Customs Import and Export Database for 2005–2013, DID estimations show that for every 1-unit reduction in export tax rebate rate, soot emission intensity of industrial export enterprises decreases by 2.63%. The reduction in soot generation, the reduction in coal use intensity, the increase in total amount and efficiency of soot treatment are four important channels through which the export tax rebate rate affects the emission behavior of enterprises.
The policy implication of this study is that reducing export tax rebate rates for export products, especially for high pollution, high energy-consuming and resource-based industries, is a favorable policy option to improve China’s environmental performance in international trade. This study may provide a reference for other developing countries that also rely on export tax rebates to adjust their policies to combine economic growth with pollution control.
Data availability statement
Publicly available datasets were analyzed in this study. This data can be found here: The original contributions presented in the study are included in the article/Supplementary Material; further inquiries can be directed to the corresponding author.
Author contributions
Conceptualization, YZ; Methodology, QT and AH; Software, QT, AH, and YZ; Validation, QT, YZ, and YM; Formal analysis, QT and AH; Writing—original draft preparation, QT, AH, and YZ; Writing—review and editing, QT, AH, and YZ; Visualization, QT, YZ, and YM; Supervision, YZ; Project administration, YZ and YM; Funding acquisition, YZ.
Funding
This research was funded by the Science and Technology Project of Beijing Electricity Trading Center, Research on the Synergistic Mechanism of Electricity Market and Green Finance to Serve the Goal of “Double Carbon” (Project No. SGDJ0000YJJS2200029).
Conflict of interest
YM was empolyed by the Offshore Oil Engineering Co., Ltd.
The remaining authors declare that the research was conducted in the absence of any commercial or financial relationships that could be construed as a potential conflict of interest.
Publisher’s note
All claims expressed in this article are solely those of the authors and do not necessarily represent those of their affiliated organizations, or those of the publisher, the editors and the reviewers. Any product that may be evaluated in this article, or claim that may be made by its manufacturer, is not guaranteed or endorsed by the publisher.
References
Acharyya, J. (2009). Fdi, growth and the environment: Evidence from India on co2 emission during the last two decades. J. Econ. Dev. 34, 43–58. doi:10.35866/caujed.2009.34.1.003
Ahmed, F. Z., Greenleaf, A., and Sacks, A. (2014). The paradox of export growth in areas of weak governance: The case of the ready made garment sector in Bangladesh. World Dev. 56, 258–271. doi:10.1016/j.worlddev.2013.11.001
An, L., Hu, C., and Tan, Y. (2017). Regional effects of export tax rebate on exporting firms: Evidence from China. Rev. Int. Econ. 25, 774–798. doi:10.1111/roie.12284
Antweiler, W., Copeland, B. R., and Taylor, M. S. (2001). Is free trade good for the environment. Am. Econ. Rev. 4, 877–908. doi:10.1257/aer.91.4.877
Asghari, M. (2013). Does fdi promote mena region’s environment quality? Pollution halo or pollution haven hypothesis. Int. J. Sci. Res. Environ. Sci. 6, 92–100. doi:10.12983/ijsres-2013-p092-100
Awosusi, A. A., Xulu, N. G., Ahmadi, M., Rjoub, H., Altuntaş, M., Uhunamure, S. E., et al. (2022). The sustainable environment in Uruguay: The roles of financial development, natural resources, and trade globalization. Front. Environ. Sci. 10, 875577. doi:10.3389/fenvs.2022.875577
Ayob, A. H., and Freixanet, J. (2014). Insights into public export promotion programs in an emerging economy: The case of malaysian smes. Eval. Program Plann 46, 38–46. doi:10.1016/j.evalprogplan.2014.05.005
Bao, Q., Hou, J., Li, K., and Wang, X. (2017). The impact of tax rebates on export performance: China's textile exports to the USA. Asia Pac Econ. Lit. 31, 79–89. doi:10.1111/apel.12175
Baron, R. M., and Kenny, D. A. (1986). The moderator-mediator variable distinction in social psychological research: Conceptual, strategic, and statistical considerations. J. Pers. Soc. Psychol. 51, 1173–1182. doi:10.1037//0022-3514.51.6.1173
Bokpin, G. A. (2017). Foreign direct investment and environmental sustainability in Africa: The role of institutions and governance. Res. Int. Bus. Finance 39, 239–247. doi:10.1016/j.ribaf.2016.07.038
Borozan, D. (2019). Unveiling the heterogeneous effect of energy taxes and income on residential energy consumption. Energy Policy 129, 13–22. doi:10.1016/j.enpol.2019.01.069
Bouvet, F., Ma, A. C., and Van Assche, A. (2017). Tariff and exchange rate pass-through for Chinese exports: A firm-level analysis across customs regimes. China Econ. Rev. 46, 87–96. doi:10.1016/j.chieco.2017.08.013
Braakmann, N., Gao, B., and Maioli, S. (2020). Vat rebates as trade policy: Evidence from China. China Econ. Rev. 63, 101536. doi:10.1016/j.chieco.2020.101536
Brandt, L., Van Biesebroeck, J., and Zhang, Y. (2012). Creative accounting or creative destruction? Firm-level productivity growth in Chinese manufacturing. J. Dev. Econ. 97, 339–351. doi:10.1016/j.jdeveco.2011.02.002
Bu, M., Li, S., and Jiang, L. (2019). Foreign direct investment and energy intensity in China: Firm-level evidence. Energy Econ. 80, 366–376. doi:10.1016/j.eneco.2019.01.003
Cai, X., Lu, Y., Wu, M., and Yu, L. (2016). Does environmental regulation drive away inbound foreign direct investment? Evidence from a quasi-natural experiment in China. J. Dev. Econ. 123, 73–85. doi:10.1016/j.jdeveco.2016.08.003
Chandra, P., and Long, C. (2013). Vat rebates and export performance in China: Firm-level evidence. J. Public Econ. 102, 13–22. doi:10.1016/j.jpubeco.2013.03.005
Chao, C., Chou, W. L., and Yu, E. S. H. (2001). Export duty rebates and export performance: Theory and China's experience. J. Comp. Econ. 29, 314–326. doi:10.1006/jcec.2001.1713
Chen, C., Mai, C., and Yu, H. (2006). The effect of export tax rebates on export performance: Theory and evidence from China. China Econ. Rev. 17, 226–235. doi:10.1016/j.chieco.2005.06.001
Chen, D. (2020). Falling trade barriers and improving environmental pollution - new evidence from Chinese corporate pollution data. Econ. Res. J. 55, 98–114. (in Chinese).
Chong'En, B., Xin, W., and Xiaohan, Z. (2011). An empirical analysis of the impact of export tax rebate policy adjustment on China's exports. China Econ. Q. 10, 799–819.
Chung, S. (2014). Environmental regulation and foreign direct investment: Evidence from South Korea. J. Dev. Econ. 108, 222–236. doi:10.1016/j.jdeveco.2014.01.003
Convery, F., McDonnell, S., and Ferreira, S. (2007). The most popular tax in Europe? Lessons from the Irish plastic bags levy. Environ. Resour. Econ. 38, 1–11. doi:10.1007/s10640-006-9059-2
Eisenbarth, S. (2017). Is Chinese trade policy motivated by environmental concerns? J. Environ. Econ. Manage 82, 74–103. doi:10.1016/j.jeem.2016.10.001
Eskeland, G. S., and Harrison, A. E. (2003). Moving to greener pastures? Multinationals and the pollution haven hypothesis. J. Dev. Econ. 70, 1–23. doi:10.1016/S0304-3878(02)00084-6
Fan, J., Liang, Q., Wang, Q., Zhang, X., and Wei, Y. (2015). Will export rebate policy be effective for co2 emissions reduction in China? A ceepa-based analysis. J. Clean. Prod. 103, 120–129. doi:10.1016/j.jclepro.2014.03.020
He, P., Ning, J., Yu, Z., Xiong, H., Shen, H., and Jin, H. (2019). Can environmental tax policy really help to reduce pollutant emissions? An empirical study of a panel ardl model based on oecd countries and China. Sustainability 11, 4384. doi:10.3390/su11164384
Heerma Van Voss, B., and Rafaty, R. (2022). Sensitive intervention points in China's coal phaseout. Energy Policy 163, 112797. doi:10.1016/j.enpol.2022.112797
Hu, C., and Tan, Y. (2016). Export spillovers and export performance in China. China Econ. Rev. 41, 75–89. doi:10.1016/j.chieco.2016.08.008
Jiang, Y., and Chen, A. (2020). Does China's export tax rebate policy have a positive impact on environmental protection? China Popul. Resour. Environ. 30, 100–106. doi:10.12062/cpre.20200102
Kong, Q., Peng, D., Ni, Y., Jiang, X., and Wang, Z. (2021). Trade openness and economic growth quality of China: Empirical analysis using ardl model. Financ. Res. Lett. 38, 101488. doi:10.1016/j.frl.2020.101488
Lee, W., Ma, H., and Xu, Y. (2021). Export tax rebate and the margins of exports: Product-level evidence from a quasi-natural experiment. Int. Tax. Public Financ. 28, 386–404. doi:10.1007/s10797-020-09633-2
Li, J., and Li, S. (2022). Environmental protection tax, corporate esg performance, and green technological innovation. Front. Environ. Sci. 10, 982132. doi:10.3389/fenvs.2022.982132
Li, J., and Liu, Y. (2015). An empirical study on the pollution abatement effect of environmental taxes and fees in China. China Popul. Resour. Environ. 25, 84–91. doi:10.3969/j.issn.1002-2104.2015.08.011
Li, Y., Cen, H., Lin, T., Lin, Y., and Chiu, Y. (2022). Sustainable coal mine and coal land development in China. Resour. Policy 79, 103092. doi:10.1016/j.resourpol.2022.103092
Lin, B., and Li, X. (2011). The effect of carbon tax on per capita co2 emissions. Energy Policy 39, 5137–5146. doi:10.1016/j.enpol.2011.05.050
Liu, X., and Ge, W. (2018). Who benefits from the export tax rebate policy? Evidence from the Chinese fishery sector. Stud. Agric. Econ. 120, 97–104. doi:10.7896/j.1806
Long, F., Liu, J., and Zheng, L. (2022). The effects of public environmental concern on urban-rural environmental inequality: Evidence from Chinese industrial enterprises. Sustain Cities Soc. 80, 103787. doi:10.1016/j.scs.2022.103787
Mah, J. S. (2007). The effect of duty drawback on export promotion: The case of Korea. J. Asian Econ. 18, 967–973. doi:10.1016/j.asieco.2007.08.001
Mai, J., and Stoyanov, A. (2015). The effect of the Canada-us free trade agreement on canadian multilateral trade liberalization. Can. J. Econ. 48, 1067–1098. doi:10.1111/caje.12168
Mengshu, S., Yuansheng, H., Xiaofeng, X., and Dunnan, L. (2021). China's coal consumption forecasting using adaptive differential evolution algorithm and support vector machine. Resour. Policy 74, 102287. doi:10.1016/j.resourpol.2021.102287
Nguyen, X. D. (2014). Effects of Japan's economic partnership agreements on the extensive margin of international trade. Int. trade J. 28, 169–191. doi:10.1080/08853908.2013.863170
Peters, G. P., and Hertwich, E. G. (2008). Co2 embodied in international trade with implications for global climate policy. Environ. Sci. Technol. 42, 1401–1407. doi:10.1021/es072023k
Peters, G. P., Weber, C. L., Guan, D., and Hubacek, K. (2007). China's growing co2 emissions-a race between increasing consumption and efficiency gains. Environ. Sci. Technol. 41, 5939–5944. doi:10.1021/es070108f
Piciu, G. C., and Trică, C. L. (2012). Assessing the impact and effectiveness of environmental taxes. Procedia Econ. Finance 3, 728–733. doi:10.1016/S2212-5671(12)00221-3
Singhania, M., and Saini, N. (2021). Demystifying pollution haven hypothesis: Role of fdi. J. Bus. Res. 123, 516–528. doi:10.1016/j.jbusres.2020.10.007
Song, P., Mao, X., and Corsetti, G. (2015). Adjusting export tax rebates to reduce the environmental impacts of trade: Lessons from China. J. Environ. Manage 161, 408–416. doi:10.1016/j.jenvman.2015.07.029
Sterner, T. (2007). Fuel taxes: An important instrument for climate policy. Energy Policy 35, 3194–3202. doi:10.1016/j.enpol.2006.10.025
Sun, Y., Mao, X., Liu, G., Yin, X., and Zhao, Y. (2020). Modelling the effects of energy taxes on ecological footprint transfers in China's foreign trade. Ecol. Modell. 431, 109200. doi:10.1016/j.ecolmodel.2020.109200
Tachie, A. K., Xingle, L., Dauda, L., Mensah, C. N., Appiah-Twum, F., and Adjei Mensah, I. (2020). The influence of trade openness on environmental pollution in eu-18 countries. Environ. Sci. Pollut. Res. Int. 27, 35535–35555. doi:10.1007/s11356-020-09718-9
Tsai, P. L. (1999). Is trade liberalization harmful to the environment? An alternative view. J. Econ. Stud. 3, 201–209. doi:10.1108/01443589910284381
Wang, C., Chen, P., Hao, Y., and Dagestani, A. A. (2022). Tax incentives and green innovation—The mediating role of financing constraints and the moderating role of subsidies. Front. Environ. Sci. 10, 1067534. doi:10.3389/fenvs.2022.1067534
Wang, D., Wang, Y., Song, X., and Liu, Y. (2018). Coal overcapacity in China: Multiscale analysis and prediction. Energy Econ. 70, 244–257. doi:10.1016/j.eneco.2018.01.004
Wang, H., and Wei, W. (2020). Coordinating technological progress and environmental regulation in co2 mitigation: The optimal levels for oecd countries and emerging economies. Energy Econ. 87, 104510. doi:10.1016/j.eneco.2019.104510
Wang, P., and Liang, S. (2022). Environmental regulations and energy efficiency: The mediating role of climate change and technological innovation. Front. Environ. Sci. 10, 909082. doi:10.3389/fenvs.2022.909082
Wang, Z., Zhu, N., Wang, J., Hu, Y., and Nkana, M. (2022). The impact of environmental taxes on economic benefits and technology innovation input of heavily polluting industries in China. Front. Environ. Sci. 10, 959939. doi:10.3389/fenvs.2022.959939
Weber, C. L., Peters, G. P., Guan, D., and Hubacek, K. (2008). The contribution of Chinese exports to climate change. Energy Policy 36, 3572–3577. doi:10.1016/j.enpol.2008.06.009
Wissema, W., and Dellink, R. (2007). Age analysis of the impact of a carbon energy tax on the Irish economy. Ecol. Econ. 61, 671–683. doi:10.1016/j.ecolecon.2006.07.034
Wolde-Rufael, Y., and Mulat-Weldemeskel, E. (2021). Do environmental taxes and environmental stringency policies reduce co2 emissions? Evidence from 7 emerging economies. Environ. Sci. Pollut. Res. Int. 28, 22392–22408. doi:10.1007/s11356-020-11475-8
Xu, J., Li, J., and Liu, C. (2022). How does foreign trade affect green total factor energy efficiency? Evidence from China. Front. Environ. Sci. 10. doi:10.3389/fenvs.2022.979177
Xu, Z. (2018). China's exports, export tax rebates and exchange rate policy. World Econ. 41, 1288–1308. doi:10.1111/twec.12570
Yu, C., and Luo, Z. (2018). What are China's real gains within global value chains? Measuring domestic value added in China's exports of manufactures. China Econ. Rev. 47, 263–273. doi:10.1016/j.chieco.2017.08.010
Zhang, B., Chen, X., and Guo, H. (2018). Does central supervision enhance local environmental enforcement? Quasi-experimental evidence from China. J. Public Econ. 164, 70–90. doi:10.1016/j.jpubeco.2018.05.009
Zhang, D. (2019). Can export tax rebate alleviate financial constraint to increase firm productivity? Evidence from China. Int. Rev. Econ. Financ. 64, 529–540. doi:10.1016/j.iref.2019.09.005
Zhang, T., Xu, S., and Zhang, S. (2022). Are export tax rebates patronage for Chinese firms? An analysis of productivity. China Econ. Rev. 75, 101844. doi:10.1016/j.chieco.2022.101844
Zhang, Y. (2012). Scale, technique and composition effects in trade-related carbon emissions in China. Environ. Resour. Econ. 51, 371–389. doi:10.1007/s10640-011-9503-9
Keywords: export tax rebate, China, soot emissions, industrial exporters, DID method
Citation: Tian Q, Hu A, Zhang Y and Meng Y (2023) The impact of export tax rebate reform on industrial exporters’ soot emissions: Evidence from China. Front. Environ. Sci. 10:1101102. doi: 10.3389/fenvs.2022.1101102
Received: 17 November 2022; Accepted: 30 December 2022;
Published: 12 January 2023.
Edited by:
Ghassan H. Mardini, Qatar University, QatarReviewed by:
Yunjie Wei, Academy of Mathematics and Systems Science (CAS), ChinaYuanchun Zhou, Nanjing University of Finance and Economics, China
Copyright © 2023 Tian, Hu, Zhang and Meng. This is an open-access article distributed under the terms of the Creative Commons Attribution License (CC BY). The use, distribution or reproduction in other forums is permitted, provided the original author(s) and the copyright owner(s) are credited and that the original publication in this journal is cited, in accordance with accepted academic practice. No use, distribution or reproduction is permitted which does not comply with these terms.
*Correspondence: Yuexing Zhang, emhhbmd5eEBwYmNzZi50c2luZ2h1YS5lZHUuY24=