 Weiqi Yang1*
 Ting Zeng
- 1Department of Civil Engineering, Sichuan College of Architectural Technology, Deyang, China
- 2School of Economic and Management, Dalian Ocean University, Dalian, China
- 3Science and Technology for Development Research Center of Sichuan Province, Chengdu, China
Construction, tunneling, and other urban anthropogenic activities strain neighboring buildings through distortion and rotation on both the surface and underground, resulting in instability of the local geological structure. This may cause devastating structural damage to buildings. Therefore, quantitative assessment of building structural damage is essential for the safety of local communities. In this study, a novel data-driven approach was applied to assess the building damage risks in urban areas. Data collected from over 50 buildings adjacent to the construction site were analyzed. The extreme learning machine (ELM) algorithm was applied to predict building structural risks. A modified Lanczos algorithm was used to regularize the ELM and improve the overall prediction performance. The computational results demonstrate the robustness and efficiency of the proposed Lanczos algorithm-regularized ELM.
Introduction
Intensive urbanization in China has resulted in rapid and widespread infrastructure construction in megacities. Overconstruction, tunneling, and other activities distort the ground surface and cause irreversible damage to the ground structure (Zhou et al., 2021). Consequently, adjacent buildings are at risk of structural damage. Accurate evaluation of building structural damage risk is essential for preventing devastating risks. In addition, it is beneficial to mitigate risk in advance (Feng et al., 2021a; Feng et al., 2021b).
Traditional building structural risk assessment approaches correlate the extent of the damage with ground movements using empirical, semiempirical, and numerical methods. Most empirical studies, such as Skempton and MacDonald (1956), often limit the cause of damage to settlements arising from the weight of the structure, ignoring the fact that deformation could be a consequence of neighborhood excavation (Charles and Skinner, 2004). As an advanced improvement approach, semi-analytical methods have attracted considerable attention and have been widely applied in engineering practices. Burland and Wroth (1974) applied the idea of a critical tensile strain to the initial visible cracking of a simple beam for building damage evaluation. Boscardin and Cording (1989) developed a building damage criterion based on the critical strain for a given damage level, which was determined from the combined effect of the lateral strain induced by lateral ground displacements and angular distortion of the structure. Finno et al. (2005) used the deflection ratio as an evaluation criterion with a laminate beam model for building damage risk assessment. Similar studies also utilized Timoshenko’s first-order shear deformation theory for building damage evaluation, which assumes that the degree of damage is positively correlated with the relative density of soil (Netzel, 2009). However, both empirical and semi-analytical studies have failed to consider building stiffness on the ground movements.
To overcome these limitations, numerical analysis, which considers the interactions between building stiffness and soil, has attracted significant attention (Tang et al., 2021). Potts and Addenbrooke (1997) utilized a 2D finite element model to study the influence of a surface structure on ground movement due to tunneling. Son and Cording (2005) investigated building damage due to excavation-induced ground movement using a damage criterion based on the average state of strain in the distorting portion of the underlying building structure. Dimmock and Mair (2008) used stiffness values to present the upper and lower envelopes for a numerical analysis of the building structural distortion. The computational results demonstrate the effectiveness of the proposed approaches. In addition, case studies analyzing landslide–tunnel interactions have been extensively studied (Vassallo et al., 2016; Li et al., 2018; Vassallo et al., 2019). A preliminary structural analysis was performed using 2D FEM non-linear models of tunnel cross sections by simulating tunnel shear strength values.
Recent advances in machine learning and information technology have created unprecedented opportunities to study building structural damage risks from a data-driven perspective. Machine learning-based regression and classification algorithms have achieved promising results in various engineering domains such as mechanical engineering (He et al., 2017; Sun et al., 2017; Dekhtiar et al., 2018; Ouyang et al., 2019), civil engineering (Afzaal et al., 2020; Li et al., 2021a), natural hazards (Xu et al., 2019; Cui et al., 2021), renewable energy (He and Kusiak, 2017; Ouyang et al., 2017; Liu et al., 2020; Ouyang et al., 2020), computer vision (Pereira et al., 2016; Havaei et al., 2017; Li et al., 2022), and others (Wei and Yang, 2018; Li et al., 2020; Li et al., 2021b). According to the literature review, in building risk analytics, Kim et al. (2001) introduced artificial neural networks (ANNs) to predict ground surface settlement induced by tunneling. Boubou et al. (2010) applied least-squares regression and ANN to correlate ground surface settlements and tunneling operation parameters in a case study. Adoko and Wu (2012) proposed an approach to predict building structural damage using neural networks. Tunnel convergence and velocity were collected as inputs in the neural net models. Recently, Mishra et al. (2021) applied an ANN to predict the deflection behavior of various types of beams and achieved promising results. Machine learning algorithms have been demonstrated to be effective at predicting the compressive strength of masonry.
This study explored data-driven risk assessment of building structural damage in urban areas due to ground excavation activities such as tunneling using feature selection and a comprehensive comparison of data-driven methods. A handful of features collected from the on-site investigation were used. Two feature selection approaches, the wrapper and filter methods, were applied to screen predictive features, which were used as inputs in the data-driven classifier. To comprehensively compare the prediction performance of the algorithms tested, four state-of-the-art machine learning algorithms were applied and compared. For a fair comparison, the same feature set selected by the wrapper/filter was used for all the algorithms, and their hyperparameters were well tuned via grid-based search. An extensive computational experiment was conducted to evaluate the classification performance of the algorithms and identify the best performing model.
Methodology
Problem Definition
Tunneling and other types of underground excavation cause ground movements, exposing building structures to potential damage (Feng et al., 2022). In this study, monitoring data from the buildings adjacent to an urban excavation site were analyzed for a comprehensive risk assessment of the buildings. The data were collected from 50 buildings.
Figure 1 shows the horizontal view of the mechanism of building structural damage caused by ground excavation activities in the unground geological structure. Tunneling activity in urban areas causes ground movements, which represent a major factor in building damage (Tang et al., 2020). Many design approaches for evaluating damage to building structures adjacent to excavation sites are based on greenfield displacement input. The greenfield shape function, which follows Gaussian distribution, is usually applied to compute the transverse ground surface and is presented in Eq. (1):
where
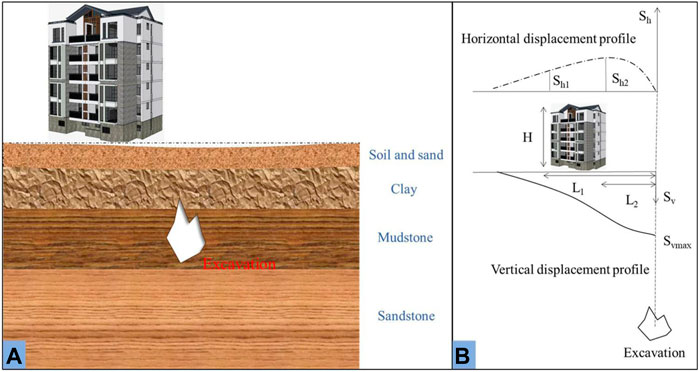
FIGURE 1. Horizontal view of building damage mechanism.
In addition to the ground features associated with the excavation site, building parameters, including the building height and width, were also taken into account in this study. According to the domain expertise of the field engineers, two labels were assigned, providing a comprehensive overview of the structural risk caused by the settlement (low risk/moderate risk) and treated as the target output. This predictive framework may be formulated as a binary classification problem.
Feature Selection Methods
The wrapper method is a feature selection algorithm that uses induction learning as the evaluation function to select the most important features. Intuitively, a wrapper algorithm searches the space of all possible feature combinations and evaluates each subset by building a regressor/classifier. The one with the best prediction performance is selected by comparing the predictive performance of each subset. In most scenarios, the wrapper method has a high computational cost (Kusiak et al., 2011). Three widely used solutions, namely, genetic search, greedy search, and linear forward search, were considered in this study. A schematic of the wrapper method is intuitively illustrated in Figure 2A. The first step of the wrapper algorithm is to select a subset of features from the dataset and build a classification model to test the prediction power. Next, another randomly selected feature subset is created from the dataset and another classification model is built. After several repeated feature subsamplings, the well-performing classification experiments can add votes to the most predictive features, and the total number of votes indicates the overall predictive power of the underlying feature.
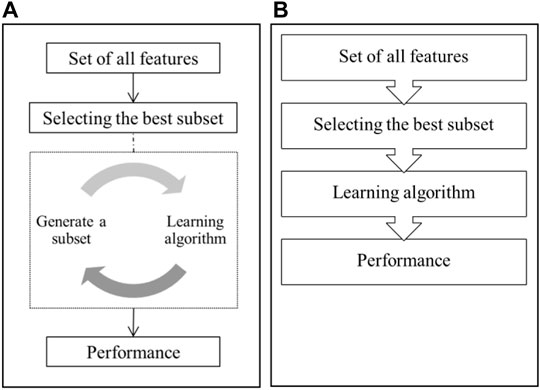
FIGURE 2. Schematic of wrapper (A) and filter algorithms (B).
A single wrapper algorithm may select features with biases in certain aspects. The voting-based wrapper algorithm can be more robust in selecting the most appropriate feature subset. In this study, we selected three different wrapper search methods with 10-fold cross-validation. For each wrapper evaluation, the number of candidate features selected within the 10-fold cross-validation experiments was added. Next, the summed results for the three search methods were aggregated to determine the importance of each feature by counting the total number of times it was selected.
By comparison, the filter method is a more effective approach for evaluating the importance of features (see Figure 2B). It uses heuristic-based characteristics (e.g., correlation) of the data. A correlation-based feature selection filter is faster and more effective than a voting-based method as it selects a feature if it correlates with the decision outcome but not with any other feature that has already been selected. Thus, it avoids multicollinearity, which is often observed in multivariate regression/classification tasks.
Extreme Learning Machine
The ELM algorithm is a specific type of single-hidden layer feedforward neural network (SHLFN) with higher robustness and computational efficiency. It has a single hidden layer feedforward network (SHFFN) structure (Huang et al., 2006). A schematic of the ELM algorithm is illustrated in Figure 3.
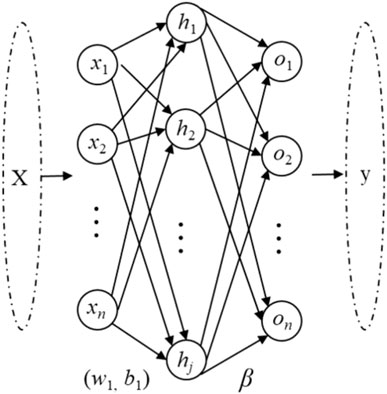
FIGURE 3. Schematic of extreme learning machine algorithm.
The basic ELM consists of three key components: the input, hidden, and output layers. For a given training dataset (xi, ti) and a total of L hidden nodes, the ELM can be expressed as Eq. 2:
where xi is the input feature vector,
where y represents the actual target output, and
where
Modified Lanczos Algorithm
The modified Lanczos algorithm was selected to optimize the computation process to solve the linear system in ELM. The Lanczos algorithm was originally proposed by Parlett (1980) to compute the eigenvalue and eigenvector problems. It can also be used to accelerate the solution of symmetric systems using linear equations (Hu et al., 2020).
In a given symmetric linear system expressed as
Here, the Lanczos algorithm is proposed by performing several iterations to approximate the true
where
To incorporate the Lanczos algorithm in the ELM, we can replace the expensive computation of
Measurement Matrices
In a binary classification task, the confusion matrix is usually the first step in comparing the predictive performance of different algorithms. A confusion matrix consists of four events: true positive (TP), true negative (TN), false positive (FP), and false negative (FN).
Applying these four numbers, we can compute three evaluation metrics, namely, accuracy (8), precision (9), and recall (10), for the quantitative evaluation of the predictive performance as follows:
where Num () represents the total number of events in the confusion matrix.
Nevertheless, simple accuracy-related measures are not sufficient for assessing classifiers when data are affected by additional complexity factors, such as imbalance. To overcome this issue, receiver operating characteristic (ROC) serves as a fundamental tool for evaluating the performance of a binary classifier in many research domains. It compares the two operating characteristics (TP rate and FP rate) as the cutoff threshold changes. As a common solution, the area under the ROC curve (AUC), which summarizes the relationship between the TP and FP rates of a binary classifier, was used in this study. Intuitively, the AUC measures the sensitivity of a binary classifier with respect to different decision thresholds, and the implementation details can be found in Bradley (1997).
On-Site Investigation
In this study, an urban area in Shanxi Province, China, with extensive underground excavation activities was selected for the case study. The study area is located in the provincial capital of Taiyuan city, where the underground structure consists of clay, mudstone, and sandstone, as illustrated in Figure 1. Recent tunneling activities for subway construction have escalated the risk of ground subsidence in buildings located in adjacent communities.
The study was conducted in collaboration with the Shanxi Provincial Geological Prospecting Bureau, and civil engineers from the Bureau conducted on-site data collection, including the measurement of related geological features. Data from 50 buildings adjacent to the excavation site were collected over 3 years. The civil engineers had domain expertise, and a risk level (low/moderate risk) was assigned as a ground truth label for each building. The majority of the buildings were old-framed residential and commercial buildings, and many were founded on reinforced concrete rafts. Figure 4 shows photographs of some of the buildings, and hair cracks are visible in many of them.
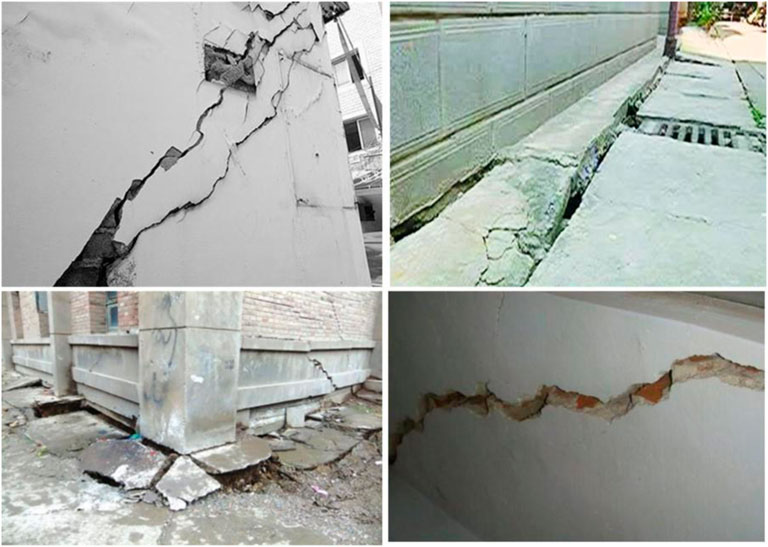
FIGURE 4. Structural damages in some of the buildings selected for the case study area.
Both geological and building features were considered for constructing the classification models. As indicated in the Problem Definition Section, the geological features that represent the impact from the excavation activities include the axial stiffness ratio, bending stiffness ratio, maximum settlement, inflection point, and eccentricity. The building features include the building height, building width, building length, and building stiffness ratio. The basic statistics for these features are summarized in Table 1.
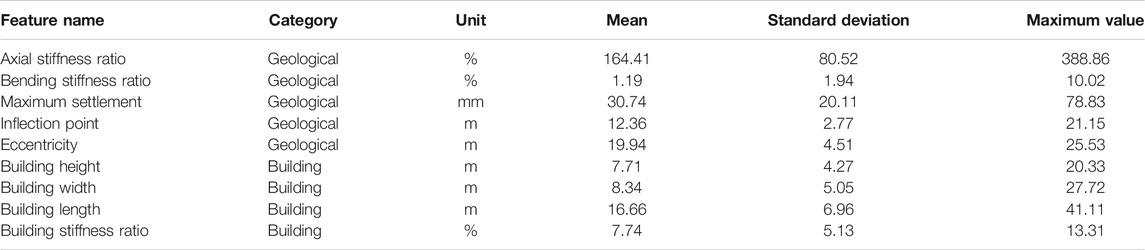
TABLE 1. Description of geological and building features.
In addition to the data features listed in Table 1, the civil engineers provided a comprehensive evaluation of building structural risk. Based on these evaluation documents, the buildings were classified into two groups: low risk and high risk. Hence, this can be converted into a binary classification task for constructing the predictive models.
Experimental Results
Feature Analysis
Feature selection is a critical step in avoiding over-parametrization in predictive modeling by using all the features to construct the mapping between the input and output. Based on the domain knowledge, nine features obtained by the engineering geologists during on-site investigations were taken into consideration. The voting-based wrapper algorithm and filter algorithm were used to select the predictive features.
The voting-based wrapper algorithm uses 10-fold cross-validation to generate the feature subset that contains the predictive features. The most predictive feature has the highest votes as it is more frequently selected in each experiment. On the contrary, less predictive features have a lower chance of being selected in each experiment and thus result in fewer votes. A summary of the results from the voting-based wrapper algorithm is shown in Figure 5A. The bending stiffness ratio and building width have the highest number of votes (10 votes), demonstrating their high predictive capacity. The eccentricity has only 5 votes, indicating that it may not be strongly predictive of the building damage outcome. A cutoff threshold of seven votes was selected based on a literature review, and a total of five features were chosen to construct the predictive models in the next section.
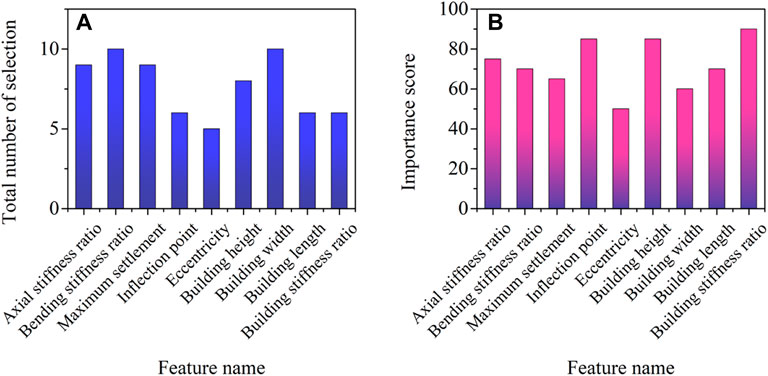
FIGURE 5. Feature selection from voting-based wrapper algorithm (A) and filter algorithm (B).
The filter feature selection algorithm provides scores for each candidate feature based on its correlation with the output. In comparison with the wrapper algorithm, which uses feature subsets, filter selection focuses more on each feature. The scores generated for each candidate feature in this study are shown in Figure 5B. The inflection point, building height, and building stiffness ratio have the most significant correlations with building damage. Upon applying a cutoff threshold of 70, the axial stiffness ratio, bending stiffness ratio, inflection point, building height, building length, and building stiffness ratio were selected as the predictive features for the modeling experiments described in the next section.
Cross-Validation
Three case studies were examined using all features, features selected by the voting-based wrapper, and the filter algorithm. As a binary classification task is performed, confusion matrices were constructed to evaluate the prediction performance of all the algorithms tested.
The predictive performance of the algorithms tested using all features is summarized in Scenario I in Table 2. Four measurement metrics, including accuracy, precision, recall, and AUC, were computed. The receiver operating characteristic (ROC) curves of each tested algorithm are illustrated in Scenario I of Figure 6. According to the computational results, the Lanczos-ELM has the best performance, with an accuracy of 0.75 and an AUC of 0.77 via 10-fold cross-validation.
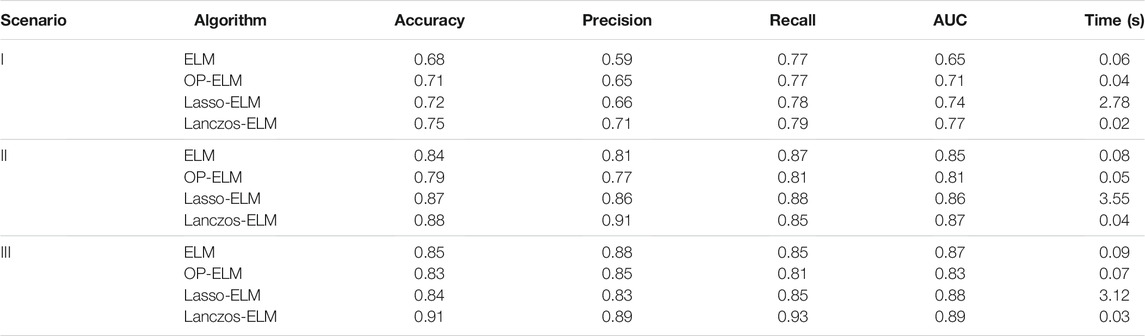
TABLE 2. Predictive performance of building structural damage risk classification algorithms.
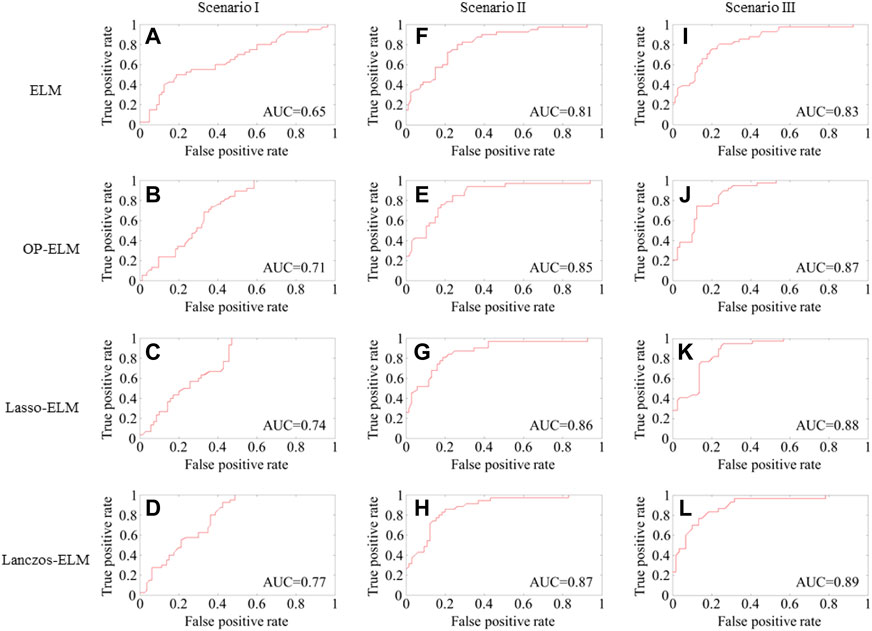
FIGURE 6. Predictive performance of building structural-damage risk classification algorithms.
The predictive performance of all algorithms using the voting-based wrapper-selected features is summarized in Scenario II of Table 2. It can be observed that all algorithms show significant improvement over classical classification algorithms according to the measurement metrics. The Lanczos-ELM classifier has the best performance in classifying building structural damage risks among all the algorithms tested. It achieves an accuracy of 0.88 and an AUC of 0.87 according to the 10-fold cross-validation. The ROC curves of all algorithms are presented in Scenario II of Figure 6.
The predictive performance for all algorithms using the filter selected features is summarized in Scenario III of Table 2. The Lanczos-ELM classifier still outperforms all the algorithms tested, which demonstrates its superiority in binary classification tasks. It achieves an accuracy of 0.91 and an AUC of 0.89 according to the 10-fold cross-validation. The ROC curves of all algorithms are presented in Scenario III of Figure 6.
In summary, the feature selection algorithms offered improved performance over classical classification algorithms for predictive modeling algorithms. The comparative analysis showed that the filter selection algorithm selects the most predictive feature subset, which improves the prediction performance over classical classification algorithms most significantly.
Conclusion
In this study, two core aspects of building structural damage risk assessment were investigated: the selection of relevant features and the comparison of data-driven algorithms. To determine the best feature set and use features in an effective manner, two feature selection approaches, the wrapper method and the filter method, were comparatively assessed. To select the best data-driven algorithm, the ELM, OP-ELM, Lasso-ELM, and Lanczos-ELM were considered as candidate algorithms and their performances compared.
In the computational experiments, the Lanczos-ELM algorithm provided the most accurate prediction performance in all scenarios. The computational results demonstrated that the Lanczos-ELM classifier with the filter’s feature selection method had the best classification performance across all combinations of feature selection and algorithms tested. In summary, this comparative study offers interesting insights into the risk assessment of building structural damage for geologists and engineers during the evaluation process. In the future, we will focus on developing highly interpretable machine learning pipelines to perform the risk classification and offer interpretable results to the field engineers.
Data Availability Statement
The original contributions presented in the study are included in the article/Supplementary Material, further inquiries can be directed to the corresponding authors.
Author Contributions
WY contributed to the study methodology and wrote the original draft. LW contributed to the study’s data curation. YF contributed to the data analysis and investigation. TZ contributed to conceptualizing the study and writing original draft. All authors have read and agreed to the published version of the manuscript.
Conflict of Interest
The authors declare that the research was conducted in the absence of any commercial or financial relationships that could be construed as a potential conflict of interest.
Publisher’s Note
All claims expressed in this article are solely those of the authors and do not necessarily represent those of their affiliated organizations, or those of the publisher, the editors, and the reviewers. Any product that may be evaluated in this article, or claim that may be made by its manufacturer, is not guaranteed or endorsed by the publisher.
References
Adoko, A. C., and Wu, L. (2012). Estimation of Convergence of a High-Speed Railway Tunnel in Weak Rocks Using an Adaptive Neuro-Fuzzy Inference System (ANFIS) Approach. J. Rock Mech. Geotechnical Eng. 4 (1), 11–18. doi:10.3724/sp.j.1235.2012.00011
Afzaal, H., Farooque, A. A., Abbas, F., Acharya, B., and Esau, T. (2020). Groundwater Estimation from Major Physical Hydrology Components Using Artificial Neural Networks and Deep Learning. Water 12 (1), 5. doi:10.3390/w12010005
Boscardin, M. D., and Cording, E. J. (1989). Building Response to Excavation‐Induced Settlement. J. Geotech. Engrg. 115 (1), 1–21. doi:10.1061/(asce)0733-9410(1989)115:1(1)
Boubou, R., Emeriault, F., and Kastner, R. (2010). Artificial Neural Network Application for the Prediction of Ground Surface Movements Induced by Shield Tunnelling. Can. Geotech. J. 47 (11), 1214–1233. doi:10.1139/t10-023
Bradley, A. P. (1997). The Use of the Area under the ROC Curve in the Evaluation of Machine Learning Algorithms. Pattern recognition 30 (7), 1145–1159. doi:10.1016/s0031-3203(96)00142-2
Burland, J., and Wroth, C. (1974). “Settlement of Buildings and Associated Damage,” in SOA Review, Conf. Settlement of structures, Cambridge, April 1974, 651–654.
Charles, J. A., and Skinner, H. D. (2004). Settlement and Tilt of Low-Rise Buildings. Proc. Inst. Civil Eng. - Geotechnical Eng. 157 (2), 65–75. doi:10.1680/geng.2004.157.2.65
Cui, S., Pei, X., Jiang, Y., Wang, G., Fan, X., Yang, Q., et al. (2021). Liquefaction within a Bedding Fault: Understanding the Initiation and Movement of the Daguangbao Landslide Triggered by the 2008 Wenchuan Earthquake (Ms = 8.0). Eng. Geology. 295, 106455. doi:10.1016/j.enggeo.2021.106455
Dekhtiar, J., Durupt, A., Bricogne, M., Eynard, B., Rowson, H., and Kiritsis, D. (2018). Deep Learning for Big Data Applications in CAD and PLM - Research Review, Opportunities and Case Study. Comput. Industry 100, 227–243. doi:10.1016/j.compind.2018.04.005
Dimmock, P. S., and Mair, R. J. (2008). Effect of Building Stiffness on Tunnelling-Induced Ground Movement. Tunnelling Underground Space Technol. 23 (4), 438–450. doi:10.1016/j.tust.2007.08.001
Feng, P., Dai, F., Shuai, K., and Wei, M. (2022). Dynamic Mechanical Behaviors of Pre-fractured sandstone with Noncoplanar and Unparallel Flaws. Mech. Mater. 166 (6), 104219. doi:10.1016/j.mechmat.2022.104219
Feng, P., Xu, Y., and Dai, F. (2021b). Effects of Dynamic Strain Rate on the Energy Dissipation and Fragment Characteristics of Cross-Fissured Rocks. Int. J. Rock Mech. Mining Sci. 138, 104600. doi:10.1016/j.ijrmms.2020.104600
Feng, P., Zhao, J., Dai, F., Wei, M., and Liu, B. (2021a). Mechanical Behaviors of Conjugate-Flawed Rocks Subjected to Coupled Static-Dynamic Compression. Acta Geotech., 1–20. doi:10.1007/s11440-021-01322-6
Finno, R. J., Voss, F. T., Rossow, E., and Blackburn, J. T. (2005). Evaluating Damage Potential in Buildings Affected by Excavations. J. Geotech. Geoenviron. Eng. 131 (10), 1199–1210. doi:10.1061/(asce)1090-0241(2005)131:10(1199)
Havaei, M., Davy, A., Warde-Farley, D., Biard, A., Courville, A., Bengio, Y., et al. (2017). Brain Tumor Segmentation with Deep Neural Networks. Med. image Anal. 35, 18–31. doi:10.1016/j.media.2016.05.004
He, Y., Kusiak, A., Ouyang, T., and Teng, W. (2017). Data-Driven Modeling of Truck Engine Exhaust Valve Failures: A Case Study. J. Mech. Sci. Technol. 31 (6), 2747–2757. doi:10.1007/s12206-017-0518-1
He, Y., and Kusiak, A. (2017). Performance Assessment of Wind Turbines: Data-Derived Quantitative Metrics. IEEE Trans. Sustain. Energ. 9 (1), 65–73. doi:10.1109/TSTE.2017.2715061
Hu, R., Ratner, E., Stewart, D., Björk, K.-M., and Lendasse, A. (2020). A Modified Lanczos Algorithm for Fast Regularization of Extreme Learning Machines. Neurocomputing 414, 172–181. doi:10.1016/j.neucom.2020.07.015
Huang, G. B., Zhu, Q. Y., and Siew, C. K. (2006). Extreme Learning Machine: Theory and Applications. Neurocomputing 70 (1-3), 489–501. doi:10.1016/j.neucom.2005.12.126
Kim, C. Y., Bae, G. J., Hong, S. W., Park, C. H., Moon, H. K., and Shin, H. S. (2001). Neural Network Based Prediction of Ground Surface Settlements Due to Tunnelling. Comput. Geotechnics 28 (6-7), 517–547. doi:10.1016/s0266-352x(01)00011-8
Kusiak, A., Tang, F., and Xu, G. (2011). Multi-Objective Optimization of HVAC System with an Evolutionary Computation Algorithm. Energy 36 (5), 2440–2449. doi:10.1016/j.energy.2011.01.030
Li, H., Deng, J., Feng, P., Pu, C., Arachchige, D. D. K., and Cheng, Q. (2021a). Short-Term Nacelle Orientation Forecasting Using Bilinear Transformation and ICEEMDAN Framework. Front. Energ. Res. 9, 780928. doi:10.3389/fenrg.2021.780928
Li, H., Deng, J., Yuan, S., Feng, P., and Arachchige, D. D. K. (2021b). Monitoring and Identifying Wind Turbine Generator Bearing Faults Using Deep Belief Network and EWMA Control Charts. Front. Energ. Res. 9, 799039. doi:10.3389/fenrg.2021.799039
Li, H., He, Y., Xu, Q., Deng, j., Li, W., and Wei, Y. (2022). Detection and Segmentation of Loess Landslides via Satellite Images: a Two-phase Framework. Landslides, 1–14. doi:10.1007/s10346-021-01789-0
Li, H., Xu, Q., He, Y., and Deng, J. (2018). Prediction of Landslide Displacement with an Ensemble-Based Extreme Learning Machine and Copula Models. Landslides 15 (10), 2047–2059. doi:10.1007/s10346-018-1020-2
Li, H., Xu, Q., He, Y., Fan, X., and Li, S. (2020). Modeling and Predicting Reservoir Landslide Displacement with Deep Belief Network and EWMA Control Charts: A Case Study in Three Gorges Reservoir. Landslides 17 (3), 693–707. doi:10.1007/s10346-019-01312-6
Liu, X., Zhang, Z., and Song, Z. (2020). A Comparative Study of the Data-Driven Day-Ahead Hourly Provincial Load Forecasting Methods: From Classical Data Mining to Deep Learning. Renew. Sustain. Energ. Rev. 119, 109632. doi:10.1016/j.rser.2019.109632
Mishra, M., Bhatia, A. S., and Maity, D. (2021). A Comparative Study of Regression, Neural Network and Neuro-Fuzzy Inference System for Determining the Compressive Strength of brick–mortar Masonry by Fusing Nondestructive Testing Data. Eng. Comput. 37, 77–91. doi:10.1007/s00366-019-00810-4
Netzel, H. D. (2009). Building Response Due to Ground Movements. Delft, Netherlands: Delft University Press/Ios Press.
Ouyang, T., He, Y., Li, H., Sun, Z., and Baek, S. (2019). Modeling and Forecasting Short-Term Power Load with Copula Model and Deep Belief Network. IEEE Trans. Emerg. Top. Comput. Intell. 3 (2), 127–136. doi:10.1109/tetci.2018.2880511
Ouyang, T., Huang, H., He, Y., and Tang, Z. (2020). Chaotic Wind Power Time Series Prediction via Switching Data-Driven Modes. Renew. Energ. 145, 270–281. doi:10.1016/j.renene.2019.06.047
Ouyang, T., Kusiak, A., and He, Y. (2017). Modeling Wind-Turbine Power Curve: A Data Partitioning and Mining Approach. Renew. Energ. 102, 1–8. doi:10.1016/j.renene.2016.10.032
Parlett, B. N. (1980). A New Look at the Lanczos Algorithm for Solving Symmetric Systems of Linear Equations. Linear algebra its Appl. 29, 323–346. doi:10.1016/0024-3795(80)90248-7
Pereira, S., Pinto, A., Alves, V., and Silva, C. A. (2016). Brain Tumor Segmentation Using Convolutional Neural Networks in MRI Images. IEEE Trans. Med. Imaging 35 (5), 1240–1251. doi:10.1109/tmi.2016.2538465
Potts, D. M., and Addenbrooke, T. I. (1997). A Structure's Influence on Tunnelling-Induced Ground Movements. Proc. Inst. Civil Eng. - Geotechnical Eng. 125 (2), 109–125. doi:10.1680/igeng.1997.29233
Skempton, A. W., and MacDonald, D. H. (1956). The Allowable Settlements of Buildings. Proc. Inst. Civil Eng. 5 (6), 727–768. doi:10.1680/ipeds.1956.12202
Son, M., and Cording, E. J. (2005). Estimation of Building Damage Due to Excavation-Induced Ground Movements. J. Geotech. Geoenviron. Eng. 131 (2), 162–177. doi:10.1061/(asce)1090-0241(2005)131:2(162)
Sun, Z., He, Y., Gritsenko, A., Lendasse, A., and Baek, S. (2017). Deep Spectral Descriptors: Learning the point-wise Correspondence Metric via Siamese Deep Neural Networks. arXiv preprint arXiv:1710.06368.
Tang, P., Chen, G.-Q., Huang, R.-Q., and Wang, D. (2021). Effect of the Number of Coplanar Rock Bridges on the Shear Strength and Stability of Slopes with the Same Discontinuity Persistence. Bull. Eng. Geol. Environ. 80 (5), 3675–3691. doi:10.1007/s10064-021-02180-y
Tang, P., Chen, G.-Q., Huang, R.-Q., and Zhu, J. (2020). Brittle Failure of Rockslides Linked to the Rock Bridge Length Effect. Landslides 17 (4), 793–803. doi:10.1007/s10346-019-01323-3
Vassallo, R., Mishra, M., Santarsiero, G., and Masi, A. (2016). Interaction of a Railway Tunnel with a Deep Slow Landslide in clay Shales. Proced. Earth Planet. Sci. 16, 15–24. doi:10.1016/j.proeps.2016.10.003
Vassallo, R., Mishra, M., Santarsiero, G., and Masi, A. (2019). Modeling of Landslide-Tunnel Interaction: the Varco d'Izzo Case Study. Geotech Geol. Eng. 37 (6), 5507–5531. doi:10.1007/s10706-019-01020-x
Wei, Y., and Yang, C. (2018). Predictive Modeling of Mining Induced Ground Subsidence with Survival Analysis and Online Sequential Extreme Learning Machine. Geotech Geol. Eng. 36 (6), 3573–3581. doi:10.1007/s10706-018-0558-z
Xu, Q., Li, H., He, Y., Liu, F., and Peng, D. (2019). Comparison of Data-Driven Models of Loess Landslide Runout Distance Estimation. Bull. Eng. Geol. Environ. 78 (2), 1281–1294. doi:10.1007/s10064-017-1176-3
Keywords: building damage risk management, quantitative assessment, machine learning, feature engineering, area under the receiver operation characteristics
Citation: Yang W, Wang L, Feng Y and Zeng T (2022) Ground Settlement-Induced Building Damage Assessment With Modified Lanczos Algorithm and Extreme Learning Machine. Front. Environ. Sci. 10:861747. doi: 10.3389/fenvs.2022.861747
Received: 25 January 2022; Accepted: 09 February 2022;
Published: 28 February 2022.
Edited by:
Yusen He, Grinnell College, United StatesReviewed by:
Peng Feng, Chengdu University, ChinaPeng Tang, Jiangxi University of Science and Technology, China
Copyright © 2022 Yang, Wang, Feng and Zeng. This is an open-access article distributed under the terms of the Creative Commons Attribution License (CC BY). The use, distribution or reproduction in other forums is permitted, provided the original author(s) and the copyright owner(s) are credited and that the original publication in this journal is cited, in accordance with accepted academic practice. No use, distribution or reproduction is permitted which does not comply with these terms.
*Correspondence: Ting Zeng, dHplbmdfc2N1QDE2My5jb20=; Weiqi Yang, eWFuZ3dlaXFpMjgyNDEyMUAxNjMuY29t; Lingling Wang, MzQ2Njk3OTA2QHFxLmNvbQ==; Yuran Feng, ZmVuZ3l1cmFuMjAxN0AxNjMuY29t