 Shuaibin Liu
 Farah Durani2*
 Qasim Raza Syed
 Mohammad Haseeb
 Zaijun Li
- 1School of Civil Engineering and Architecture, Zhengzhou University of Aeronautics, Zhengzhou, China
- 2Department of Finance, College of Business Administration, University of Business and Technology, Jeddah, Saudi Arabia
- 3National Tariff Commission, Islamabad, Pakistan
- 4China Institute of Development Strategy and Planning, Institute for Region and Urban-Rural Development, Wuhan University, Wuhan, China
- 5Department of Economics, Faculty of Social Science, Aligarh Muslim University, Aligarh, India
- 6Research Institute of Central Jiangsu Development, Yangzhou University, Yangzhou, China
Climate change, energy security, and volatile energy prices have been emerging as eminent threats worldwide. To overcome these concerns, energy efficiency could play a positive role. Hence, this study probes whether energy efficiency curbs CO2 emissions in the US, while controlling for trade, economic growth, and population. We use the Fourier-ADF and Fourier-LM tests to discern the unit-roots. Moreover, to render reliable findings, we rely on the novel Fourier ARDL model. The study divulges that energy efficiency plunges emissions in the long- and short-run. In particular, a 1% upsurge in energy efficiency impedes emissions by about 0.37% and 1.07% during the long- and short-term, respectively. Moreover, population and economic growth escalate emissions whether it is long- or short-run. Next, we document that trade upsurges emissions in the long-run. Also, we perform two types of sensitivity analysis to test whether our key results remain the same across different models/methods. Finally, we suggest escalating energy efficiency through investment and technological advancement. Moreover, import tariffs on renewables should be plunged while there should be relatively high tariffs on non-renewables.
Introduction
The global economy has witnessed a remarkable upsurge in economic growth (EG) since the inception of the 21st century. This unprecedented escalation in EG entails an enormous amount of energy. According to a report from the International Energy Agency1, global energy consumption (EC) has witnessed around a 50% upsurge since 1995. As a result, there exists a gap between demand and supply of energy, leading to an emerging issue of energy security. For instance, during 2003, EC was around 97.87 (quad BTU) whereas energy production (EP) stood at 67.73 (quad BTU) in the US. This gap exerts pressure on energy prices, contributing to energy prices hike and volatility. It is a point to report that high energy prices and their uncertainty affect production and consumption decisions Not only this, these above-mentioned issues exert a detrimental impact on investment and EG. Parallel to this, excessive EC leads to momentous environmental problems such as climate change, global warming, and environmental degradation. These factors have been contributing to higher levels of average global temperature, severe weather events, and several natural disasters, among others. It is widely reported that greenhouse gases, particularly CO2 emissions (COE), trigger these aforementioned environmental problems. Next, COE are derived from energy sources, especially the non-renewables. Thus, it could be noted that EC is mainly accountable for both energy security and climate change. To resolve these aforementioned global concerns (i.e., energy security and climate change), the world has been performing collective endeavors such as the Paris Agreement of 2015 and the United Nations Climate Change Conference (COP26) of 2022. Nonetheless, COE not only remains high but it witnesses an upsurge, calling for the research-based steps that can help to plunge COE.
Discerning the triggers of COE is indispensable in order to adopt policies that assist to accomplish sustainable development. To this end, several drivers of COE have extensively been probed in the relevant body of prior literature. Thereby, it is reported that EG is a critical factor that affects COE (Mujtaba et al., 2020; Mujtaba et al., 2021; Mujtaba and Jena, 2021; Mujtaba et al., 2022). Next, Chien et al. (2021) and Huang et al. (2022) conclude that financial development and ICT affect the environment. Similarly, Anwar and Malik (2021) reveal that institutions that perform better can plunge COE. Liu et al. (2022) highlighted that environment-friendly innovations impede COE. Parallel to this, Anwar et al. (2021a), Anwar et al. (2021b) noted that renewables and financial development curb COE. Likewise, Anwar et al. (2021c) conclude that investment through public-private collaboration mitigates COE. Next, Anwar et al. (2021d) and Anwar et al. (2022) highlighted that technological advancement exerts a detrimental impact on COE. Likewise, Sun et al. (2022) and Jahanger et al. (2021) noted that globalization affects COE. The prior literature also emphasizes the role of energy efficiency (EEF) in order to plunge COE. It is a point to report that EEF, which could be described as producing the same volume of output with less amount of energy, is an effective tool to combat energy security and COE nowadays. Also, EEF could be able to preserve energy which in turn plunges EC and hence plunges COE. Moreover, EEF contributes to high levels of EG, which upsurges the level of income. This hike in income compels individuals to prefer environment-friendly goods and/or technology, leading to low levels of COE. In the prior literature, an emerging line of research investigates the impact of EEF on COE (see, e.g., Moutinho et al., 2015). Several research studies reveal that EEF impedes COE (Akram et al., 2020a; Awan et al., 2022; Lei et al., 2022) in developed and developing countries while using the methodologies such as the ARDL model, NARDL, Structural time-series model, 2SLS model, and quantile-based models, among others. Nonetheless, the existing literature on this line of research contains many drawbacks. For instance, proper handling of structural breaks has been disregarded in the relevant literature, which may provide unreliable findings (Enders and Lee, 2012). Further, the existing literature on the EEF-COE nexus mainly borrows the Environmental Kuznets Curve (EKC) framework, which also contains a few issues. That is, the EKC framework may contain issues of serial correlation and inappropriate functional form which can lead to invalid results (Hashmi et al., 2022).
Hence, to provide reliable findings, reinvestigating the EEF-COE nexus is imperative while using the appropriate methods. Therefore, this study aims to explore the impact of EEF on COE in the US. The US is the leading economy in the world while it is one of the top carbon emitter countries (i.e., rank#2 in the world). Moreover, the US has also been confronting energy security issues due to high levels of EC. These distinct characteristics motivate us to test the EEP-COE nexus in the US. Regarding the contribution to the relevant literature, this study employs the STIRPAT framework to discern whether EEP affects COE in the US. Unlike the EKC, the STIRPAT framework does not contain issues of serial correlation and model misspecification. Next, unlike previous studies that disregard structural breaks while testing the unit roots, we employ the Fourier-ADF and Fourier-LM unit root tests, having the ability to cover structural breaks and hence provide reliable findings. Third, this analysis employs the novel Fourier ARDL (FARDL) approach to estimate the long- and short-term coefficients. The inclusion of the Fourier transformation in the ARDL methodology renders robust findings. Finally, we perform two sensitivity analyses to report robust outcomes. To this end, we use urbanization, instead of population, as an independent variable in the FARDL approach. Next, we estimate the FMOLS, DOLS, and CCR models as the second type of sensitivity analysis.
This study will be beneficial for several stakeholders. For instance, future energy and environmental policies could be reshaped given the findings of this study. Moreover, the researchers and academicians could also expand this line of research to explore avenues that help to achieve COP26 targets. This study also assists in formulating a sustainable trade policy, which implies that a trade policy should be introduced in such a way that trade of the US will not exert a detrimental environmental impact.
Review of Relevant Literature
This section is segregated into three parts. The first part highlights the relevant literature on the impact of EG on COE, the second part reports the existing literature on the impact of TR on COE, and the last subsection reports the existing literature related to the impact of energy efficiency and COE.
Literature on the Impact of EG on COE
Undoubtedly, EG is perceived as the core influencing factor behind the enormous volume of COE. In the literature, the Environmental Kuznets Curve (EKC) hypothesis is the main theoretical approach that links EG with COE. The EKC explains that an inverted U-shaped relationship exists between EG and COE (see, e.g., Syed and Bouri, 2021). However, in the literature, there also exist contradictory findings regarding the shape of the EKC. There exist four major shapes of EKC, showing the different relationships between growth and emissions in each case. For instance, Apergis and Payne (2009) and Jalil and Mahmud (2009) report the inverted U-shaped EKC. For several While Lee et al. (2009) and Sinha et al. (2018) validate the N-shaped EKC. Next, several research studies such as Ozturk and Al-Mulali (2015) and Dogan and Turkekul (2016) document the U-shaped EKC. Parallel to this, Abdallah et al. (2013) and Moghadam and Dehbashi (2018) validate the inverted N-shaped EKC. Besides, monotonically increasing/decreasing EKC is also reported in the prior literature (Begum et al., 2015; Gill et al., 2018). Finally, a few studies document that EKC does not exist, indicating that income does not explain CO2 emissions (see, for example, Acaravci and Ozturk, 2010). However, the aforementioned conventional EKC framework is also criticized in the literature. Stern and Common (2001) note that EKC suffers from misspecification. Also, Stern (2004) claimed that EKC has a weak econometrics base. Hence, Narayan and Narayan (2010) put forward the EKC framework that does use square or cubic terms of GDP, rather it validates the EKC hypothesis based on the magnitude of the short- and long-run elasticity of income. Thereafter, several studies test the validity of the EKC hypothesis modified by Narayan and Narayan (2010) (see, inter alia, Al-Mulali et al., 2015; Al-Mulali et al., 2016; Hashmi et al., 2022). Contrarily, several research studies use the STIRPAT framework to test whether EG impacts COE (see, e.g., Syed et al., 2022). The findings noted that EG enhanced COE (ibid).
Literature on the Impact of TR on COE
The existing literature on environmental economics highlights that TR is also an inevitable determinant of COE (Ertugrul et al., 2016). There exist certain theoretical channels/effects (i.e., scale, composition, and technique effects) that link TR with COE (Farhani et al., 2014). The scale effect notes that an upsurge in EG or industrial production entails energy, which ultimately escalates COE. The composition effect notes that, due to TR, the economy alters its structure, and resources are redistributed/reallocated within the economy. Further, the dynamics of imports and exports may also be changed, which in turn affect COE. Finally, the technique effect argues that the increase in technological advancement leads to environment-friendly production methods. As a result, COE witness a profound plunge. Besides, Pollution Haven Hypothesis (PHH) also provides a theoretical rationale that links TR with COE. The PHH argues that TR introduces FDI into the economy, and if the host country has relatively low environmental standards, COE will witness an upsurge due to an increase in FDI. In particular, countries with higher environmental standards transfer their resources to the countries with relatively low environmental standards in order to avoid the additional cost (e.g., carbon tax) (Copeland and Taylor, 2004). Several research outlets have examined the TR-COE nexus, e.g., Atici (2012) probes whether TR affects COE in ASEAN countries. The study concludes that higher exports lead to high COE. Contrarily, while using the Hatemi-j (2008) cointegration approach, Kanjilal and Ghosh (2013) report that TR plunges COE. Applying the ARDL approach, Shahbaz et al. (2013) confirm that TR contributes to an enormous volume of COE. Similar results have been reported by Al-Mulali and Sheau-Ting (2014). Next, Ali et al. (2016) noted that uni-directional causality exists, which runs from TR to COE. Recently, Wang and Zhang (2021) reported that TR plunges COE in the high- and middle-income countries, whereas TR does not affect COE in the low-income countries. Using the quantile-on-quantile approach, Adebayo et al. (2022) highlight that TR impedes COE at lower quantiles. The prior literature on the TR-COE nexus shows the contrasting results, which motivates this study to further explore this issue to achieve a specific conclusion.
Literature on the Impact of EEF on COE
In their study, Özcan and Özkan (2018) explain that EEF is the capability to produce the same level of production while utilizing a low level of energy. There exists an emerging body of literature that reports whether and how EEF affects COE. For example, Mahapatra and Irfan (2021) noted that EEF leads to energy preservation, and hence COE decreases. Similar findings have been reported by Imran et al. (2020) in Pakistan. Xia et al. (2020) noted that, in the industrial sector of China, an upsurge in EEF contributes to low levels of COE. Further, Akram et al. (2020a, b) highlight that EEF plunges COE in both the developed and developing countries. Mirza et al. (2022) reported that EEF is one of the lower-cost approaches that curbs COE. There exists a strand of literature that probes the asymmetric impact of EEF on COE (Wu and Shi, 2011). In this line of research, Li et al. (2022) noted that EEF posits an asymmetric impact on emissions. Shahbaz et al. (2016) highlight that EEF is a tool to achieve several sustainable development goals, especially related to a clean environment.
Regarding the methodological approaches used in the prior literature to probe the impact of EEF on COE, many research studies employ DOLS and FMOLS estimators (see, Dong et al., 2018; Shao et al., 2019). Also, several researchers employ the ARDL approach and conclude that EEF plunges COE. Using the AMG estimator, a few studies report that EEF affects COE (see, Danish et al., 2019). Contrarily, there exist studies that apply the Granger causality testing procedure to discern the EEF-COE nexus (see, e.g., Zhang et al., 2017). The review of relevant literature shows that the prior literature used the methods (i.e., mentioned above) that do not cover the structural breaks. It is worth to note that disregarding the structural breaks may give unreliable outcomes. Hence, this literature gap motivates this study to probe whether EEF affects COE while accounting for the several types/nature of breaks.
Model and Data
The present study aims to probe whether EEF, TR, and EG affect COE in the US. To this end, we employ the STIRPAT (i.e., stochastic impact by regression on population, affluence, and technology) model of Dietz and Rosa (1994), which has widely been adopted to discern the influencing factors of COE (Syed et al., 2022). According to the STIRPAT model, environmental degradation (i.e., proxied by COE in this study) depends on population (i.e., proxied by urbanization or total population), affluence (i.e., proxied by economic growth), and technology (i.e., proxied by energy efficiency or technological advancement). For details on the STIRPAT model, see the study of Dietz and Rosa (1994). Next, the empirical model using the STIRPAT framework is reported as follows:
From Eq. 1, t denotes year (time) while E reflects the error term. Next, βi (i = 1, 2, 3, 4) represents coefficient (elasticity) whereas β0 shows an intercept. Moreover, COE, EG, EEF, POP, and TR denote CO2 emissions, economic growth, energy efficiency, population, and trade openness, respectively. This study also appends TR in the STIRPAT model as an additional variable.
Regarding the dataset, we make use of time series data, for the US, covering the period 1970–2020. We use COE (i.e, carbon emissions) as a dependent variable, which is measured in metric tons per capita. On the contrary, EG, EEF, POP, and TR are the independent variables. It is a point to note that EG (i.e, GDP per capita) is measured in 2015$, EEF (energy efficiency) is measured in GDP to energy consumption ratio (i.e., GDP/energy consumption) (Akram et al., 2022), POP is proxied by total population, and TR is measured as trade to GDP ratio. The entire dataset is gathered from World Development Indicators (WDI) database. The entire dataset is converted into a logarithmic form. The description of variables is delineated in Table 1.

TABLE 1. Description of variables.
The anticipated sign for EG is positive which implies that EG leads to higher COE, while we anticipate EEF to be a negative number which shows that EEF plunges COE. Next, the foretold sign for TR is positive which indicates that TR enhances COE, whereas the expected sign for POP is also positive which reports that POP escalates COE.
From Table 1, POP and TR contain the highest and the lowest mean, respectively. Similarly, TR and COE have the highest and lowest standard deviation, respectively. Excluding COE, the entire dataset contains negative skewness. The kurtosis shows that there do not exist fat tails in the dataset whereas the Jarque-Bera test explains that the selected dataset follows the normal distribution.
Methodology
This study accomplishes its objective by employing the novel Fourier ARDL (FARDL) approach. Therefore, the present section covers the discussion on the methodology of the FARDL approach. It is worth noting that the prior literature reports several methods to test cointegration (i.e., the long-run association among the considered variables) such as Engle and Granger (1987) test, and Johansen and Juselius (1990) test, among others. Nonetheless, these aforementioned methods contain a few drawbacks. For instance, the order of integration should be the same to apply these above-mentioned methods. Hence, Pesaran et al. (2001) proposed the autoregressive distributed lags (ARDL) approach which is applicable if the variables follow different ordering. Further, the ARDL approach covers the issues of serial correlation and endogeneity and hence provides robust findings. On top of this, the ARDL approach segregates the long- and short-run estimates which help to formulate heterogeneous policies for the long- and short-run. In its standard form, the ARDL can be delineated s follows:
Equation 2 describes the ARDL approach with unrestricted intercept and no trend. Next,
It is a point to report that the ARDL approach contains a drawback, i.e., it disregards the structural breaks which in turn lead to erroneous outcomes (Enders and Lee, 2012). Therefore, this study applies Fourier transformation to the ARDL approach, which accounts for the structural breaks. The Fourier transformation outperforms structural break dummies because it does not require prior information on the nature, date/time, and frequency of breaks. Further, the Fourier transformation does not contain several parameters and hence possesses good power and size properties (Enders and Lee, 2012). The ARDL with Fourier transformation (FARDL) is reported as follows:
From Eq. 3,
Empirical Results
We report the empirical findings in this section. In the time series dataset, exploring unit root/stationarity is inevitable to eschew erroneous findings and choose the appropriate estimation technique. Therefore, we discern the unit root before estimating the novel FARDL approach. The literature notes several unit root tests, e.g., the ADF test and Phillips-Perron test, among others. Nevertheless, these conventional tests ignore the structural breaks and hence might produce invalid results. To overcome this, we employ Fourier-ADF and Fourier-LM tests. These tests use Fourier transformation, which covers the structural breaks and thus provides robust empirical results. Table 2 delineates findings from the Fourier-ADF and Fourier-LM tests.
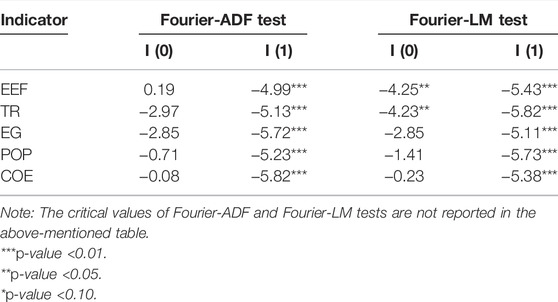
TABLE 2. Fourier-ADF and Fourier-LM tests.
It is a point to report that H0 of the Fourier-LM and Fourier-ADF tests states that there exists a unit root, whereas H1 notes vice versa. The findings from Table 2 highlight that we could not reject H0 at I (0) in the case of both tests, implying that the entire dataset contains a unit root at I (0). Contrarily, we can reject H0 at I (1) in both tests. Therefore, it could be concluded that the dataset does not hold any unit root at I (1). The stationarity of data at I (1) compels us to employ the novel FARDL approach.
It is a point to highlight that we use the novel FARDL approach in this analysis. As reported in the methodology section, the FARDL approach outperforms other contemporary methods due to its ability to cover several types of structural breaks. The outcomes from the FARDL bounds test are shown in Table 3.

TABLE 3. FARDL bounds test.
As depicted in Table 3, the test statistic from both the F- and t-test is greater than the respective upper bound value. Thus, we can reject the null hypothesis of no cointegration, implying that a long-run relationship holds between the considered variables of this study. In the next step, we report the long- and short-run findings from the novel FARDL model.
The findings from the novel FARDL model are noted in Table 4. In the long-run, all variables are statistically significant. This indicates that EEF, EG, POP, and TR affect COE in the US. In particular, the coefficient of EEF is −0.37, which notes that a 1% increase in EEF curbs emissions by 0.37%. This outcome is backed by Akram et al. (2020a) and Akram et al. (2022). An upsurge in EEF preserves energy resources, which produce more output with the same level of energy and hence curb emissions. Moreover, EEF leads to higher levels of income which allows individuals to prefer environment-friendly products and technologies. As a result, emissions witnessed a decline. In the US, special attention has been given to climate change mitigation technologies that improve the EEF, resulting in low levels of emissions. Next, the coefficient of EG is 1.64, highlighting that a 1% rise in EG enhances emissions by 1.64%. This empirical finding is also concluded by Hashmi et al. (2022). Further, the coefficient of POP is 0.73, suggesting that a 0.73% increase in emissions is fostered by a 1% increase in POP. This result is backed by Syed et al. (2022) in BRICST countries. Finally, the magnitude of TR is 0.01, implying that a 1% upsurge in TR enhances emissions by 0.01%. This conclusion is in line with the result of Dou et al. (2021). An upsurge in the trade may entail higher levels of energy which eventually escalates COE. In the short-run, the coefficient on EEF is −1.07, reporting that a 1% increase in EEF mitigates COE by 1.07%. Parallel to this, the coefficient of EG is 1.17. This implies that a 1.17% rise in COE is fostered by a 1% upsurge in EG. Next, the coefficient of POP and TR is statistically insignificant, indicating that neither population nor trade openness cause emissions in the short-run. Regarding the diagnostics, the error correction term (ECT) is −0.25, explaining that any deviation from equilibrium will be converged by 25% every year. The adjusted R-square is 0.95, describing that 95% variation in COE is explained by selected independent variables of the study. Further, the serial correlation test, ARCH test, Jarque-Bera test, and Ramset RESET test report that the estimated model does not contain issues such as auto-correlation, heteroskedasticity, non-normal distribution of errors, and misspecification. To probe the stability, CUSUM and CUSUM of squares tests are employed with the findings as reported in Figures 1, 2. The results from these abovementioned tests note that the estimates model is stable (Figures 3, 4).
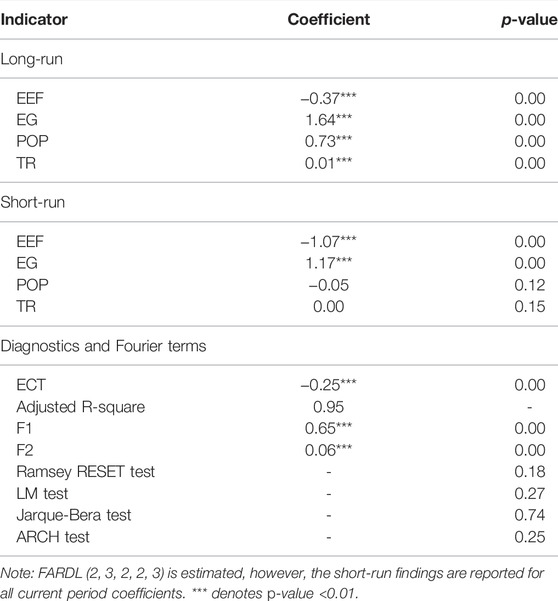
TABLE 4. Results from FARDL approach.
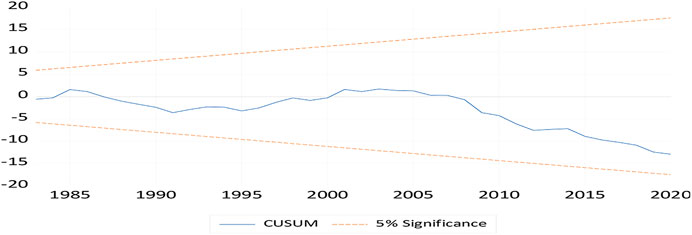
FIGURE 1. CUSUM test.
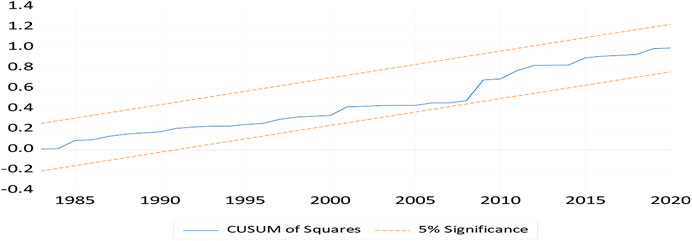
FIGURE 2. CUSUM of squares test.
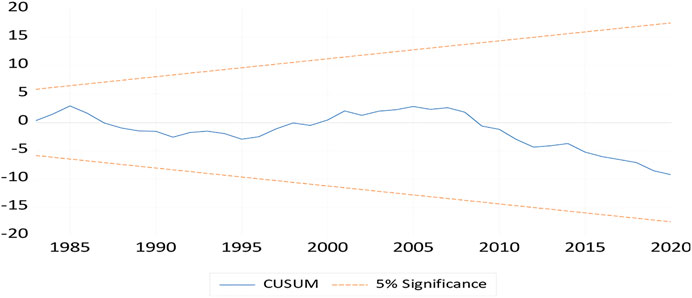
FIGURE 3. CUSUM test.
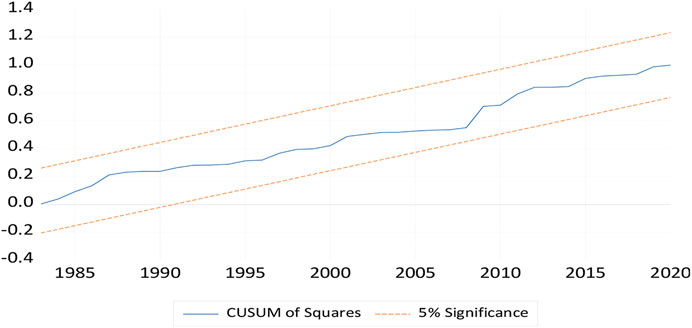
FIGURE 4. CUSUM of squares.
Sensitivity Analysis
This section presents a sensitivity analysis to see whether the choice of model/methodology alters the baseline findings. For this purpose, we use two approaches: 1) we estimate the FARDL model using urbanization (URB) instead of POP, and 2) we employ FMOLS, DOLS, and CCR methods. The findings from the FARDL model using URB as an independent variable are presented in Table 5.
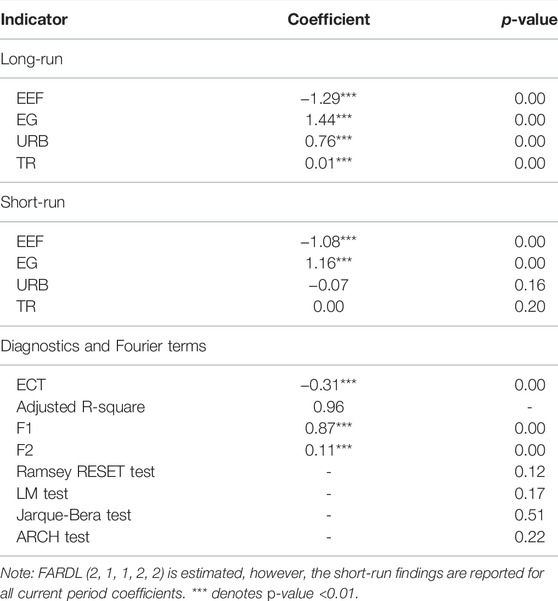
TABLE 5. Results from FARDL approach.
The long-run findings from the FARDL model note that EEF, EG, URB, and TR are statistically significant, indicating that COE depends on these aforementioned variables. Particularly, the coefficient of EEF is negative, explaining that EEF helps to curb emissions in the US. Similarly, the positive coefficient of EG, URB, and TR describes that these aforementioned factors lead to higher levels of emissions. Regarding the short-run findings, EEF has a negative coefficient, noting that any increase in EEF impedes emissions. Further, EG contributes to higher emissions. On the contrary, TR and URB do not explain emissions in the short-run. These findings are similar to our baseline findings.
Next, we employ FMOLS, DOLS, and CCR approaches to probe whether the choice of methodology reshapes the baseline findings. The outcomes are delineated in Table 6.
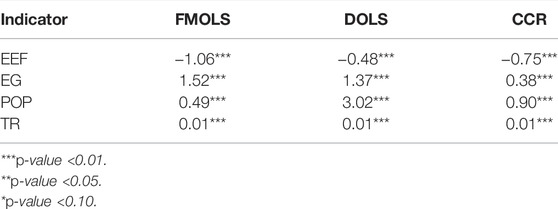
TABLE 6. Results from FMOLS, DOLS, and CCR approach.
As depicted in Table 6, all variables are statistically significant at a 1% level. The coefficient of EEF is negative in FMOLS, DOLS, and CCR model, reporting that a hike in EEF improves environmental quality by curbing emissions. Next, the coefficient on EG, POP, and TR is positive across different models, showing that these aforementioned factors enhance the level of emissions. These results are akin to our baseline findings. Hence, we confirm that our results are robust since they are not sensitive to the choice of model and/or methodology.
Conclusion
Energy security, volatile energy prices, and climate change are cited as the growing global threats. To handle these aforementioned inevitable issues, improved energy efficiency (EEF) could act as an effective instrument. Although the prior literature probes the impact of EEF on CO2 emissions, we reinvestigate whether EEF affects COE in the US using the STIRPAT framework. On top of this, we apply the Fourier-ADF and Fourier-LM tests to discern unit root property. The findings reveal that the entire dataset is integrated at I (1) (i.e., stationary at the first difference). Next, we employ the novel Fourier ARDL (FARDL) approach, which covers the structural breaks and hence provides reliable results. The outcomes from the FARDL approach describe that EEF curbs COE, while economic growth (EG), trade (TR), and population (POP) escalate COE. To check whether the baseline findings are sensitive to the choice of model/methodology, we conduct two procedures as sensitivity analysis: 1) we incorporate urbanization (URB), instead of POP while estimating the FARDL model; 2) we employ FMOLS, DOLS, and CCR model. The key findings from our analysis reveal that EEF plunges COE in the long- and short-run. EG and POP escalate COE in both time horizons. Contrarily, TR upsurges COE only in the long-run. We get similar results from the sensitivity analysis.
The US has been conducting several steps to improve the EEF which will, in turn, exert a positive impact on issues of energy security and environmental quality. For instance, the Advanced Manufacturing Office (AMO) aims to improve the EEF in the US. The AMO provides technical assistance to the industries on how to improve EEF. Moreover, the AMO has set several targets to limit COE originating from industrial production. Next, to escalate the production of energy-efficient products, the Appliance and Equipment Standard Program (AESP) has been initiated in the US which set energy-efficiency standards for the products being used at home, in industry, and other places. Similarly, the National Action Plan for Energy Efficiency (NAPEE) is a program that provides investment for abolishing the barriers to efficient energy usage in homes, schools, and industries. These initiatives of the US play a significant role in curbing COE, and our key findings support the endeavors of these aforementioned initiatives.
Finally, we put forward various policy suggestions. First, since EEF is found to be an effective tool to curb emissions, policymakers should put efforts to escalate EEF in the US by encouraging investment into efficient energy technologies. Next, international organizations/agencies/institutions should initiate programs that encourage/motivate individuals to use products with improved energy efficiency. A significant proportion of the R&D budget/expenditure should be devoted to research projects, attempting to develop efficient energy technologies. The should be the introduction of subsidized loans for the producers and consumers of energy-efficient products, which in turn improve the level of EEF in the economy. Since TR has an adverse environmental impact in the long-run, structure of trade should be critically noticed and trade in renewables needs to be enhanced. Besides, there is a need to announce low levels of feed-in-tariff coupled with the high tariffs on non-renewables. There should be an export tax on renewables, which, in turn, escalates the domestic use of renewables. The role of population or urbanization should not be overlooked while formulating environmental policies. Since EG (i.e., derived from non-renewables) upsurges COE, structural reform should be introduced that can help to derive EG from renewable energy and improved EEF technologies. The growth rate of producing efficient-energy products should be either higher or equal to the population growth rate in order to offset the adverse environmental impacts of the population.
Regarding the limitations, the present study ignores the non-linear aspect of EEF on COE since the FARDL model reports the linear impact of EEF on COE. Also, the FARDL approach does not report the impact of EEF on various quantiles of COE. Moreover, the availability of a relatively small dataset compels us not to include several control variables such as financial development, natural resources, and economic policies, among others. The researchers can extend this line of research by employing non-linear econometric methods. Next, instead of the STIRPAT model, other frameworks could also be used such as the Environmental Phillips Curve, Pollution haven hypothesis, and carbon hysteresis hypothesis, among others. Also, to discern the TR-COE nexus, researchers may employ other proxies for trade such as tariffs and non-tariff barriers, etc (Tajudeen et al., 2018).
Data Availability Statement
Publicly available datasets were analyzed in this study. This data can be found here: https://databank.worldbank.org/source/world-development-indicators.
Author Contributions
FD: Conceptualization; first draft, QS: data analysis, MH: literature, JS: drafting, SL: conclusion and supervision, ZL: data.
Funding
This work is supported by the Humanities and Social Sciences Research Project of Henan Province (No. 2020-ZZJH-483) and by a Research reward (IRCI) from University of Business and Technology, KSA.
Conflict of Interest
The authors declare that the research was conducted in the absence of any commercial or financial relationships that could be construed as a potential conflict of interest.
Publisher’s Note
All claims expressed in this article are solely those of the authors and do not necessarily represent those of their affiliated organizations, or those of the publisher, the editors and the reviewers. Any product that may be evaluated in this article, or claim that may be made by its manufacturer, is not guaranteed or endorsed by the publisher.
Footnotes
1IEA, 2013. Redrawing the Energy-climate Map: World Energy Outlook Special Report: OECD/IEA.
References
Abdallah, K. B., Belloumi, M., and De Wolf, D. (2013). Indicators for Sustainable Energy Development: A Multivariate Cointegration and Causality Analysis from Tunisian Road Transport Sector. Renew. Sustain. Energy Rev. 25, 34–43. doi:10.1016/j.rser.2013.03.066
Acaravci, A., and Ozturk, I. (2010). On the Relationship between Energy Consumption, CO2 Emissions and Economic Growth in Europe. Energy 35 (12), 5412–5420. doi:10.1016/j.energy.2010.07.009
Adebayo, T. S., Rjoub, H., Akinsola, G. D., and Oladipupo, S. D. (2022). The Asymmetric Effects of Renewable Energy Consumption and Trade Openness on Carbon Emissions in Sweden: New Evidence from Quantile-On-Quantile Regression Approach. Environ. Sci. Pollut. Res. 29 (2), 1875–1886. doi:10.1007/s11356-021-15706-4
Akram, R., Chen, F., Khalid, F., Ye, Z., and Majeed, M. T. (2020a). Heterogeneous Effects of Energy Efficiency and Renewable Energy on Carbon Emissions: Evidence from Developing Countries. J. Clean. Prod. 247, 119122.doi:10.1016/j.jclepro.2019.119122
Akram, R., Majeed, M. T., Fareed, Z., Khalid, F., and Ye, C. (2020b). Asymmetric Effects of Energy Efficiency and Renewable Energy on Carbon Emissions of BRICS Economies: Evidence from Nonlinear Panel Autoregressive Distributed Lag Model. Environ. Sci. Pollut. Res. 27 (15), 18254–18268. doi:10.1007/s11356-020-08353-8
Akram, R., Umar, M., Xiaoli, G., and Chen, F. (2022). Dynamic Linkages between Energy Efficiency, Renewable Energy along with Economic Growth and Carbon Emission. A Case of MINT Countries an Asymmetric Analysis. Energy Rep. 8, 2119–2130. doi:10.1016/j.egyr.2022.01.153
Al-Mulali, U., Saboori, B., and Ozturk, I. (2015). Investigating the Environmental Kuznets Curve Hypothesis in Vietnam. Energy policy 76, 123–131. doi:10.1016/j.enpol.2014.11.019
Al-Mulali, U., and Sheau-Ting, L. (2014). Econometric Analysis of Trade, Exports, Imports, Energy Consumption and CO2 Emission in Six Regions. Renew. Sustain. Energy Rev. 33, 484–498. doi:10.1016/j.rser.2014.02.010
Al-Mulali, U., Solarin, S. A., and Ozturk, I. (2016). Investigating the Presence of the Environmental Kuznets Curve (EKC) Hypothesis in Kenya: an Autoregressive Distributed Lag (ARDL) Approach. Nat. Hazards 80 (3), 1729–1747. doi:10.1007/s11069-015-2050-x
Ali, H. S., Law, S. H., and Zannah, T. I. (2016). Dynamic Impact of Urbanization, Economic Growth, Energy Consumption, and Trade Openness on CO 2 Emissions in Nigeria. Environ. Sci. Pollut. Res. 23 (12), 12435–12443. doi:10.1007/s11356-016-6437-3
Anwar, A., Chaudhary, A. R., Malik, S., and Bassim, M. (2021a). Modelling the Macroeconomic Determinants of Carbon Dioxide Emissions in the G-7 Countries: the Roles of Technological Innovation and Institutional Quality Improvement. Glob. Bus. Rev., 09721509211039392. doi:10.1177/09721509211039392
Anwar, A., Sharif, A., Fatima, S., Ahmad, P., Sinha, A., Rehman Khan, S. A., et al. (2021b). The Asymmetric Effect of Public Private Partnership Investment on Transport CO2 Emission in China: Evidence from Quantile ARDL Approach. J. Clean. Prod. 288, 125282. doi:10.1016/j.jclepro.2020.125282
Anwar, A., Siddique, M., Eyup Dogan, E., and Sharif, A. (2021c). The Moderating Role of Renewable and Non-renewable Energy in Environment-Income Nexus for ASEAN Countries: Evidence from Method of Moments Quantile Regression. Renew. Energy 164, 956–967. doi:10.1016/j.renene.2020.09.128
Anwar, A., Sinha, A., Sharif, A., Siddique, M., Irshad, S., Anwar, W., et al. (2021d). The Nexus between Urbanization, Renewable Energy Consumption, Financial Development, and CO2 Emissions: Evidence from Selected Asian Countries. Environ. Dev. Sustain. 24, 1–21. doi:10.1007/s10668-021-01716-2
Anwar, A., Malik, S., and Ahmad, P. (2022). Cogitating the Role of Technological Innovation and Institutional Quality in Formulating the Sustainable Development Goal Policies for E7 Countries: Evidence from Quantile Regression. Glob. Bus. Rev., 09721509211072657. doi:10.1177/09721509211072657
Anwar, A., and Malik, S. (2021). Cogitating the Role of Technological Innovation and Institutional Quality on Environmental Degradation in G-7 Countries. Int. J. Green Econ. 15 (3), 213–232. doi:10.1504/ijge.2021.120871
Apergis, N., and Payne, J. E. (2009). CO2 Emissions, Energy Usage, and Output in Central America. Energy Policy 37 (8), 3282–3286. doi:10.1016/j.enpol.2009.03.048
Atici, C. (2012). Carbon Emissions, Trade Liberalization, and the Japan-ASEAN Interaction: A Group-wise Examination. J. Jpn. Int. Econ. 26 (1), 167–178. doi:10.1016/j.jjie.2011.07.006
Awan, A., Kocoglu, M., Banday, T. P., and Tarazkar, M. H. (2022). Revisiting Global Energy Efficiency and CO2 Emission Nexus: Fresh Evidence from the Panel Quantile Regression Model. Environ. Sci. Pollut. Res., 1–14. doi:10.1007/s11356-022-19101-5
Begum, R. A., Sohag, K., Abdullah, S. M. S., and Jaafar, M. (2015). CO2 Emissions, Energy Consumption, Economic and Population Growth in Malaysia. Renew. Sustain. Energy Rev. 41, 594–601. doi:10.1016/j.rser.2014.07.205
Chien, F., Anwar, A., Hsu, C.-C., Sharif, A., Razzaq, A., and Sinha, A. (2021). The Role of Information and Communication Technology in Encountering Environmental Degradation: Proposing an SDG Framework for the BRICS Countries. Technol. Soc. 65, 101587. doi:10.1016/j.techsoc.2021.101587
Copeland, B. R., and Taylor, M. S. (2004). Trade, Growth, and the Environment. J. Econ. literature 42 (1), 7–71. doi:10.1257/.42.1.7
Danish, , , Baloch, M. A., Mahmood, N., and Zhang, J. W. (2019). Effect of Natural Resources, Renewable Energy and Economic Development on CO2 Emissions in BRICS Countries. Sci. Total Environ. 678, 632–638. doi:10.1016/j.scitotenv.2019.05.028
Dietz, T., and Rosa, E. A. (1994). Rethinking the Environmental Impacts of Population, Affluence and Technology. Hum. Ecol. Rev. 1 (2), 277–300. syed.
Dogan, E., and Turkekul, B. (2016). CO2 Emissions, Real Output, Energy Consumption, Trade, Urbanization and Financial Development: Testing the EKC Hypothesis for the USA. Environ. Sci. Pollut. Res. 23 (2), 1203–1213. doi:10.1007/s11356-015-5323-8
Dong, K., Sun, R., Jiang, H., and Zeng, X. (2018). CO2 Emissions, Economic Growth, and the Environmental Kuznets Curve in China: what Roles Can Nuclear Energy and Renewable Energy Play? J. Clean. Prod. 196, 51–63. doi:10.1016/j.jclepro.2018.05.271
Dou, Y., Zhao, J., Malik, M. N., and Dong, K. (2021). Assessing the Impact of Trade Openness on CO2 Emissions: Evidence from China-Japan-ROK FTA Countries. J. Environ. Manag. 296, 113241. doi:10.1016/j.jenvman.2021.113241
Enders, W., and Lee, J. (2012). A Unit Root Test Using a Fourier Series to Approximate Smooth Breaks∗. Oxf. Bull. Econ. Statistics 74 (4), 574–599. doi:10.1111/j.1468-0084.2011.00662.x
Engle, R. F., and Granger, C. W. J. (1987). Co-integration and Error Correction: Representation, Estimation, and Testing. Econometrica 55, 251–276. doi:10.2307/1913236
Ertugrul, H. M., Cetin, M., Seker, F., and Dogan, E. (2016). The Impact of Trade Openness on Global Carbon Dioxide Emissions: Evidence from the Top Ten Emitters Among Developing Countries. Ecol. Indic. 67, 543–555. doi:10.1016/j.ecolind.2016.03.027
Esmaeilpour Moghadam, H., and Dehbashi, V. (2018). The Impact of Financial Development and Trade on Environmental Quality in Iran. Empir. Econ. 54 (4), 1777–1799. doi:10.1007/s00181-017-1266-x
Farhani, S., Chaibi, A., and Rault, C. (2014). CO2 Emissions, Output, Energy Consumption, and Trade in Tunisia. Econ. Model. 38, 426–434. doi:10.1016/j.econmod.2014.01.025
Gill, A. R., Viswanathan, K. K., and Hassan, S. (2018). A Test of Environmental Kuznets Curve (EKC) for Carbon Emission and Potential of Renewable Energy to Reduce Green House Gases (GHG) in Malaysia. Environ. Dev. Sustain 20 (3), 1103–1114. doi:10.1007/s10668-017-9929-5
Hashmi, S. M., Bhowmik, R., Inglesi-Lotz, R., and Syed, Q. R. (2022). Investigating the Environmental Kuznets Curve Hypothesis amidst Geopolitical Risk: Global Evidence Using Bootstrap ARDL Approach. Environ. Sci. Pollut. Res. 29 (16), 24049–24062. doi:10.1007/s11356-021-17488-1
Hatemi-j, A. (2008). Tests for Cointegration with Two Unknown Regime Shifts with an Application to Financial Market Integration. Empir. Econ. 35 (3), 497–505. doi:10.1007/s00181-007-0175-9
Huang, Y., Haseeb, M., Usman, M., and Ozturk, I. (2022). Dynamic Association between ICT, Renewable Energy, Economic Complexity and Ecological Footprint: Is There Any Difference between E-7 (Developing) and G-7 (Developed) Countries? Technol. Soc. 68, 101853. doi:10.1016/j.techsoc.2021.101853
Imran, M., Özçatalbaş, O., and Bashir, M. K. (2020). Estimation of Energy Efficiency and Greenhouse Gas Emission of Cotton Crop in South Punjab, Pakistan. J. Saudi Soc. Agric. Sci. 19 (3), 216–224. doi:10.1016/j.jssas.2018.09.007
Jahanger, A., Usman, M., and Balsalobre‐Lorente, D. (2021). Autocracy, Democracy, Globalization, and Environmental Pollution in Developing World: Fresh Evidence from STIRPAT Model. J. Public Aff., e2753. doi:10.1002/pa.2753
Jalil, A., and Mahmud, S. F. (2009). Environment Kuznets Curve for CO2 Emissions: a Cointegration Analysis for China. Energy policy 37 (12), 5167–5172. doi:10.1016/j.enpol.2009.07.044
Johansen, S., and Juselius, K. (1990). Maximum Likelihood Estimation and Inference on Cointegration—With Appucations to the Demand for Money. Oxf. Bull. Econ. statistics 52 (2), 169–210. doi:10.1111/j.1468-0084.1990.mp52002003.x
Kanjilal, K., and Ghosh, S. (2013). Environmental Kuznet’s Curve for India: Evidence from Tests for Cointegration with Unknown Structuralbreaks. Energy Policy 56, 509–515.
Lee, C.-C., Chiu, Y.-B., and Sun, C.-H. (2009). Does One Size Fit All? A Reexamination of the Environmental Kuznets Curve Using the Dynamic Panel Data Approach. Appl. Econ. Perspect. Policy 31 (4), 751–778. doi:10.1111/j.1467-9353.2009.01465.x
Lei, W., Xie, Y., Hafeez, M., and Ullah, S. (2022). Assessing the Dynamic Linkage between Energy Efficiency, Renewable Energy Consumption, and CO2 Emissions in China. Environ. Sci. Pollut. Res. 29 (13), 19540–19552. doi:10.1007/s11356-021-17145-7
Li, Y., Zhang, C., Li, S., and Usman, A. (2022). Energy Efficiency and Green Innovation and its Asymmetric Impact on CO2 Emission in China: a New Perspective. Environ. Sci. Pollut. Res., 1–8. doi:10.1007/s11356-022-19161-7
Liu, L., Anwar, A., Irmak, E., and Pelit, I. (2022). Asymmetric Linkages between Public-Private Partnership, Environmental Innovation, and Transport Emissions. Econ. Research-Ekonomska Istraživanja, 1–22. doi:10.1080/1331677x.2022.2049979
Mahapatra, B., and Irfan, M. (2021). Asymmetric Impacts of Energy Efficiency on Carbon Emissions: a Comparative Analysis between Developed and Developing Economies. Energy 227, 120485. doi:10.1016/j.energy.2021.120485
Mirza, F. M., Sinha, A., Khan, J. R., Kalugina, O. A., and Zafar, M. W. (2022). Impact of Energy Efficiency on CO2 Emissions: Empirical Evidence from Developing Countries. Gondwana Res. 106, 64–77. doi:10.1016/j.gr.2021.11.017
Moutinho, V., Costa, C., and Bento, J. P. C. (2015). The Impact of Energy Efficiency and Economic Productivity on CO2 Emission Intensity in Portuguese Tourism Industries. Tour. Manag. Perspect. 16, 217–227. doi:10.1016/j.tmp.2015.07.009
Mujtaba, A., and Jena, P. K. (2021). Analyzing Asymmetric Impact of Economic Growth, Energy Use, FDI Inflows, and Oil Prices on CO2 Emissions through NARDL Approach. Environ. Sci. Pollut. Res. Int. 28 (24), 30873–30886. doi:10.1007/s11356-021-12660-z
Mujtaba, A., Jena, P. K., and Mukhopadhyay, D. (2020). Determinants of CO2 Emissions in Upper Middle-Income Group Countries: an Empirical Investigation. Environ. Sci. Pollut. Res. 27 (30), 37745–37759. doi:10.1007/s11356-020-09803-z
Mujtaba, A., Jena, P. K., and Joshi, D. P. P. (2021). Growth and Determinants of CO2 Emissions: Evidence from Selected Asian Emerging Economies. Environ. Sci. Pollut. Res. 28 (29), 39357–39369. doi:10.1007/s11356-021-13078-3
Mujtaba, A., Jena, P. K., Bekun, F. V., and Sahu, P. K. (2022). Symmetric and Asymmetric Impact of Economic Growth, Capital Formation, Renewable and Non-renewable Energy Consumption on Environment in OECD Countries. Renew. Sustain. Energy Rev. 160, 112300. doi:10.1016/j.rser.2022.112300
Narayan, P. K., and Narayan, S. (2010). Carbon Dioxide Emissions and Economic Growth: Panel Data Evidence from Developing Countries. Energy policy 38 (1), 661–666. doi:10.1016/j.enpol.2009.09.005
Özcan, K. M., and Özkan, A. U. (2018). The Relationship between Energy Efficiency and Economic Performance in G20 Countries. Top. Middle East. Afr. Econ. Proc. Middle East Econ. Assoc. 20 (1).
Ozturk, I., and Al-Mulali, U. (2015). Investigating the Validity of the Environmental Kuznets Curve Hypothesis in Cambodia. Ecol. Indic. 57, 324–330. doi:10.1016/j.ecolind.2015.05.018
Pesaran, M. H., Shin, Y., and Smith, R. J. (2001). Bounds Testing Approaches to the Analysis of Level Relationships. J. Appl. Econ. 16 (3), 289–326. doi:10.1002/jae.616
Shahbaz, M., Kumar Tiwari, A., and Nasir, M. (2013). The Effects of Financial Development, Economic Growth, Coal Consumption and Trade Openness on CO2 Emissions in South Africa. Energy policy 61, 1452–1459. doi:10.1016/j.enpol.2013.07.006
Shahbaz, M., Jam, F. A., Bibi, S., and Loganathan, N. (2016). Multivariate Granger Causality between CO2 Emissions, Energy Intensity and Economic Growth in Portugal: Evidence from Cointegration and Causality Analysis. Technol. Econ. Dev. Econ. 22 (1), 47–74. doi:10.3846/20294913.2014.989932
Shao, Q., Wang, X., Zhou, Q., and Balogh, L. (2019). Pollution Haven Hypothesis Revisited: a Comparison of the BRICS and MINT Countries Based on VECM Approach. J. Clean. Prod. 227, 724–738. doi:10.1016/j.jclepro.2019.04.206
Sinha, A., Shahbaz, M., and Balsalobre, D. (2018). N-shaped Environmental Kuznets Curve: A Note on Validation and Falsification.
Solarin, S. A. (2019). Modelling the Relationship between Financing by Islamic Banking System and Environmental Quality: Evidence from Bootstrap Autoregressive Distributive Lag with Fourier Terms. Qual. Quant. 53 (6), 2867–2884. doi:10.1007/s11135-019-00904-7
Stern, D. I., and Common, M. S. (2001). Is There an Environmental Kuznets Curve for Sulfur? J. Environ. Econ. Manag. 41 (2), 162–178. doi:10.1006/jeem.2000.1132
Stern, D. I. (2004). The Rise and Fall of the Environmental Kuznets Curve. World Dev. 32 (8), 1419–1439. doi:10.1016/j.worlddev.2004.03.004
Sun, Y., Anwar, A., Razzaq, A., Liang, X., and Siddique, M. (2022). Asymmetric Role of Renewable Energy, Green Innovation, and Globalization in Deriving Environmental Sustainability: Evidence from Top-10 Polluted Countries. Renew. Energy 185, 280–290. doi:10.1016/j.renene.2021.12.038
Syed, Q. R., Bhowmik, R., Adedoyin, F. F., Alola, A. A., and Khalid, N. (2022). Do economic Policy Uncertainty and Geopolitical Risk Surge CO2 Emissions? New Insights from Panel Quantile Regression Approach. Environ. Sci. Pollut. Res. Int. 29, 27845–27861. doi:10.1007/s11356-021-17707-9
Syed, Q. R., and Bouri, E. (2021). Impact of Economic Policy Uncertainty on CO2 Emissions in the US: Evidence from Bootstrap ARDL Approach. J. Public Aff., e2595. doi:10.1002/pa.2595
Tajudeen, I. A., Wossink, A., and Banerjee, P. (2018). How Significant Is Energy Efficiency to Mitigate CO2 Emissions? Evidence from OECD Countries. Energy Econ. 72, 200–221. doi:10.1016/j.eneco.2018.04.010
Wang, Q., and Zhang, F. (2021). The Effects of Trade Openness on Decoupling Carbon Emissions from Economic Growth - Evidence from 182 Countries. J. Clean. Prod. 279, 123838. doi:10.1016/j.jclepro.2020.123838
Wu, P., and Shi, P. (2011). An Estimation of Energy Consumption and CO2 Emissions in Tourism Sector of China. J. Geogr. Sci. 21, 733–745. doi:10.1007/s11442-011-0876-z
Xia, Z., Abbas, Q., Mohsin, M., and Song, G. (2020). Trilemma Among Energy, Economic and Environmental Efficiency: Can Dilemma of EEE Address Simultaneously in Era of COP 21? J. Environ. Manag. 276, 111322. doi:10.1016/j.jenvman.2020.111322
Zhang, B., Zhang, T., Yu, S., Wang, H., Wang, X., Chang, Y., Mou, H., Zhang, P., Wang, L., and Jiang, Y. (2017). Carbon-wrapped Four-Component Na-Ni-Ti-Co Oxides via Sol-Gel Process for NIB Anode Material with Superior Cycling Stability. J. Appl. Electrochem 47 (8), 855–864. doi:10.1007/s10800-017-1083-0
Keywords: energy efficiency, CO2 emissions, STIRPAT model, Fourier ARDL model, Fourier unit root tests
Citation: Liu S, Durani F, Syed QR, Haseeb M, Shamim J and Li Z (2022) Exploring the Dynamic Relationship Between Energy Efficiency, Trade, Economic Growth, and CO2 Emissions: Evidence From Novel Fourier ARDL Approach. Front. Environ. Sci. 10:945091. doi: 10.3389/fenvs.2022.945091
Received: 16 May 2022; Accepted: 09 June 2022;
Published: 28 June 2022.
Edited by:
Atif Jahanger, Hainan University, ChinaReviewed by:
Roni Bhowmik, Guangdong University of Foreign Studies, ChinaAhsan Anwar, National College of Business Administration and Economics, Pakistan
Aqib Mujtaba, Shri Mata Vaishno Devi University, India
Copyright © 2022 Liu, Durani, Syed, Haseeb, Shamim and Li. This is an open-access article distributed under the terms of the Creative Commons Attribution License (CC BY). The use, distribution or reproduction in other forums is permitted, provided the original author(s) and the copyright owner(s) are credited and that the original publication in this journal is cited, in accordance with accepted academic practice. No use, distribution or reproduction is permitted which does not comply with these terms.
*Correspondence: Farah Durani, Zi5kdXJhbmlAdWJ0LmVkdS5zYQ==