 Yinping Liu
 Yuhui Jiang1
 Xia Li
- 1Key Laboratory of Meteorological Disaster, Ministry of Education (KLME)/Joint International Research Laboratory of Climate and Environment Change (ILCEC)/Collaborative Innovation Center on Forecast and Evaluation of Meteorological Disasters (CIC-FEMD)/Key Laboratory for Aerosol-Cloud-Precipitation of China Meteorological Administration, Nanjing University of Information Science and Technology, Nanjing, China
- 2State Key Laboratory of Severe Weather, Chinese Academy of Meteorological Sciences, Beijing, China
- 3Guangdong Technical Support Center of Meteorological Public Security, Guangzhou, China
This study is performed to analyze the effects of both soil water content and porosity, two of the influencing factors of the finite conductivity, on the propagation of lightning electromagnetic fields (LEMFs) and lightning-induced voltages (LIVs) on overhead lines. A two-dimensional finite difference time domain (FDTD) model together with an improved Archie’s soil model is adopted for the field calculation at close distances from the lightning channel. The obtained results confirm that the soil water content and porosity have notable impacts on the peak values of LEMFs, especially the horizontal electric field. Moreover, the soil water content and porosity are correlated when acting together. The peak values of the horizontal electric field are found to be markedly influenced by the porosity changes at high water content or the water content changes at low porosity. The LIVs on overhead lines in these two cases are also studied. There appear to be greater differences in the induced voltages as the water content changes at low porosity.
1 Introduction
The finitely conducting ground is widely recognized to possibly influence the propagation of lightning electromagnetic fields (LEMFs) with advances in the knowledge of it. This effect will cause a great difference from the value estimated for perfectly conducting ground, thereby affecting the results of lightning location and lightning-induced voltage (LIV) computation. Thus, a comprehensive study on the finite conductivity and its influencing factors, such as the soil water content and porosity, could deepen the research of LEMFs, which is also a contributing factor to lightning detection technology, lightning disaster assessment, and lightning protection.
The studies on LEMFs have primarily involved development of algorithms, the earliest one of which is Sommerfeld’s integrals (Sommerfeld, 1909). Later, many approximation methods derived from it were proposed (Rubinstein, 1996; Wait, 1997). The application of the above classical analytical methods is sometimes subject to the complexity of the actual situation to some extent. In this aspect, the results of numerical methods are more accurate than analytical results. Based on the finite difference time domain (FDTD) method (Kane Yee, 1966), a numerical method of popularity, considerable efforts have been dedicated to examining the characteristics of LEMFs along different propagation paths, including rough surfaces (Shoory et al., 2005; Li et al., 2014), stratified paths (Zhang et al., 2012; Zhang et al., 2015), irregular terrains (Soto et al., 2014a; Li D. et al., 2019; Arzag et al., 2019; He et al., 2019), and tall objects (Baba and Rakov, 2008; Araki et al., 2018).
In the existing studies on the propagation of LEMFs, many articles mentioned the lack of consideration of the soil medium. Recently, through the SHAndong Triggering Lightning Experiment, Li et al. found that the soil medium may lead to amplitude attenuation of the magnetic field generated by lightning discharge radiation (Li X. et al., 2019). In the calculation of LEMFs, the soil medium is always represented by soil electrical parameters, mainly referring to soil permittivity and conductivity. The influence of permittivity on the horizontal electric field has been found to be ignorable compared with soil conductivity (Yu et al., 2017). The attenuation effect of soil conductivity on electromagnetic field propagation is indispensable. Additionally, the water content may affect the soil conductivity particularly, among many factors.
Some of the studies assumed conductivities influenced by the water content to be constant parameters. For example, Liu et al. set up different conductivities of wetland, dry land, and sand to numerically simulate the propagation characteristics of LEMFs (Liu et al., 2012). As to whether making soil electrical parameters constant is reasonable when studying the LEMFs in air and underground, Delfino et al. (2009) concluded in their study that the assumption seems reasonable for soil with a water content of 2%–10%. However, for soil with very low or very high water content, the electromagnetic field appears to be significantly affected by the frequency dependence of ground electrical parameters. From the same point of view of frequency-dependent soil, a natural rough surface (Ouyang et al., 2012) and stratified ground (Li et al., 2020) were also studied. It was also considered in studies on LIVs on overhead lines (Akbari et al., 2013; Schroeder et al., 2018; Rizk et al., 2021) and grounding systems (Visacro and Alipio, 2012; Nazari et al., 2021). In addition, an expression between soil water content and conductivity obtained from engineering surveys was applied by Yang et al. (2021) to the simulation of LEMFs. They found that the water content affects the propagation characteristics of lightning electromagnetic pulses along the surface to a certain extent.
However, soil is a typical porous medium composed of soil particles, air voids between particles and liquid water (Hallikainen et al., 1985). The breakdown inside the air voids is what initiates the soil ionization (Ghania, 2019). Meanwhile, the porosity may determine the proportion of air and water in the soil. Therefore, analyzing the influence of water content on LEMF propagation without considering the impact of the soil porosity does not seem comprehensive.
This study is performed to analyze the influences of both soil water content and porosity on the propagation of LEMFs at close distances. A two-dimensional (2-D) FDTD model and a generalized Archie’s model are used. To the best of our knowledge, few previous studies have taken porosity into account in the analysis of LEMFs. Our model could help in further understanding the relationship between soil physical properties and LEMF propagation. Moreover, the following computation of the LIVs on overhead lines under different water contents and porosities can contribute a sound theoretical basis for lightning protection of overhead transmission lines.
2 Methodology
2.1 Lightning Electromagnetic Field Calculation
Figure 1 illustrates the configuration of the 2-D FDTD model for calculating the LEMFs employed in this study. The working space is set to
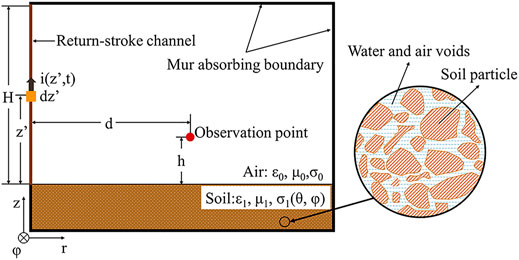
FIGURE 1. Geometry: 2-D FDTD simulation model of LEMFs for the soil considering both soil water content and porosity.
In this model, the simplified lightning model corresponds to an antenna perpendicular to the ground. The observation point is located at distance
where the channel height
with

TABLE 1. Typical current parameters of subsequent return stroke.
Note that different from most other FDTD models for calculating the lightning-generated electromagnetic field, we focus on the changes in soil conductivity caused by the soil water content and porosity. The specific soil microstructure is highlighted in Figure 1. Additionally, as we only study the changes in LEMFs in a close range, the influence of earth curvature is not considered.
2.2 Soil Model
Archie’s model is an empirical formula for simulating the formation resistivity of saturated cohesionless soil through experiments (Archie, 1942). Archie’s second law was then developed in applications to unsaturated porous media. In addition, many improved models of Archie’s model have been proposed (Ewing and Hunt, 2006; Ghanbarian et al., 2014; Glover, 2017).
A generalized Archie’s model developed by Fu et al. (2021) which is verified to be simpler and easier than the previous models is chosen in this research. This model takes surface conduction into account, which may be important in porous media containing many clay particles. As expressed in Eq. 3, the soil conductivity
where
2.3 Model Validation
The continuity equation calculation method proposed by Thottappillil is used here to verify our FDTD simulation model (Thottappillil et al., 1997). The parameters chosen in both methods are completely consistent in the following calculation. The results obtained from the two methods can be compared in Figure 2. It is apparent that our result of the vertical electric field (Ez) is in close agreement with Thottappillil’s. As a result, the simulation model used in this paper is deemed to be reasonable and effective.
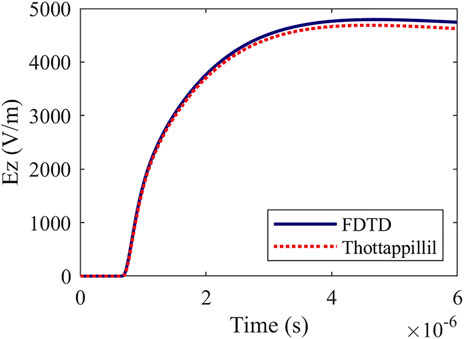
FIGURE 2. Examination of the FDTD model by comparing it to the result of Thottappillil formula.
3 Influences on Lightning Electromagnetic Fields
Figure 3A depicts the changes in electrical conductivity caused by different water contents in clay loam (
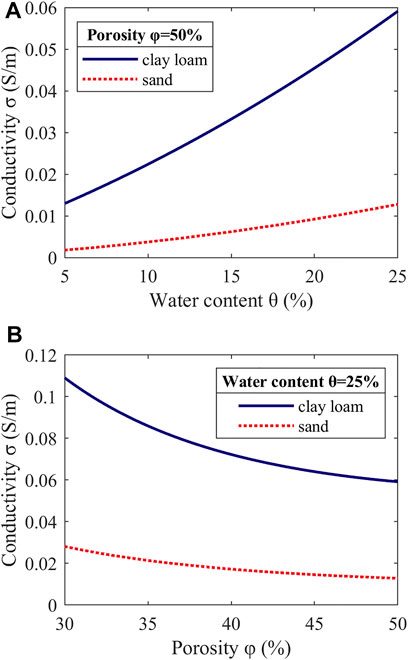
FIGURE 3. (A) Relationship between water content and electrical conductivity in clay loam and sand. The porosity is set to φ = 50%. (B) Relationship between porosity and electrical conductivity in clay loam and sand. The water content is set to
Therefore, clay loam is selected as the main research object in this paper. After referring to the actual range of the parameters of clay loam (Zhou, 2003), the water content
The electromagnetic field for various water contents when the porosity is fixed at 40% and the influence of soil porosity for a water content of 15% can be seen in Figure 4. In this figure, the calculated electromagnetic field components waveforms due to the lightning subsequent stroke include (A-B) horizontal electric field (Er), (C-D) vertical electric field (Ez), and (E-F) azimuthal magnetic field (Hφ). The observation point is located at distance d = 200 m from the lightning channel and the height
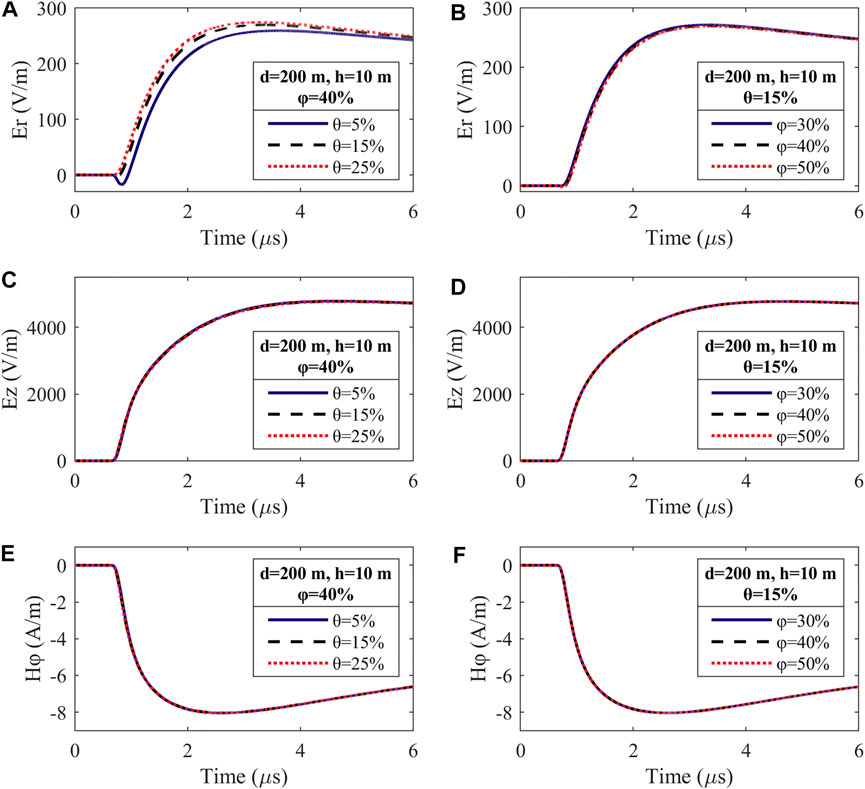
FIGURE 4. FDTD-computed subsequent return stroke waveforms of the (A,B) horizontal electric field (Er), (C,D) vertical electric field (Ez), and (E,F) azimuthal magnetic field (Hφ) (
Tables 2, 3 list the peak values and rise times of LEMFs with changing water content and porosity, respectively. In light of Figure 4 together with Tables 2, 3, the following conclusions can be drawn:
1) Both the water content and the porosity exert the greatest influence on the horizontal electric field. It is found that the vertical electric field and the azimuthal magnetic field are almost unaffected by the change in the water content or porosity except for some small changes. The same cases are also studied at three other horizontal distances from the lightning channel (50 m, 1 km, and 3 km), and the same conclusion is obtained. As expected, this result is consistent with previous studies. Aoki et al. found that there is little change in the vertical electric field and azimuthal magnetic field with the ground conductivity within 5 km (Aoki et al., 2015). Therefore, the change in soil conductivity caused by the soil water content or porosity studied in this paper would also not cause great changes in the two fields.
2) Referring to Figures 4A,B, different soil water contents or porosities can result in a noticeable difference in the peaks of the horizontal electric field, while the rise time and steepness of the waveforms change little. Note that the peak values acutely vary at different soil water contents or porosities, especially around the peak. As the water content increases, the positive peak of horizontal electric field increases under the settings shown in Figure 4A. In contrast, under the settings shown in Figure 4B, when the porosity increases, the positive peak of the horizontal electric field decreases.
3) With decreasing soil water content or porosity, the effect of its change on the peak values is more intense. This can be attributed to the ion movement in clay loam that originally has a at low water content, which is more likely to form conductive pathways, even if the water content increases slightly. When the porosity increases, the connectivity of the conductive paths becomes stronger for the clay loam that originally has low porosity. However, clay loam has a certain saturation. When the water in the soil voids forms a conductive path, changes in the water content have no obvious effect on the horizontal electric field.

TABLE 2. Peak values and rise times of the horizontal electric field (

TABLE 3. Same as Table 2 but for different porosities
As illustrated in Figure 5, to further analyze the specific effects of the soil water content and porosity on the peak values of the horizontal electric field, we study the waveforms of the horizontal electric field at different distances: (A-B) 50 m, (C-D) 200 m, (E-F) 1 km and (G-H) 3 km. The observation point is set to 10 m above the ground. The porosity in Figures 5A,C,E,G is set to 40%, and the water content changes. The water content in Figures 5B,D,F,H is set to 15% with the porosity changes.
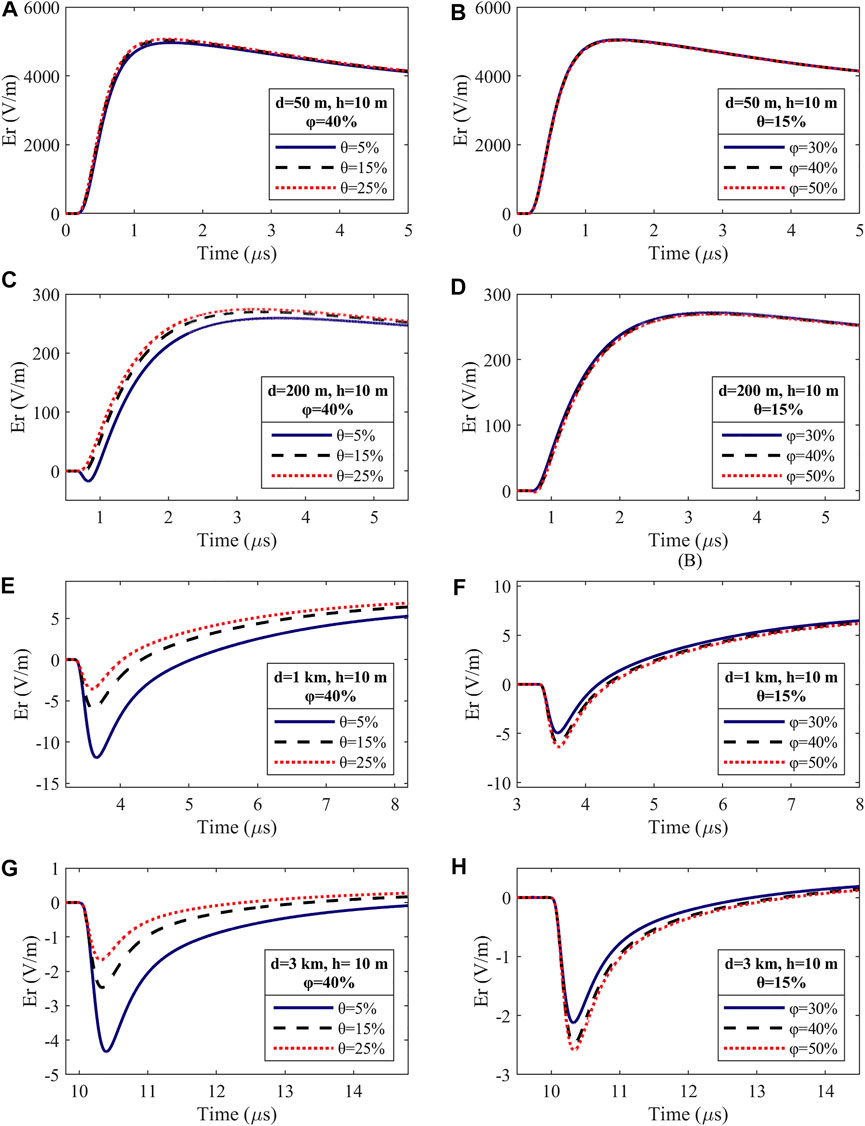
FIGURE 5. FDTD-computed subsequent return stroke waveforms of the horizontal electric field (Er). (A,C,E,G) Different water contents
Figure 5 shows that as the horizontal distance increases, the positive peak of the horizontal electric field significantly decreases. This can be explained by the fact that the high-frequency component will experience rapid attenuation in the propagation of LEMF. Simultaneously, the waveforms are found to present positive polarity at very close distances. They also exhibit a zero-crossing at low water content or high porosity at 200 m. Moreover, the waveform of the horizontal electric field tends to be more bipolar with increasing distance.
Tables 4, 5 list the positive and negative peaks of the horizontal electric field for the case at different distances and a height of 10 m with changing water content. The porosity is set to 40%. Consider the same case with changing porosity at the water content of 15%, the positive and negative peaks of the horizontal electric field are listed in Tables 6, 7. The change rate of the values at different water contents (porosities) relative to that at the water content of 5% (porosity of 30%) is marked in parentheses.

TABLE 4. Positive peak values of the horizontal electric field (Er) for different water contents

TABLE 5. Same as Table 4 but for negative peak values of the horizontal electric field (Er) for different water contents

TABLE 6. Positive peak values of the horizontal electric field (Er) for different porosities

TABLE 7. Same as Table 6 but for negative peak values of the horizontal electric field for different porosities
It is shown in Table 4 that when the porosity is 40%, a stronger influence is exerted by the soil water content on the positive peak of the horizontal electric field at 200 m than on that at 50 and 500 m. Table 5 shows that the water content has the biggest effect on the negative peaks of the horizontal electric field at 200 m. The increase in the water content from 5% to 20% results in a 99.85% reduction in the negative peak at 200 m.
Table 6 reveals that the influence of the soil porosity on the positive peaks of the horizontal electric field at 200 m is more prominent when the porosity is 45% and 50% for a water content of 15%. However, in Table 7, the porosity has a very strong influence on the negative peak values at 200 m. When the porosity increases from 30% to 50%, the negative peak value at 200 m increases by 672.55%.
Figure 6 shows line charts of the positive peak value changes of the horizontal electric field when the soil water content and porosity change simultaneously. Figure 6A presents the influence of the water content at different porosities. The effect of the porosity at different water contents is shown in Figure 6B. To focus on the changes in the positive peak values, the horizontal distance in Figure 6 is set to 200 m. It should be noted that the negative peaks at 1 km are also studied but not shown in this paper. The results show that the overall rules in the change of the positive or negative peaks are almost identical except for the opposite trends. Thus, the concrete analysis is only made on the changes in positive peak values.
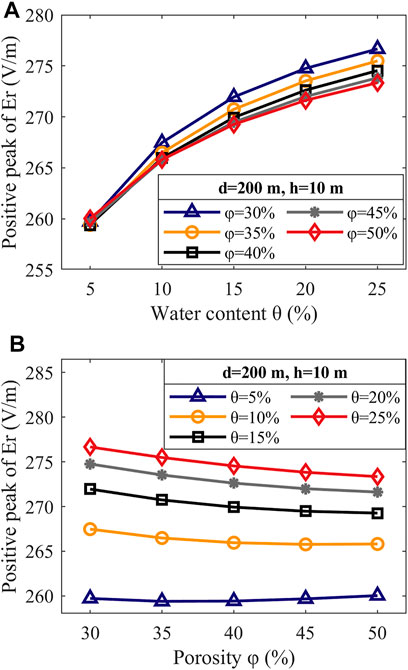
FIGURE 6. (A) Influence of water content on FDTD-computed subsequent return stroke waveforms of the horizontal electric field (Er) at different porosities
According to Figure 6A, on the one hand, porosity has little impact on the peak values at low water content. With increasing water content, the porosity plays an increasingly important role. This is because as the volume of air voids in clay loam increases, so does the water and air capacity. Therefore, conductive pathways more easily form. On the other hand, a low porosity will increase the sensitivity of horizontal electric field to changes in the water content. At high porosity, taking 40% and 50% as examples, the change in water content hardly makes effect on the peaks of the horizontal electric field at high water content. This can be explained by the fact that the soil conductivity mainly depends on the water conductivity at low porosity. When the porosity is high, the influence of the water content beyond a certain value on the conductivity is weakened.
Note that the conclusions obtained above, specifically that the change in porosity is inversely proportional (proportional) to the change in the positive peak (negative peak) of the horizontal electric field, are not applicable when the water content is set to 5% and 10% as shown in Figure 6B. However, consistent with the previous conclusions, first, the sensitivity of the horizontal electric field peak values to the water content decreases as the porosity increases. Second, if the water content decreases, its impact on the horizontal electric field increases.
Overall, it is evident that the soil water content and porosity affect each other when they act together on the horizontal electric field. The effect of the soil water content on the peaks of the horizontal electric field is more distinct than the effect of soil porosity. The reason may be that the fluid in clay voids is mainly composed of air and water, and the conductivity of air is far less than that of water. However, the effect of the porosity cannot be ignored, especially at high water contents. In addition, when the porosity is low, changes in the soil water content will also have a great influence on the peak values of the horizontal electric field. In fact, thunderstorms are often accompanied by rainfall, which increases the water content in clay loam. Hence, more attention should be given to differentiated lightning protection in areas with low-porosity clay loam.
4 Influences on Lightning-Induced Voltages on Overhead Lines
The induced voltages coupled on overhead lines will seriously endanger the stable operation of power systems when lightning strikes near transmission lines. The Agrawal model is a commonly used transmission line model to analyze induced voltages of LEMFs on overhead lines (Agrawal et al., 1980). In this model, the horizontal electric field plays an important role as the excitation source of induced voltages. We analyzed the influences of the soil water content and porosity on LEMFs in Section 3, especially the horizontal electric field. On this basis, we further analyze the effect of the water content and porosity on LIVs on overhead lines.
In this paper, the Agrawal method is adopted. The FDTD method is employed to discretely solve the Agrawal model of a single-conductor transmission line. The total induced voltages of overhead lines consist of the incident voltage and the scattered voltage. As given in Eq. 4, the incident voltage
As expressed in Eqs 5, 6, the scattered voltage
where
Figure 7 is a sketch map of the locations of the overhead line and the lightning strike point. The distance
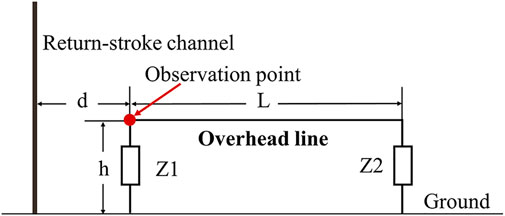
FIGURE 7. The sketch map of the locations of the lightning channel and the overhead line.
The conclusion has been drawn from Section 3 that two situations require attention when considering the influences of soil water content and porosity on the horizontal electric field simultaneously. One is changes in soil porosity at high water content and the other is changes in water content at low porosity. Figure 8 shows the results of analyzing the influences of the soil water content and porosity on the LIVs on the overhead lines from these two perspectives.
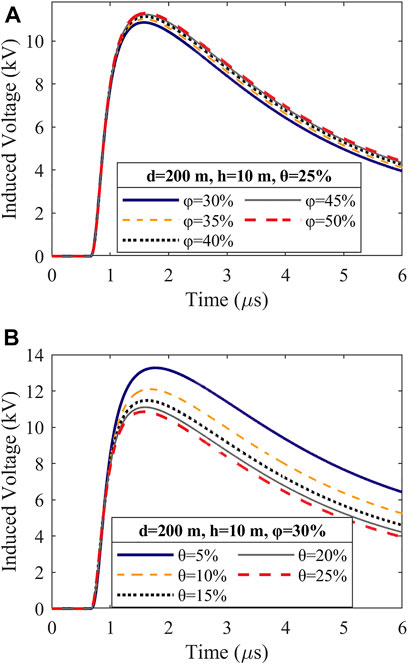
FIGURE 8. (A) Influence of the porosity on LIVs at the near end of the overhead line for high water content θ = 25%. (B) Influence of the water content on LIVs at the near end of the overhead line for low porosity φ = 30%.
The effect of the soil porosity on LIVs at the near end point of the overhead line at a high water content of 25% is shown in Figure 8A. The results show that the LIV amplitude increases with increasing porosity. However, the increasing extent decreases with the increase of soil porosity. At the same point, the variation in LIVs with changing water content at a low porosity of 30% is depicted in Figure 8B. Contrary to the influence of the porosity, the change in the soil water content is negatively correlated with the induced voltage; that is, the amplitude of the induced voltage increases with decreasing water content. The increasing extent decreases with decreasing water content. Comparing Figures 8A,B, the change in soil water content at low porosity has a more severe impact on LIVs on overhead lines than the change in porosity at high water content.
5 Summary and Discussion
Changes in soil water content and porosity can affect soil conductivity, which in turn affect the propagation of LEMFs. To explore the specific laws, the 2-D FDTD algorithm and a generalized Archie’s model are used to study the influences of the water content and the porosity on the LEMFs propagation and LIVs on overhead lines in this paper. The results obtained are as follows:
When the change in a single factor is discussed, the soil water content and the porosity are found to have the most significant impact on the peaks of the horizontal electric field of lightning and hardly affect the vertical electric field and magnetic field. The water content and porosity have prominent effects on the positive and negative peaks of the horizontal electric field at a horizontal distance of 200 m from the lightning channel. Specifically, an increase in the water content leads to an increase in the positive peak values and a decrease in the negative peak values. In contrast, the positive peak values decrease, and the negative peak values increase as the porosity increases, except in the cases where the water content is set to 5% and 10%.
The results show that the water content and porosity affect each other when they act together on the peaks of the horizontal electric field. In general, the influence of the soil water content on the peaks of the horizontal electric field is more obvious. Changes in the porosity at high water content and changes in the water content at low porosity have the greatest influence on the peaks of the horizontal electric field.
Additionally, we also analyzed the influences of water content and porosity on LIVs on overhead lines. We found that the effect of the soil water content at low porosity on the induced voltages was more severe, which can provide a reference for the design of lightning protection projects for overhead transmission lines under soil conditions with different water contents and porosities.
Due to the limitation of the observation experiments and calculation models, only two factors that affect soil conductivity, namely, water content and porosity, can be analyzed in this paper, and the relationship between them cannot be covered. Establishing a more comprehensive and scientific soil model to further analyze the propagation law of LEMFs under different soil conditions could be the direction of our follow-up improvement and exploration.
Data Availability Statement
The original contributions presented in the study are included in the article/Supplementary Material, further inquiries can be directed to the corresponding author.
Author Contributions
YL and YJ contributed to conception and design of the study. YL and YJ performed the analysis and wrote the first draft of the manuscript. QG, XL, GY, and QZ contributed to manuscript revision. QG and BT contributed to coding. All authors contributed to manuscript revision approved the submitted version.
Funding
This work was supported by the Natural Science Foundation of China (41575004), the Jiangsu Provincial Natural Science Foundation of China (BK20150903), and the NUIST Students’ Platform for Innovation and Entrepreneurship Training Program (XJDC202110300024 and XJDC202110300020).
Conflict of Interest
The authors declare that the research was conducted in the absence of any commercial or financial relationships that could be construed as a potential conflict of interest.
Publisher’s Note
All claims expressed in this article are solely those of the authors and do not necessarily represent those of their affiliated organizations, or those of the publisher, the editors and the reviewers. Any product that may be evaluated in this article, or claim that may be made by its manufacturer, is not guaranteed or endorsed by the publisher.
References
Agrawal, A., Price, H., and Gurbaxani, S. (1980). “Transient Response of Multiconductor transmission Lines Excited by a Nonuniform Electromagnetic Field,” in 1980 Antennas and Propagation Society International Symposium, Quebec, Canada, June 2–6, 1980 Institute of Electrical and Electronics Engineers, 432–435. doi:10.1109/APS.1980.1148283
Akbari, M., Sheshyekani, K., Pirayesh, A., Rachidi, F., Paolone, M., Borghetti, A., et al. (2013). Evaluation of Lightning Electromagnetic Fields and Their Induced Voltages on Overhead Lines Considering the Frequency Dependence of Soil Electrical Parameters. IEEE Trans. Electromagn. Compat. 55, 1210–1219. doi:10.1109/TEMC.2013.2258674
Aoki, M., Baba, Y., and Rakov, V. A. (2015). FDTD Simulation of LEMP Propagation over Lossy Ground: Influence of Distance, Ground Conductivity, and Source Parameters. J. Geophys. Res. Atmos. 120, 8043–8051. doi:10.1002/2015JD023245
Araki, S., Nasu, Y., Baba, Y., Rakov, V. A., Saito, M., and Miki, T. (2018). 3-D Finite Difference Time Domain Simulation of Lightning Strikes to the 634-m Tokyo Skytree. Geophys. Res. Lett. 45, 9267–9274. doi:10.1029/2018GL078214
Archie, G. E. (1942). The Electrical Resistivity Log as an Aid in Determining Some Reservoir Characteristics. Trans. AIME 146, 54–62. doi:10.2118/942054-G
Arzag, K., Azzouz, Z.-E., Baba, Y., and Ghemri, B. (2019). 3-D FDTD Computation of Electromagnetic Fields Associated with Lightning Strikes to a Tower Climbed on a Trapezoidal Mountain. IEEE Trans. Electromagn. Compat. 61, 606–616. doi:10.1109/TEMC.2019.2895689
Baba, Y., and Rakov, V. A. (2008). Influence of Strike Object Grounding on Close Lightning Electric Fields. J. Geophys. Res. 113, D12109. doi:10.1029/2008JD009811
Delfino, F., Procopio, R., Rossi, M., and Rachidi, F. (2009). Influence of Frequency-dependent Soil Electrical Parameters on the Evaluation of Lightning Electromagnetic Fields in Air and Underground. J. Geophys. Res. 114, D11113. doi:10.1029/2008JD011127
Ewing, R. P., and Hunt, A. G. (2006). Dependence of the Electrical Conductivity on Saturation in Real Porous Media. Vadose Zone J. 5, 731–741. doi:10.2136/vzj2005.0107
Fu, Y., Horton, R., Ren, T., and Heitman, J. L. (2021). A General Form of Archie's Model for Estimating Bulk Soil Electrical Conductivity. J. Hydrol. 597, 126160. doi:10.1016/j.jhydrol.2021.126160
Ghanbarian, B., Hunt, A. G., Ewing, R. P., and Skinner, T. E. (2014). Universal Scaling of the Formation Factor in Porous Media Derived by Combining Percolation and Effective Medium theories. Geophys. Res. Lett. 41, 3884–3890. doi:10.1002/2014GL060180
Ghania, S. M. (2019). Grounding Systems under Lightning Surges with Soil Ionization for High Voltage Substations by Using two Layer Capacitors (TLC) Model. Electr. Power Syst. Res. 174, 105871. doi:10.1016/j.epsr.2019.105871
Glover, P. W. J. (2017). A New theoretical Interpretation of Archie's Saturation Exponent. Solid earth. 8, 805–816. doi:10.5194/se-8-805-2017
Hallikainen, M., Ulaby, F., Dobson, M., El-rayes, M., and Wu, L.-k. (1985). Microwave Dielectric Behavior of Wet Soil-Part 1: Empirical Models and Experimental Observations. IEEE Trans. Geosci. Remote Sens. GE-23, 25–34. doi:10.1109/TGRS.1985.289497
He, L., Rachidi, F., Azadifar, M., Rubinstein, M., Rakov, V. A., Cooray, V., et al. (2019). Electromagnetic Fields Associated with the M-Component Mode of Charge Transfer. J. Geophys. Res. Atmos. 124, 6791–6809. doi:10.1029/2018JD029998
Kane Yee, Yee. (1966). Numerical Solution of Initial Boundary Value Problems Involving Maxwell's Equations in Isotropic Media. IEEE Trans. Antennas Propagat. 14, 302–307. doi:10.1109/TAP.1966.1138693
Li, D., Zhang, Q., Wang, Z., and Liu, T. (2014). Computation of Lightning Horizontal Field over the Two-Dimensional Rough Ground by Using the Three-Dimensional FDTD. IEEE Trans. Electromagn. Compat. 56, 143–148. doi:10.1109/TEMC.2013.2266479
Li, D., Luque, A., Rachidi, F., Rubinstein, M., Azadifar, M., Diendorfer, G., et al. (2019a). The Propagation Effects of Lightning Electromagnetic Fields over Mountainous Terrain in the Earth-Ionosphere Waveguide. J. Geophys. Res. Atmos. 124, 14198–14219. doi:10.1029/2018JD030014
Li, X., Lu, G., Fan, Y., Jiang, R., Zhang, H., Li, D., et al. (2019b). Underground Measurement of Magnetic Field Pulses during the Early Stage of Rocket-Triggered Lightning. J. Geophys. Res. Atmos. 124, 3168–3179. doi:10.1029/2018JD029682
Li, Q., Rubinstein, M., Wang, J., Cai, L., Zhou, M., Fan, Y., et al. (2020). On the Influence of the Soil Stratification and Frequency-dependent Parameters on Lightning Electromagnetic Fields. Electr. Power Syst. Res. 178, 106047. doi:10.1016/j.epsr.2019.106047
Liu, X., Zhang, Q., and Feng, X. (2012). Effect of Finite Conductivity on Rise Time and Field Strength Amplitude of Return Stroke Radiation Field of Cloud-Ground Flash. High. Volt. Eng. 38, 457–463. doi:10.3969/j.issn.1003-6520.2012.02.029
Mur, G. (1981). Absorbing Boundary Conditions for the Finite-Difference Approximation of the Time-Domain Electromagnetic-Field Equations. IEEE Trans. Electromagn. Compat. EMC-23, 377–382. doi:10.1109/TEMC.1981.303970
Nazari, M., Moini, R., Fortin, S., Dawalibi, F. P., and Rachidi, F. (2021). Impact of Frequency-Dependent Soil Models on Grounding System Performance for Direct and Indirect Lightning Strikes. IEEE Trans. Electromagn. Compat. 63, 134–144. doi:10.1109/TEMC.2020.2986646
Ouyang, S., Zhang, Q., Li, Y., Li, D., and Zhang, Y. (2012). Impact on Lightning Electromagnetic Field Propagation of Soil Electrical Parameter Variation Induced by Varying Surface Soil Moisture. Meteorol. Sci. Technol. 40, 1018–1024. doi:10.3969/j.issn.1671-6345.2012.06.025
Rachidi, F., Janischewskyj, W., Hussein, A. M., Nucci, C. A., Guerrieri, S., Kordi, B., et al. (2001). Current and Electromagnetic Field Associated with Lightning-Return Strokes to tall towers. IEEE Trans. Electromagn. Compat. 43, 356–367. doi:10.1109/15.942607
Rizk, M. E. M., Abulanwar, S. M., Ghanem, A. T. M., and Lehtonen, M. (2021). Computation of Lightning-Induced Voltages Considering Ground Impedance of Multi-Conductor Line for Lossy Dispersive Soil. IEEE Trans. Power Deliv., 1. doi:10.1109/TPWRD.2021.3111149
Rubinstein, M. (1996). An Approximate Formula for the Calculation of the Horizontal Electric Field from Lightning at Close, Intermediate, and Long Range. IEEE Trans. Electromagn. Compat. 38, 531–535. doi:10.1109/15.536087
Schroeder, M. A. O., de Barros, M. T. C., Lima, A. C. S., Afonso, M. M., and Moura, R. A. R. (2018). Evaluation of the Impact of Different Frequency Dependent Soil Models on Lightning Overvoltages. Electr. Power Syst. Res. 159, 40–49. doi:10.1016/j.epsr.2017.09.020
Shoory, A., Moini, R., Sadeghi, S. H. H., and Rakov, V. A. (2005). Analysis of Lightning-Radiated Electromagnetic Fields in the Vicinity of Lossy Ground. IEEE Trans. Electromagn. Compat. 47, 131–145. doi:10.1109/TEMC.2004.842104
Sommerfeld, A. (1909). Über die Ausbreitung der Wellen in der drahtlosen Telegraphie. Ann. Phys. 333, 665–736. doi:10.1002/andp.19093330402
Soto, E., Perez, E., and Herrera, J. (2014a). Electromagnetic Field Due to Lightning Striking on Top of a Cone-Shaped Mountain Using the FDTD. IEEE Trans. Electromagn. Compat. 56, 1112–1120. doi:10.1109/TEMC.2014.2301138
Soto, E., Perez, E., and Younes, C. (2014b). Influence of Non-flat terrain on Lightning Induced Voltages on Distribution Networks. Electr. Power Syst. Res. 113, 115–120. doi:10.1016/j.epsr.2014.02.034
Thottappillil, R., Rakov, V. A., and Uman, M. A. (1997). Distribution of Charge along the Lightning Channel: Relation to Remote Electric and Magnetic Fields and to Return-Stroke Models. J. Geophys. Res. 102, 6987–7006. doi:10.1029/96JD03344
Visacro, S., and Alipio, R. (2012). Frequency Dependence of Soil Parameters: Experimental Results, Predicting Formula and Influence on the Lightning Response of Grounding Electrodes. IEEE Trans. Power Deliv. 27, 927–935. doi:10.1109/TPWRD.2011.2179070
Wait, J. R. (1997). Concerning the Horizontal Electric Field of Lightning. IEEE Trans. Electromagn. Compat. 39, 186. doi:10.1109/15.584943
Yang, Y., Liu, Y., Liu, F., Zhang, N., Liu, G., and Zhai, H. (2021). Research on Influence of Different Soil Types and Moisture on Lightning Electromagnetic Field Based on FDTD. J. Trop. Meteorol. 37, 348–357. doi:10.16032/j.issn.1004-4965.2021.03410.1016/j.celrep.2021.110097
Yu, J. L., Fan, Y. D., Wang, J. G., Qi, R. H., Zhou, M., Cai, L., et al. (2017). Characteristics of the Horizontal Electric Field Associated with Nearby Lightning Return Strokes. J. Atmos. Solar-Terr. Phys. 154, 207–216. doi:10.1016/j.jastp.2016.02.017
Zhang, Q., Li, D., Fan, Y., Zhang, Y., and Gao, J. (2012). Examination of the Cooray-Rubinstein (C-R) Formula for a Mixed Propagation Path by using FDTD: TECHNIQUES FOR A MIXED GROUND. J. Geophys. Res. 117, 117–D15309. doi:10.1029/2011JD017331
Zhang, Q., Tang, X., Hou, W., and Zhang, L. (2015). 3-D FDTD Simulation of the Lightning-Induced Waves on Overhead Lines Considering the Vertically Stratified Ground. IEEE Trans. Electromagn. Compat. 57, 1112–1122. doi:10.1109/TEMC.2015.2420653
Keywords: lightning electromagnetic fields, lightning-induced voltages, finite difference time domain method, soil water content, soil porosity
Citation: Liu Y, Jiang Y, Gao Q, Li X, Yang G, Zhang Q and Tang B (2022) Influences of Soil Water Content and Porosity on Lightning Electromagnetic Fields and Lightning-Induced Voltages on Overhead Lines. Front. Environ. Sci. 10:946551. doi: 10.3389/fenvs.2022.946551
Received: 17 May 2022; Accepted: 06 June 2022;
Published: 23 June 2022.
Edited by:
Xinyao Xie, Institute of Mountain Hazards and Environment (CAS), ChinaCopyright © 2022 Liu, Jiang, Gao, Li, Yang, Zhang and Tang. This is an open-access article distributed under the terms of the Creative Commons Attribution License (CC BY). The use, distribution or reproduction in other forums is permitted, provided the original author(s) and the copyright owner(s) are credited and that the original publication in this journal is cited, in accordance with accepted academic practice. No use, distribution or reproduction is permitted which does not comply with these terms.
*Correspondence: Yinping Liu, eXVhbjg1MDNAMTYzLmNvbQ==