 Zhihong Zhai1
 Minxing Jiang
 Xiahui Che
- 1Guangzhou Climate and Agrometeorology Center, Guangzhou, China
- 2School of Business, Nanjing University of Information Science and Technology, Nanjing, China
- 3Guangdong Meteorological Service, Guangzhou, China
- 4School of Management, Hebei University, Baoding, China
Changes in meteorological conditions affect crop output and planting structure. Based on county-level data of agricultural statistics and weather information in Guangdong province from 1992 to 2018, this paper uses a panel regression model to examine the effects of high impact weather on agricultural outputs and identify the responses in planting structure. The findings show that the rainstorm significantly reduces the per-unit yield (PUY) of rice, and an additional day with daily excessive precipitation (≥50 mm) in the growth period leads to an average 0.25% reduction in PUY. However, the vegetable yield is not susceptible to high-impact weather. With a two-period panel regression model and sub-regional climate response analysis, we find that the agricultural planting structure is formed by the regional farming adapting to the high-impact weather (low temperature, high temperature, rainstorms, and high wind). The original rice farmland in the more climate-sensitive areas is transformed into vegetable farming, while the scale of rice is increasing in those less sensitive areas. Finally, we argue that the agricultural sector should assess the impacts of climate change on staple crops and make national climate sensitivity zoning maps. It will provide a scientific justification for making the national agriculture structural adjustment plan.
1 Introduction
Global climate change is exerting a significant effect on the economic system, health, and sustainable development. It has drawn extensive attention from multiple fields of study. Nordhaus (1982) study firstly included climate change within the framework of economic analysis, emerging as a pioneering work of climate economics. Natural elements, such as light, temperature, and water, are necessities for the growth of crops, while the most direct influence of climate change is to systematically change these elements, which in turn may have important implications for agriculture. As climate change increases the probability of high-impact weather, what effects do frequent high-impact weather events (which refer to some serve weather events such as low temperature, high temperature, heavy precipitation, strong gale and so forth) have on agricultural production? Does the agricultural planting structure make self-adaptive adjustments in the face of high-impact weather? It is of great significance to stabilize agricultural production and maintain food security in China by assessing the effects of high-impact weather on agricultural output and revealing the law of agricultural production adapting to high-impact weather.
Existing documents have surveyed how changes in weather factors such as temperature and precipitation affect agricultural production and have made breakthroughs in research methods (Pang et al., 2021). Most early studies were conducted based on cross-section data, which can be divided into two categories: (a) Estimating a relationship between climate factors and the yield of crops based on the agricultural production functions and forecasting climate change’s impacts on agricultural output by numerical simulation (Hansen, 1991; Kaiser et al., 1993; Rosenzweig and Parry, 1994; Adams et al., 1995; Lobell et al., 2007) (b) Adopting the hedonic model to estimate the relationship between climate factors and the price of agricultural land (Mendelsohn et al., 1994; Schlenker et al., 2005; Wang et al., 2009). A major defect of the cross-section data method is that the reliability of the conclusions is fairly sensitive to the control variables as the estimate is biased due to the omitted variables (Dell et al., 2014). Therefore, some improvements were made in the following studies. For instance, Deschênes and Greenstone (2007) used the panel data model to analyze the effects of temperature and precipitation on the agriculture of the United States and qualified the relationship between agricultural profits and interannual fluctuations in temperature and precipitation, which to some extent alleviates the endogeneity in the cross-section model and enables the model to characterize the influences of adaptive measures on agriculture. However, Recent studies have found that controlling for only temperature and precipitation in the panel data model in the Chinese agriculture case will suffer from the bias of omitting important variables. For example, it was found that relative humidity is critical to accurately estimate the effect of temperature and that ignoring relative humidity would result in an overestimation associated with the negative effects of climate warming. For instance, the effect of temperature on rice was overestimated by 12.5%, and that on wheat by 29.6% (Zhang et al., 2017). The climate factors are generally in a nonlinear relationship with agricultural output, which has been supported by extensive empirical evidence (Schlenker and Roberts, 2009; Lobell et al., 2011). If the temperature exceeds the corresponding threshold of a crop, its output will reduce significantly. Chen et al. (2016) found that there is an inverted U-shaped relationship between meteorological factors and outputs of maize and soybean.
Agricultural production needs to proactively adjust to climate change to reduce adverse effects and promote sustainable agricultural development (Qian et al., 2014). Most existing studies (Mendelsohn et al., 1994; Chen et al., 2016; Sesmero et al., 2018) used the panel data models to estimate the short-run relation between agriculture outputs and weather factors, but in general, failed to predict the long-term effects of climatic change. Because the effects of climatic change might be either enhanced or weakened in the long-run conditions. However, the existing studies did not reach a consensus associated with agriculture’s capacity to adapt to climatic change. Some studies propose the argument based on the historical analysis that advancements in agricultural technology and agricultural specialization enable agriculture to adapt to climate extremes. Farmers in the northern region of the United States have pushed crop farming north and west by introducing new crop varieties, and new varieties of wheat have gradually been planted in some uncultivable areas with low temperature and drought (Olmstead and Rhode, 2011). With the increase of specialized investments in workforce, land, and facilities for apple planting, farmers in Shaanxi China tend to take more measures such as film mulching and irrigation to adapt to climatic change. Consequently, the risk of agricultural output has remarkably reduced and outputs have increased (Feng et al., 2018). However, some studies made some distinct discoveries. Some studies (Hornbeck, 2012; Burke and Emerick, 2016) paid attention to the American Dust Bowl in the 1930s and found that the Dust Bowl led to a sharp decline in the productivity of farmland in some regions. After adjustment in the severely afflicted areas, the original wheat farmland was transformed into pasture or forage grass. However, the measures did not help much to recover the land value in these areas. The gap between the land value in the severely afflicted areas and that in other regions has narrowed only by 25 percent.
Considering that the subtropical zone in the southeast coastal region of China is sensitive to global climatic change, we take Guangdong province as a survey area. Moreover, we select rice as a representative of land-intensive crops and vegetables as a representative of labor-intensive crops, since rice is planted in double-season (early and late season), and vegetables are universally planted in Guangdong province. Based on county-level agricultural statistics and meteorological data in Guangdong from 1992 to 2018, this paper quantifies the effects of high-impact weather including low temperature, high temperature, rainstorms, and high wind on the outputs of rice and vegetables by the panel data regression model. It also identifies the responses in the planting structure. We try to provide empirical evidence for the agricultural output effects and adaptive agricultural structure effects from the high-impact weather.
2 High-impact climate factors and agricultural scale in Guangdong
Guangdong belongs to the tropical and southern subtropical monsoon climate region (20–26°N). The special geological location endows Guangdong with prominent climatic resource superiority, with agricultural production all year round. However, disasters such as low temperature, rainstorms, and high wind take place alternatively throughout the year. In 2018, the rice area was 178.7 × 10⁴ hm2 all over the province, which accounted for 6 percent of the nationwide rice area. The major rice planting area of Guangdong (≥1.0 × 10⁵ hm2) is Zhanjiang, Maoming, Zhaoqing, Jiangmen, Meizhou, Heyuan, Qingyuan, Yangjiang, and Shaoguan (see Figure 1A). Due to the abundant water and heat resources, Guangdong is a major province of vegetable production and outward transportation in China, with a vegetable planting area of 127.2 × 10⁴ hm2 in 2018, including more than 1.0 × 10⁵ hm2 in Guangzhou, Zhanjiang, Qingyuan, Huizhou, and Maoming (see Figure 1B).
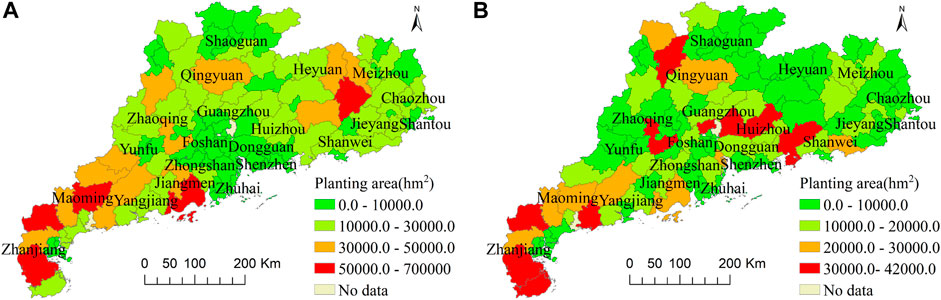
FIGURE 1. The planting area of rice and vegetables in Guangdong in 2018. (A) Rice. (B) Vegetables.
2.1 Variation tendency of high-impact climate factors
We characterize the variation tendency of meteorological factors by a linear regression model by the county-level data from 1992 to 20181. Ten times of model coefficients represent the changing rates of the meteorological factors. The changing rates of spatial distribution are obtained by Kriging’s interpolation method. As shown in Figure 2A, the number of low-temperature days decreases in most areas except for some areas in western and eastern Guangdong, especially in the northern and southern regions, where the decrease rate reaches 1.8–2.5d/10a (day/decade). As shown in Figure 2B, the number of high-temperature days shows is increasing all over the province, with the increase rate ascending from the southwest region to the northeast region. The increase rate is even up to 7.0–9.1d/10a in some areas of northern Guangdong.
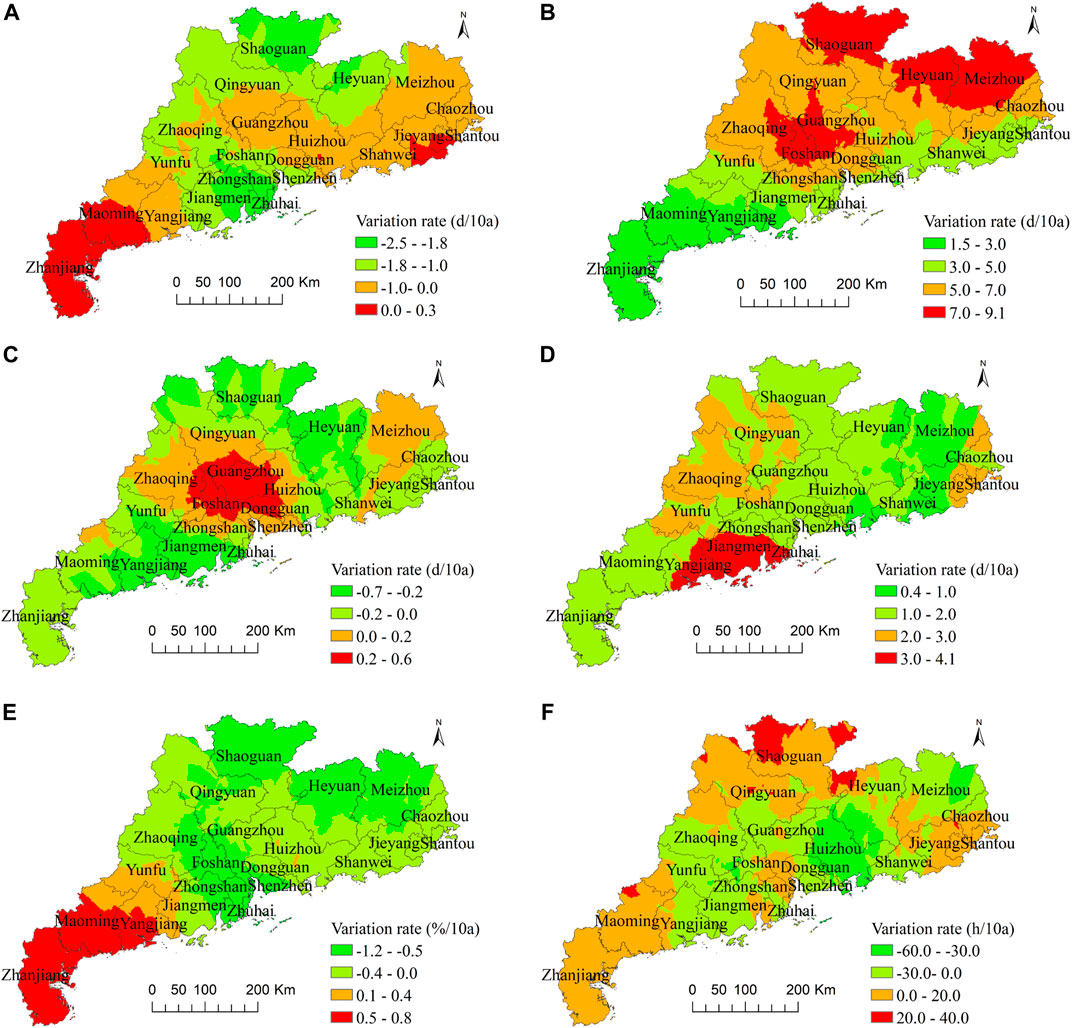
FIGURE 2. The variation tendency spatial distribution of high-impact climate factors in 1992–2018. (A) Low-temperature days. (B) High-temperature days. (C) Rainstorm days. (D) High wind days. (E) Average relative humidity. (F) Total hours of sunshine.
As shown in Figure 2C, the variation tendency in the number of rainstorm days in different regions are remarkably different, with the highest increase rate of 0.2–0.6d/10a in the central region, whereas the decrease rate is up to 0.2–0.7d/10a in northern and the west region. The high wind days show an increasing trend, with the highest increase rate up to 3.0–4.1d/10a in some west regions (Figure 2D). The average relative humidity increases in most of western Guangdong, with the highest increase rate up to 0.4–0.8%/10a, but the other regions like the northern and central regions have a decreasing trend with 0.5–1.2%/10a (Figure 2E). The total hours of sunshine increase in northern regions, most of the western regions, and eastern coastal regions, and decrease in the rest regions, with a higher decrease rate of 30.0–60.0h/10a in central regions (Figure 2F).
2.2 Variation tendency of agricultural outputs
The variation tendency spatial distribution of planting area and the per-unit yield (PUY) from 1992 to 2018 is obtained by the same methods used in characterizing the variation tendency of climate factors. It shows that the planting area of rice in most counties is decreasing fast, especially in central regions, where the decrease rate is up to 12,000–24,000 hm2/10a (Figure 3A), and there is no rice planting in recent years in some counties. The PUY of rice shows a downward tendency in a wider range of the province, including central regions, most parts of northern regions, eastern regions, and most parts of western regions. The decrease rate of PUY is up to 700–1,400kg/(hm2·10a) in some northern regions (Figure 3B). The areas with increased PUY are concentrated in east-central regions and western coastal regions.
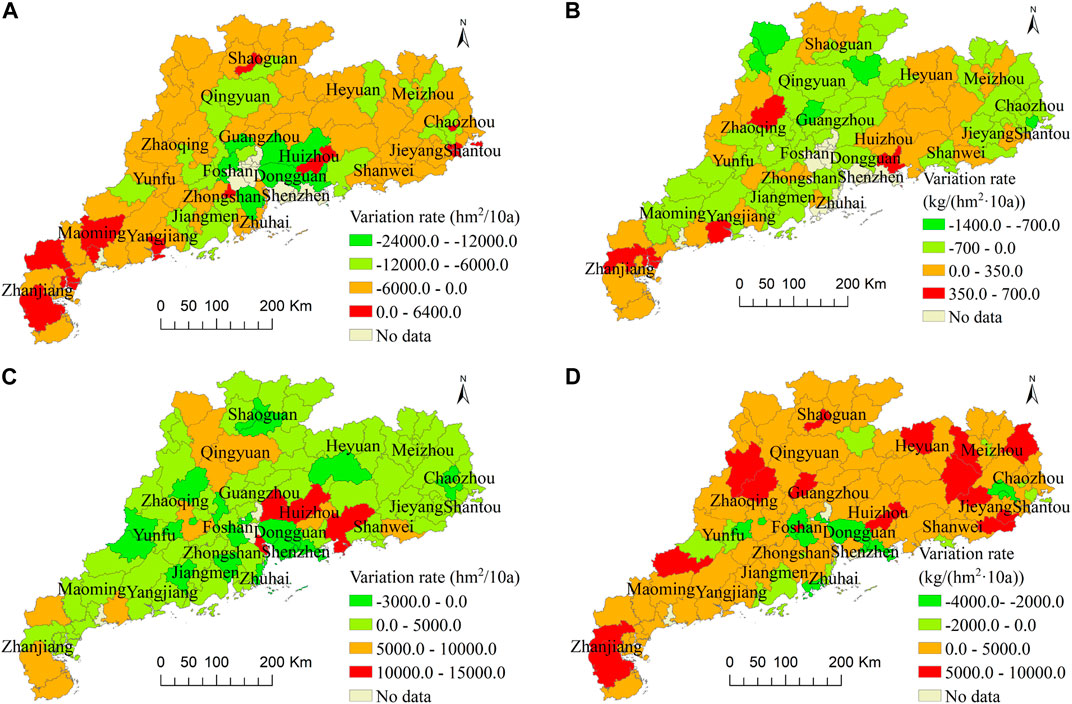
FIGURE 3. Spatial distribution of variation rate of planting area and per unit yield of crops by county in Guangdong province from 1992 to 2018. (A) Rice planting area. (B) Per unit yield of rice. (C) Vegetable planting area. (D) Per unit yield of vegetables.
As shown in Figure 3C, the vegetable planting area shows an upward trend in almost counties. In some central counties, the increase rate of vegetable planting area is10,000–15,000 hm2/10a. As shown in Figure 3D, The PUY of vegetables shows an upward trend in most counties all over the province. The areas with a greater increase rate are scattered throughout the province, with an increased rate up to 5,000–10,000kg/(hm2·10a), A few central counties and eastern counties have a greater decline rate with 2,000–4,000kg/(hm2·10a).
3 Methodology and data
3.1 Model specification and estimation method
As the panel data model includes information in both cross section and time dimensions, it significantly increases the sample volume and overcomes the problem of omission of variables. With the county and time fixed effect in the model and the addition of strict exogenous variables, i.e., other meteorological factors, the estimated relationship between high-impact weather and agricultural output has become more reliable. Inspired by Chen et al. (2016) and Deschênes and Greenstone (2007), we use the two-way fixed effect model as following:
where
Moreover, Section 4.2 will conduct several robustness tests on the results from model (1). Firstly, we add the monomial and quadratic terms of time trend into the basic model (1), namely we suppose the PUY of crops has a nonlinear variation with time; Secondly, considering that crop yield might be affected by the earlier climate factors, we further test the effect that the earlier high-impact weather events have on the crops.
3.2 Variables definition and data
Dependent variable. We use the agricultural output per-unit area to measure the dependent variable. The agricultural output data is from the Rural Statistic Yearbook of Guangdong Province (1993–2019), which collects county-level data about yields and planting areas of rice (including early-season rice and late-season rice) and vegetables in more than 120 counties of Guangdong. The types of vegetable include eggplants, leafy vegetables, root vegetables, pods, fungi, bean sprouts, melons and fruits. The administrative divisions of some regions were adjusted and the number and names of some counties changed as well from 1992 to 2018, which were verified based on historical information. The dependent variable is taken the logarithm in the regression.
Independent variables. Inspired by existing studies (Huang et al., 2014; Feng et al., 2019), we take high-impact weather events including low temperature, high temperature, rainstorms, and high wind that might happen during the planting seasons of rice and vegetables as the independent variables to explain the variation of crop outputs. Table 1 reports the descriptive statistical analysis of the variables. There are 30.9 days on average with a daily average temperature below 12°C in each year, 21.0 days on average with a daily maximum temperature over 35°C, and 7.7 days on average with daily precipitation over 50 mm. The growing seasons of crops are as follows according to their growth characteristics: there are early season rice and late rice in Guangdong and the maximum in-field period is from late February to mid-November each year; vegetables grow throughout the year. The county-level meteorological information is from the meteorological station inside a county or the closest meteorological station outside a county.
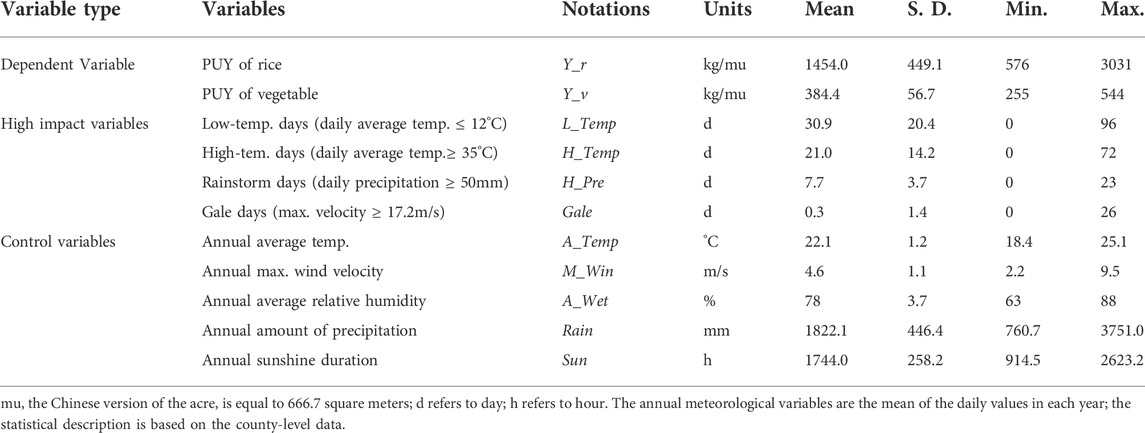
TABLE 1. The statistical description of the variables.
Control variables. According to the study (Huang et al., 2014; Feng et al., 2018; Feng et al., 2019), there are other meteorological factors affecting the crop output, other than the four high-impact weather factors above. Based on the data availability, the control variables include annual average relative humidity, annual sunshine duration, and annual average air pressure. All the meteorological data are from the information recorded in the Climate Center of Guangdong, belonging to the data set from a total of 86 national meteorological stations.
Table 1 reports the descriptive statistical results of the control variables. It shows that from 1992 to 2018 in all counties. The average PUY of rice reaches 1454.0 kg/mu with standard deviation 449.1 kg/mu, which implies there is remarkable difference across the regional and annual PUY of rice. The average PUY of vegetable is 384.4 kg/mu but with a lower standard deviation (56.7 kg/mu). The annually average low-temperature (daily temperature ≤ 12°C) time is near one month (30.9 days) with a lager standard deviation (20.4). There are on average annually 21 days, 7.7 days, and 0.3 days with high-temperature (daily temperature ≥ 35°C), rainstorm (daily precipitation ≥ 50 mm), and Gale (maximum velocity ≥ 17.2 m/s), respectively. The annual average temperature, maximum wind velocity, relative humidity, precipitation, and sunshine duration are 22.1°C, 4.6 m/s, 78 percent, 1822.1 mm, 1744.0 h, respectively.
4 Results and discussions
4.1 Basic results: High-impact weather and agricultural output
Table 2 shows the estimated effects of high-impact weather events on the PUY of rice and vegetables. Columns 1 and 2 are the estimation results for the rice and columns 3 and 4 for the vegetables. Columns 1 and 3 include the independent variables, county and year fixed effects, but exclude the control variables; columns 2 and 4 add all the control variables based on columns 1 and 3. Both columns 1 and 2 show that the rainstorms decrease the rice yield with the significance level of p < 0.01 and that an extra rainstorm day will result in an average 0.25% reduction of PUY each year. Besides, columns 1 and 2 show the coefficients of the low-temperature days, high-temperature days high and wind days are negative but not statistically significant.
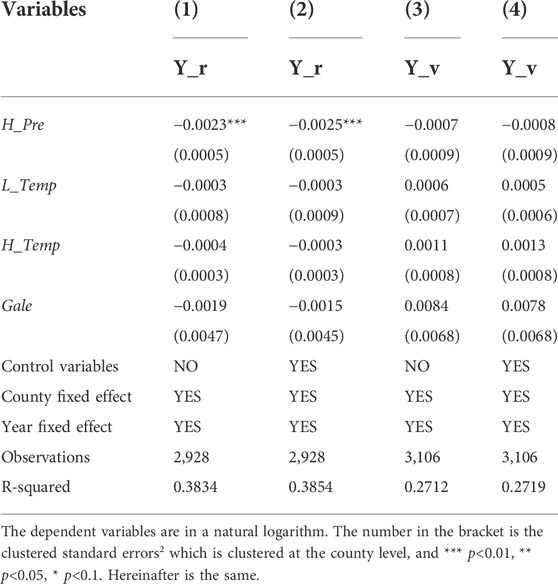
TABLE 2. The effects of meteorological factors on the per unit yield of crops.
Columns 3 and 4 in Table 2 show that high-impact weather factors such as low temperature, high temperature, rainstorm, and high wind have a non-significant effect on the PUY of vegetables. Different from rice and other land-intensive crops, vegetables are of labor intensity. The farmers will input more labor and capital in the vegetable production process, which is conducive to stabilizing output and responding to the impact of unfavorable weather. According to Li and Song (2016), the development of greenhouse vegetables will reduce the impact of climatic disasters on vegetable yields. On the other hand, this paper examines the impact of high-impact weather on the vegetable yield in the long term (at least one year). Although the high-impact weather might hurt the PUY of vegetables in the short term (a week or a month), it can be mitigated by farmers’ later countermeasures and planting structure adjustment. The PUY of vegetable is less susceptible to unfavorable weather since it is of more varieties and more feasible to be protected from bad weather than the rice. In fact, vegetable production in most Chinese areas suffered severely chilling damages in 2008 and 2016. Although the PUY yield of some species of vegetable dropped dramatically after the chilling disaster, like tomato, lettuce, and cucumber, the PUY of all vegetables in either year did not reduce remarkably. The average PUY of vegetables was 21,754.5 kg/hm2 in 2008, slightly down compared with 22,034.6 kg/hm2 in 2007; whereas in 2016 the PUY of vegetables arrived at its peak in the latest 30 years.
4.2 Robustness tests
We further test whether the PUY of crops has a nonlinear function with time, then we test the effects that the earlier high-impact weather has on the crops based on model (1).
(1) Robustness test of a nonlinear time trend. The results in Table 3 obtained from the nonlinear model report that both PUY of rice and vegetables have a monomial time trend with the significance of p < 0.01 and a quadratic time trend with the significance of p < 0.01 (the coefficients are not shown in this Table). Moreover, the estimated result by the nonlinear model is completely consistent with the basic model: rainstorm events hurt the PUY of rice and the other high-impact weather events have no significant impact on it; all the high-impact weather events still have no significant impact on PUY of vegetables.
(2) Robustness test in the lag effects. Table 4 shows the results estimated by the lag effect model in which the high-impact weather factors in the one year lag were added into the model (1) (For the sake of simplicity, the coefficients of high-impact weather factors are reported in the lag while its coefficients in current are not). The results in Column 1 of Table 4 indicate that the high-impact weather factors in the lag have no significant effects on the PUY of rice except for the high wind, and all the high-impact weather factors in the lag have no significant effects on the PUY of vegetables. Moreover, the coefficients of high-impact weather factors in the current are consistent with those in Table 2 in terms of sign and significance.
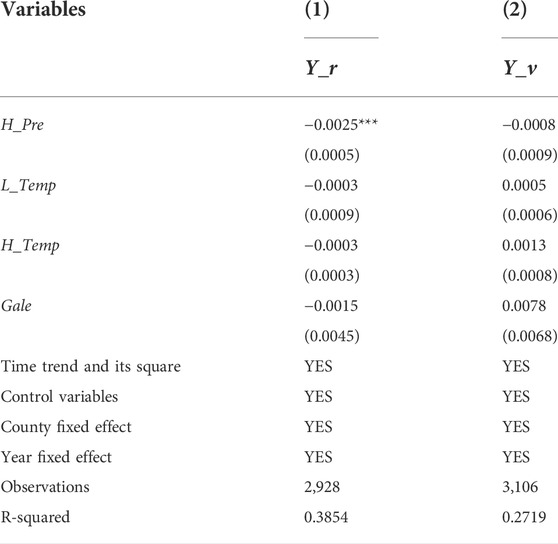
TABLE 3. Robustness test 1: Nonlinear regression results.
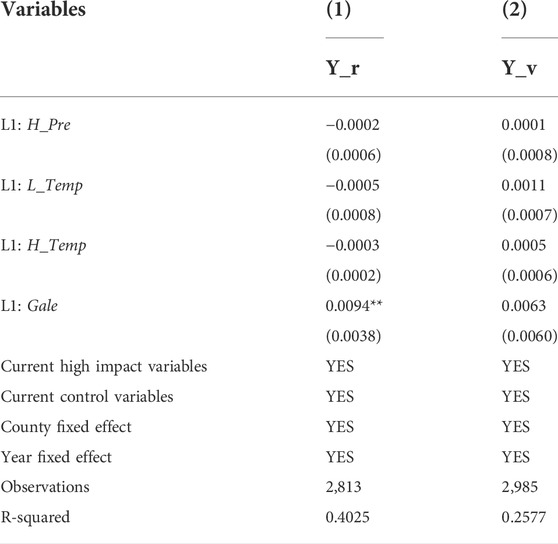
TABLE 4. Robustness test 2: Lag effect.
5 Analysis of the response of the agricultural structure to climate change
The agricultural production’s response to high-impact weather factors is not invariable, and we will further analyze the change of rice planting area to demonstrate this. In this paper, we divide the sample into two subsamples, i.e., 1992–2005 and 2006–2018, respectively. The estimated results in Table 5 are obtained by the model (1), then the corresponding coefficients of high-impact weather factors in the two periods are compared to examine whether the PUY of rice is adaptive to the high-impact weather factors (Note that we do not analyze the response of vegetable planting due to the insignificant coefficients of high-impact weather factors as shown in Table 2). Columns 2 and 3 in Table 5 respectively show the estimated results from the two subsamples, and column 1 is the result from the total sample in Table 2. According to the results in Table 5, the coefficient of the rainstorm is -0.0029 with p < 0.01 in the earlier period (1992–2005), while the corresponding coefficient is -0.0009 with p < 0.1 in the later period (2006–2018). It indicates that, compared with the first period, the second period is exposed to fewer negative effects on the PUY of rice by high-impact weather.
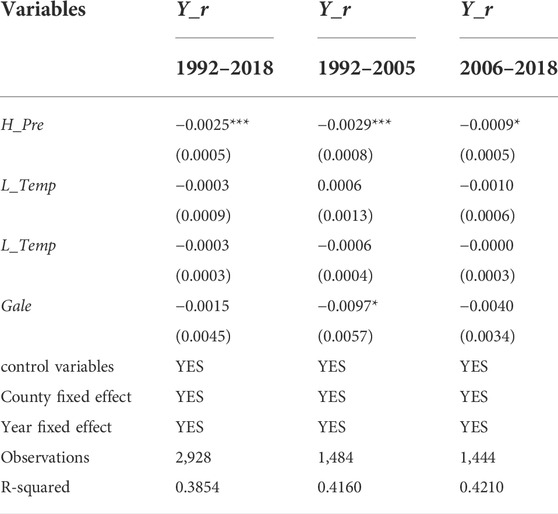
TABLE 5. The PUY of rice changes corresponding with the high-impact weather (1992–2005 vs. 2006–2018).
By GIS spatial analysis tools, the distribution of the change rate regarding cereal planting area (Figure 1A) and that of accumulated rainstorm days (Figure 2C) are used to match the rainstorm days change rate in the regions with the rice planting area change rate in the corresponding regions. Then we can get the average change rate of either rainstorm days or rice planting areas in any region, with the results listed in Table 6. It shows the decreasing rate of the rainstorm days declines in the regions where the rice planting area rises, slightly reduces, and declines, but rainstorm events are increasing in those regions where the rice planting area reduces dramatically. This says that farmers have taken some effective adaptive measures against the unfavorable effect of the heavy precipitation; and that the local rice production in Guangdong has made adaptive changes to the impact of the rainstorms.

TABLE 6. The change rate of rice planting area corresponding with the rainstorm events.
As various crops’ sensitivity to high-impact weather events is remarkably heterogeneous, did farmers adjust the planting area of crops to respond to the events? Data show that the rice planting area in Guangdong presented a quick reduction tendency from 1978 to 2006 and a stabilization tendency after 2006. On the contrary, the planting area of vegetables grew remarkably from 1978 to 2006. The mechanism based on the “climate sensitivity hypothesis” proposed in this paper can make some explanations for this phenomenon. As rice is a land-intensive agricultural product that is highly sensitive to high-impact weather events, farmers gradually reduced the rice area significantly under climate change and meanwhile increased the vegetable area, which is less affected by climate. Over a long period of adjustment, the PUY of rice is less sensitive to the impact of high-impact weather events and the rice area is stable. The empirical results of both Tables 5, 6 prove the hypothesis. Due to the increased input in labor and capital and indigenous knowledge of the sensitivity of plants, vegetables have a higher capacity for resisting natural disasters and are insusceptible to high-impact weather. It implies that farmers could choose to increase the vegetable area on those land where rice had grown, and this adaptive adjustment led to a stable rising tendency for the planting area of vegetables.
6 Conclusion and policy implications
This paper examines the effects that high-impact weather including low temperature, high temperature, rainstorms, and high wind exert on the agricultural outputs in the climate-sensitive regions based on county-level agricultural and meteorological data of Guangdong province from 1992 to 2008, and shows how the regional planting structure responds to climate change. The findings are as follows: (1) the rice planting area declines rapidly in most counties all over the province, with the fastest reduction in the central region of Guangdong; the per-unit yield of rice is declining in most regions except for the east-central areas and western coastal areas in Guangdong; the vegetable area is increasing in almost all regions as well as its per-unit yield; (2) The rainstorm events decrease the per-unit yield of rice, and we find that an extra rainstorm day (daily precipitation above 50 mm) leads to a reduction in the per-unit yield of rice by 0.25% in average. However, high-impact weather events have no effects on the per-unit yield of vegetables; (3) The rice production has become adaptive to the local rainstorm events after the planting structure adjustments. The adaptive adjustment is manifested in the decrease in the rice area in high climate-sensitive regions where vegetables are planted instead, and the increase in the rice area in less climate-sensitive areas.
The following policy suggestions are proposed based on the findings. Firstly, making a division of climate-sensitive regions nationwide and optimizing and adjusting the inter-regional crop planting structure. The existing crop planting structure is mostly adjusted in terms of the crop diversity, land constraints, consumer demand, and industrial chain, but less taking climate change factors into account. The “climate sensitivity hypothesis” proposed in this paper provides a new perspective for the planting of the crops’ structure adjustment and food security assurance plan. Constrained by the realistic factors of economic development, land area, and climatic conditions, there are often limited measures for the intra-regional adjustment of planting structure, with a far less effect of adjustment than cross-regional adjustment. Thus, it is suggested that a nationwide assessment of the influence of climate change on multiple crops should be carried out and a nationwide climate sensitivity zoning map should be drawn according to future climate change prospects. This will provide a scientific reference for the nationwide crop planting structure adjustments. Once the general objective of the nationwide crop planting area is determined, the provincial regions for planting area adjustment should be identified according to the nationwide climate sensitivity zoning map. The less climate-sensitive regions have priority to increase crop planting area, whereas the area of high climate-sensitive crops can be reduced, and the vacant land can be used for other less climate-sensitive crops planting instead.
Secondly, the agriculture department should consider the impacts the climate and non-climate factors have on agricultural production to make the policy more feasible. Adjustment in regional crop planting structure depends on the interactions between internal and external natural factors. In fact, the agricultural planting structure adaptivity to climate change does not merely rely on the causal relationship between agricultural yield and climate change; more importantly, market demand, labor price, technological progress, agricultural policy, and climate change can affect the farmers’ planting plan, such as crop types and area. Therefore, the non-climate factors’ effect on crop outputs shall be assessed by the macro and micro data. Next, a relevant prediction model shall be constructed and a database of non-climate factor change scenarios shall be set to predict the crop planting area. Finally, a variety of crops with planting structure to be adjusted shall be included in the analysis so that the policy with scientific justification can be provided for the adjustment of multiple crops’ planting structure.
Data availability statement
The datasets presented in this study can be found in online repositories. The names of the repository/repositories and accession number(s) can be found below: http://stats.gd.gov.cn/gdnctjnj/
Author contributions
ZZ: Conceptualization, Data curation, Methodology, Writing—Original draft. MJ: Modelling, Software, Writing—Original draft preparation. WC: Data collection, Draft modification. XC: Translation, Writing—Reviewing and Editing.
Funding
This work is supported by the National Natural Science Foundation of China (71903099), 2022 Science and technology think tank Young Talent Program (2141552200201), Special Research Project of the China Meteorological Administration for Decision-making Meteorological Services (JCZX2022007), and the Science and Technology Innovation Team Project of Guangzhou Meteorological service.
Conflict of interest
The authors declare that the research was conducted in the absence of any commercial or financial relationships that could be construed as a potential conflict of interest.
Publisher’s note
All claims expressed in this article are solely those of the authors and do not necessarily represent those of their affiliated organizations, or those of the publisher, the editors and the reviewers. Any product that may be evaluated in this article, or claim that may be made by its manufacturer, is not guaranteed or endorsed by the publisher.
Footnotes
1The regression results are not reported here due to the space limit.
2Clustered standard errors are the measurements that estimate the standard error of the estimated parameter in settings where the observations can be subdivided into smaller-sized groups (clusters) and where the sampling is correlated within each group.
Reference
Adams, R. M., Fleming, R. A., Chang, C. C., McCarl, B. A., and Rosenzweig, C. (1995). A reassessment of the economic effects of global climate change on US agriculture. Clim. change 30 (2), 147–167. doi:10.1007/bf01091839
Burke, M., and Emerick, K. (2016). Adaptation to climate change: Evidence from US agriculture. Am. Econ. J. Econ. Policy 8 (3), 106–140. doi:10.1257/pol.20130025
Chen, S., Chen, X., and Xu, J. (2016). Impacts of climate change on agriculture: Evidence from China. J. Environ. Econ. Manag. 76, 105–124. doi:10.1016/j.jeem.2015.01.005
Dell, M., Jones, B. F., and Olken, B. A. (2014). What do we learn from the weather? The new climate-economy literature. J. Econ. Literature 52 (3), 740–798. doi:10.1257/jel.52.3.740
Deschênes, O., and Greenstone, M. (2007). The economic impacts of climate change: Evidence from agricultural output and random fluctuations in weather. Am. Econ. Rev. 97 (1), 354–385. doi:10.1257/aer.97.1.354
Feng, L., Pang, Y., Zhong, Q., Zhang, B., Chen, Z., and Wang, T. (2019). Impacts of climate variability on crop yields in Hunan Province during 1980-2016. Resour. Sci. 41 (3), 582–590. doi:10.18402/resci.2019.03.15
Feng, X., Liu, M., Chou, H., and Huo, X. (2018). The impacts of asset specificity on specialized farmers’ adaption to climate change: Evidence from apple farmers in Shaanxi province. China Rural. Surv. 4, 74–85.
Hansen, L. T. (1991). Farmer response to changes in climate: The case of corn production. J. Agric. Econ. Res. 43, 18–25. doi:10.22004/ag.econ.138230
Hornbeck, R. (2012). The enduring impact of the American Dust Bowl: Short-and long-run adjustments to environmental catastrophe. Am. Econ. Rev. 102 (4), 1477–1507. doi:10.1257/aer.102.4.1477
Huang, Z., Liu, J., Liu, W., Li, C., and Wang, H. (2014). Assessment of influence of tropical cyclones which land Guangdong on rice yield. J. Nat. Disasters 4, 170–176. doi:10.13577/j.jnd.2014.0422
Kaiser, H. M., Riha, S. J., Wilks, D. S., Rossiter, D. G., and Sampath, R. (1993). A farm-level analysis of economic and agronomic impacts of gradual climate warming. Am. J. Agric. Econ. 75 (2), 387–398. doi:10.2307/1242923
Li, C., and Song, C. (2016). Study of vegetable and fruit products’ price volatility causes and regulatory policies. Issues Agric. Econ. 2, 17–24. doi:10.13246/j.cnki.iae.2016.02.003
Lobell, D. B., Cahill, K. N., and Field, C. B. (2007). Historical effects of temperature and precipitation on California crop yields. Clim. change 81 (2), 187–203. doi:10.1007/s10584-006-9141-3
Lobell, D. B., Schlenker, W., and Costa-Roberts, J. (2011). Climate trends and global crop production since 1980. Science 333 (6042), 616–620. doi:10.1126/science.1204531
Mendelsohn, R., Nordhaus, W. D., and Shaw, D. (1994). The impact of global warming on agriculture: A ricardian analysis. Am. Econ. Rev., 84 753–771.
Olmstead, A. L., and Rhode, P. W. (2011). Adapting North American wheat production to climatic challenges, 1839–2009. Proc. Natl. Acad. Sci. U. S. A. 108 (2), 480–485. doi:10.1073/pnas.1008279108
Pang, Y., Chen, C., Guo, X., and Xu, F. (2021). Analysis of annual climate types and potential yield for single cropping rice in Southwest China during 1961-2015. J. Nat. Resour. 36 (2), 476–489. doi:10.31497/zrzyxb.20210216
Qian, F., Wang, W., and Liu, Y. (2014). Research of adaptive countermeasures of addressing climate change in agriculture field. China Popul. Resour. Environ. 24 (5), 19–24. doi:10.3969/j.issn.1002-2104.2014.05.004
Rosenzweig, C., and Parry, M. L. (1994). Potential impact of climate change on world food supply. Nature 367 (6459), 133–138. doi:10.1038/367133a0
Schlenker, W., Hanemann, W. M., and Fisher, A. C. (2005). Will US agriculture really benefit from global warming? Accounting for irrigation in the hedonic approach. Am. Econ. Rev. 95 (1), 395–406. doi:10.1257/0002828053828455
Schlenker, W., and Roberts, M. J. (2009). Nonlinear temperature effects indicate severe damages to US crop yields under climate change. Proc. Natl. Acad. Sci. U. S. A. 106 (37), 15594–15598. doi:10.1073/pnas.0906865106
Sesmero, J., Ricker-Gilbert, J., and Cook, A. (2018). How do african farm households respond to changes in current and past weather patterns? A structural panel data analysis from Malawi. Am. J. Agric. Econ. 100 (1), 115–144. doi:10.1093/ajae/aax068
Wang, J., Mendelsohn, R., Dinar, A., Huang, J., Rozelle, S., and Zhang, L. (2009). The impact of climate change on China's agriculture. Agric. Econ. 40 (3), 323–337. doi:10.1111/j.1574-0862.2009.00379.x
Keywords: high-impact weather, crops, planting structure, climate sensitivity, vegetable
Citation: Zhai Z, Jiang M, Chen W and Che X (2022) Agricultural outputs and structure adjustments: Empirical evidence based on high-impact weather. Front. Environ. Sci. 10:951607. doi: 10.3389/fenvs.2022.951607
Received: 24 May 2022; Accepted: 29 August 2022;
Published: 28 September 2022.
Edited by:
Zhen Wang, Huazhong Agricultural University, ChinaReviewed by:
Zhijuan Liu, China Agricultural University, ChinaTemitope Samuel Egbebiyi, University of Cape Town, South Africa
Copyright © 2022 Zhai, Jiang, Chen and Che. This is an open-access article distributed under the terms of the Creative Commons Attribution License (CC BY). The use, distribution or reproduction in other forums is permitted, provided the original author(s) and the copyright owner(s) are credited and that the original publication in this journal is cited, in accordance with accepted academic practice. No use, distribution or reproduction is permitted which does not comply with these terms.
*Correspondence: Minxing Jiang, MTg1ODg4NDc1MTVAMTYzLmNvbQ==; Xiahui Che, Y2hleGlhaHVpQHllYWgubmV0