 Ranjeet M. Nagare
 Ali Kiyani1
- 1ARKK Engineering Corp, Sherwood Park, AB, Canada
- 2Earth and Environmental Sciences, University of Waterloo, Waterloo, ON, Canada
- 3Syncrude Canada Ltd., Calgary, AB, Canada
Development of robust reclamation designs would require understanding the relative effects of climate change on the water budget of reclaimed Athabasca oil sands landforms (Alberta, Canada). A surplus water budget is critical to sustain pit lakes and periodically freshen localized surface water ponds within the closure landscape. In this study, four hypothetical future climate scenarios were developed from statistically downscaled RCP2.6 and RCP8.5 climate projections and used in a hydrological model to investigate the potential effects of climate change on the water budget of an in-pit reclaimed oil sands mine landform. The four scenarios allowed the assessment of climate change effects for endpoints that bracket a range of future climate conditions on the water balance of the landform. Surface water and groundwater flow and chloride transport were simulated for the 2024–2100 period using daily climate forcing and the results were compared with equivalent responses under historical climate (1944–2020). The results suggest that the hydrological behavior under historical and RCP2.6 scenarios is similar. The climatic water deficit (potential evapotranspiration exceeding precipitation) will rise significantly under the RCP8.5 scenario. However, the modeling suggests that the water budget of the landform will not be too different from the early 21st century prolonged dry climate period. The chloride released from the landform under the different projected and historical climate scenarios also remained similar. Although evapotranspiration increases and leads to relatively drier conditions, a modest increase in precipitation helps maintain a surplus water budget in most years. The results demonstrate that incorporating future climate projections into water balance analyses is crucial to understand the potential reductions in runoff depths.
1 Introduction
The oil sands are the third-largest proven oil reserve in the world (NRCAN 2022). Open-pit mining in the Athabasca Oil Sands Region (AOSR) involves large-scale excavation of oil sands located near the surface (NRCAN 2022). During mining, the surficial materials from the large open pits are stockpiled in overburden dumps, while the fluid and fine tailings are stored in external and in-pit tailings facilities. As per regulations of the Alberta Energy Regulator (AER), oil sands mine leases are to be reclaimed to a land capability that is equivalent to pre-mining conditions (AER 2022). This is being achieved by creating hydrologically functional landforms that will integrate into the regional boreal setting (Ketcheson et al., 2017; Nagare et al., 2018; Biagi et al., 2021; Nagare et al., 2022). The open pits may be backfilled either with tailings capped with soil and vegetation covers to create terrestrial closure landforms or create pit lakes (in-pit). Fluids are removed from the external tailings facilities at closure to create terrestrial closure landforms (out-of-pit). The overburden dumps typically have some re-contouring applied at closure and are also considered terrestrial closure landforms. Reclaiming of in-pit and out-of-pit terrestrial tailings landforms includes the construction of upland hummocks that drain into low-lying areas where wetlands may or may not form. Following closure re-contouring, the landform is covered with reclamation soil and revegetated. This type of construction mimics the natural boreal systems creating closely coupled surface water and groundwater systems.
The AOSR is located in the boreal region wherein the landscape is made up of treed (deciduous and coniferous) uplands surrounded by wetlands. Water movement in the boreal region is characterized by tight surface water and groundwater coupling (Hayashi et al., 1998; Devito et al., 2012; Ketcheson et al., 2017; Nagare et al., 2022). The climate in the boreal systems is characterized by water deficit and pronounced annual and decadal cycles of water availability wherein potential evapotranspiration (PET) exceeds precipitation on an annual time scale (Devito et al., 2005; Devito et al., 2012). The functioning of the hydrologic system in the Boreal Plains has evolved to store and redistribute water during dry climate cycles and transmit large amounts of water in wet climate periods (Devito et al., 2005; Devito et al., 2012). Such functioning ensures water availability during the prolonged decadal scales of dry periods making ecosystems resilient to the water deficit climate. Field measurements of total annual runoff in the Boreal Plains in Alberta ranges from 0 mm to 90 mm under dry climate conditions and 50 mm–269 mm under wet climate conditions (Devito et al., 2012). Successful reclamation of oil sands landforms would require maintaining of a positive water balance to create hydrologically functional landforms that will integrate into the regional boreal setting. Therefore, it is critical to understand the water budget of reclaimed landforms under future climate including the effects of climate change to develop robust mine reclamation designs.
Future climate change scenarios are described by four “Representative Concentration Pathways (RCP)” developed in the lead-up to the IPCC (2014) report (Moss et al., 2010; Hausfather and Peters 2020)1. The scenarios describe the broad range of greenhouse gases and other radiative forcings in 2,100 (2.6, 4.5, 6.0, and 8.5 W per meter squared). Climate models use these forcings to predict increases in global and regional (through downscaling) temperature and precipitation trends. The RCP2.6 scenario assumes that global warming is mitigated with robust policies and that global temperature rise is kept well below 2°C relative to pre-industrial temperatures (Riahi et al., 2011; van Vuuren et al., 2011). The RCP8.5 scenario assumes that the world will carry on with intensive fossil-fuel use and excludes any climate mitigation policies leading to nearly 5°C of warming by the end of the century (Riahi et al., 2011; van Vuuren et al., 2011). Downscaling of the RCP2.6 and RCP8.5 climate scenarios by Zhang et al. (2019) suggests that the Canadian Prairies, which includes the AOSR, will experience on the order of 1.9°C and 6.5°C and 5.9% and 15.3% increases to annual temperature and precipitation relative to 1986–2005 period, respectively. Although neither of the scenarios2 is likely to occur (Hausfather and Peters 2020; Sognnaes et al., 2021), they provide valid endpoints that bracket a range of future climate conditions for impact analysis. Such endpoints are particularly helpful in probing hydrological responses of local watersheds and for testing the potential water stress for vegetation and water quality within them under changing climate.
All three types of terrestrial closure landforms (in-pit tailings landforms, external tailings landforms, and overburden dumps) may have reclamation soils sourced from active reclamation soil stripping face, stockpiles, or a combination of both. Closure landforms constructed using tailings present unique initial and interim water quality challenges for revegetation and water discharge from the final reclaimed landscape versus overburden closure landforms. For example, tailings sand is used to construct in-pit tailings landforms and the hydraulically placed sand initially has 100% oil sands process affected water (OSPW) which contains elevated levels of salts and other constituents of interest (COIs) (Nagare et al., 2018; Syncrude 2020; Biagi et al., 2021). Understanding the flushing and mobility characteristics of these COIs by meteoric water during wet climate cycles and water availability for vegetation and end pit lakes during dry climate cycles is critical to the long-term success of the oil sands mine reclamation (Ketcheson et al., 2017; Nagare et al., 2018; Nagare et al., 2022).
Syncrude Canada Ltd.’s East-In-Pit (EIP) tailings facility is the first mine-scale in-pit terrestrial closure landform that is currently being constructed to its final closure topography. A relatively smaller portion of the EIP facility, called Sandhill Fen, has been constructed to final closure topographic design and reclaimed since 2012 as a long-term reclamation research site. Meteoric water falling on the reclaimed landform will recharge the uplands and flush the near-surface tailings sand cap over time leading to freshening of the vegetation root zone. This water, along with the dissolved COIs will discharge into the lowland/wetland areas of the landform and eventually flow through the closure drainage channel that connects the EIP landform to another in-pit mine that is being reclaimed as an end-pit lake (Base Mine Lake). Water stress due to dry climate cycles or climate change could reduce the efficiency of the flushing mechanism, lead to evapoconcentration of salts in the landform, and could contribute to water shortage/water quality issues in the end pit lake. Syncrude has consistently evaluated the hydrological and engineering performance of the EIP landform during its construction and made necessary adjustments to ensure the meeting of the reclamation objectives (e.g., Nagare et al., 2022). Alam et al. (2018): Alam et al. (2020) studied the effects of climate change on the hydrology of reclamation soil covers using one-dimensional hydrological models. However, the relative effects of climate change on the hydrology of the oil sands reclaimed tailings landforms as a whole have not yet been investigated. As the EIP is now close to being fully constructed, it provides a first-of-its-kind study case example to evaluate the effects of climate change.
In this study, we used Environment and Climate Change Canada’s (ECCC) statistically downscaled RCP2.6 and RCP8.5 temperature and precipitation projections to investigate the effects of climate change on the total outflow, groundwater levels, and solute mass release from the EIP landform. For this, we modeled three-dimensional (3D) surface water flow, groundwater flow, and solute transport in the EIP for a period of 77 years (2024–2100) following final reclamation using daily climate forcing and compared the results with equivalent response under historical climate (1944–2020). Specifically, we investigated the effects of significant warming, and therefore significantly higher PET, on the water budget, i.e., if the substantially increased climatic water deficit (the difference between cumulative precipitation and PET for a given period when PET exceeds precipitation) in the future adversely affects the hydrological functioning of the closure landform. The objective was to assess the extent of water stress caused by a warming climate on water availability as it relates to the flushing of solutes during the wet climate cycle and the effects of a prolonged dry climate cycle on the water budget of the reclaimed landform and water quality of the end-pit lake. Finally, already downscaled climate projections were used because 1) the primary objective of the study was to understand the effects of climate change on the water budget of the reclaimed landform, 2) the downscaled ECCC climate dataset is accepted by the AER as a reference dataset, and 3) using widely accepted downscaled climate forcings will allow for consistency in comparison between current and future studies in the region for climate change impacts mitigation policy development.
2 Methods
The study case example and modeling methods are described in detail by Nagare et al. (2018) and Nagare et al. (2022). Parts of the description and additional details are provided below.
2.1 Study case example
Syncrude mine site is located 40 km north of Fort McMurray, Alberta, Canada. The study area is shown in Figure 1. The area of the reclaimed watershed modeled in this study is 8.4 km2. The closure design was progressively completed, and the landform was revegetated over multiple years in the past decade. The original mine pit was initially backfilled to varying elevations with composite tailings (CT), a mixture of fluid fine tailings, sand tailings, and gypsum (Syncrude, 2020). Hydraulically placed tailings sand was deposited concurrently with CT in several locations and was also utilized as the capping material. A conceptual cross-section through EIP is shown in Figure 2. To create upland/wetland systems typical of natural systems in boreal forests, cell construction is used to create a series of upland sand hummocks. The areas between hummocks form swales/valleys and the hummock/swale system are sloped towards a flat low-lying area connected to the landform outlet. The low-lying areas are generally intended to evolve into a series of wetlands supporting native wetland vegetation species. The elevated sand tailings hummocks are intended to support treed vegetation and drain into the low-lying wetland areas. At final closure, the outlet of the EIP closure landform will be connected to the Base Mine Lake by a bioengineered closure channel. The hummocks and the low-lying areas between them and throughout the landform are being covered with 0.5 m thick reclamation soil and revegetated based on modeled ecosite type. The soil cover design is generally comprised of salvaged peat overlying a layer of salvaged glacial clay of the same thicknesses (Dobchuk et al., 2012; Nagare et al., 2018). The exact vegetation prescription is still being planned and it is anticipated that typical boreal vegetation will be established. As already introduced, the tailings (sands and CT) are constructed primarily by hydraulically transporting in OSPW and contain elevated levels of salts in pore-fluid initially following their placement.
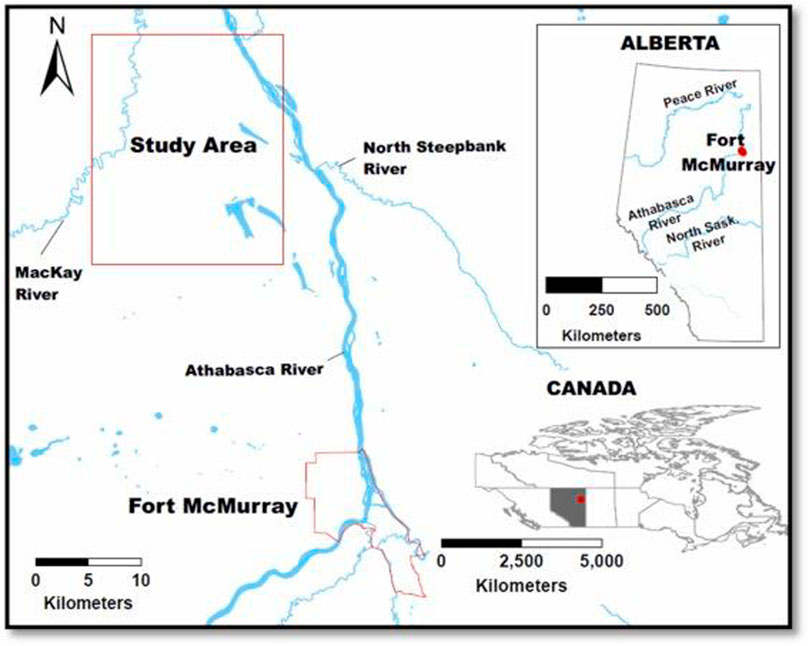
FIGURE 1. Location map.
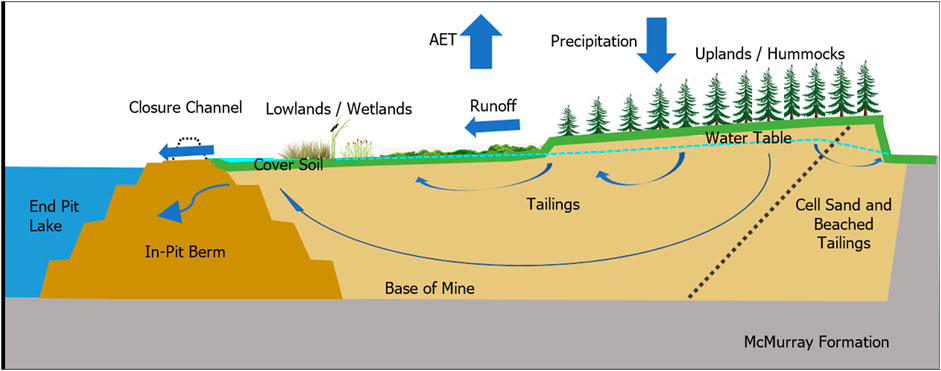
FIGURE 2. Conceptual cross-section showing post reclamation setting and key hydrological components.
2.2 Hydrological model
We used HydroGeoSphere (HGS) (Brunner and Simmons 2011; Aquanty Inc, 2018) to model the surface water and groundwater flow and chloride transport within the landform using daily climate forcing. The model has been successfully used to assess the impacts of climate change on water resources and hydrological changes at the watershed scale (e.g., Pascal et al., 2011; Erler et al., 2019). Irregular triangular prism elements were used to construct the 3D model grid. Each model slice of the surface and subsurface domains was discretized using 78,271 nodes and 155,640 triangular elements of different sizes. The typical hummock dimensions are 150–400 m (width) by 500–1,250 m (length). The node spacing of 20 m or smaller was used to construct the grid. The model was discretized into 13 subsurface numerical layers of varying thicknesses. The surface and subsurface domains were separated by a coupling length of 0.001 m.
Model topography was based on aerial topographic data. Model bottom elevation was based on surveyed mine bottom elevations. The model layers represent the in-pit geometry (pit floor, pit walls, overburden embankments), and include tailings infilling materials and reclamation soils. The base of the mine pit was excavated into McMurray Formation which is a bitumen-filled low permeability geological unit. Therefore, no significant subsurface fluxes are expected to leave the reclaimed landform through the McMurray Formation. Subsurface water transfer will be limited to the shallow subsurface through the tailings sand hummocks. Water input to the landform will be from rain and snow and water transfer out of the landform will be by evapotranspiration (ET) and overland flow at the landform outlet flowing into the closure drainage channel. The ET is controlled by the vegetation distribution over the landform. The uplands (hummocks) were assumed to be vegetated by treed species and the valley invert and other low-lying areas by shrubs and wetland species. The precipitation is assumed to be equally distributed over the entire landform (i.e., no spatial variation). Net percolation is expected to result in flushing of the upper portion of the hummocks prior to seeping into adjacent swales and low-lying wetland areas where it mixes with the overland flow (Nagare et al., 2018).
Daily time-varying fluxes to represent precipitation and potential evapotranspiration boundary conditions were applied to the entire top of the model. Critical depth boundary condition was applied at the top boundary nodes corresponding to the watershed outlets to allow outflow when surface water depth exceeds ground elevation at these locations. Elsewhere, a zero gradient boundary condition was used in both the surface and subsurface domains. Details of mathematical descriptions of the boundary conditions can be found in Aquanty Inc (2018). Model parameters are summarized in Table 1. The parameters were based on model verification and previous studies (e.g., Nagare et al., 2022). The tailings layers were subdivided based on the sand to fines ratios determined from cone penetration tests. Other model parameters are based on laboratory and field investigations completed by Syncrude over the years and literature values (McKenna, 2002; Shurniak and Barbour, 2002; Huang et al., 2018; Lukenbach et al., 2019; Biagi and Carey, 2020; Biagi et al., 2021; Nagare et al., 2022).
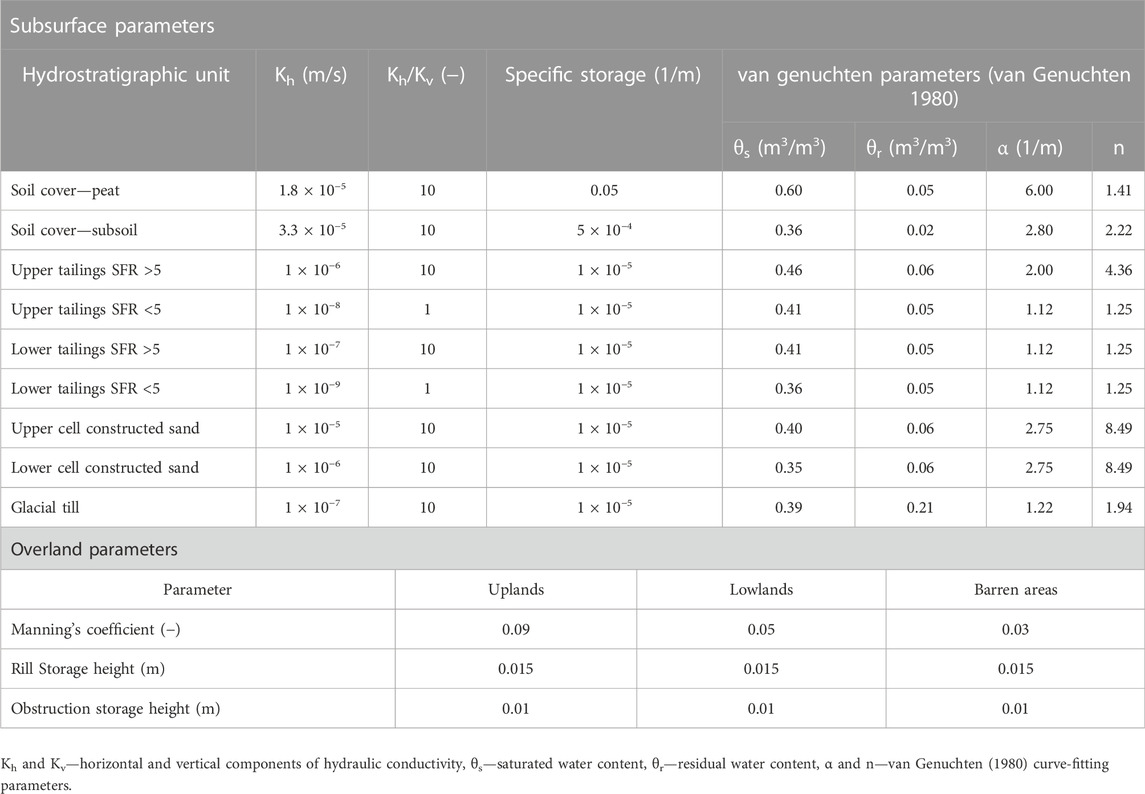
TABLE 1. Model parameters.
Actual evapotranspiration (AET) is calculated in HGS using PET, calculated soil moisture, leaf area index (LAI), rooting depth, and soil moisture limiting parameters, and is based on Kristensen and Jensen’s (1975) formulation (Aquanty Inc 2018). The LAI was modeled as a seasonally varying function with values varying between 0 in winter and peaking in summer. The vegetation was modeled as immature (early stage) in the first 10 years of simulation with peak LAI values reaching 2.1 (wetlands) and 2.6 (uplands). For the remaining 67 years, the mature vegetation LAI peak values of 3.3 (wetlands) and 4.1 (uplands) were used (Barr et al., 2004; Nagler et al., 2004; Bonneville et al., 2008; Huang et al., 2018). Rooting depths of 0.25 m for wetlands and 1 m for uplands were used with quadratic distribution with depth. Soil moisture limiting parameters were based on Huang et al. (2015). It is acknowledged that climate change will also lead to regional changes in vegetation (e.g., Schneider 2013). However, such changes were not considered, and vegetation characteristics were assumed to be based on vegetation as currently planned. Generally, if vegetation is impacted by water availability, it is speculated that AET will decrease and further water conservation would occur (i.e., drier conditions will lead to a shift in vegetation communities that take up less water). Therefore, assuming AET properties for the current vegetation communities is a conservative assumption when assessing the impacts of climate change on the water budget of a reclaimed landform (i.e., drought conditions).
2.3 Climate data
Precipitation and PET time series from historical (1944–2020) and projected (2024–2100) time periods were used as inputs to the hydrological model. Historical daily temperature and precipitation data measured at Fort McMurray Airport climate station was downloaded from the ECCC’s website (ECCC 2022). The daily PET input time series was calculated using Hamon’s (1961) method and calibrated to local published data (Alberta Government 2013). Snowmelt was modeled using the Degree-Day Melt model (Dingman 2002; Carrera-Hernández et al., 2011) and the calculated snowmelt water equivalent was added to the daily precipitation time series. The historical precipitation data shows two distinct prolonged wet (1966–1978) and dry (2006–2017) climate cycles (Figure 3). These types of climate cycles play a key role in boreal hydrology as described by Devito et al. (2012).
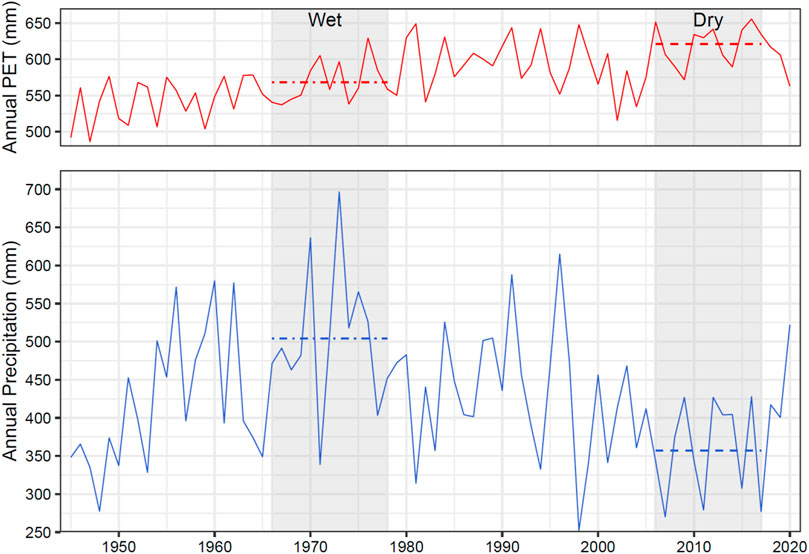
FIGURE 3. 1944–2020 annual precipitation and PET at fort mcmurray airport climate station. The dashed lines show the average value for the wet and dry periods.
Statistically downscaled multi-model ensembles of modeled climate time series for historical simulations and different climate change scenarios at a 10 km grid resolution, are available from ECCC (ECCC 2021). These datasets have been developed by downscaling outputs from 24 global climate models using the Bias Correction/Constructed Analogues with Quantile mapping version 2 (BCCAQv2) algorithm (Werner and Cannon 2016; ECCC 2021). The median (50 percentile) monthly total precipitation and mean air temperature (the highest resolution of the downscaled climate projection) at the grid point of Fort McMurray Airport for the period of 1951–2100 were used for generating projected climate data time series. The precipitation (%) and temperature (°C) anomalies for the 2024–2100 period were calculated with reference to the 1986–2005 period consistent with the methodology used by Zhang et al. (2019). The standard meteorological seasons were used, i.e., March to May (spring), June to August (summer), September to November (fall), and December to February (winter). Anomalies represent the difference between the value of a climate variable for a season in a given year and the average value of the reference period (Charron 2016). The historical data shows strong seasonal precipitation patterns, while precipitation increases in the downscaled climate projection data are concentrated in the winter months. This leads to differences in the long-term, annual, and seasonal trends in the anomalies. Therefore, seasonal linear trends were developed from the calculated monthly anomaly datasets to account for the seasonal trends in the historical and climate projection data (Figure 4). The projected (2024–2100) climate time series were developed by adding the seasonal monthly anomalies derived from the linear trends to the historical daily precipitation and temperature time series. Linear trends were used because the daily historical precipitation and temperature data already include daily, seasonal, and annual variations. Note that the 1944–2020 daily historical temperature time series was detrended before using it to develop the future climate time series.
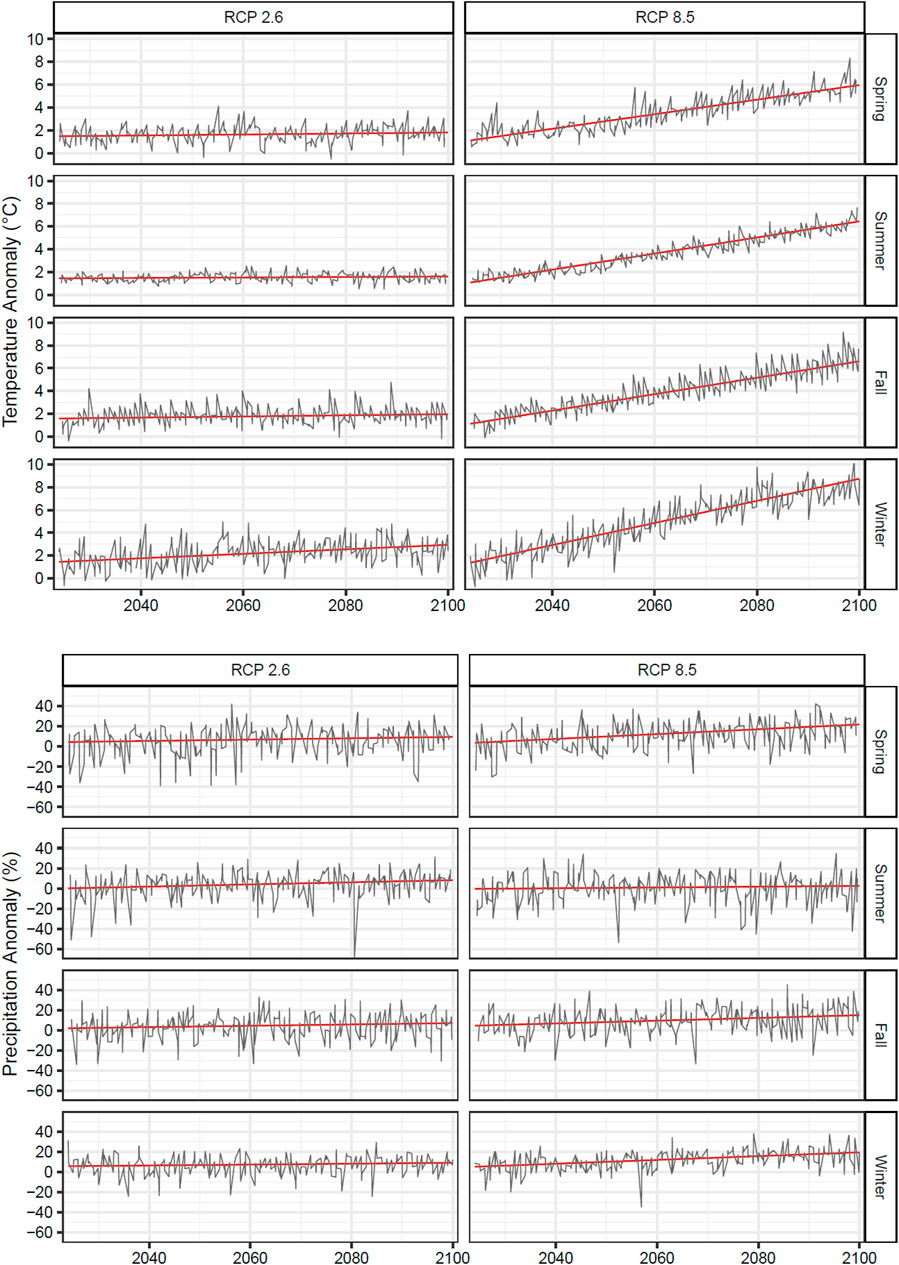
FIGURE 4. Seasonal temperature (top) and precipitation (bottom) anomalies for climate change scenarios relative to 1986–2005.
The wettest and driest periods (with respect to the overall historical precipitation average) in the historic climate time series are from 1966 to 1978 and 2006–2020, respectively (Figure 3). Therefore, four daily climate series were constructed to represent dry and wet conditions at the end of the century for the RCP2.6 and RCP8.5 scenarios. The two dry condition time series were constructed by adding the RCP2.6 and RCP8.5 anomalies from linear trends to the historic daily precipitation and temperature data. The wet climate condition time series were constructed by adding the linear RCP2.6 and RCP8.5 anomaly trends to a rearranged 1979–2020 to 1944–1978 sequence of historic daily climate time series (Table 2). Using the four climate time series as described above allows for the assessment of the effects of the climate change endpoints that bracket a range of future climate conditions (i.e., precipitation and temperature increase at the end of the century) to be overlain by the historical wet and dry cycles. Thus, including the historic climate scenario, a total of five climate scenarios were developed (Table 2; Figure 5).
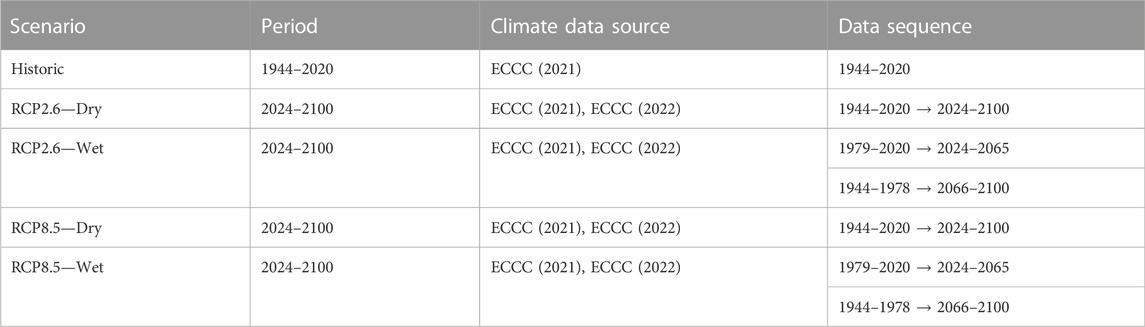
TABLE 2. Modeled climate scenario description.
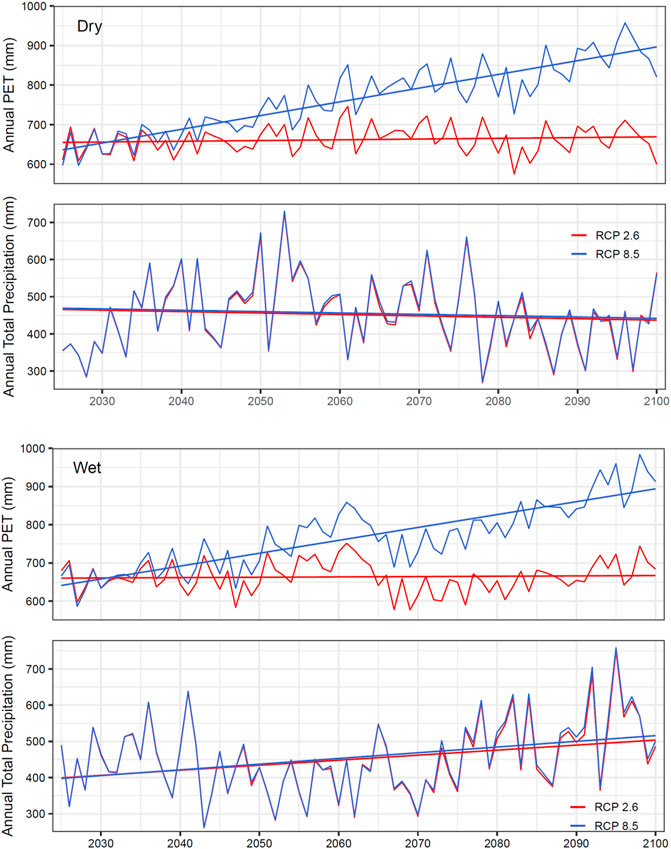
FIGURE 5. Projected precipitation and PET for RCP2.6 and RCP8.5 dry (top) and wet (bottom) climate scenarios.
Based on the calculated seasonal anomalies (Figure 4), winter precipitation increases of 9.5% and 17.6% for RCP2.6 and RCP8.5, respectively, are projected by the end of the century relative to the 1986–2005 period. This increase in winter precipitation however does not lead to a significant annual increase (Table 3; Figure 5 and Figure 6A) because most precipitation in the Fort McMurray area falls in summer as convective storms of high intensity and short durations (Devito et al., 2005). In contrast, the increase in PET due to 1.9°C and 6.5°C change for RCP2.6 and RCP8.5 scenarios is substantial (Table 3; Figure 5 and Figure 6B). The annual PET for the last decade of the century exceeds precipitation by on the order of 251, 468, 138, and 347 mm for RCP2.6 and RCP8.5 dry and wet scenarios, respectively. In comparison, the climatic water deficit for the 1986–2005 reference period was 160 mm.
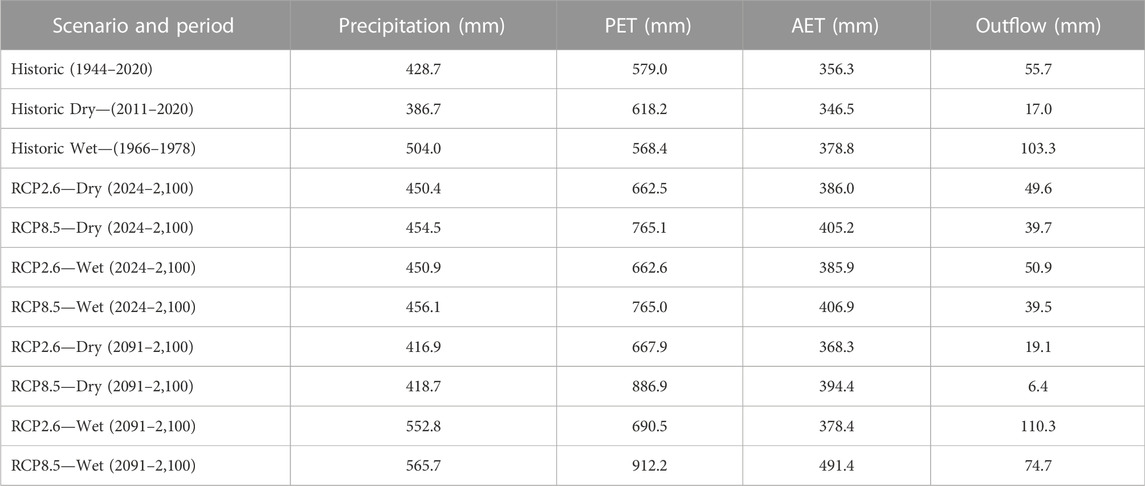
TABLE 3. Annual averages—precipitation and potential evapotranspiration (PET) and modeled outflow and actual evapotranspiration (AET).
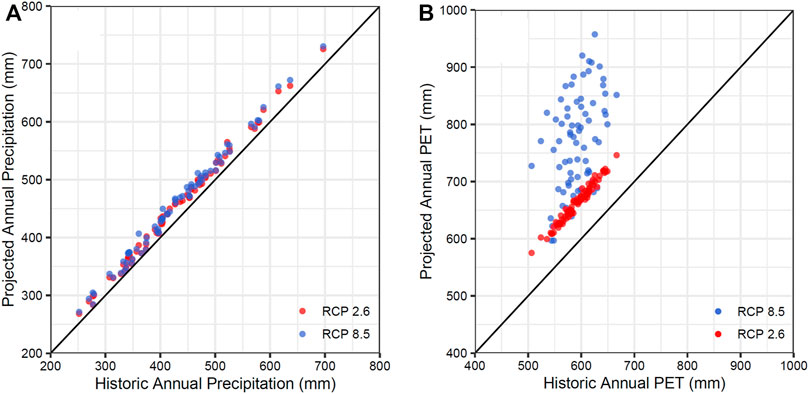
FIGURE 6. Annual (A) precipitation and (B) potential evapotranspiration (PET)—historical measured versus projected for RCP2.6 and RCP8.5 dry climate scenarios.
3 Results and discussion
3.1 Three-dimensional HydroGeoSphere model verification
Model verification is described in detail by Nagare et al. (2022) and is briefly reproduced here. Full model calibration of the 3D transient HGS model was not possible as the closure landform is not yet fully built, and the long-term monitoring dataset is not available. Therefore, the model performance was verified for available data from within the partially built landform and based on data from regional natural and reclaimed watersheds. Transient modeling was used because the hydrological responses are transient in nature and there is no true or pseudo-steady-state that can describe the long-term evolution of the water balance of the boreal region (Devito et al., 2005; Carrera-Hernández et al., 2011; Devito et al., 2012). Although steady-state models could be useful in certain circumstances such as deriving initial conditions (Lamontagne-Hallé et al., 2020), transient modeling of coupled flow and transport processes driven by climate forcings, and near-surface interactions provides better insights as compared to steady-state models (e.g., Carrera-Hernández et al., 2011; Lamontagne-Hallé et al., 2020; Langford et al., 2020).
Groundwater elevations in an adjoining research plot and other areas within the partially built landform are available for a limited time period. The measured and simulated groundwater table elevations matched within 2 m for the period of measurements. Seepage flux measurements from toe drains within the dykes of the partially built landform were also available. The modeled seepage rate of 6.4 L/s agrees reasonably with the measured seepage rate of 5.3 L/s. Measured actual evapotranspiration (AET) data from an adjoining reclaimed overburden dump is available for the 2003–2015 period (Huang et al., 2018). The two landforms are different in characteristics and therefore not directly comparable. The simulated AET from the EIP landform of 354 mm–400 mm is fairly comparable to the measured 370 mm–450 mm range from the adjoining landform.
3.2 Model simulations
Results of the 3D coupled water flow and chloride transport simulations for the different climate change scenarios were compared with the historical climate simulations based on annual water balance, groundwater elevations in representative upland and lowland areas, and chloride mass release at the landform outlet.
3.2.1 Water outflow, actual evapotranspiration, and groundwater table elevations
The model simulations for the different climate scenarios were conducted using daily input time steps as discussed in Sections 2.2, 2.3. The differences in the long-term annual averages of the outflow between the scenarios are predominantly from the effects of increased AET (Table 3). However, the long-term annual averages do not provide the complete picture or are less meaningful in describing the effects of climate change on the hydrological functioning of EIP. The modeled annual average outflow and AET from the landform under the historical climate and under the climate change scenarios show great variability (Figure 7). The variability is predominantly a result of the effects of the prolonged interannual climate cycles. This climate variability drives the storage and slow-release processes from the landform and therefore modulates the amount of overland runoff. The annual averages for the wet and dry cycles within the different climate scenarios provide an improved picture of the effect of climate change from the landform designed and built with the intention to support the natural hydrological functions of the natural boreal systems. The significant increase in climatic water deficit does not translate into the same magnitude of change to the outflow from the reclaimed landform. The dry and wet cycle outflow results for historic and RCP2.6 scenarios are identical. The outflow during 2091–2100 for the RCP8.6 wet climate scenario is reduced by on the order of 29 mm, which is a 27% decrease compared to the historic wet period. This is a direct result of the substantial increase in PET leading to increased AET (378.8 vs. 491.4 mm). However, the moderately higher precipitation and the negative feedback from shutting down of evapotranspiration in the wetland areas as well as the storage during the different climate cycles regulates the effects of climatic water deficit. This leads to outflow from the system even during the anticipated very dry conditions of the RCP8.5 dry climate scenario (Table 3; Figure 7). The simulated runoff depths under the different climate scenarios (Table 3) compare well with the measured runoff in the Boreal Plains, which ranges from 0–90 mm per year under dry climate conditions to 50–269 mm under wet climate conditions (Devito et al., 2012).
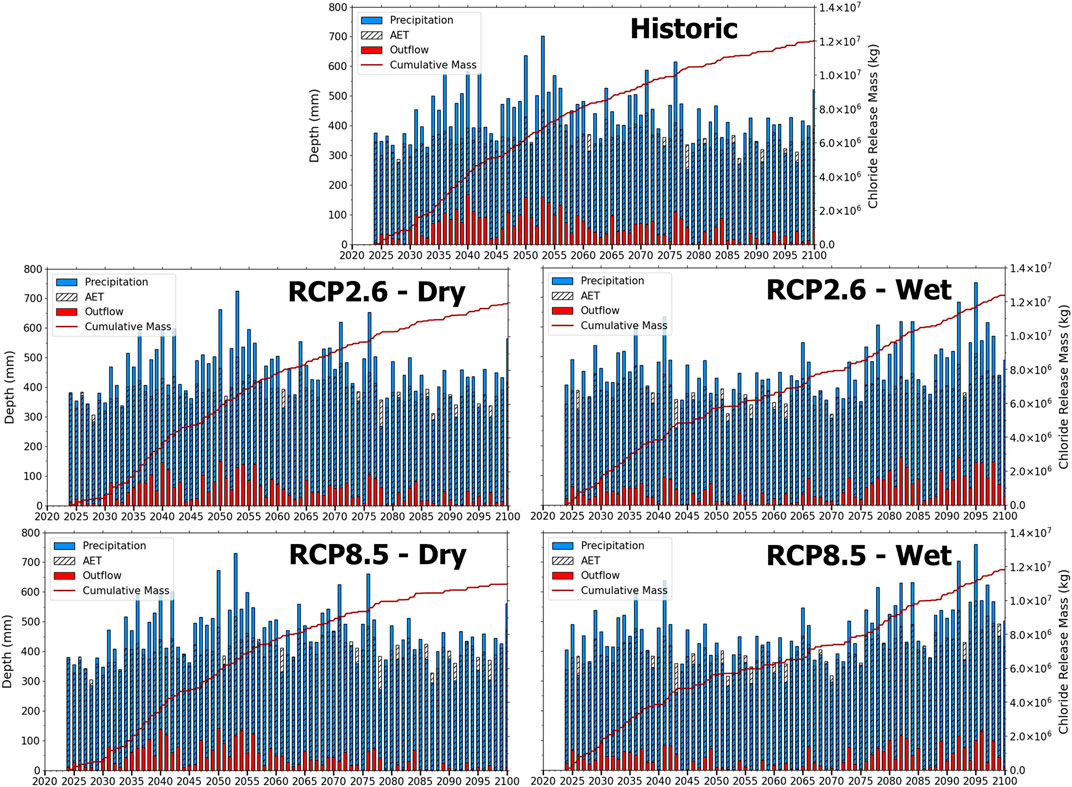
FIGURE 7. Precipitation, outflow, actual evapotranspiration (AET) and chloride mass loading for the five model simulations.
The storage mechanisms of the reclaimed landform built to replicate the natural boreal systems also ensure the dampening of the effects of warming on groundwater table elevations (Figure 8). Other than the variability during the different prolonged climate cycles, groundwater table elevations both in upland and wetland areas show similar behavior during all the simulations. The groundwater table for the RCP8.5 scenario drops by less than 0.5 m in the upland and less than 0.1 m in the wetlands areas as compared to the historic climate scenario. This is primarily because of the storage and slow-release mechanism from the landform driven by the long interannual wet and dry climate cycles. In short, more water is stored during the dry periods due to the shutting down of evapotranspiration, which is the major water export mechanism, and the system transmits large amounts of water during the wet climate cycles. The model results suggest that the system shows resiliency during the RCP8.5 dry climate scenario primarily by reducing the outflow while maintaining the subsurface storage.
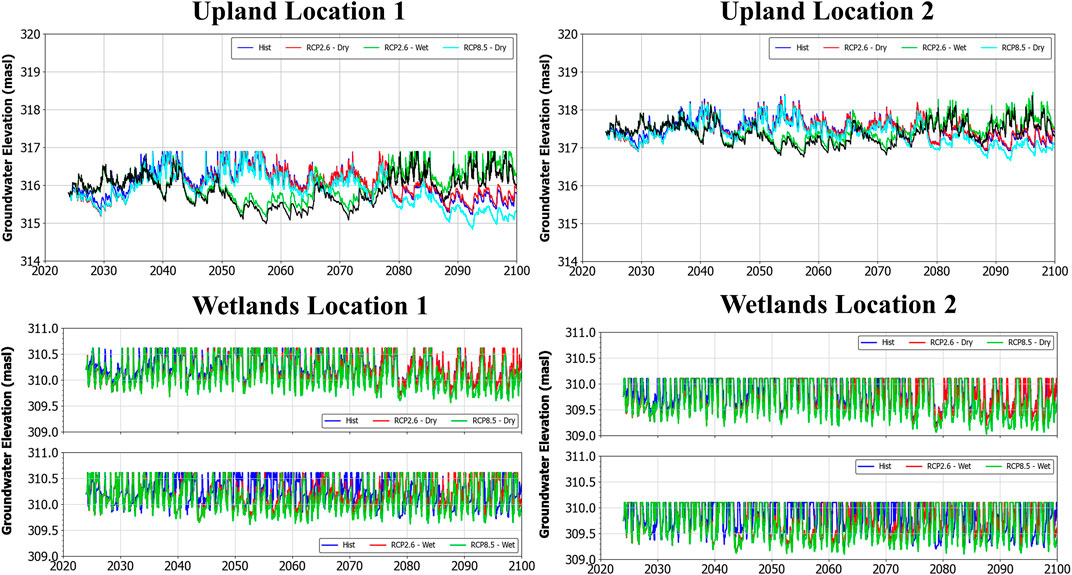
FIGURE 8. Groundwater table elevations in upland and wetlands areas of the reclaimed landform for the different climate scenario simulations.
3.2.2 Chloride mass release
The chloride mass release in the outflow is indicative of the flushing characteristics of the reclaimed landform. The model results suggest that the landform would shed on the order of 12 × 106 kg (kg) chloride mass for the historic climate scenario (Figure 7). As described in Nagare et al. (2022), the reclaimed landforms will store solute mass during dry periods and discharge this load during the wet climate cycles. A similar effect is seen in Figure 7. The solute mass release is identical for the historic climate scenario and the RCP2.6 dry climate scenario. The modeled chloride mass release for the RCP8.5 dry climate scenario is on the order of 1 × 10⁶ kg lower than the historic and RCP2.6 dry climate scenario model results. The approximately 8% less efficient flushing occurs after 2075, before which the cumulative mass release is identical to the historic and RCP2.6 dry climate scenarios. This lesser efficiency is directly a result of the reduction in the outflow for the RCP8.5 dry climate scenario (15.7 mm average) compared to 29.6 mm and 31 mm annual average outflows for historical and RCP2.6 climate scenarios for the 2075–2100 period. In comparison, the total mass released from the landform at the end of the century for the RCP2.6 scenario is 0.5 × 10⁶ kg greater than the historical climate scenario and identical to the historical climate scenario for the RCP8.5 scenario.
The model results of the RCP2.6 and RCP8.5 wet climate scenarios, for which the dry climate cycle is assumed to occur in the early part of the century, highlight the effects of the storage characteristics of the landform on chloride mass release. The mass is stored during the dry cycle between 2050 and 2075 and rapidly released with increased outflow in response to the wetter climate towards the end of the century (Figure 7 and Figure 9). Approximately 4 × 10⁶ kg chloride mass is released during the last 25 years in these scenarios as compared to 2.3, 2.5, and 1.8 × 10⁶ kg chloride mass during the historic, and RCP2.6 and RCP8.5 dry climate scenarios. The different release rates during the different periods (Figure 9) of the next century clearly highlight the effects of the interannual climate variability, specifically the prolonged wet and dry cycles, and the storage and slow-release mechanisms of the boreal systems during dry periods and ability to move large amounts of water during wet climate cycles.
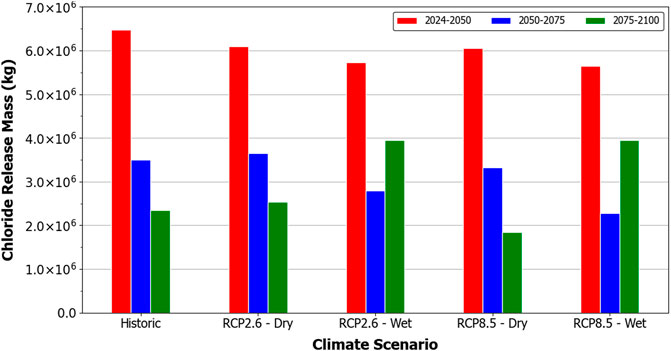
FIGURE 9. Cumulative (by period) chloride release mass for the different climate scenarios.
4 Conclusion
The relative effects of climate change on the water balance of the oil sands reclaimed tailings landforms as a whole have not yet been investigated. Syncrude’s EIP landform is close to being fully constructed and vegetated in the next few years and provides a first-of-its-kind study case example to evaluate the effects of climate change. We used ECCC’s downscaled RCP2.6 and RCP8.5 scenarios for the 2024–2100 period to develop four temperature and precipitation time series by perturbing the measured 1944–2020 historic time series with the projected temperature and precipitation anomalies. The resulting data series provided climate endpoints that bracket a range of future climate conditions. The climate time series were used in a hydrological model to investigate the effects of climate change on the hydrological responses of the landform. Surface water and groundwater flow and solute transport was simulated within the landform for the 2024–2100 period under daily climate forcings for four climate change scenarios and compared the results with equivalent responses under historical climate.
The comparison of the modeled and measured runoff depths suggests that the reductions in runoff due to climate change do not translate into disturbing the water balance of the reclaimed closure landform beyond the range of historical natural variability of Alberta’s Boreal Plains.
This is primarily because of the apparent success in the creation of a closure landform that uses reclamation soil and revegetation establishment to effectively recreate the hydrology of the natural boreal systems, which themselves have developed in a way that generally mitigates the effects of the prolonged climate cycles. The negative feedback from shutting down of AET, and storage and slow release during dry periods lead to maintaining the effectivity of the hydrological and flushing mechanisms of the landform even during the extremely dry conditions of the RCP8.5 dry climate scenario. Modeling suggests that the hydrological functioning of the landform under future climate would mobilize solutes equivalent to historical levels during the wet periods and provide water for sustaining vegetation and end pit lakes during dry climate cycles. However, the engineers and planners need to consider the reductions under extreme dry climate for pit lake water balance (RCP8.5 dry climate) and understand the capacity of the pit lakes to accommodate the rapid solute mass release during wet periods (RCP2.6 and RCP8.5 wet climate). Overall, these are important insights for the decision-makers working on the reclamation and closure of oil sands in-pit landforms, which will make up most of the landforms in the final reclaimed mine sites. The results of the different modeling scenarios also provide a long-term dataset for the engineers to make decisions on adjusting the mine reclamation designs for similar landforms throughout the oil sands industry.
This study was comprehensive in including all the important hydrological processes. The future hydrology of the EIP landform is modeled with a large degree of uncertainty in climate data and thus the results should be regarded as a first approximation until further research addresses the limitations. Uncertainty analysis was not completed because the previous modeling of the EIP landform has shown that the uncertainty from climate forcings exceeds the parametric uncertainty (Nagare et al., 2022). In addition, because the landform is not yet fully built, the data for testing of conceptual structural uncertainties such as boundary conditions are not yet available. The study assumes the patterns of precipitation for the climate change scenarios to be equal to the historical ones, however, the changes to precipitation magnitude were considered based on calculated anomalies in RCP scenarios. The modeling also does not consider the potential changes to the vegetation due to climate change (e.g., Schneider 2013; Rooney et al., 2015) and the associated changes to the hydrological feedback mechanisms. It is recommended that future studies targeted at evaluating the effects of climate change on the hydrology of reclaimed oil sands landforms investigate the effects of changes to precipitation patterns and vegetation (e.g., Yu et al., 2021).
Data availability statement
The datasets presented in this article are not readily available because Data availability is subject to approval by the client. Requests to access the datasets should be directed to ranjeet.nagare@arkkeng.ca.
Author contributions
Data collection—RN, AK, RW, DH, GM Conceptualization, Modeling, and Analysis—RN, Y-JP, RW Manuscript—RN, AK, Y-JP, RW, DH, GM Approval—DH, GM.
Conflict of interest
RN, AK, YP, and RW are employed by ARKK Engineering Corp. DH and GM are employed by Syncrude Canada Ltd.
Publisher’s note
All claims expressed in this article are solely those of the authors and do not necessarily represent those of their affiliated organizations, or those of the publisher, the editors and the reviewers. Any product that may be evaluated in this article, or claim that may be made by its manufacturer, is not guaranteed or endorsed by the publisher.
Footnotes
1It should be noted that Shared Socioeconomic Pathways (SSPs) were also developed in parallel to RCPs (Riahi et al., 2017). The RCPs set pathways for greenhouse gas concentrations and, effectively, the amount of warming that could occur by the end of the century. Whereas the SSPs set the stage on which reductions in emissions will—or will not—be achieved. Downscaling of SSPs has not been yet completed for the AOSR and the objective of this study was to use available climate scenarios to understand the impacts on the water balance of reclaimed landforms. Therefore, the discussion is limited to RCPs and the use of projected increases in temperature and precipitation for the downscaled RCP2.6 and 8.5 climate scenarios.
2The RCP2.6 scenario is not likely to occur in the future because it is occurring in the present. It is likely based on the current emission trajectory that the RCP2.6 scenario will be exceeded. However, climate mitigation policies and future commitments will likely reduce the rate of GHG emissions to a level that potentially will fall below the RCP8.5 scenario.
References
AER (Alberta Energy Regulator) (2022). Land conservation and reclamation – guidelines for mines. Available at: https://www.alberta.ca/land-conservation-and-reclamation-guidelines-for-mines.aspx (Last retrieved on January 6, 2022).
Alam, M. S., Barbour, S. L., Elshorbagy, A., and Mingbin, H. (2018). The impact of climate change on the water balance of oil sands reclamation covers and natural soil profiles. J. Hydrometeorol. 19, 1731–1752. doi:10.1175/JHM-D-17-0230.1
Alam, M. S., Barbour, S. L., Huang, M., and Li, Y. (2020). Using statistical and dynamical downscaling to assess climate change impacts on mine reclamation cover water balances. Mine Water Environ. 39, 699–715. doi:10.1007/s10230-020-00695-6
Alberta Government (2013). Evaporation and evapotranspiration in Alberta 1912-2009. Prepared in April 2013.
Aquanty Inc (2018). HydroGeoSphere. A three-dimensional numerical model describing fully- integrated subsurface and surface flow and solute transport. Ontario, Canada: Waterloo. Retrieved from: https://www.aquanty.com/hgs-download.
Barr, A. G., Black, T. A., Hogg, E. H., Kljun, N., Morgenstern, K., and Nesic, Z. (2004). Inter-annual variability in the leaf area index of a boreal aspen-hazelnut forest in relation to net ecosystem production. Agric. For. Meteorology 126, 237–255. doi:10.1016/j.agrformet.2004.06.011
Biagi, K. M., and Carey, S. K. (2020). The role of snow processes and hillslopes on runoff generation in present and future climates in a recently constructed watershed in the Athabasca oil sands region. Hydrol. Process 34, 3635–3655. doi:10.1002/hyp.13836
Biagi, K. M., Clark, G. M., and Carey, S. K. (2021). Hydrological functioning of a constructed peatland-watershed in the Athabasca oil sands region: Potential trajectories and lessons learned. Ecol. Eng. 166, 106236–106314. doi:10.1016/j.ecoleng.2021.106236
Bonneville, M. C., Strachan, I. C., Humphreys, E. R., and Roulet, N. T. (2008). Net ecosystem CO2 exchange in a temperate cattail marsh in relation to biophysical properties. Agric. For. Meteorology 148, 69–81. doi:10.1016/j.agrformet.2007.09.004
Brunner, P., and Simmons, C. T. (2011). HydroGeoSphere: A fully integrated, physically based hydrological model. Groundwater 50 (2), 170–176. doi:10.1111/j.1745-6584.2011.00882.x
Carrera-Hernández, J. J., Mendoza, C. A., Devito, K. J., Petrone, R. M., and Smerdon, B. D. (2011). Effects of aspen harvesting on groundwater recharge and water table dynamics in a subhumid climate. Water Resour. Res. 47 (5), 542–560. doi:10.1029/2010wr009684
Charron, I. (2016). A guidebook on climate scenarios: Using climate information to guide adaptation research and decisions, 2016 edition. Montreal, Quebec: Ouranos, 94. Available at: https://www.ouranos.ca/publication-scientifique/Guidebook-2016.pdf.
Devito, K. J., Creed, I. F., and Fraser, C. (2005). Controls on runoff from a partially harvested aspen forested headwater catchment, Boreal Plain, Canada. Hydrol. Process. 19, 3–25. doi:10.1002/hyp.5776
Devito, K., Mendoza, C., and Qualizza, C. (2012). “Conceptualizing water movement in the boreal plains. Implications for watershed reconstruction,” in Prepared for the Canadian oil sands network for research and development (Environmental and Reclamation Research Group), 164. doi:10.7939/R32J4H
Dingman, S. L. (2002). Physical hydrology (second edition). Englewood, Long Grove, IL: Waveland Press Inc., 646.
Dobchuk, B. S., Shurniak, R. E., Barbour, S., O’Kane, M. A., and Song, Q. (2012). Long-term monitoring and modelling of a reclaimed watershed cover on oil sands tailings. Int. J. Min. Reclam. Environ. 1, 1–22.
ECCC (Environment and Climate Change Canada) (2022). Past weather and climate - historical station data for Fort McMurray A weather station. Available at: https://climate.weather.gc.ca/historical_data/search_historic_data_e.html (Last accessed on June 30, 2022).
ECCC (Environment and Climate Change Canada) (2021). Portal for access and download Canadian climate data. www.climatedata.ca (accessed April 18, 2021).
Erler, A. R., Frey, S. K., Khader, O., d'Orgeville, M., Park, Y-J., Hwang, H-T., et al. (2019). Evaluating climate change impacts on soil moisture and groundwater resources within a lake-affected region. Water Resour. Res. 55 (10), 8142–8163. doi:10.1029/2018wr023822
Hamon, W. R. (1961). Estimating potential evapotranspiration: Journal of the hydraulics division. Proc. Am. Soc. Civ. Eng. 87, 107–120. doi:10.1061/jyceaj.0000599
Hausfather, Z., and Peters, G. P. (2020). Emissions – The ‘business as usual’ story is misleading. Nature 577, 618–620. doi:10.1038/d41586-020-00177-3
Hayashi, M., van der Kamp, G., and Rudolph, D. L. (1998). Mass transfer processes between a prairie pothole and adjacent uplands, 1: Water balance. J. Hydrol. 207, 42–55. doi:10.1016/s0022-1694(98)00098-5
Huang, M., Barbour, S., and Carey, S. (2015). The impact of reclamation cover depth on the performance of reclaimed shale overburden at an oil sands mine in Northern Alberta, Canada. Hydrol. Process. 29, 2840–2854. doi:10.1002/hyp.10229
Huang, M., Ireson, A., Barbour, S. L., DeMars, S., and Appels, W. M. (2018). Fully coupled heat and water dynamics modelling of a reclamation cover for oil sands shale overburden. J. Hydrol. 344 (3), 198–209.
Ketcheson, S. J., Price, J. S., Sutton, O., Sutherland, G., Kessel, E., and Petrone, R. M. (2017). The hydrological functioning of a constructed fen wetland watershed. Sci. Total Environ. 603–604, 593–605. doi:10.1016/j.scitotenv.2017.06.101
Kristensen, K. J., and Jensen, S. E. (1975). A model of estimating actual evapotranspiration from potential evapotranspiration. Nord. Hydrol. 6, 170–188. doi:10.2166/nh.1975.0012
Lamontagne-Hallé, P., McKenzie, J. M., Kurylyk, B. L., Molson, J., and Lyon, L. N. (2020). Guidelines for cold-regions groundwater numerical modeling. Wiley Interdiscip. Rev. Water 7 (6), e1467. doi:10.1002/wat2.1467
Langford, J. E., Schincariol, R. A., Nagare, R. M., Quinton, W. L., and Mohammed, A. A. (2020). Transient and transition factors in modeling permafrost thaw and groundwater flow. Groundwater 58, 258–268. doi:10.1111/gwat.12903
Lukenbach, M. C., Spencer, C. J., Mendoza, C. A., Devito, K. J., Landhäusser, S. M., and Carey, S. K. (2019). Evaluating how landform design and soil covers influence groundwater recharge in a reclaimed watershed. Water Resour. Res. 55 (8), 6464–6481. doi:10.1029/2018wr024298
McKenna, G. T. (2002). Sustainable mine reclamation and landscape engineering. PhD Thesis. Edmonton: University of Alberta, 269.
Moss, R., Edmonds, J., Hibbard, K., Manning, M. R., Rose, S. K., van Vuuren, D. P., et al. (2010). The next generation of scenarios for climate change research and assessment. Nature 463, 747–756. doi:10.1038/nature08823
Nagare, R. M., Park, Y-J., and Barbour, S. L. (2018). Analytical approach to estimate salt release from tailings sand hummocks in oil sands mine closure. Mine Water Environ. 37, 673–685. doi:10.1007/s10230-018-0513-5
Nagare, R. M., Park, Y-J., Wirtz, R., Heisler, D., and Miller, G. (2022). Integrated surface-subsurface water and solute modeling of a reclaimed in-pit oil sands mine: Effects of ground freezing and thawing. J. Hydrology Regional Stud. 39, 100975. doi:10.1016/j.ejrh.2021.100975
Nagler, P. L., Glenn, E. P., Thomson, T. L., and Huete, A. (2004). Leaf area index and normalized difference vegetation index as predictors of canopy characteristics and light interception by riparian species on the Lower Colorado River. Agric. For. Meteorology 125, 1–17. doi:10.1016/j.agrformet.2004.03.008
NRCAN (2022). Where are the oil sands? Natural Resources Canada. Available at: https://www.nrcan.gc.ca/our-natural-resources/energy-sources-distribution/clean-fossil-fuels/what-are-oil-sands/18089 (Last accessed January 6, 2022).
IPCC (2014). “Climate change 2014: Synthesis report (contribution of working groups I, II and III to the fifth assessment report of the intergovernmental panel on climate change),” in Core writing team. Editors R. K. Pachauri, and L. A. Meyer (Geneva, Switzerland: Intergovernmental Panel on Climate Change), 151.
Pascal, G., Brouyère, S., Blenkinsop, S., Burton, A., Fowler, H. J., Orban, P., et al. (2011). Modeling climate change impacts on groundwater resources using transient stochastic climatic scenarios. Water Resour. Res. 47 (12). doi:10.1029/2010WR010082
Riahi, K., Rao, S., Krey, V., Cho, C., Chirkov, V., Fischer, G., et al. (2011). Rcp 8.5. - a scenario of comparatively high greenhouse gas emissions. Clim. Change 109, 33–57. doi:10.1007/s10584-011-0149-y
Riahi, K., van Vuuren, D. P., Kriegler, E., Edmonds, J., O’Neill, B. C., Fujimori, S., et al. (2017). The shared socioeconomic pathways and their Energy, land use, and greenhouse gas emissions implications: An overview. Glob. Environ. Change 42, 153–168. doi:10.1016/j.gloenvcha.2016.05.009
Rooney, R. C., Robinson, D. T., and Petrone, R. (2015). Megaproject reclamation and climate change. Nat. Clim. Change 5, 963–966. doi:10.1038/nclimate2719
Schneider, R. R. (2013). “Alberta’s natural subregions under a changing climate: Past, present, and future,” in Biodiversity management and climate change adaptation project (Edmonton: Alberta Biodiversity Monitoring Institute).
Shurniak, R. E., and Barbour, S. L. (2002). Modeling of water movement within reclamation covers on oil sands mining overburden piles. J. Am. Soc. Min. Reclam. 2002, 622–645. doi:10.21000/JASMR02010622
Sognnaes, I., Gambhir, A., van de Ven, D. J., Nikas, A., Anger-Kraavi, A., Bui, H., et al. (2021). A multi-model analysis of long-term emissions and warming implications of current mitigation efforts. Nat. Clim. Chang. 11, 1055–1062. doi:10.1038/s41558-021-01206-3
Syncrude (2020). Composite tailings capping knowledge synthesis. Report to Alberta Energy Regulator by Syncrude Canada Ltd Tech Report. doi:10.7939/r3-n048-ex41
van Genuchten, M. T. (1980). A closed-form equation for predicting the hydraulic conductivity of unsaturated soils. Soil Sci. Soc. Am. J. 44 (5), 892–898. doi:10.2136/sssaj1980.03615995004400050002x
van Vuuren, D. P., Edmonds, J., Kainuma, M., Riahi, K., Thomson, A., Hibbard, K., et al. (2011). The representative concentration pathways: An overview. Clim. Change 109, 5–31. doi:10.1007/s10584-011-0148-z
Werner, A. T., and Cannon, A. J. (2016). Hydrologic extremes–an intercomparison of multiple gridded statistical downscaling methods. Hydrology Earth Syst. Sci. 20 (4), 1483–1508. doi:10.5194/hess-20-1483-2016
Yu, J., Berry, P., Guillod, B. P., and Hickler, T. (2021). Climate change impacts on the future of forests in Great Britain. Front. Environ. Sci. 9, 640530. doi:10.3389/fenvs.2021.640530
Keywords: oil sands, mine reclamation, climate change, surface water groundwater interactions, hydrological impacts
Citation: Nagare RM, Kiyani A, Park Y-J, Wirtz R, Heisler D and Miller G (2023) Hydrological sustainability of in-pit reclaimed oil sands landforms under climate change. Front. Environ. Sci. 10:961003. doi: 10.3389/fenvs.2022.961003
Received: 03 June 2022; Accepted: 09 December 2022;
Published: 04 January 2023.
Edited by:
Xing Yuan, Nanjing University of Information Science and Technology, ChinaReviewed by:
Santosh Murlidhar Pingale, National Institute of Hydrology (Roorkee), IndiaBulgariu Laura, Gheorghe Asachi Technical University of Iași, Romania
Copyright © 2023 Nagare, Kiyani, Park, Wirtz, Heisler and Miller. This is an open-access article distributed under the terms of the Creative Commons Attribution License (CC BY). The use, distribution or reproduction in other forums is permitted, provided the original author(s) and the copyright owner(s) are credited and that the original publication in this journal is cited, in accordance with accepted academic practice. No use, distribution or reproduction is permitted which does not comply with these terms.
*Correspondence: Ranjeet M. Nagare, cmFuamVldC5uYWdhcmVAYXJra2VuZy5jYQ==