 Zenhom E. Salem
 Abdelaziz ElNahrawy1
 Abdullah M. Attiah
 Joshua N. Edokpayi
- 1Geology Department, Faculty of Science, Tanta University, Tanta, Egypt
- 2Central Laboratory for Elemental and Isotopic Analysis (CLEIA), Nuclear Research Center (NRC), Egyptian Atomic Energy Authority (Inshas), Cairo, Egypt
- 3Department of Earth Sciences, University of Venda, Thohoyandou, South Africa
Contaminants can be found in the groundwater through natural processes, such as seawater intrusion, or due to human activities that can adversely affect the quantity, quality, and distribution of the groundwater. In order to assess the influence of human activities and seawater intrusion on the groundwater chemistry in the Central Nile Delta region, groundwater was collected from 167 production wells, with depths of 15–120 m. In addition, eight soil-water samples were collected from depths of about 1 m. The groundwater samples were divided based on well depths into three zones: shallow zone (<40 m depth), intermediate zone (41–60 m depth), and deep zone (>60 m depth). The TDS, EC, pH, K+, Na+, Mg2+, Ca2+, Cl−, HCO3−, and SO42- were determined for all water samples. The groundwater samples with Cl of 100–200 mg/L and EC of 600–2,000 μs/cm represent mixing between freshwater and saltwater. The increase in TDS and concentrations of all major ions toward the northern parts reflected the impact of the seawater intrusion. The groundwater had an Na/Cl ratio of 0.46–2.75, indicating the influence of both seawater intrusion and anthropogenic activities on groundwater chemistry. In addition, the high Ca/Mg, Ca/SO4, and Ca/HCO3 ratios (>1) indicated that the groundwater was intruded by seawater. The obtained water types, the ionic ratios, and the saturation index results suggested that anthropogenic activities, water-rock interaction, infiltration, mineral weathering, and seawater intrusion are the main processes controlling the variation and evolution of groundwater chemistry.
Introduction
Groundwater is a very vital natural resource in semiarid and arid environments (Nhu et al., 2020), and because of the population increase, the demand for exploitation of groundwater resources has increased for agricultural, industrial, domestic, and drinking purposes (Ardakani et al., 2018; Nhu et al., 2020). In coastal regions, groundwater chemistry is of great interest because of the varying degree of mixing between the seawater and the groundwater. Groundwater aquifers situated in low topography coastal territories could be subjected to pollution caused by anthropogenic activities, seawater intrusion, and sea level rise (Ferguson and Gleeson, 2012; Ataie-Ashtiani et al., 2013; Luoma et al., 2013; Rasmussen et al., 2013). Groundwater exploitation for industrial and agricultural purposes also affects groundwater quality. As the coastal areas are thickly populated, the need for freshwater significantly increases. Therefore, aquifers in the coastal regions are significant sources of freshwater in several nations around the globe, particularly in the Mediterranean region (Gaaloul et al., 2012). The extraction of groundwater from such arid regions diminishes freshwater flowing to the sea and lowers the water table, thus creating a possibility for seawater intrusion and consequently leading to groundwater quality problems (Zeidan, 2017; Costall et al., 2020; Siddha and Sahu, 2020; Hajji et al., 2022).
In the arid and semiarid coastal regions, where the groundwater is the main source of freshwater (Nhu et al., 2020), seawater intrusion represents a major problem. In addition, the preservation of water resources is a fundamental challenge in semiarid coastal regions because of the complexities of their geological settings. Developing nations of the Mediterranean Basin face environmental stresses by high populace growth, fast urbanization, and inefficient management of water resources (UN-United Nations, 2003; WHO, 2006). Groundwater salinity increases because of many factors, such as anthropogenic activities, agriculture practices, biogeochemical procedures, and seawater intrusion (Kanagaraj et al., 2018). Hydrogeochemical processes occurring within the groundwater system and the water interaction with the aquifer matrix can affect the groundwater quality for different human uses. The chemical characteristics of the groundwater can reflect its origin and evolution through its passage within the aquifer system. The hydrogeochemical processes vary temporally and spatially depending on the chemical and geological characteristics of the aquifer. The residence time of the groundwater within the aquifer controls the groundwater chemical composition (Okofo et al., 2022). The major processes affecting the groundwater chemistry and quality are the rock-water interaction, especially dissolution and weathering processes, carbonate balance, oxidation-reduction, and adsorption-desorption, in addition to the anthropogenic activities and biochemical processes. The weathering of minerals which is usually accompanied by increasing levels of major cations (such as Ca, Mg, Na, and K) is an important process in controlling groundwater chemistry (Aghazadeh et al., 2016; Salem and El-Bayumy, 2016; Salem and Osman, 2017a; Walraevens et al., 2018; Zhang et al., 2020). Agricultural activities are also potential sources of groundwater contamination and can result in increasing levels of salinity and nutrient concentrations (Kumar et al., 2021).
Several authors have studied the hydrogeochemistry of groundwater and seawater intrusion (Llopis-Albert et al., 2016; Salem et al., 2016; Kanagaraj et al., 2018; Kim et al., 2019). In addition, a few authors have reported the possible causes of increased salinization of groundwater (Salem et al., 2015; Argamasilla et al., 2017; Salem and Osman, 2017b).
In the Nile Delta, agricultural and industrial activities adversely affect groundwater quality (Salem et al., 2021). The increased exploitation of water resources associated with the population growth led to dramatic changes in both surface and groundwater systems, such as deterioration of water quality, reduced levels of safe surface water resources, groundwater salinization, and lowering of groundwater table (Salem et al., 2015; Salem and Osman, 2017a; Nhu et al., 2020; Shojaei et al., 2021; Aderemi et al., 2022).
Several authors studied the groundwater chemistry in the middle delta and concluded that the excessive usage of pesticides, fertilizers, and agrochemicals; absence of sewer and drainage systems; the poor practices of waste disposal management; percolation from the network of canals and drains that receive the sanitary disposal water, agricultural, and the untreated industrial effluents; use of drainage water in irrigation; traffic emissions; and saltwater intrusion were the main sources of groundwater pollution (Salem et al., 2012; Ghoraba et al., 2013; Mabrouk et al., 2015; Balkhair and Ashraf, 2016; Armanuos et al., 2017; Khalifa et al., 2019; Abu Khatita et al., 2020; El-Amier et al., 2020).
In this study, the hydrochemical characteristics of the groundwater in the study area were performed to gain insight into the evolution of the groundwater chemistry, identify the main hydrogeochemical processes occurring along the groundwater flow paths, and determine the anthropogenic factors affecting the groundwater system.
Study area
The study area occurs around the central part of the Nile Delta, including the entire area of El-Gharbia Governorate in addition to the northern part of Menoufiya and the southern part of Kafr El-Sheikh Governorates (Figure 1). The Nile Delta has an arid climate with average rainfall ranging from 25 mm/year (in the southern and middle parts) to 200 mm/year along the Mediterranean coast (RIGW, 1992). These low precipitation values do not recharge the aquifer, especially with the existence of the clayey Bilqas Formation covering the surface of most of the Nile Delta. The maximum and the minimum temperatures in the Delta area range from 26°C to 34°C and from 6°C to 13°C, respectively (SNC, 2010). The Nile Delta aquifer spans over 24,281 km2 and is bounded by the Mediterranean Sea to the north and the Suez Canal to the east. The western boundary extends into the desert and diminishes toward the south.
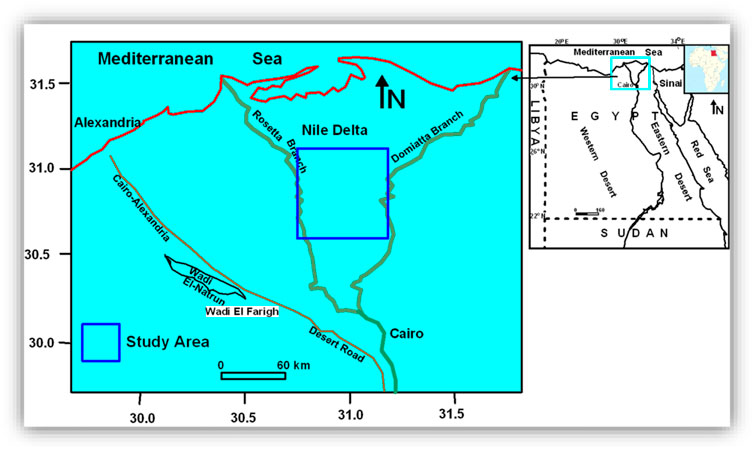
FIGURE 1. Maps show the geographic location of the study area.
The Quaternary aquifer is the main source of groundwater in the Nile Delta and is considered a semi-confined aquifer, where the clay of the Holocene Bilqas Formation represents the top of the Quaternary aquifer (Wilson et al., 1979). The Quaternary aquifer covers the whole Nile Delta area with a variable thickness ranging from 200 m in the south to 1,000 m in the north (RIGW, 1992). The agricultural soil in the region is believed to be from a coastal lagoonal deposit (Bilqas formation). The thickness of the clay deposit varies between 5 and 60 m across the south and the central part of the Nile Delta (Figure 2) (Diab and Saleh, 1982). The thickness of the clay layer plays a major role in the hydraulic connection between the surface and groundwater.
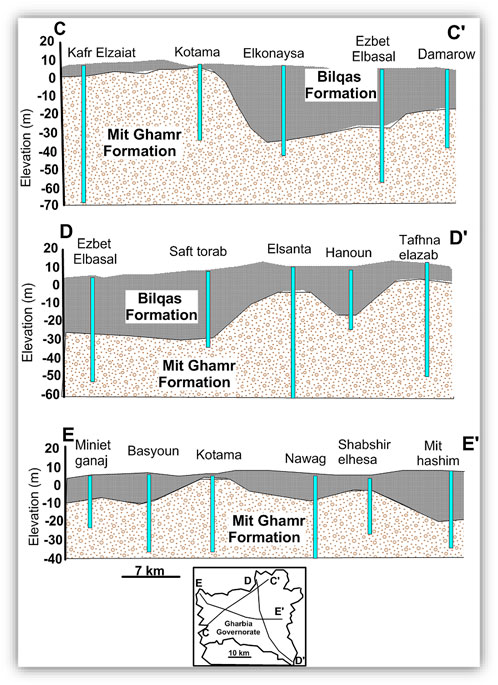
FIGURE 2. Vertical cross-sections illustrate the lateral change in Bilqas and Mit Ghamr Formations.
It has been reported that the hydraulic connectivity of the Nile Delta ranged from 70 to 100 m/d (Sherif, 1999; Salem et al., 2017c). Several authors studied the hydrogeology and hydrogeochemistry of the groundwater in different regions of the Nile Delta aquifer, such as Ahmed et al. (2012), Arnous et al. (2015), Safaa and Gad (2014), Salem (2009), Salem et al. (2015), Salem et al. (2016), Salem and El-Bayumy (2016), Salem and Osman (2017a), Salem et al. (2017a, b, and c), El-Sayed (2018), and Salem et al. (2018a and b).
Generally, the depth of the groundwater table in the Nile Delta ranges from 1 to 2 m in the north to 3–4 m in the middle parts, reaching 5 m in the south, where the groundwater head decreases from 15 m at Cairo to less than 1 m near the Mediterranean coast (RIGW, 2002). In the study area, the groundwater flows toward the north, and its level ranges from 5 m in the southern part to less than 2 m in the northern part. This suggests the effluent nature of Damietta and Rosetta branches in the southern part of the study area. The piezometric head gradient ranges from 11 to 17 cm/km (Figure 3, Abd El-bary and Thesis, 2011).
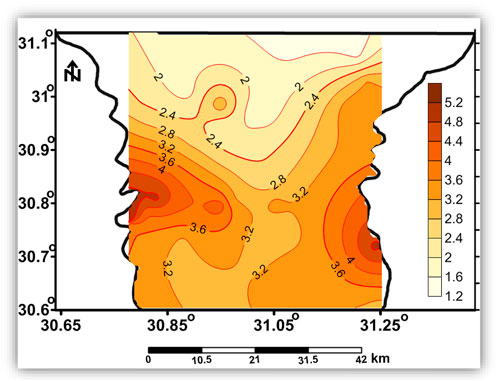
FIGURE 3. Piezometric map shows the spatial distribution of the groundwater hydraulic heads in the study area (Abd Elbary and Thesis, 2011).
The study area includes several industrial activities that represent an environmental threat as a result of their solid and liquid effluents in addition to their gaseous emissions, such as industries of bricks, pottery, paints, leather, feed and fertilizers, pesticides, rubber, battery cases, perfume, glass, detergents, construction and building materials, oils, and soap (Abu Khatita et al., 2020; El-Amier et al., 2020).
Methodology
For estimating the main factors affecting groundwater chemistry and describing the groundwater quality in the study area, soil-water was sampled twice (during the summer and winter seasons of 2017) from eight locations from depths of about 1 m (Figures 4A,B), and the groundwater was collected from 167 water wells (Figures 4C–E) with depths ranging from about 15 to 120 m.
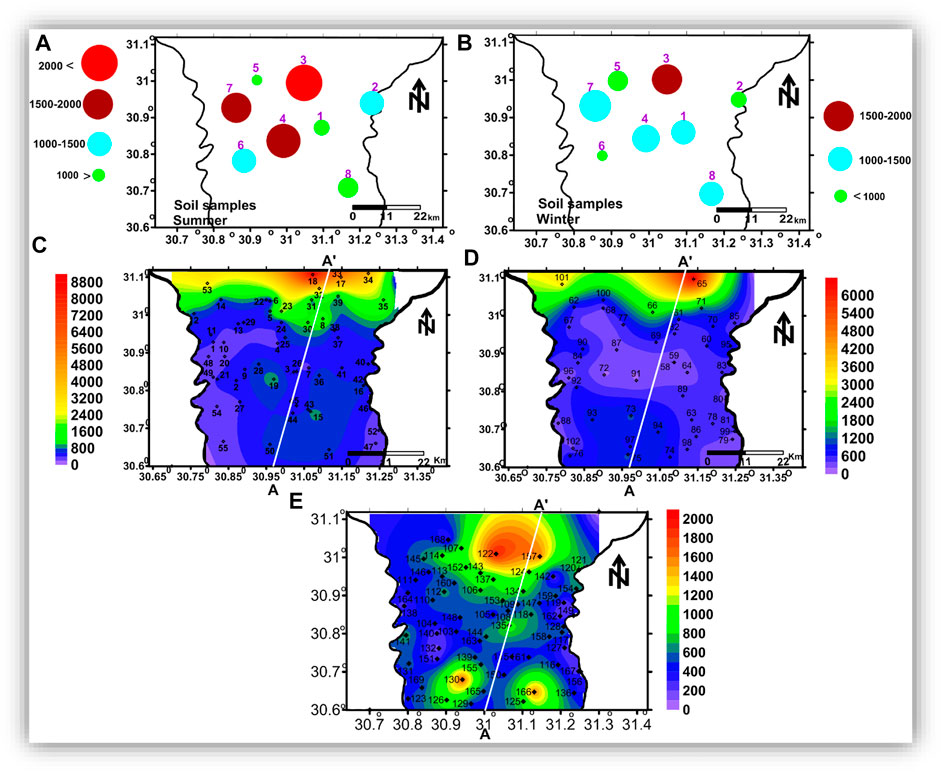
FIGURE 4. The spatial distribution maps of TDS of the soil water and the groundwater samples: (A) TDS of the soil water in summer, (B) TDS of the soil water in winter, and (C), (D), and (E) TDS of the groundwater in the shallow, intermediate, and deep zones, respectively.
In order to have a complete image of the vertical and spatial variation in the chemistry and quality of the groundwater, the groundwater samples were classified into shallow groundwater that was collected from wells with depths up to 40 m (Figure 4C), intermediated groundwater (depth of 41—60 m, Figure 4D), and deep groundwater (depth >60 m, Figure 4E).
The pH, EC, and TDS of the groundwater samples were measured in situ with a portable Consort pH meter (model P 314) and Hach’s portable EC/TDS meter. Samples were kept at 4°C, and chemical analyses were performed within 2 days of sampling. The major cations (Ca2+, Mg2+, Na+, and K+) were analyzed using an Inductively Coupled Plasma Optical Emission Spectrophotometer (Optima™ 7000 DV ICPOES. PerkinElmer, Inc. United States ). Sulfate ions were measured using a spectrophotometer (Dr/2000 Spectrophotometer) through precipitation with the barium chloride method. Chloride and bicarbonate ions were measured using a digital titrator (MODEL1690001). A standard solution of mercuric nitrate and diphenyl carbazone reagent powder was used to measure the chloride ion, and a standard sulfuric acid solution was used to measure the bicarbonate ion. Chemical analyses were carried out in the Central Laboratory of Tanta University. Table 1 presents the statistical summary of the obtained results.
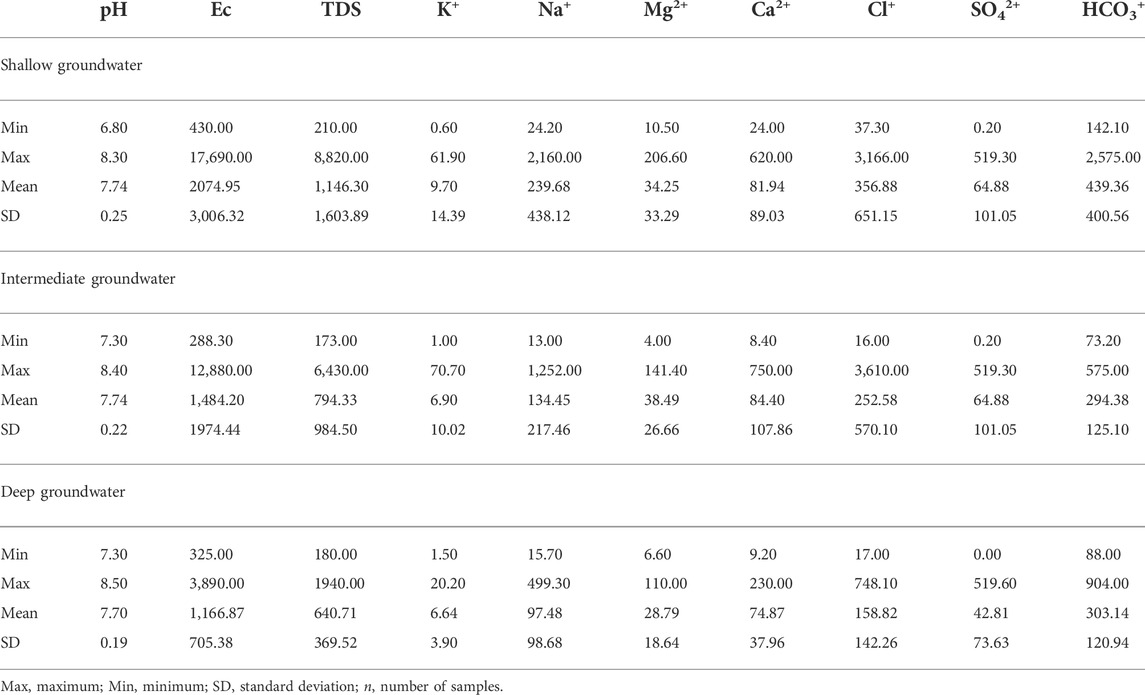
TABLE 1. Statistical summary of the chemical constituents of the collected shallow, intermediate, and deep groundwater zones (all values are in mg/l except for EC (in µs/cm) and pH).
Results and discussion
Soil water
The hydrochemical parameters of the collected soil water samples are shown in Figure 5. In summer season, sample 3 represents the highest concentrations (mg/l) of TDS (2,670), K+ (84.68), Na+ (606.14), Mg2+ (86.17), Cl− (797.52), SO42− (82.88), and HCO3− (874.09). The highest concentration of Ca2+ was recorded in sample 7. In the winter season, sample 3 had the highest concentrations of TDS (1950 mg/l), Mg2+ (111.8 mg/l), SO42− (298 mg/l), and HCO3− (804.88 mg/l); sample 7 had the highest concentrations of Na+ (323.5 mg/l), Ca2+ (80 mg/l), and Cl− (354.61 mg/l); and sample 5 had the highest concentration of K+ (16.02 mg/l). The highest concentration of NO3− (39.2 mg/l) was recorded in sample 6
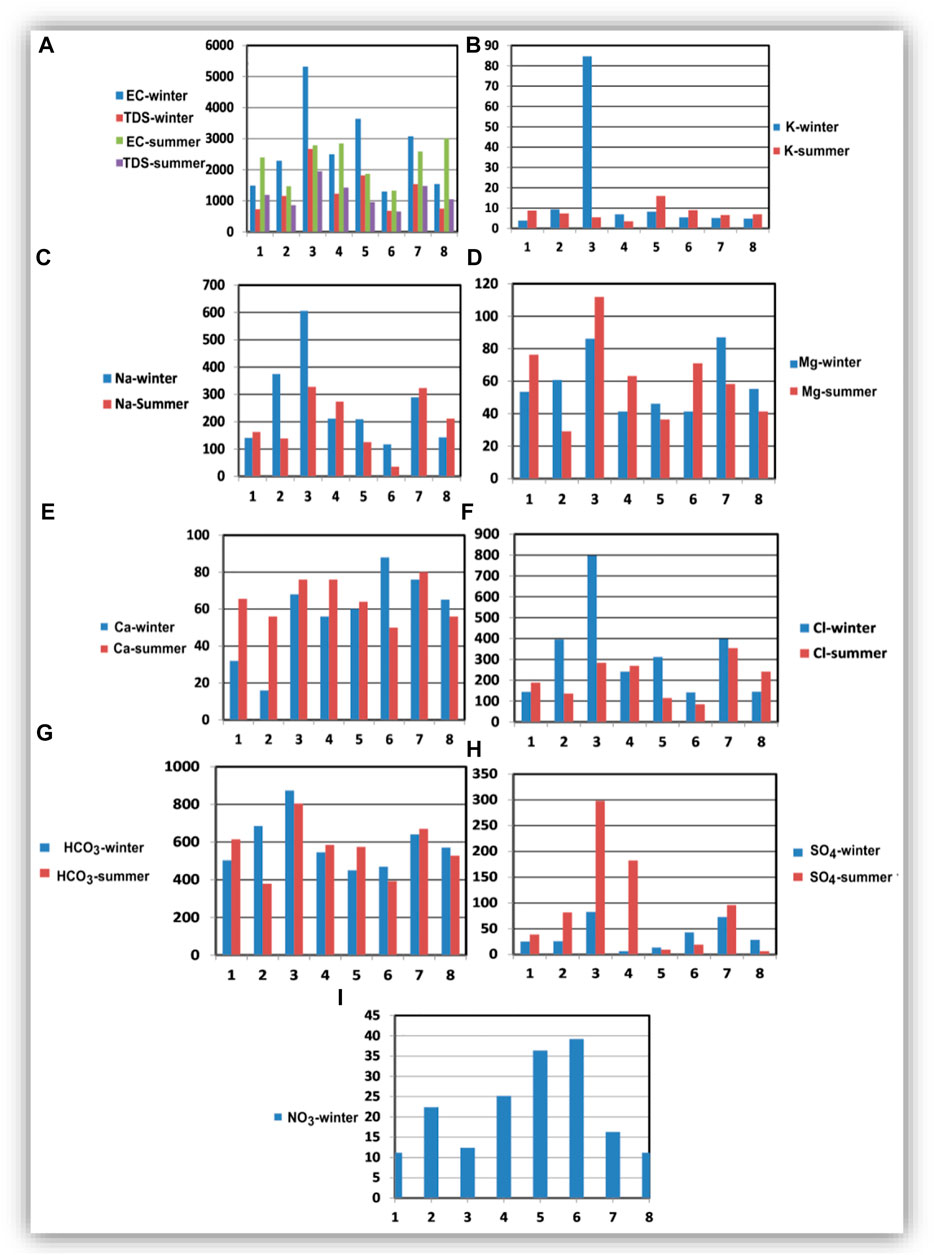
FIGURE 5. The hydrochemical composition of the collected soil water samples during winter and summer seasons.
The enrichment of these ions in soil water can be related to the evaporative concentration and minerals leaching in the soil zone (Panno et al., 2006). It was recognized that samples located in the northern part (2, 3, 5, and 7) reflect the higher soil salinity compared to those located in the central part, where they have the highest salinity and ion concentrations. The TDS and ion concentrations in these samples decrease in summer compared to winter, which can be related to excessive water use for irrigation in summer. Samples located in the central and southern parts of the area (1, 4, 6, and 8) showed lower concentrations in winter compared to summer, suggesting the effect of excessive application of fertilizers in the summer season. The NO3 concentrations (Figure 5I) ranged from 11.2 mg/l in samples 1 and 8 to 39.2 mg/l in sample 6.
Groundwater hydrochemical data
Spatial distribution
The pH of the shallow, intermediate, and deep ground waters where slightly alkaline having values ranging from 6.80 to 8.30, 7.30 to 8.40, and 7.30 to 8.50, with mean values of 7.74, 7.74, and 7.74, respectively (Table 1). In the shallow zone, TDS ranged from 210 to 8,820 mg/l, with a mean value of 1,146 mg/l. However, in the intermediate zone, it ranged from 173 to 6,430 mg/l, with a mean value of 794 mg/l. Moreover, in the deep zone, TDS varied from 180 to 1940 mg/l, with a mean value of 641 mg/l (Table 1). The TDS values obtained showed that the groundwater is fresh to brackish (Todd and Mays, 2005; Rusydi, 2018).
The TDS spatial distribution maps (Figures 5C–E) show that groundwater salinity increases toward the north. In addition, groundwater salinity decreases with depth, as salinity recorded its highest values in the shallow groundwater zone (Figure 5C). In contrast, the lowest values were recorded in the deep groundwater zone (Figure 5E). The high salinity in the shallow groundwater zone may be related to leakage from drains, canals, and agricultural drainage, in addition to human activities and evaporation (Choi et al., 2005; Kumar et al., 2009).
Figures 6–8 show the spatial distribution of major ion concentrations, where the highest concentrations of all major ions are recorded in the northern part of the study area.
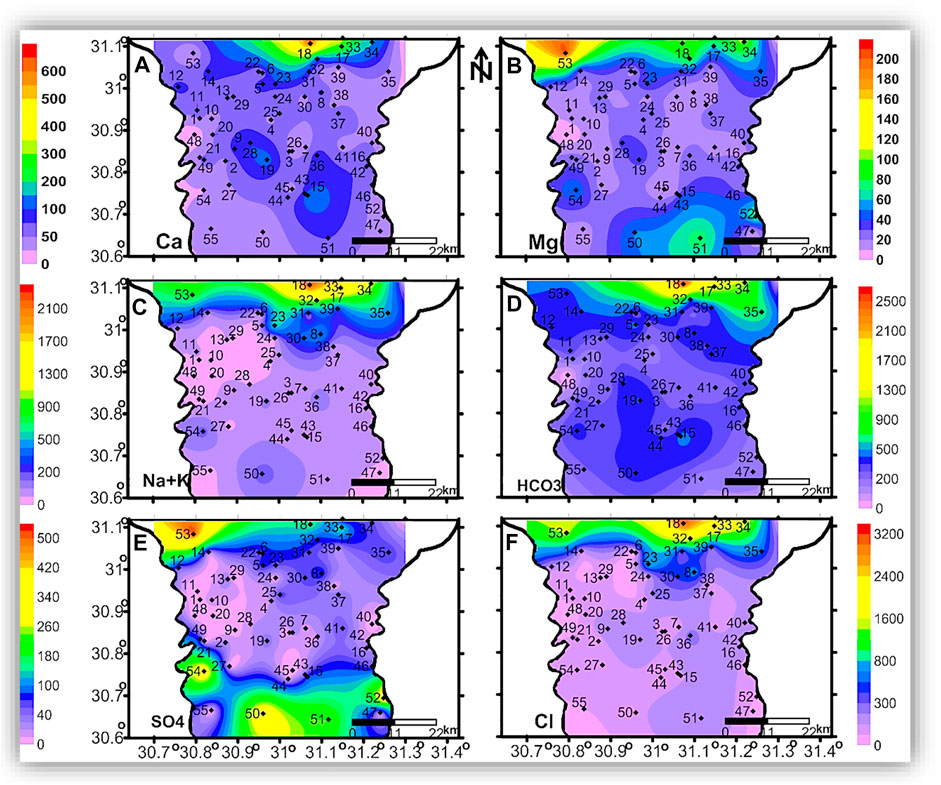
FIGURE 6. The spatial distribution maps of the major ion concentrations (mg/l) of the groundwater samples in the shallow zone.
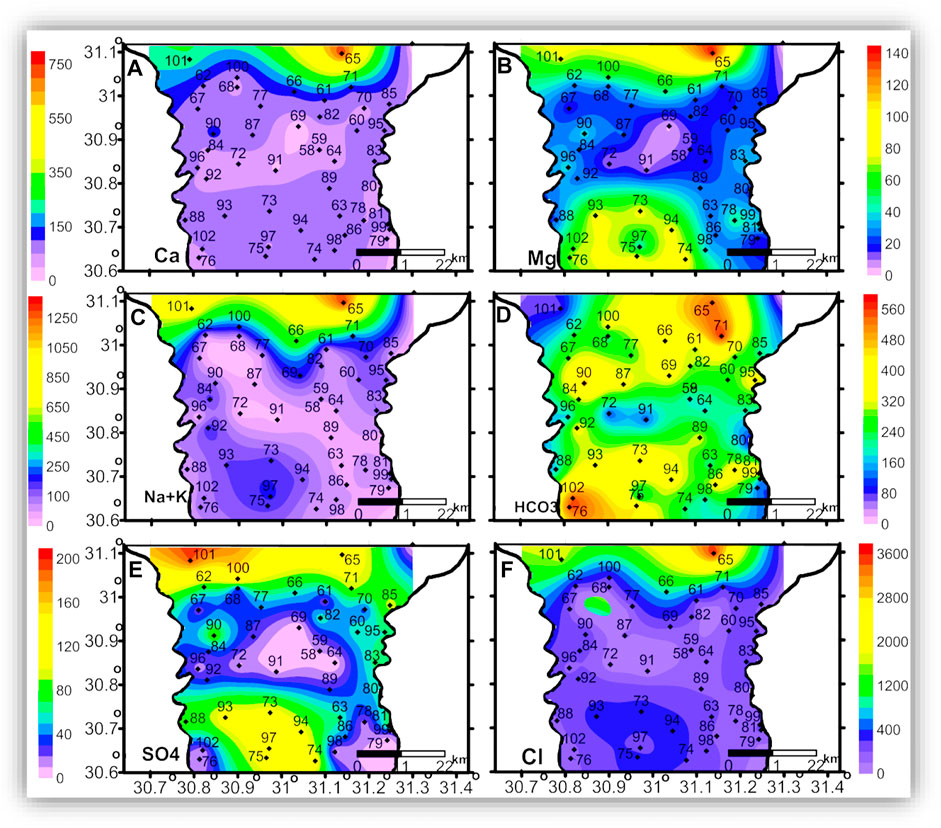
FIGURE 7. The spatial distribution maps of the major ion concentrations (mg/l) of the groundwater samples in the intermediate zone.
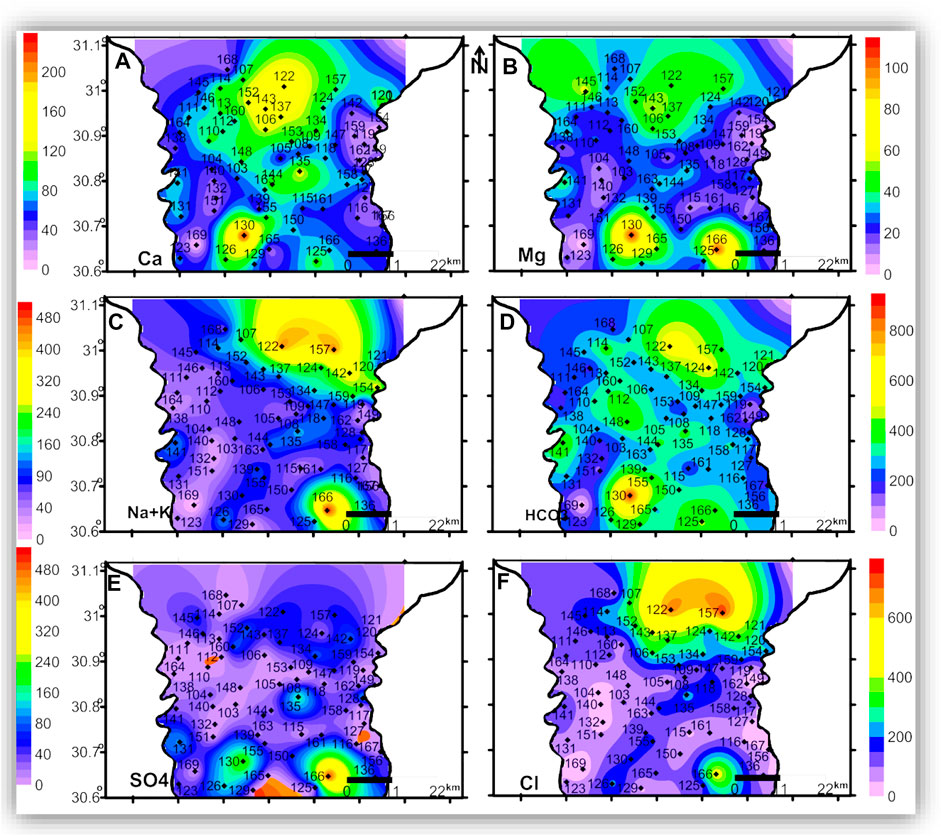
FIGURE 8. The spatial distribution maps of the major ion concentrations (mg/l) of the groundwater samples in the deep zone.
The seawater indicative ions (Na + K and Cl) have a higher concentration in the shallow and intermediate zones than in the deep zone. The freshwater-related ions (Ca and HCO3) also have higher concentrations in the shallow and intermediate zones than in the deep zone. This means the TDS and ion concentrations in the shallow and the intermediate zones could be related to surface hydrological effects such as the old existing closed lakes, which were affected by evaporation. This idea is clearly shown in Figures 9, 10, where TDS and major ion concentrations are distributed along the south-north cross-section AA'.
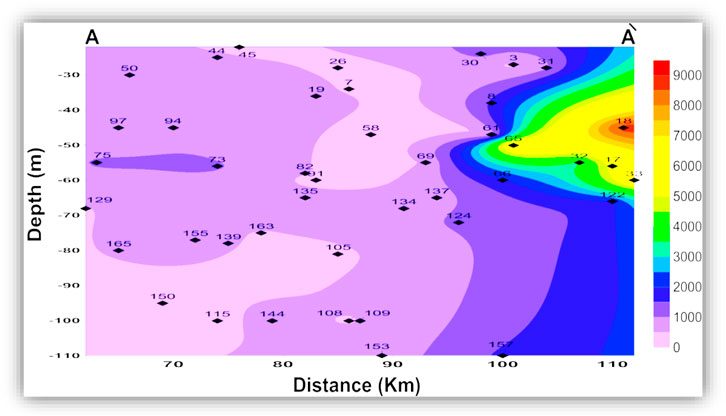
FIGURE 9. Vertical distribution of the groundwater total dissolved solids (TDS, mg/l) along the cross-section AA'.
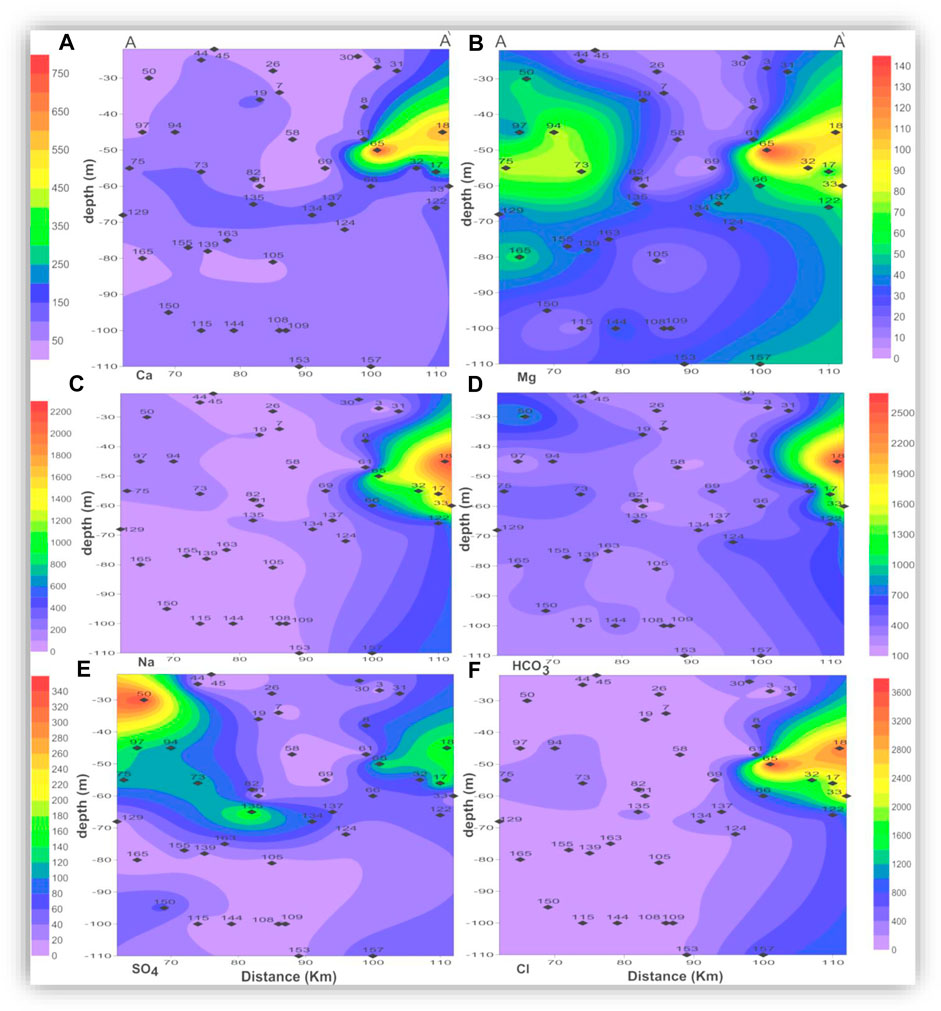
FIGURE 10. Vertical distribution of the major ion concentrations (mg/l) along the cross-section AA'.
In the three zones, TDS and most of the major ions have the lowest concentrations in the eastern and central parts of the area, which could be related to seepage from the old Nile branches and the current irrigation canals. The spatial distributions of Mg and SO4 in the three zones and the AA’ cross-section (Figures 6B,E, 7B,E, 8B,E, and 10B,E) have similar patterns, where higher concentrations are noticed in the southern and northern parts of the area. The highest concentrations of Na and Cl in the deep zone (Figures 8C,F, respectively) are observed in the northeastern part of the area, indicating seawater intrusion.
Groundwater origin
Sulin’s diagram (Figure 11) shows that most of the samples in the shallow, intermediate, and deep zones are represented by recent meteoric water (NaHCO3) and recent marine (MgCl2) waters. The NaHCO3 water type reflects the excess of Na over Cl and SO4, with soft and alkaline characteristics. This water type is probably formed by seepage from the irrigation canals and infiltration of irrigation water. The old meteoric water (Na2SO4) is characterized by an excess of Na over Cl, and it is of slightly alkaline traits. This type includes a few samples related to the three groundwater zones and indicates a decrease in bicarbonate concentrations due to precipitation and sulfate dissolution. Recent marine water type (MgCl2) includes several samples related to the three groundwater zones. It reflects the dilution of seawater by meteoric water where the excess of Cl over Na is predominant. The CaCl2 old marine type includes a few samples related to the deep and intermediate zones and is characterized by an excess of Cl over Na and Mg. The MgCl2 type is considered an intermediate stage between the NaHCO3 and CaCl2 types (El-Sabbagh, 2000; Salman et al., 2013).
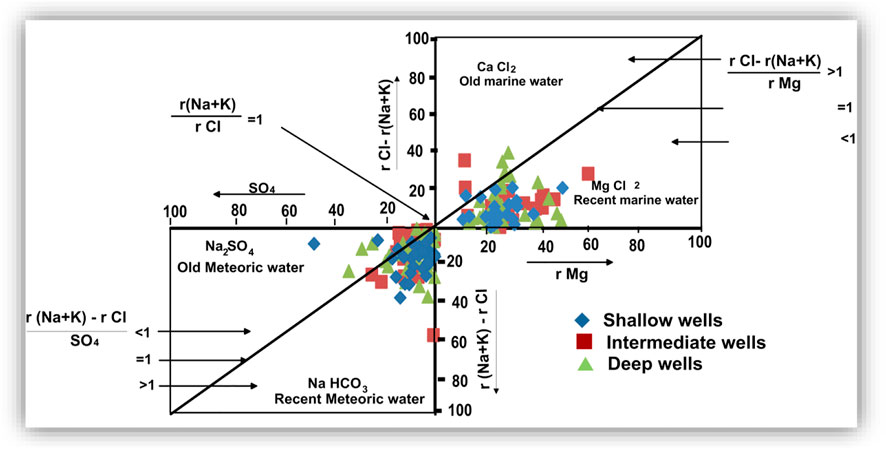
FIGURE 11. Sulin’s diagram illustrates the genetic types of the groundwater samples.
Equilibrium modeling (saturation indices)
The degree of mineral saturation in water is determined by the following equation:
where SI is the saturation index, IAP is the ionic activity product of the appropriate ions, and Ks is the solubility product of the mineral (Singh et al., 2012; Aghazadeh et al., 2016; Salem and Osman, 2017a).
The saturation index (SI) estimates the equilibrium distribution of species and the state of saturation for relevant minerals in water (Aghazadeh et al., 2016). Saturation indices are calculated using the PHREEQC Interactive Program (USGS, 2011). The statistical analysis of the mineral saturation indices is statistically listed in Table 2 and represented graphically and spatially in Figures 12–15.
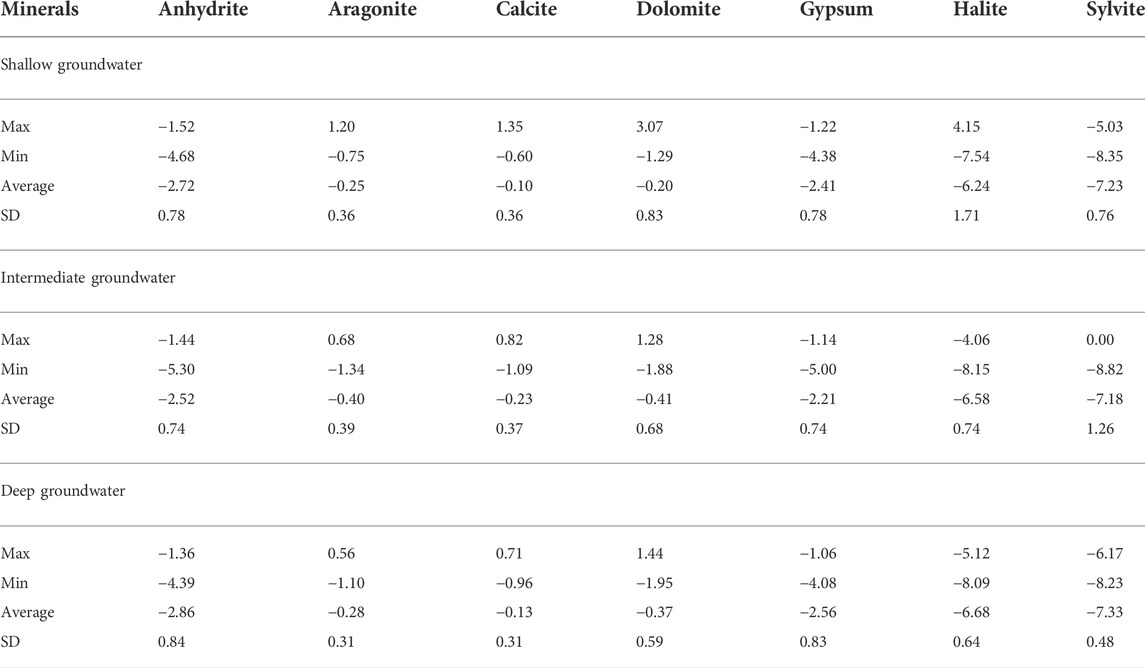
TABLE 2. Statistical summary of the mineral saturation indices of the studied groundwater.
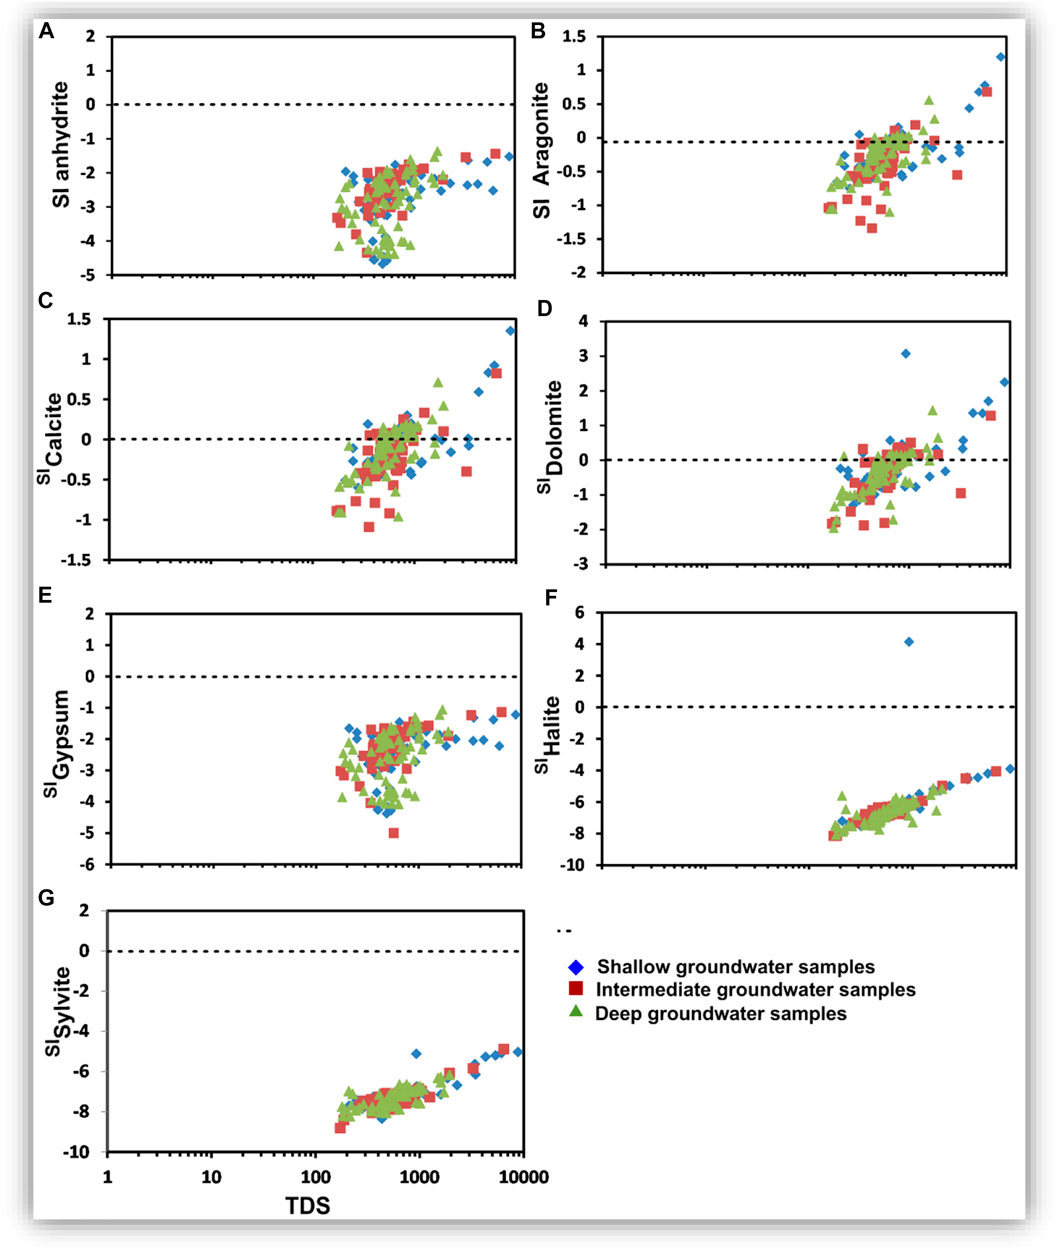
FIGURE 12. Relationships between TDS (mg/l) and the saturation indices of the dissolved minerals in the shallow, intermediate, and deep groundwater.
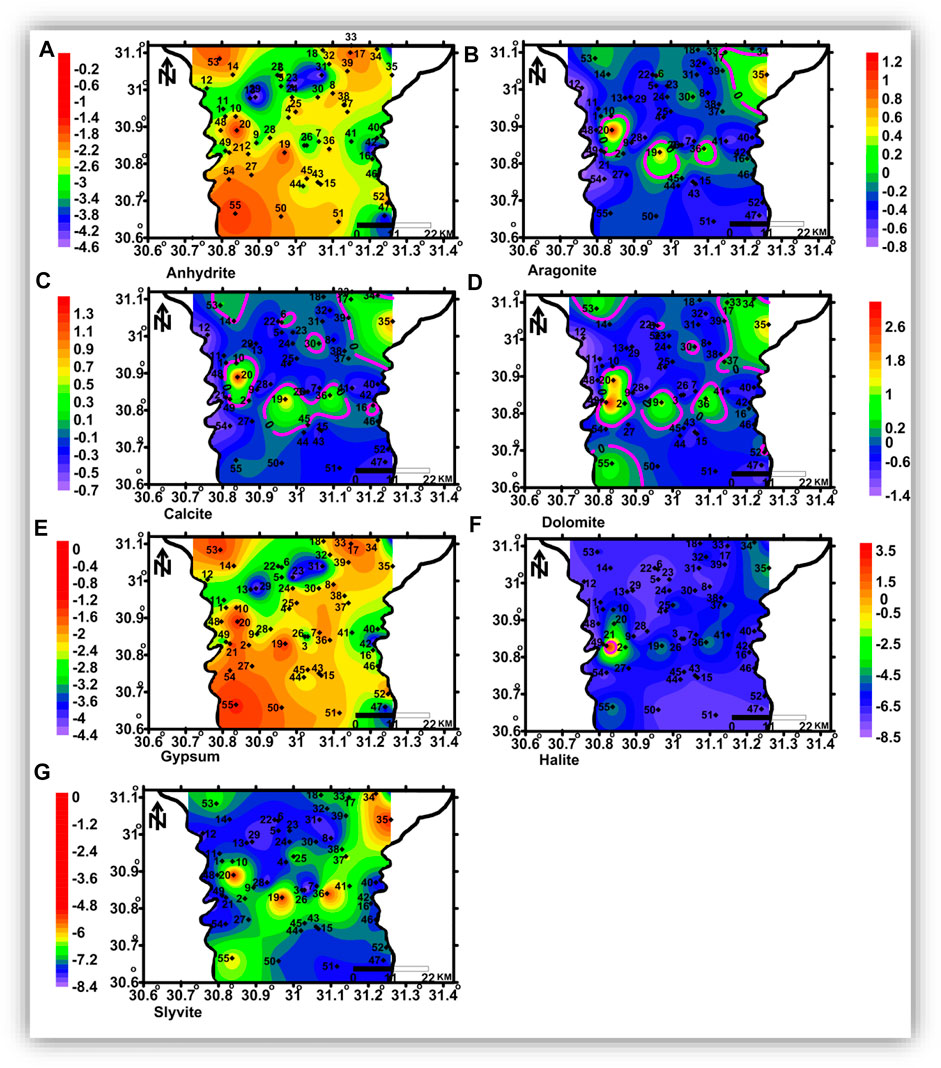
FIGURE 13. Spatial distribution maps of the dissolved minerals’ saturation indices in the shallow zone.
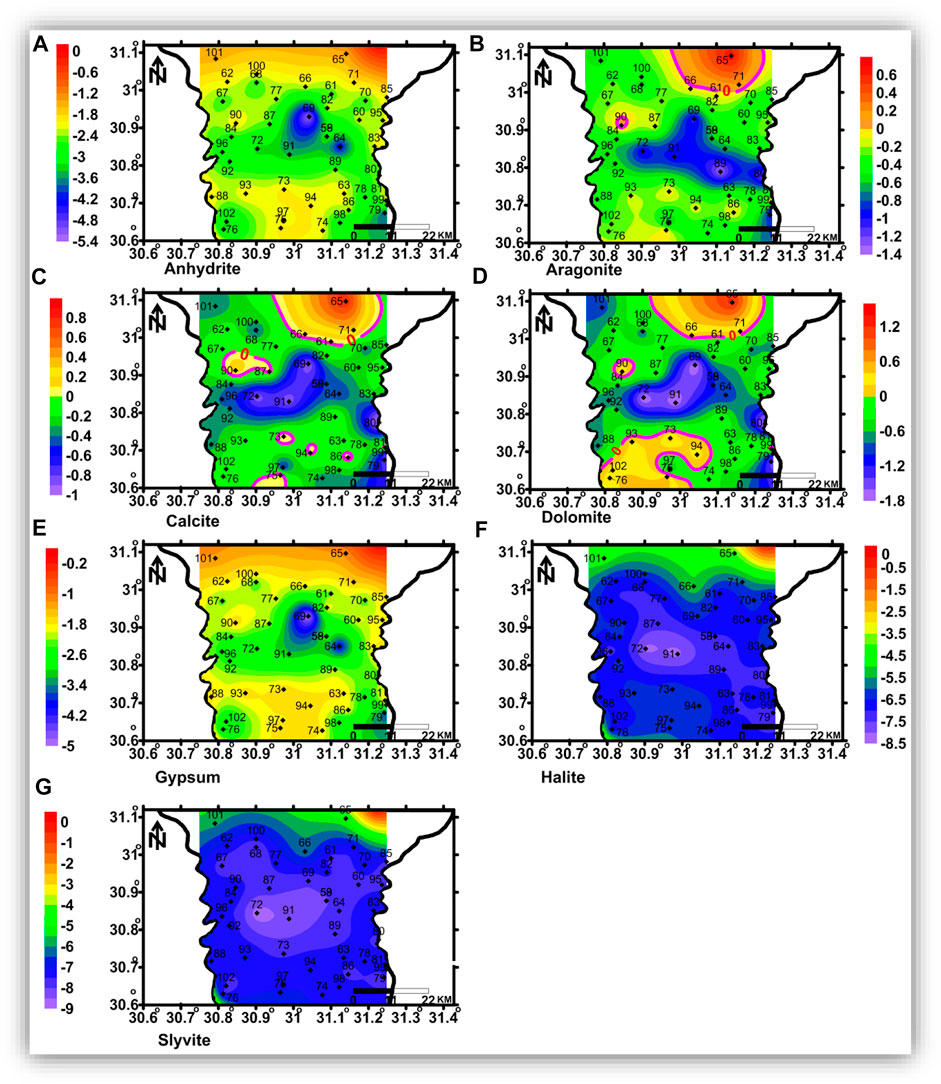
FIGURE 14. Spatial distribution maps of the dissolved minerals’ saturation indices in the intermediate zone.
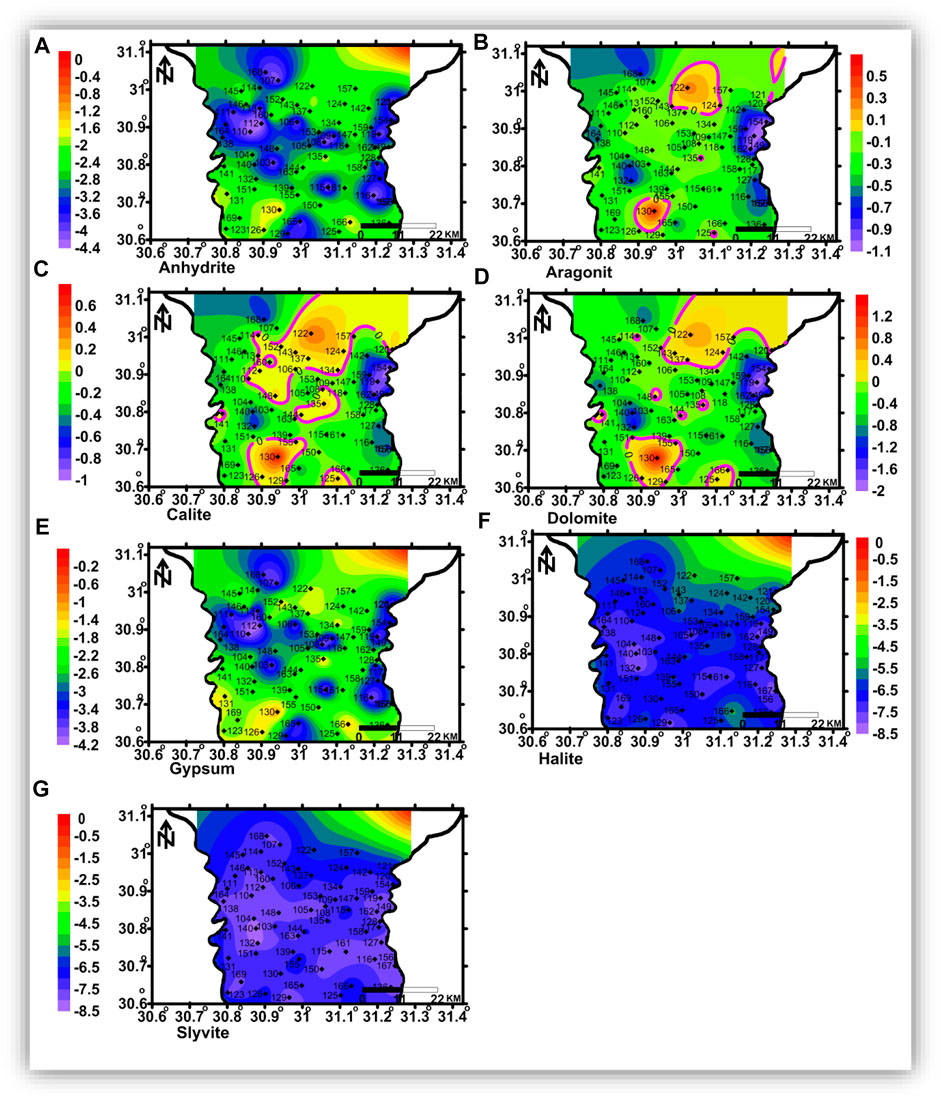
FIGURE 15. Spatial distribution maps of the dissolved minerals’ saturation indices in the deep zone.
The shallow, intermediate, and deep groundwater zones have different dissolved mineral contents. Figure 12 shows that the studied groundwater is unsaturated with respect to sulfate and chloride minerals but partially saturated with respect to carbonate minerals.
Aragonite, calcite, dolomite, halite, and sylvite saturation indices increased with increasing groundwater salinity, whereas those of anhydrite and gypsum have no significant relationship with the groundwater salinity. Partial saturation indices (SIs) of carbonate minerals could be related to the infiltration of irrigation water via soil, where the bicarbonate ion could be formed due to the production of CO2 from the decay of the organic matter as follows:
In the three groundwater zones (Table 3), the sulfate mineral (anhydrite and gypsum) SIs have a strong correlation with sulfate ion concentrations in the shallow, intermediate, and deep zones. However, sulfate minerals have a moderate correlation with Ca + Mg in the three groundwater zones. In addition, there is a moderate correlation between SO42− and Ca + Mg. This suggests that the dissolution of sulfate minerals was the main source of SO42− and Ca2+ in the groundwater, whereas Ca2+ was consumed through the ion exchange process (Kawoa and Karuppannan, 2018; Mgbenu and Egbueri, 2019; Zhang et al., 2020).
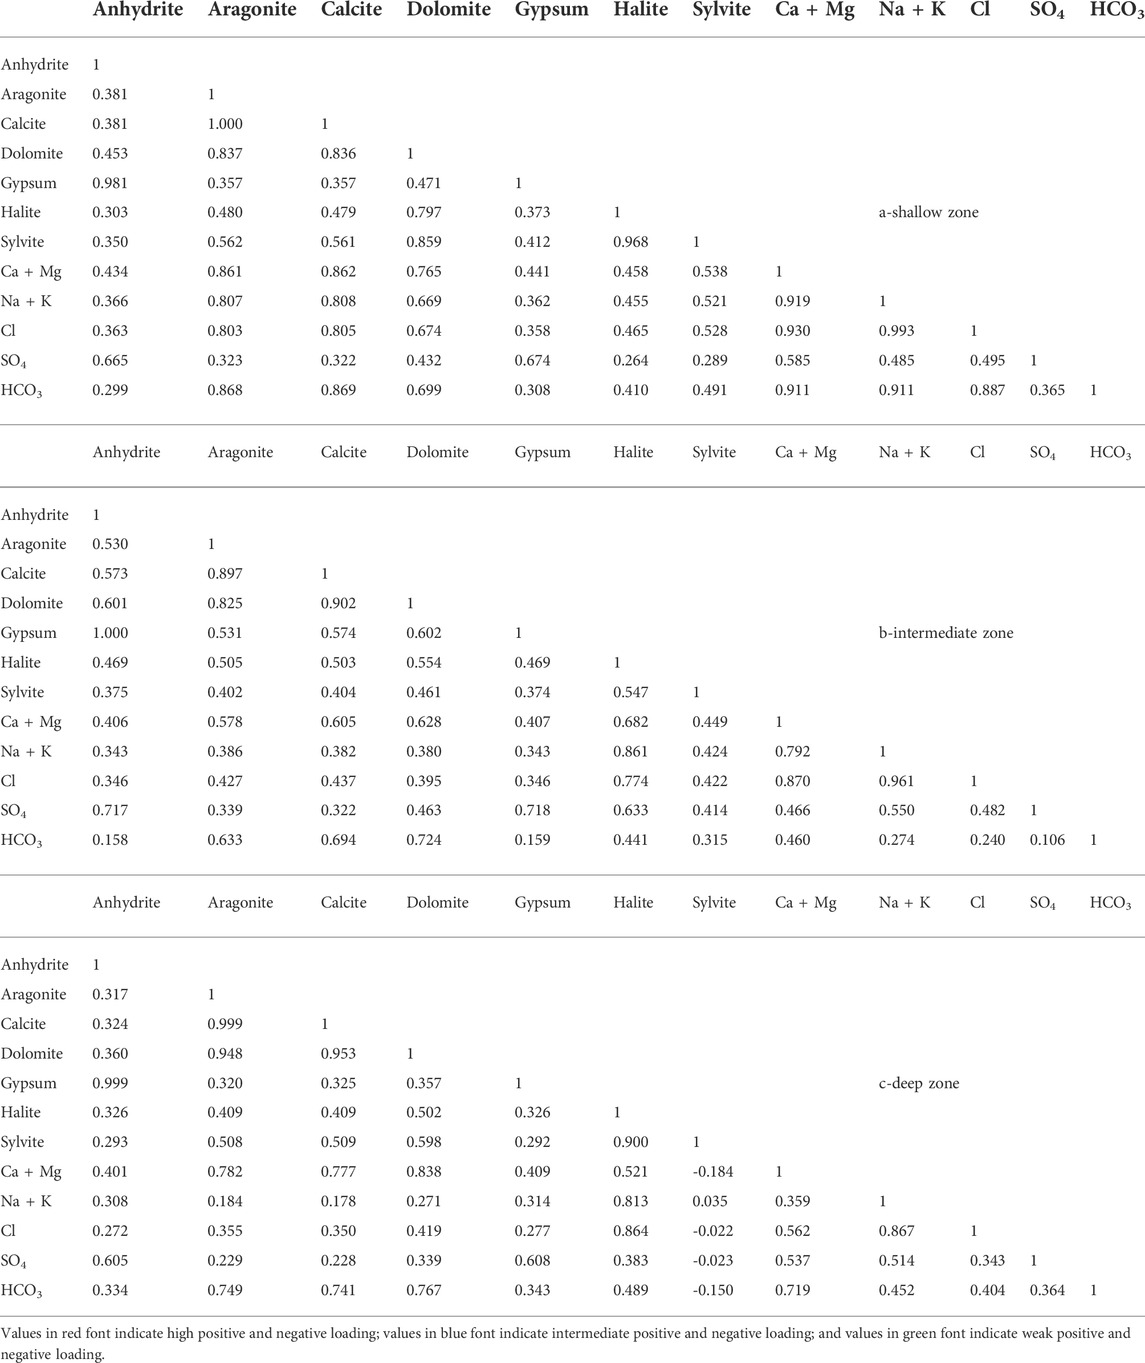
TABLE 3. Correlation coefficient matrix between SIs of the dissolved minerals and concentrations of the major ions.
Carbonate minerals in the shallow zones have a strong to very strong correlation with Ca + Mg and HCO3. In the intermediate zone, they have a moderate to strong correlation with Ca + Mg and HCO3, whereas, in the deep zone, they have a strong to very strong correlation with Ca + Mg and HCO3. This suggested the contribution of the carbonate dissolution process to the content of Ca, Mg, and HCO3 in the groundwater (Kumar et al., 2009; Okiongbo and Akpofure, 2015).
In the shallow zone, the halite and sylvite saturation indices have a moderate correlation with Na + K and Cl, which means that most of the dissolved Na and K are not related to the dissolution of chloride minerals. In the intermediate zone, halite has very strong and strong correlation relationships with Na + K and Cl, respectively, whereas sylvite has a moderate correlation relationship with Na + K and Cl. Chloride minerals in the deep zone have very strong correlation relationships with Na + K and Cl, whereas sylvite has very weak correlation relationships with Na + K and Cl. This suggests that halite dissolution is the main source of Na and Cl in both intermediate and deep zones (Aghazadeh et al., 2016; Zhang et al., 2020).
The spatial distribution of carbonate minerals (aragonite, calcite, and dolomite) saturation indices is represented in Figures 13B–D, 14 (b, c, and d), and 15 (a, b, c, and d) for the shallow, intermediate, and deep groundwater, respectively. The groundwater with higher salinity in the northeastern and northern parts and some spots in the central parts is saturated with carbonate minerals in the shallow zone. The groundwater of the intermediate and deep zones is saturated with carbonate minerals, where seawater intrusion is affecting the area in the northeastern part and in the southern parts, where higher salinities were detected. Sulfate (anhydrite and gypsum) and chloride mineral (halite and sylvite) saturation indices’ distribution maps (Figure 13 (a, e, f, and g), 14 (a, e, f, and g), and 15 (a, e, f, and g) indicated that groundwater in the three zones is undersaturated with these minerals and there is no definite spatial distribution pattern.
Hydrogeochemical processes
Groundwater samples were plotted in Gibbs diagrams (Figures 16A,B) to estimate the relationships between the chemical composition of water and the lithological composition of the aquifer (Gibbs 1970; Xie et al., 2015). It was obtained that the water–rock interaction was responsible for introducing the dissolved HCO3 and Ca into most of the soil water, shallow, intermediate, and deep groundwater samples (Figure 16A). Infiltration via soil accompanied by organic matter decomposition and minerals’ dissolution followed by leachate mixing in the shallow, intermediate, and deep groundwater can greatly affect the groundwater carbonate concentration (Gibbs, 1970; Singh et al., 2012; Salem et al., 2015; Zhang et al., 2020).
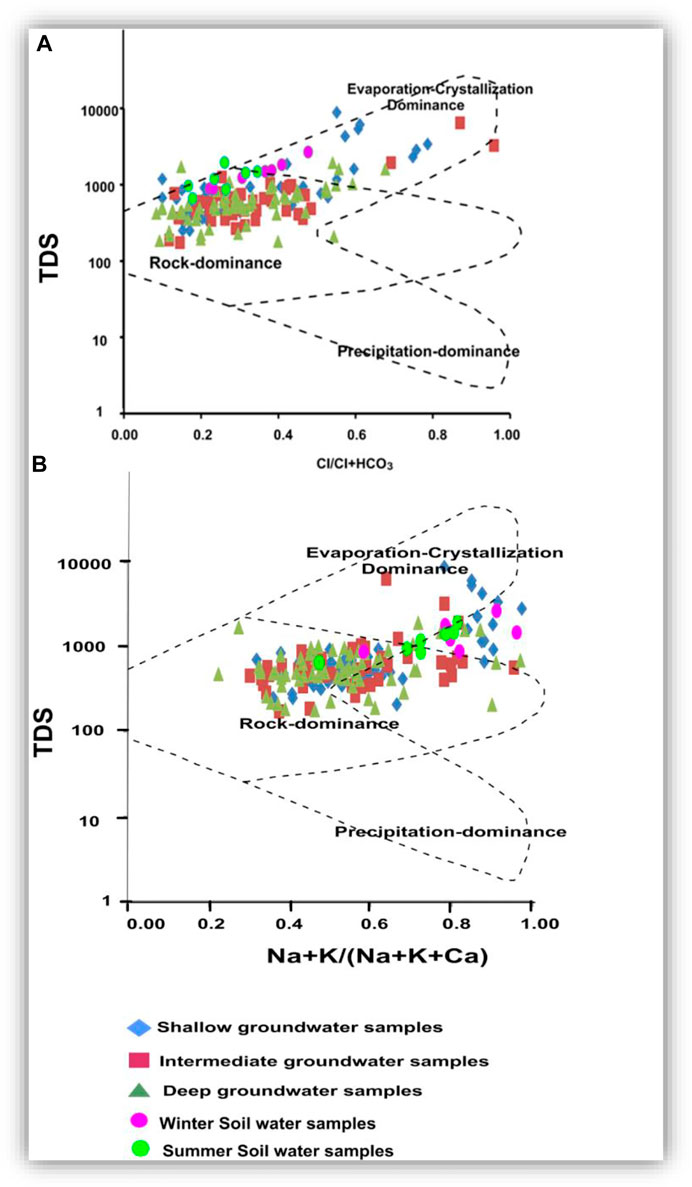
FIGURE 16. Gibbs diagrams (A,B) illustrate the hydrogeochemical processes controlling groundwater chemistry. Concentrations of TDS and ion are in mg/l.
As shown in Figure 16B, Na and Cl in some soil water, shallow, intermediate, and deep groundwaters could be related mainly to evaporation and seawater intrusion. Accumulations of evaporites, especially in the northern parts of the area, in the soil and farmland, such as anhydrite, gypsum, and halite, indicate the potential role of evaporation.
Figure 17 presents the relationships of TDS versus Ca, Mg, Na, HCO3, SO4, and Cl. In addition, the correlation coefficient values (r) are listed in Table 4. Plotting of TDS versus Ca, Na + K, and Cl (Figures 17A,B,F) gave very strong correlation relationships, where r = 0.88, 0.99, and 0.99, respectively, for the shallow groundwater, and r = 0.85, 0.97, and 0.99, respectively, for the intermediate groundwater. However, TDS had strong correlations with Ca (r = 0.74) and Na + K (r = 0.74) and very strong correlation with Cl (r = 0.80) for the deep groundwater.
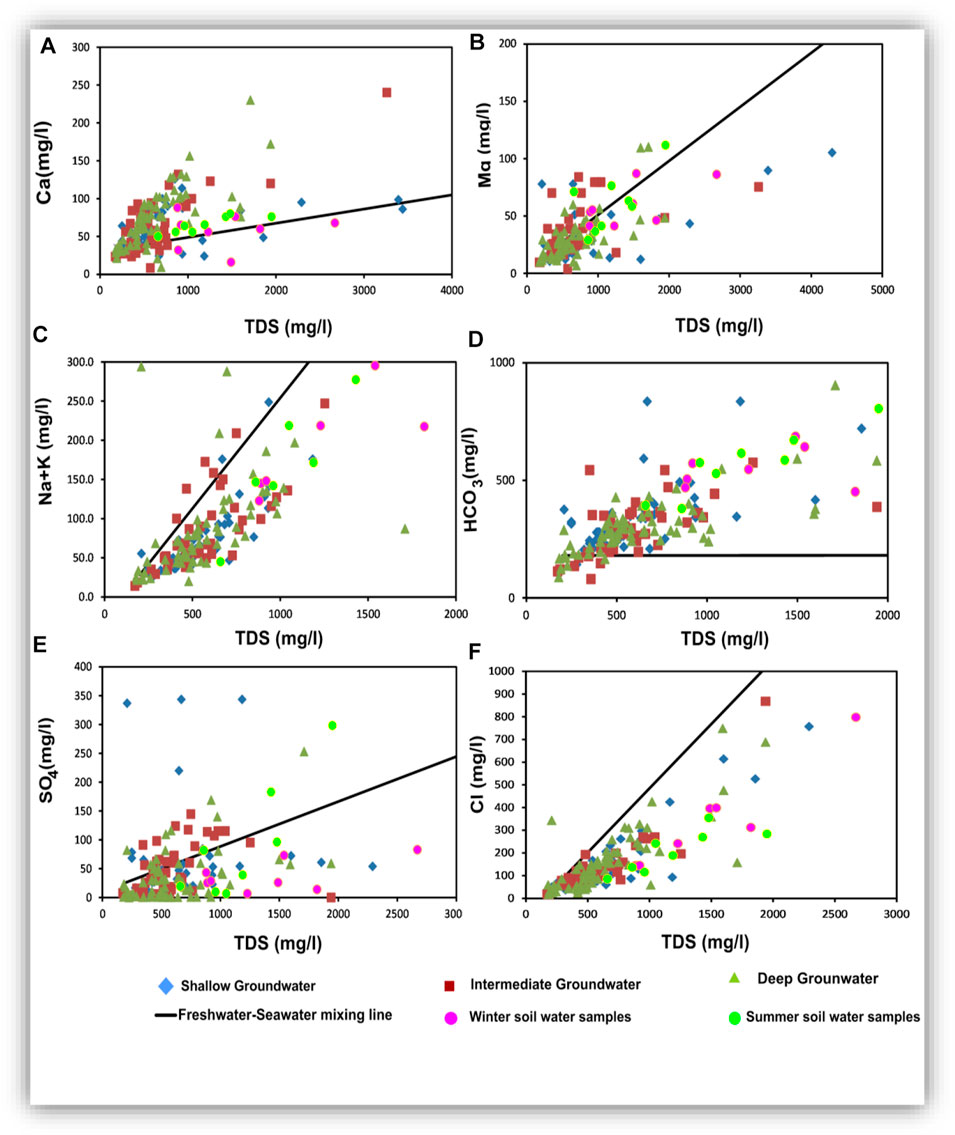
FIGURE 17. The relationships between total dissolved solids (TDS) and ion concentrations.
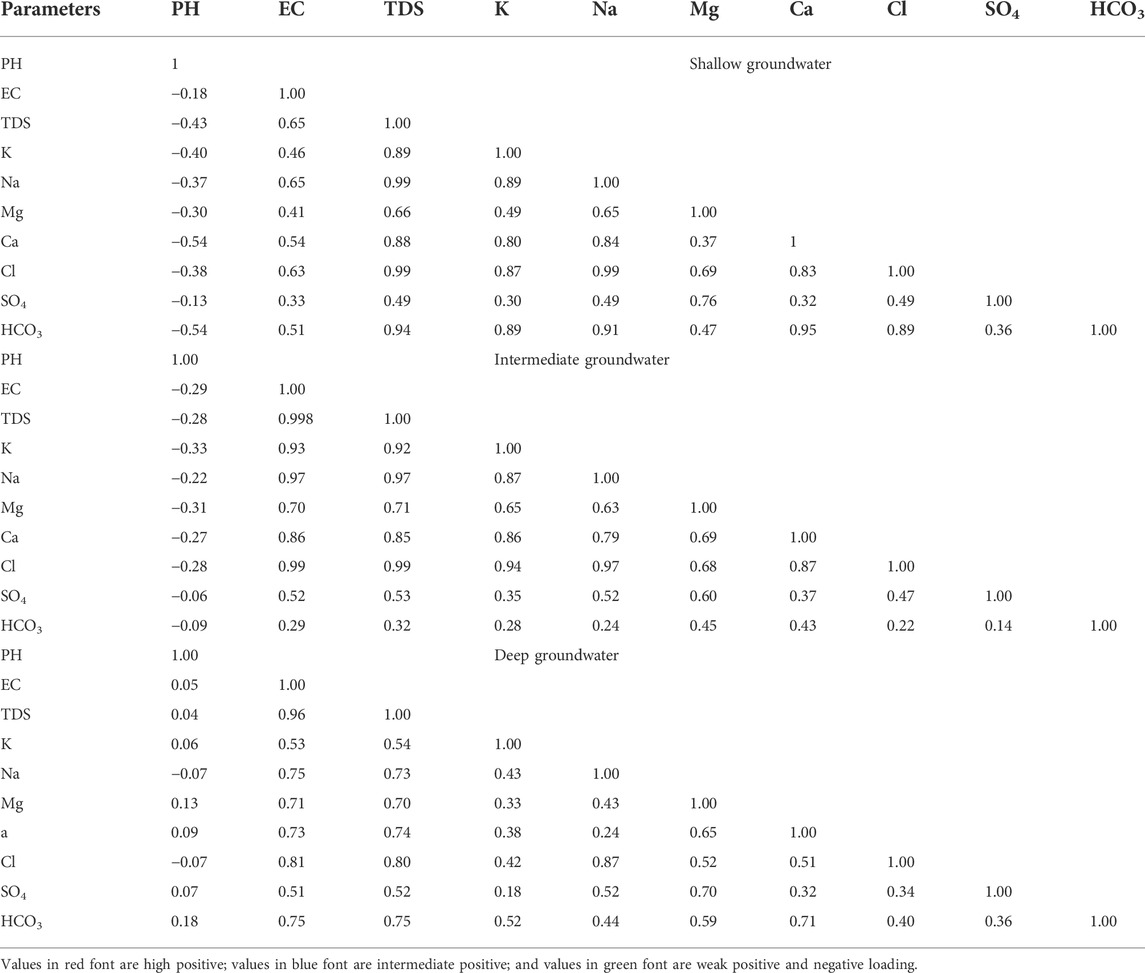
TABLE 4. Correlation matrix between physicochemical parameters in shallow, intermediate, and deep groundwater.
Plotting of TDS versus Mg (Figure 17B) showed an intermediate relationship for the shallow, intermediate, and deep groundwater (r2 = 0.66, 0.71, and 0.70, respectively). Plotting of TDS versus HCO3 (Figure 17C) showed a very strong relationship for the shallow and deep groundwater (r = 0.94 and 0.75, respectively), reflecting that carbonate might be related to the infiltration and dissolution processes. In contrast, the obtained weak correlation relationship for the intermediate groundwater (r = 0.32) suggested that carbonate ions were not of primary origin and they could be related to mineral weathering in this zone (Salem and Osman, 2017a; Masindi and Muedi, 2018; Ali et al., 2019; Liu et al., 2020).
Plotting of TDS versus SO4 (Figure 17E) showed intermediate correlation relationships for the shallow, intermediate, and deep groundwater (r = 0.49, 0.53, and 0.52, respectively). Sulfates were not mostly related to the freshwater–seawater mixing process but probably of soil and sediment origin. For TDS versus Na + K and Cl relationships, most samples were plotted parallel to the freshwater–seawater mixing line indicating the evaporation or/and the seawater intrusion effects. In all the relationships shown in Figure 17, plotted soil samples indicated that the soil hydrochemical processes are very effective in the hydrochemical characteristics of the studied groundwater, where they act as an important origin of the dissolved ions. Mixing infiltrated soil water and seeped canal water was the major effective hydrochemical process influencing the current groundwater chemistry (Masindi and Muedi, 2018; Liu et al., 2020).
The relationships among the major ions are very important for comparing different water characteristics, estimating the possible origins of salts, and identifying the effective hydrogeochemical processes occurring within the aquifer (Hem, 1985). Table 5 presents a statistical summary of the calculated ionic ratios, and Figure 18 shows the scatter binary plots among the major ions (Figure 18).
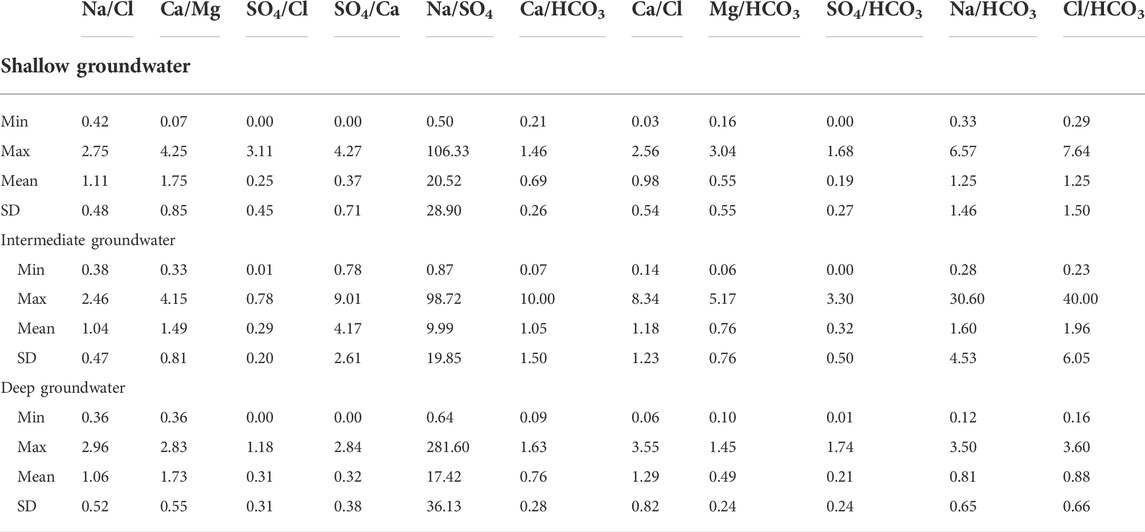
TABLE 5. Ionic ratios of the groundwater samples.
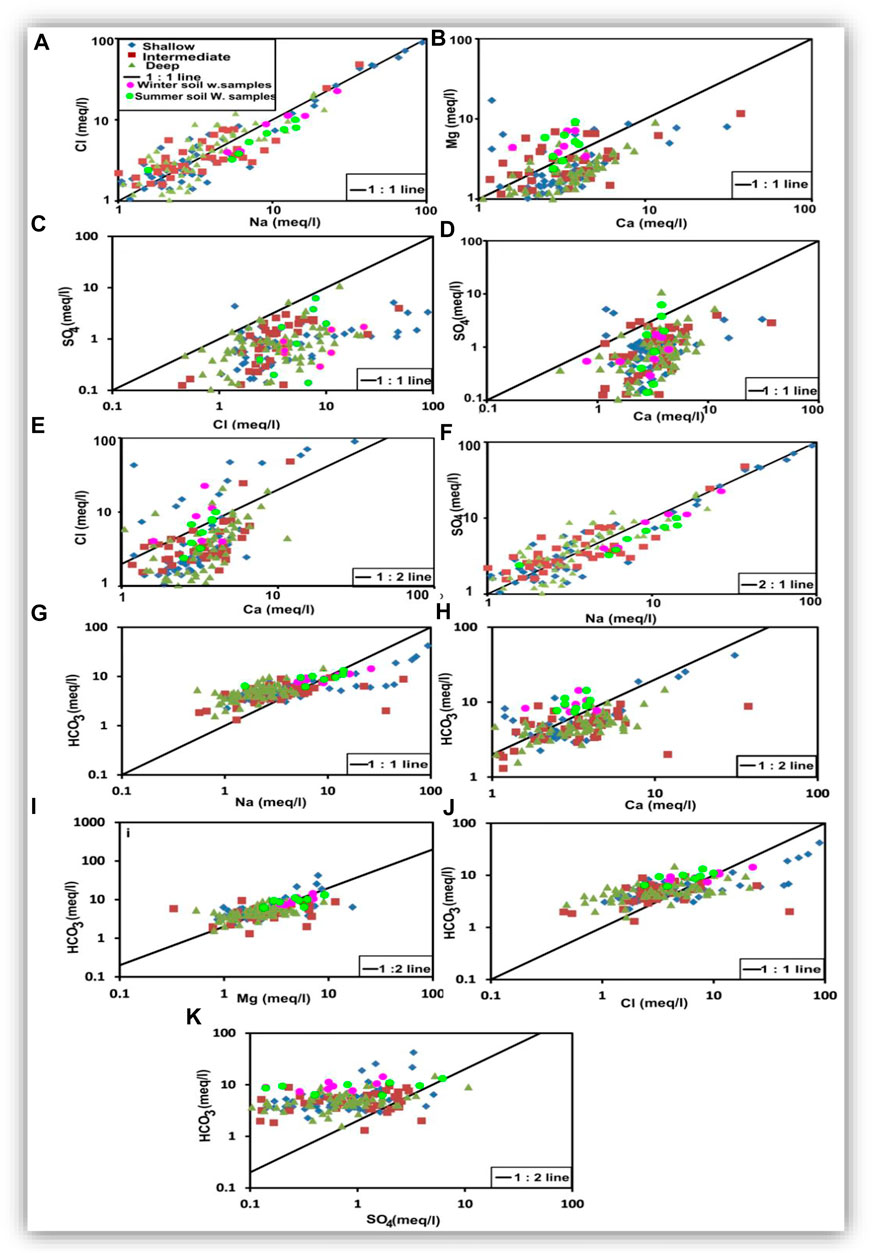
FIGURE 18. Ionic relationships to estimate the hydrogeochemical processes that occur in the groundwater.
The Na–Cl imbalance in water can be expressed by the Na/Cl ratio. If the Na/Cl ratio is greater than unity, water is said to be of meteoric origin. However, it is of marine origin if the ratio is less than unity, where the Na/Cl ratio of seawater is 0.86 (Khaska et al., 2013; Ibrahim et al., 2021). The Na/Cl ratio in the groundwater samples ranged from 0.42 to 2.75, with a mean value of 1.11. The Na/Cl ratios less than 0.86 may represent groundwater affected by seawater intrusion (Panno et al., 2006). Table 5 and Figure 18A showed that most samples (55%) of shallow groundwater had values of Na/Cl higher than unity, where they have Cl− concentration less than Na+, reflecting the meteoric origin, meteoric water recharge, and/or dissolution of terrestrial salts (Ibrahim et al., 2021). The Na/Cl ratios higher than unity may represent groundwater contaminated by anthropogenic sources (Panno et al., 2006). In contrast, most samples of the intermediate groundwater (56%) and the deep groundwater (58%) had values of Na/Cl less than unity, where they have Na+ concentration less than Cl− (Table 5 and Figure 18A), reflecting the effect of seawater intrusion and/or dissolution of marine sediments in the aquifer matrix (Ibrahim et al., 2021). The correlation coefficients (r) were 0.99, 0.97, and 0.87 for shallow, intermediate, and deep groundwater, respectively (Table 4). Soil water samples showed Na/Cl values higher than unity, where sodium addition in the soil zone was one of the main hydrochemical processes through mineral weathering and ion exchange processes (Bouderbala and Gharbi, 2017; Zhang et al., 2020).
The Ca/Mg ratio for seawater = 0.25; therefore, it can be used for tracing contamination by seawater (Salem and El-Horiny, 2014; Barzegar et al., 2016; Hussien and Faiyad, 2016). The Ca/Mg ratio of the groundwater samples ranged from 0.07 to 4.25, with a mean value of 1.75, indicating the enrichment of Ca, which is an indicator of seawater intrusion (Panno et al., 2006). Most samples of shallow (84%), intermediate (67%), and deep groundwater (89.5%) had a Ca/Mg ratio higher than unity (Table 5 and Figure 18B), reflecting the dissolution of calcium-rich minerals and leaching of gypsum in the aquifer matrix (Ibrahim et al., 2021). In addition, the rest of the samples in the three zones had a Ca/Mg ratio lower than unity (Table 5), which might indicate the ion exchange and/or precipitation of carbonates (Salem and El-Horiny, 2014; Ibrahim et al., 2021). Correlation coefficients (r) of calcium-magnesium relationships were 0.37, 0.69, and 0.65 for the shallow, intermediate, and deep groundwater, respectively (Table 4), suggesting different origins of both Ca and Mg. High values of this ratio may indicate the dissolution of gypsum, anhydrite, and calcite; surface water mixing; and/or CO2-CaCO3 interaction. Soil water samples with higher Mg than Ca indicate the ion exchange between Ca of water and Na of the soils, resulting in excess Na and lower Ca in the soil water (Zhang et al., 2020).
The SO4/Cl ratio was used to estimate the role of halite, gypsum, or anhydrite dissolution. About 96%, 100%, and 98% of shallow, intermediate, and deep groundwater samples, respectively, had an SO4/Cl ratio lower than unity (Table 5), indicating the dissolution of gypsum and anhydrite. In contrast, some samples had values of SO4/Cl less than the ratio of seawater (0.12), indicating seawater intrusion (Ibrahim et al., 2021). The plotted soil and groundwater samples (Figure 18C) are distributed on the scatter plot of SO4 versus Cl with no definite trend, where r = 0.50, 0.47, and 0.34 for the shallow, intermediate, and deep groundwater, respectively (Table 4). Such relationships suggest the presence of several sources for SO4 and Cl ions, such as dissolution, evaporation, and seawater intrusion. The soil samples are matched with the plotted groundwater samples indicating the soil hydrochemical processes were effective in the origin of the two ions. Approximately 93%, 96%, and 97% of the shallow, intermediate, and deep groundwater samples had SO4/Ca ratios less than unity (Table 5). The plotted samples (Figure 18D) are distributed on the scatter plot of SO4 versus Ca with no definite trend, where r = 0.33 for the shallow, 0.37 for the intermediate, and 0.32 for the deep groundwater (Table 4). As soil water was matched with the groundwater, the low SO4/Ca ratio indicates that the addition of calcium occurred by the dissolution of Ca-rich minerals more than gypsum (Kumar et al., 2009; Salem and El-horiny, 2014; Salem et al., 2015).
The Ca/Cl ratio is used to understand the modification of groundwater composition through the dissolution of calcite, dolomite, gypsum, and anhydrite. The Ca/Cl ratio for the groundwater samples had a mean value less than unity (45% for shallow groundwater, 53% for intermediate groundwater, and 57% for deep groundwater) (Table 5). The Ca-Cl scatter plot (Figure 18E) showed a scattered pattern with r values of 0.83, 0.87, and 0.51, respectively (Table 4). These coefficient and soil samples’ scattering patterns confirm that both ions were affected by the same hydrogeochemical processes, such as evaporation in the soil zone and the shallow and intermediate groundwater zones. In the deep zone, they have different origins where higher Cl is mostly related to seawater intrusion and Ca traces the freshwater origin (Li et al., 2016). As shown in Table 5, the Ca/Cl ratio showed enrichment of Ca2+ with respect to Cl− with depth indicating the ion exchange process, where Na+ was consumed by an exchange, whereas Ca2+ was released (Gopinath et al., 2016).
The Na relationships with Ca and Mg are significant in shallow groundwater (r = 0.84 and 0.65, respectively) and intermediate groundwater (r = 0.79 and 0.63, respectively, Table 4), where Na increases with calcium and magnesium increase. The Na-Ca and Na-Mg relationships have weak strengths in the deep groundwater zone (r = 0.24 and 0.43, respectively, Table 4), suggesting different origins for these ions, where Na could be mostly related to seawater intrusion, whereas Ca and Mg are of freshwater origin. The Na-SO4 relationship has weak strength in the shallow groundwater (r = 0.48) and intermediate strength in both intermediate and deep groundwater zones (r = 0.51) (Table 4 and Figure 18F), indicating the association between these two ions that might be related to the ion exchange processes. HCO3 shows a good correlation with Na for the shallow groundwater, where the r value is 0.91 (Table 4). Most of the shallow groundwater samples (about 69%) have Na/HCO3 ratio values less than unity (Table 5 and Figure 18G). The Na/HCO3 relationship (Figure 18G) shows no trend pattern with r values of 0.24 and 0.45 (Table 4) for the intermediate and deep groundwater, respectively. About 67% and 82% of the intermediate and deep groundwater samples, respectively, have Na/HCO3 ratios less than unity (Table 5). A high correlation between Na and HCO3 in the shallow zone indicates the replacement of Ca by Na in both soil water and shallow zones. The low correlation in the intermediate and deep zones is attributed to different origins, where Na is mostly related to seawater intrusion and HCO3 is of freshwater origin in the southern part (Elango and Kannan, 2007; Luo et al., 2018).
HCO3 strongly correlates with Ca for both the shallow and deep groundwater samples, where r = 0.94 and 0.71, respectively. The HCO3-Ca relationship has a weak strength where r = 0.43 (Table 4 and Figure 18H) for the intermediate groundwater. HCO3 shows a weak correlation with Mg, where r = 0.47 and 0.45 for the shallow and intermediate zones, respectively (Table 4 and Figure 18I), and a moderate correlation in the deep groundwater, where r = 0.59 (Table 4). Most of the shallow groundwater samples, 89% and 93%, have values less than unity for Ca/HCO3 and Mg/HCO3 ratios, respectively (Table 5). Besides, about 78% and 53% of the intermediate groundwater samples and 87% and 97% of the deep groundwater samples have the Ca/HCO3 and Mg/HCO3 ratios less than unity, respectively (Table 5). Such trends and ratios suggest that the freshwater origin, dissolution of dolomite and calcite, rock weathering, and ion exchange of Ca and Mg with Na are the possible sources responsible for the dissolved carbonates and such low values of the ratios Ca/HCO3 and Mg/HCO3 recorded (Kumar et al., 2009; Salem and El-horiny, 2014; Salem et al., 2015).
The Cl-HCO3 relationship recorded a good correlation for the shallow groundwater (r = 0.89) (Table 4 and Figure 18J) and is weak for the intermediate and deep groundwater (r = 0.22 and 0.40, respectively). A higher correlation between Cl and HCO3 in the shallow zone could be due to the same origin. Surface and soil hydrological processes, including evaporation and organic matter decay, are the main sources of the higher concentrations of both ions in the shallow groundwater zone. The weak relationship between Cl and HCO3 in the intermediate and deep zones indicates two different origins, where higher Cl is mostly related to seawater intrusion and HCO3 traces the freshwater origin. The SO4-HCO3 relationship showed that the samples (Figure 18K) are distributed on the Cl-HCO3 scatter plot with no definite trend, where r = 0.37, 0.14, and 0.36 for the shallow, intermediate, and deep groundwater samples, respectively (Table 4). The soil samples are matched with the plotted groundwater samples, indicating that the soil hydrochemical processes were effective in the origin of the two ions. The Ca + Mg relationship with HCO3 + SO4 is strong for the shallow groundwater (r = 0.89), weak for the intermediate groundwater (r = 0.31), and intermediate for the deep zone (r = 0.61) (Figure 19A). Plotting of (Na + Mg + Ca) versus (HCO3 + SO4) showed significant correlations for the shallow and deep groundwater (r = 0.89 and 0.65, respectively) and weak correlations for the intermediate groundwater (r = 0.25) (Figure 19B). These two relationships suggested that soil water chemistry controls the groundwater composition where HCO3 and SO4 are mostly related to the mix between the groundwater seeped from the irrigation canals and that infiltrated via soils. Some shallow groundwater samples have higher HCO3 and SO4 concentrations than the soil water, which might be related to calcite and gypsum dissolution. Excess Ca + Mg in some groundwater samples could be caused by rock weathering (Zhen-Wu et al., 2016; Walraevens et al., 2018; Zhang et al., 2020).
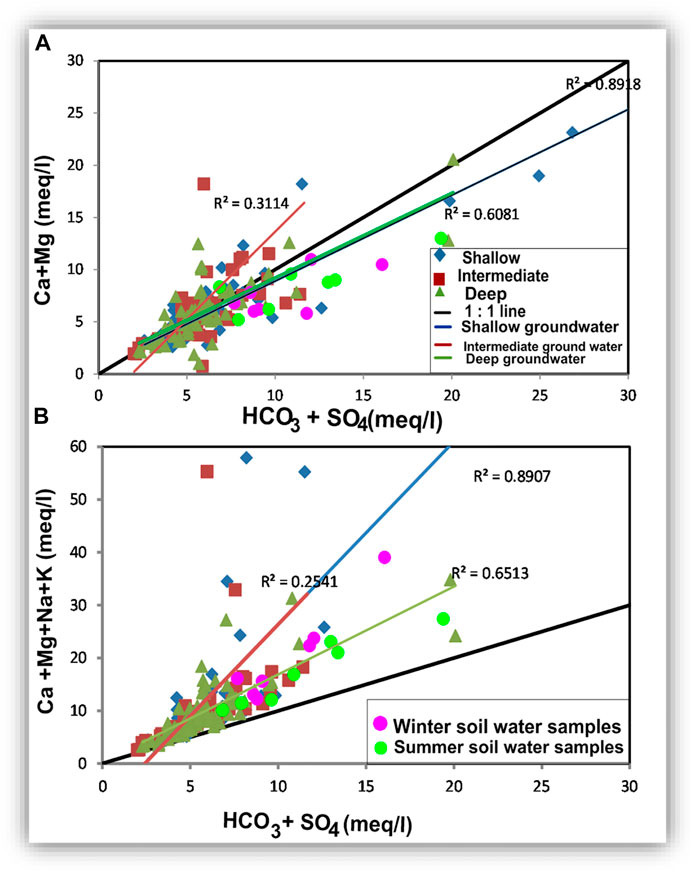
FIGURE 19. Relationships showing the role of sodium in forming salts with SO4 and HCO3 by replacing Ca and Mg in the dissolved sulfate and carbonate minerals.
Ion exchange reactions play a very important role between groundwater and clay minerals in the seepage zones. The plot of (Ca + Mg-HCO3-SO4) versus (Na-Cl) was used to estimate the occurrence of the ion exchange reactions within the groundwater aquifer. If all Cl comes from NaCl dissolution, the groundwater samples not affected by ion exchange will fall close to zero on the y-axis (Figure 20). The x-axis of Ca + Mg-HCO3-SO4 shows the amounts of Ca and Mg attributed to calcite, dolomite, and gypsum dissolution. If ion exchange reactions occur in the aquifer, the groundwater samples will fall on a straight line with a high correlation coefficient. The shallow, intermediate, and deep groundwater have r2 values of 0.87, 0.93, and 0.99, respectively (Figure 20). Therefore, it can be said that ion exchange and rock weathering are the predominant processes affecting groundwater chemistry. In the upper part of the diagram, soil and groundwater samples showed an excess of Na over Cl, where Na of the clays is replaced Ca and Mg in the solution. In the lower part of the diagram, an excess of Ca + Mg over HCO3 + SO4 was noticed. This could be related to rock weathering (Bouderbala and Gharbi, 2017; Dehnavi, 2018; Chen et al., 2019).

FIGURE 20. Binary diagram illustrates the ion exchange processes in the groundwater.
The Na/Cl and Ca/SO4 ratios in most of the soil water and groundwater samples were higher than 1 (Figures 21A,C). In contrast, most of the groundwater samples have Ca/HCO3 higher than 0.5, whereas most of soil water samples have values lower than 0.5. Regardless of the water salinity, ion exchange occurred in the soil water and most of the groundwater. The carbonate originating in the soil water from organic matter decaying is higher than Ca, whereas most of the groundwater samples have an excess of Ca compared to HCO3, which can be related to weathering of the Ca-rich mineral (Figure 21B).
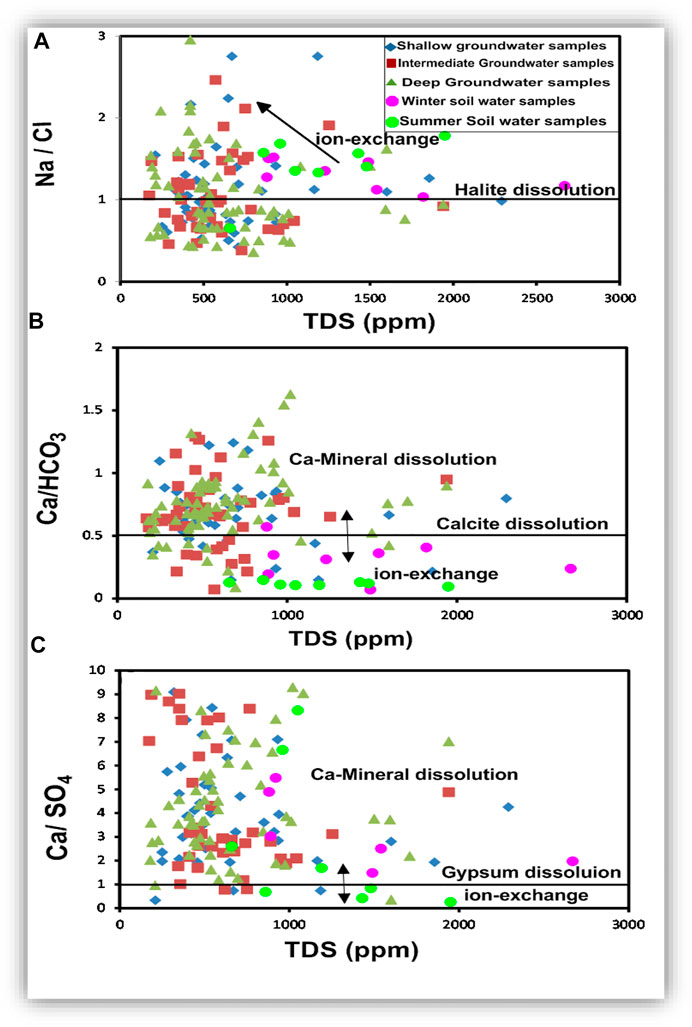
FIGURE 21. The TDS-ionic ratio relationships to estimate the effect of ion exchange and mineral dissolution on the hydrochemical composition of the groundwater.
Plotting of Ca/HCO3 versus Ca/SO4 (Figure 22) shows how calcium content is controlled by the dissolution of calcite and gypsum. All soil water samples have a Ca/HCO3 ratio of less than 0.5, and most of them showed Ca/SO4 higher than 1. Most of the groundwater samples have an excess of Ca over HCO3 and SO4. This means Ca-rich mineral (other than calcite and gypsum) dissolution and weathering are common processes in the groundwater. In the soil zone, lower SO4 compared to Ca and higher HCO3 compared to Ca occur due to the use of SO4 to produce HCO3 (Salem and Osman, 2017a; Zhang et al., 2020).
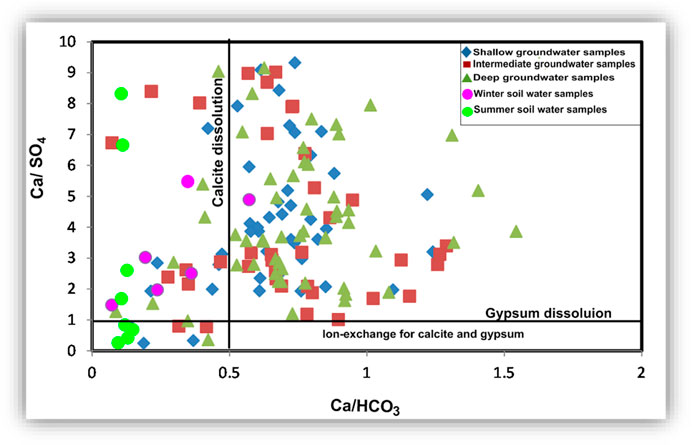
FIGURE 22. Binary relationship to estimate the effect of the ion exchange process on gypsum and calcite composition and the calcite and gypsum dissolutions.
Hydrochemical facies using HFE-D
In the intrusion phase, if saline water penetrates the freshwater aquifer, a reaction occurs that produces Ca and adsorbs Na in a reverse exchange reaction, as indicated by Eq. 3 (Appelo and Geirnaert, 1983; Anders et al., 2013; Gopinath et al., 2016). In the freshening phase, a direct ion exchange reaction occurs. If a salinized aquifer is flushed by fresh Ca-HCO3 water, Na will be released into the water and Ca will be absorbed, as indicated by Eq. 4 (Appelo and Geirnaert, 1983; Anders et al., 2013; Gopinath et al., 2016):
where X indicates the soil exchanger.
In the HFE-diagram (Figure 23), the freshening blue arrow represents the direction of the freshening sub-stage, and the intrusion red arrow represents the direction of the intrusion phase sub-stage. In the shallow groundwater (Figures 23A,B), freshening facies represented by MixCa-HCO3 natural freshwater occupy most of the central and the southern parts of the study area. Na-HCO3, salinized water with direct ion exchange, is represented in the central and southern parts of the study area. MixNa-HCO3 occupied central and northern parts of the area, and Ca-HCO3 was represented in two locations in the central part.
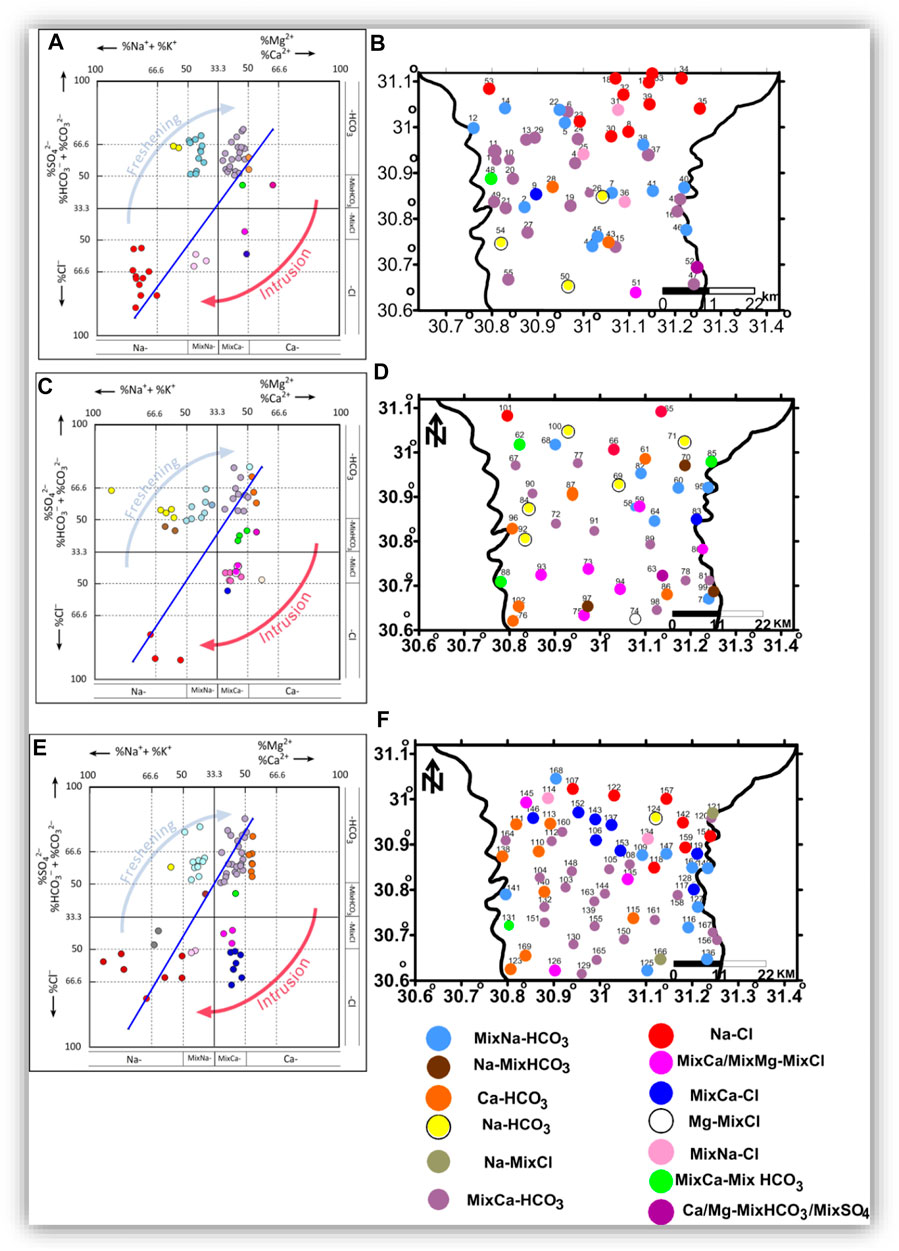
FIGURE 23. The HFE-diagrams (A,C,E) and facies spatial distribution in the shallow zone (B), intermediate zone (D), and deep zone (F).
Intrusion phase sub-stages were identified by MixCa-Cl salinized water with a reverse exchange, revealed at one location in the central part of the area; MixCa-MixHCO3 was revealed at the western central part of the area. Ca-MixHCO3 occupied one location southeast of the area. MixCa-MixCl was revealed in the southern part; and the Na-Cl type occupies the northern parts of the area (Anders et al., 2013; Gopinath et al., 2016).
In the intermediate zone (Figures 23C,D), sub-stages of freshening were represented by Na-HCO3, MixNa-HCO3, Na-MixHCO3, MixCa-HCO3, and Ca-HCO3, occupying most of the study area. Intrusion facies identified by MixCa-MixHCO3 wew represented as separated locations in the north and southwest of the area; Ca-MixHCO3 and MixCa-MixCl were revealed in the southern part; Mg-MixCl was only represented in the southern part, MixCa-Cl was shown only in the eastern part, and Na-Cl occupied the northern part. In Figures 23E,F, the deep zone was represented by the freshening facies Na-MixCl, MixNa-MixHCO3, Na-HCO3, MixNa-HCO3, MixCa-HCO3, and Ca-HCO3, occupying most of the study area, except for the northeastern parts, occupied by the intrusion facies. The Na-Cl water type represents the most affected groundwater by seawater and is located in the northern and northeastern parts of the area. The Na-Cl type is followed to the south by MixNa-Cl, MixCa-Cl and MixCa-MixCl, indicating seawater intrusion (Anders et al., 2013; Gopinath et al., 2016).
The sea and fresh groundwater types and their ideal interaction zone are clearly represented in the deep zone (Figure 23F). In contrast, this interaction zone in the shallow groundwater is not represented (Figure 23B). This means the groundwater with high salinity detected in the northeastern part of the area in the shallow zone is not due to seawater intrusion, but it could be related to surface hydrological and soil salinity processes. The intermediate zone could be considered an intermediate stage between the shallow and deep zones.
Conclusion
The analysis of soil water samples revealed that salinity (TDS) and major ion showed higher values in winter than in summer. The salinity of the groundwater ranged from fresh to saline. The groundwater salinity increased in the northern direction, which might be related to either seawater intrusion or surface conditions. The recorded higher salinity of the shallow groundwater compared to the intermediate and the deep zones indicated that surface activities, soil salinity, and human activities are responsible for the high salinity of this zone. The seawater indicative ions (Na + K and Cl) and TDS had a higher concentration in the shallow and intermediate zones than in the deep zone. This could be related to leakage from canals and drains, human activities, and evaporation, whereas seawater intrusion was the main factor affecting the salinity of deep groundwater. Meteoric water and marine water types were indicated, suggesting that the groundwater was affected by recent recharge from the Nile branches, canals, and drains in addition to seawater intrusion and evaporation. Evaporation, dissolution, ion exchange, seawater intrusion, leakage, recent recharge, and human activities were the major processes controlling groundwater chemistry in the three zones.
Continuous monitoring of the available water resources, identification, and reduction of pollution sources through sustainable development plans are essential requirements for maintaining the quality of the available water resources for different human uses. Sustainable development involving the management of wastewater and environmental pollution needs to be assessed, and mitigation measures are proposed to combat the negative impacts of human activities. Efforts and planning should be carried out in urban and industrial areas to reduce the number of vehicles to mitigate the amount of emissions, prevent and criminalize irrigation from wastewater, improve drainage systems, replacing old irrigation methods with modern irrigation methods that reduce water wastage in irrigation, and reduce the use of pesticides and agrochemicals. The hydrochemical parameters are useful for understanding the hydrogeological conditions and assessing the water quality for different human uses.
Data availability statement
The raw data supporting the conclusion of this article will be made available by the authors without undue reservation.
Author contributions
ZS: fieldwork, data processing, review, and writing the manuscript. AE: fieldwork, lab work, and writing, AA: Lab work, data processing, and writing. JE: manuscript modification and English review.
Acknowledgments
The authors are grateful to Tanta University for the financial support offered by Project no. “TU-01-12-03” during the course of this paper.
Conflict of interest
The authors declare that the research was conducted in the absence of any commercial or financial relationships that could be construed as a potential conflict of interest.
Publisher’s note
All claims expressed in this article are solely those of the authors and do not necessarily represent those of their affiliated organizations or those of the publisher, the editors, and the reviewers. Any product that may be evaluated in this article, or claim that may be made by its manufacturer, is not guaranteed or endorsed by the publisher.
References
Abd El-bary, M. H. (2011). Integration of geological, hydrogeological and geophysical investigation in solving some envirnmental problems in the central part of Nile Delta, Egypt. Ph, D. Thesis (Tanta: Geology Department, Fac. of Sci. Tanta Univ).
Abu Khatita, A. M., Koch, R., and Bamousa, A. O. (2020). Sources identification and contamination assessment of heavy metals in soil of Middle Nile Delta, Egypt. J. Taibah Univ. Sci. 14 (1), 750–761. doi:10.1080/16583655.2020.1771833
Aderemi, B. A., Olwal, T. O., Ndambuki, J. M., and Rwanga, S. S. (2022). A review of groundwater management models with a focus on IoT-based systems. Sustainability 14 (148). doi:10.3390/su14010148
Aghazadeh, N., Chitsazan, M., and Golestan, Y. (2016). Hydrochemistry and quality assessment of groundwater in the Ardabil area, Iran. Appl. Water Sci. 7 (7), 3599–3616. doi:10.1007/s13201-016-0498-9
Ahmed, M. A., Abdel Samie, S. G., and Badawy, H. A. (2012). Factors controlling mechanisms of groundwater salinization and hydrogeochemical processes in the Quaternary aquifer of the Eastern Nile Delta, Egypt. Environ. Earth Sci. 68, 369–394. doi:10.1007/s12665-012-1744-6
Ali, H., Khan, E., and Ilahi, I. (2019). Environmental chemistry and ecotoxicology of hazardous heavy metals: Environmental persistence, toxicity, and bioaccumulation. J. Chem., 1–14. doi:10.1155/2019/6730305
Anders, R., Mendez, G. O., Futa, K., and Danskin, W. R. (2013). A geochemical approach to determine sources and movement of saline groundwater in a coastal aquifer. Groundwater 52 (5), 756–768. doi:10.1111/gwat.12108
Appelo, C. A. J., and Geirnaert, W. (1983). Processes accompanying the intrusion of salt water. Geol. Appl. Idrogeol. 18-II, 29–40.
Ardakani, A. H. H., Shojaei, S., Siasar, H., and Ekhtesasi, M. R. (2018). Heuristic evaluation of groundwater in arid zones using remote sensing and geographic information system. Int. J. Environ. Sci. Technol. (Tehran). 17, 633–644. doi:10.1007/s13762-018-2104-1
Argamasilla, A., Barberá, J. A., and Andreo, B. (2017). Factors controlling groundwater salinization and hydrogeochemical processes in coastal aquifers from southern Spain. Sci. Total Environ. 580, 50–68. doi:10.1016/j.scitotenv.2016.11.173
Armanuos, A. M., Ibrahim, M. G., Mahmod, W. E., Negm, A., Yoshimura, C., Takemura, J., et al. (2017). Evaluation of the potential impact of Grand Ethiopian Renaissance Dam and pumping scenarios on groundwater level in the Nile Delta aquifer. Water Sci. Technol. Water Supply 17 (5), 1356–1367. doi:10.2166/ws.2017.037
Arnous, M. O., El-Rayes, A. E., and Green, D. R. (2015). Hydrosalinity and environmental land degradation assessment of the East Nile Delta region, Egypt. J. Coast. Conserv. 19, 491–513. doi:10.1007/s11852-015-0402-z
Ataie-Ashtiani, B., Werner, A. D., Simmons, C. T., Morgan, L. K., and Lu, C. (2013). How important is the impact of land-surface inundation on seawater intrusion caused by sea-level rise. Hydrogeol. J. 21 (7), 1673–1677. doi:10.1007/s10040-013-1021-0
Balkhair, K. S., and Ashraf, M. A. (2016). Field accumulation risks of heavy metals in soil and vegetable crop irrigated with sewage water in Western region of Saudi Arabia. Saudi J. Biol. Sci. 23, S32–S44. doi:10.1016/j.sjbs.2015.09.023
Barzegar, R., Moghaddam, A. A., Najib, M., Kazemian, N., and Adamowski, J. (2016). Characterization of hydrogeologic properties of the Tabriz plain multilayer aquifer system, NW Iran. Arab. J. Geosci. 9, 147. doi:10.1007/s12517-015-2229-1
Bouderbala, A., and Gharbi, B. Y. (2017). Hydrogeochemical characterization and groundwater quality assessment in the intensive agricultural zone of the Upper Cheliff plain, Algeria. Environ. Earth Sci. 76 (21), 744. doi:10.1007/s12665-017-7067-x
Costall, A. R., Harris, B. D., Teo, B., Schaa, R., Wagner, F. M., and Pigois, J. P. (2020). Groundwater throughflow and seawater intrusion in high quality coastal aquifers. Sci. Rep. 10 (1), 9866. doi:10.1038/s41598-020-66516-6
Chen, J., Huang, Q., Lin, Y., Fang, Y., Qian, H., Liu, R., et al. (2019). Hydrogeochemical characteristics and quality assessment of groundwater in an irrigated region, northwest China. Water 11 (1), 96. doi:10.3390/w11010096
Choi, B-Y., Yun, S-T., Yu, S-Y., Lee, P-K., Park, S-S., Chae, G-T., et al. (2005). Hydrochemistry of urban groundwater in seoul, South Korea: Effects of land-use and pollutant recharge. Environ. Geol. 48, 979–990. doi:10.1007/s00254-004-1205-y
Dehnavi, A. G. (2018). Hydrochemical assessment of groundwater using statistical methods and ionic ratios in Aliguodarz, Lorestan, west of Iran. J. Adv. Environ. Health Res. 6, 193–201. doi:10.22102/JAEHR.2018.137767.1091
Diab, M. S., and Saleh, M. F. (1982). The hydrogeochemistry of the pleistocene aquifer in the nile delta area, Egypt. Environ. Int. 7, 221–230. doi:10.1016/0160-4120(82)90109-x
El-Amier, Y. A., Bonanomi, G., Al-Rowaily, S. L., and Abd-ElGawad, A. M. (2020). Ecological risk assessment of heavy metals along three main drains in nile delta and potential phytoremediation by macrophyte plants. Plants 9 (7), 910. doi:10.3390/plants9070910
El-Sabbagh, A. A. A. (2000). Evaluation of environmental impact on water resources and soil characteristics in the eastern Nile Delta area, Egypt. PhD Thesis (Cairo: Fac. Sci. Cairo Univ).
El-Sayed, S. A. (2018). Contribution to the ground water hydrology of the quaternary aquifer in west ismailia area, Egypt. J. Geoscience Environ. Prot. 6, 134–158. doi:10.4236/gep.2018.67010
Elango, L., and Kannan, R. (2007). Chapter 11 Rock–water interaction and its control on chemical composition of groundwater. Dev. Environ. Sci. 5, 229–243. doi:10.1016/S1474-8177(07)05011-5
Ferguson, G., and Gleeson, T. (2012). Vulnerability of coastal aquifers to groundwater use and climate change. Nat. Clim. Chang. 2, 342–345. doi:10.1038/nclimate1413
Gaaloul, N., Pliakas, F., Kallioras, A., Schuth, C., and Marinos, P. (2012). Simulation of seawater intrusion in coastal aquifers: Forty Five’Years exploitation in an eastern coast aquifer in NE Tunisia. Open Hydrol. J. 6, 31–44. doi:10.2174/1874378101206010031
Ghoraba, S. M., Zyedan, B. A., and Rashwan, I. M. H. (2013). Solute transport modeling of the groundwater for quaternary aquifer quality management in Middle Delta, Egypt. Alexandria Eng. J. 52 (2), 197–207. doi:10.1016/j.aej.2012.12.007
Gopinath, S., Srinivasamoorthy, K., Vasanthavigar, M., Saravanan, K., Prakash, R., Suma, C. S., et al. (2016). Hydrochemical characteristics and salinity of groundwater in parts of nagapattinam district of Tamil nadu and the union territory of puducherry, India. Carbonates Evaporites 33 (1), 1–13. doi:10.1007/s13146-016-0300-y
Hajji, S., Allouche, N., Bouri, S., Aljuaid, A. M., and Hachicha, W. (2022). Assessment of seawater intrusion in coastal aquifers using multivariate statistical analyses and hydrochemical facies evolution-based model. Int. J. Environ. Res. Public Health 19 (155). doi:10.3390/ijerph19010155
Hem, J. D. (1985). US Geological Survey Water-Supply Paper 2254. 3rd edition. Charlottesville: University of Virginia, 263.Study and interpretation of the chemical characteristics of natural water
Hussien, B. M., and Faiyad, A. S. (2016). Modeling the hydrogeochemical processes and source of ions in the groundwater of aquifers within kasra-nukhaib region (west Iraq). Int. J. Geosciences 7, 1156–1181. doi:10.4236/ijg.2016.710087
Ibrahim, R. G. M., Ali, M. E. A., Abdel Satar, Y. M., Sabaa, M., and Ezzat, H. (2021). Ionic ratios as tracers to assess seawater intrusion and to identify salinity sources in ras suder coastal aquifer, south west sinai, Egypt. Curr. Sci. Int. 10 (04), 599–622. doi:10.36632/csi/2021.10.4.51
Kanagaraj, G., Elango, L., Sridhar, S. G. D., and Gowrisankar, G. (2018). Hydrogeochemical processes and influence of seawater intrusion in coastal aquifers south of Chennai, Tamil Nadu, India. Environ. Sci. Pollut. Res. 25, 8989–9011. doi:10.1007/s11356-017-0910-5
Kawoa, N. S., and Karuppannan, S. (2018). Groundwater quality assessment using water quality index and GIS technique in Modjo River Basin, central Ethiopia. J. Afr. Earth Sci. 147, 300–311. doi:10.1016/j.jafrearsci.2018.06.034
Khalifa, A. A., Elshemy, M. M., Masoud, A. A., and Rashwan, I. M. H. (2019). Assessment of aquifer vulnerability for pollution for middle delta in Egypt using Geographic Information System and DRASTIC technique. J. Eng. Res. Ponta. Grossa. 3 (16), 132–139. doi:10.21608/erjeng.2019.125528
Khaska, M., Le Gal La Salle, C., Lancelot, J., Team, A., Mohamad, A., Verdoux, P., et al. (2013). Origin of groundwater salinity (current seawater vs. saline deep water) in a coastal karst aquifer based on Sr and Cl isotopes. Case study of the La Clape massif (southern France). Appl. Geochem. 37, 212–227. doi:10.1016/j.apgeochem.2013.07.006
Kim, R., Kim, J., Ryu, J., and Koh, D. (2019). Hydrogeochemical characteristics of groundwater influenced by reclamation, seawater intrusion, and land use in the coastal area of Yeonggwang, Korea. Geosci. J. 23, 603–619. doi:10.1007/s12303-018-0065-5
Kumar, H., Saini, V., Kumar, D., and Chaudhary, R. S. (2009). Influence of trisodium phosphate (TSP) anti-salant on the corrosion of carbon steel in cooling water systems. Indian J. Chem. Technol. 16, 401–410.
Kumar, N., Kumar, A., Marwein, B. M., Verma, D. K., Jayabalan, I., Kumar, A., et al. (2021). Agricultural activities causing water pollution and its mitigation – a review. Int. J. Mod. Agric. 10 (1), 590–609.
Li, P., Wu, J., Qian, H., Zhang, Y., Yang, N., Jing, L., et al. (2016). Hydrogeochemical characterization of groundwater in and around a wastewater irrigated forest in the southeastern edge of the tengger desert, northwest China. Expo. Health 8 (3), 331–348. doi:10.1007/s12403-016-0193-y
Liu, J., Wang, M., Gao, Z., Chen, Q., Wu, G., and Li, F. (2020). Hydrochemical characteristics and water quality assessment of groundwater in the yishu river basin. Acta Geophys. 68, 877–889. doi:10.1007/s11600-020-00440-1
Llopis-Albert, C., Merigo, J. M., and Yejun, X. (2016). A coupled stochastic inverse/sharp interface seawater intrusion approach for coastal aquifers under groundwater parameter uncertaint. J. Hydrol. 540, 774–783.
Luo, W., Gao, X., and Zhang, X. (2018). Geochemical processes controlling the groundwater chemistry and fluoride contamination in the yuncheng basin, China—an area with complex hydrogeochemical conditions. PLOS ONE 13 (7), e0199082. doi:10.1371/journal.pone.0199082
Luoma, S., Klein, J., and Backman, B. (2013). “Climate change and groundwater: Impacts and Adaptation in shallow coastal aquifer in Hanko, south Finland,” in Climate change adaptation in practice–from strategy Development to implementation. Editors P. Schmidt Thomé, and J. Klein (Wiley-Blackwell), 137–155.
Mabrouk, B., Arafa, S., and Gemail, Kh (2015). Water management strategy in assessing the water scarcity in Northern Western region of Nile Delta, Egypt. Geophys. Res. Abstr. 17, EGU2015–15805. EGU General Assembly 2015.
Masindi, V., and Muedi, K. L. (2018). Environmental contamination by heavy metals. Intech Open, pp115–133. doi:10.5772/intechopen.76082
Mgbenu, C. N., and Egbueri, J. C. (2019). The hydrogeochemical signatures, quality indices and health risk assessment of water resources in Umunya district, southeast Nigeria. Appl. Water Sci. 9 (1), 22. doi:10.1007/s13201-019-0900-5
Nhu, V.-H., Rahmati, O., Falah, F., Shojaei, S., Al-Ansari, N., Shahabi, H., et al. (2020). Mapping of groundwater spring potential in karst aquifer system using novel ensemble bivariate and multivariate models. Water 12 (4), 985. doi:10.3390/w12040985
Okiongbo, K., and Akpofure, E. (2015). Identification of hydrogeochemical processes in groundwater using major ion chemistry: A case study of yenagoa and environs, southern Nigeria. Glo. Jnl. Geo. Sci. 12 (1), 39–52. doi:10.4314/gjgs.v12i1.5
Okofo, L. B., Bedu-Addo, K., and Martienssen, M. (2022). Characterization of groundwater in the 'tamnean' plutonic suite aquifers using hydrogeochemical and multivariate statistical evidence: A study in the garu-tempane district, upper east region of Ghana. Appl. Water Sci. 12, 22. doi:10.1007/s13201-021-01559-2
Panno, S. V., Hackley, K. C., Hwang, H. H., Greenberg, S. E., Krapac, I. G., Landsberger, S., et al. (2006). Characterization and identification of Na-Cl sources in ground water. Ground Water 44 (2), 176–187. doi:10.1111/j.1745-6584.2005.00127.x
Rasmussen, P., Sonnenborg, T. O., Goncear, G., and Hinsby, K. (2013). Assessing impacts of climate change, sea level rise, and drainage canals on saltwater intrusion to coastal aquifer. Hydrol. Earth Syst. Sci. 17, 421–443. doi:10.5194/hess-17-421-2013
RIGW (1992). Groundwater resources and projection of groundwater development, water security project, (WSP). Egypt: Research Institute for Groundwater.
RIGW (2002). Nile Delta groundwater modeling report. Kanater El- Khairia, Egypt: Research Institute for Groundwater.
Rusydi, A. F. (2018). Correlation between conductivity and total dissolved solid in various type of water: A review. IOP Conf. Ser. Earth Environ. Sci. 118, 012019. doi:10.1088/1755-1315/118/1/012019
Salem, Z. E., Negm, A. M., and Nahrawy, A. (2017c). “Hydrogeophysical characteristics of the central nile delta aquifer,” in Groundwater in the nile Delta (2019). The handbook of environmental chemistry. Editor A. Negm (Cham: Springer), Vol. 73.
Safaa, M. S., and Gad, M. (2014). Sustainable development and management of water resources in west nile delta, Egypt. Int. J. Sci. Eng. Res. 5, 1296–1310.
Salem, M. G., El-Awady, M. H., and Amin, E. (2012). Enhanced removal of dissolved iron and manganese from nonconventional water resources in delta district, Egypt energy. Procedia 18, 983–993. doi:10.1016/j.egypro.2012.05.113
Salem, Z. E., Atwia, M. G., and El-Horiny, M. M. (2015). Hydrogeochemical analysis and evaluation of groundwater in the reclaimed small basin of Abu Mina, Egypt. Hydrogeol. J. 23, 1781–1797. doi:10.1007/s10040-015-1303-9
Salem, Z. E., and El-Bayumy, D. A. (2016). Hydrogeological, petrophysical and hydrogeochemical characteristics of the groundwater aquifers east of Wadi El-Natrun, Egypt. NRIAG J. Astronomy Geophys. 5, 124–146. doi:10.1016/j.nrjag.2015.12.001
Salem, Z. E., and El-horiny, M. M. (2014). Hydrogeochemical evaluation of calcareous eolianite aquifer with saline soil in a semiarid area. Environ. Sci. Pollut. Res. 21 (13), 8294–8314. doi:10.1007/s11356-014-2735-9
Salem, Z. E., Elsaiedy, G., and ElNahrawy, A. (2017a). “Assessment of the groundwater quality for drinking and irrigation purposes in the Central Nile Delta Region, Egypt,” in Groundwater in the nile Delta (2019). The handbook of environmental chemistry. Editor A. Negm (Cham: Springer), Vol. 73.
Salem, Z. E., Elsaiedy, G., and ElNahrawy, A. (2017b). “Hydrogeochemistry and quality assessment of groundwater under some central nile delta villages, Egypt,” in Groundwater in the nile Delta (2019). The handbook of environmental chemistry. Editor A. Negm (Cham: Springer), Vol. 73.
Salem, Z. E., Fathy, M. S., Helal, A. I., Afifi, S. Y., and Attiah, A. M. (2021). “Groundwater quality for irrigation as an aspect of sustainable development approaches: A case study of semi-arid area around ismailia canal, eastern nile delta, Egypt,” in Groundwater in Egypt’s deserts. Editors A. Negm, and A. Elkhouly (Springer Water), 295–326. doi:10.1007/978-3-030-77622-0_12
Salem, Z. E., Gaame, O. M., and Hassan, T. M. (2018b). “Integrated subsurface thermal regime and hydrogeochemical data to delineate the groundwater flow system and seawater intrusion in the Middle Nile Delta, Egypt,” in Groundwater in the nile Delta (2019). The handbook of environmental chemistry. Editor A. Negm (Cham: Springer), Vol. 73.
Salem, Z. E. (2009). Natural and human impacts on the groundwater under an Egyptian village, central nile delta – A case study of mehallet menouf. 13th international water technology conference (IWTC, 13). Hurghada, Egypt 3, 1397–1414.
Salem, Z. E., and Osman, O. M. (2017b). “Use of geoelectrical resistivity to delineate the seawater intrusion in the northwestern part of the Nile Delta, Egypt,” in Groundwater in the nile Delta (2019). The handbook of environmental chemistry. Editor A. Negm (Cham: Springer), Vol. 73.
Salem, Z. E., and Osman, O. M. (2017a). Use of major ions to evaluate the hydrogeochemistry of groundwater influenced by reclamation and seawater intrusion, West Nile Delta, Egypt. Environ. Sci. Pollut. Res. 24 (4), 3675–3704. doi:10.1007/s11356-016-8056-4
Salem, Z. E., Temamy, A. M. A., Salah, M. K., and Kassa, M. (2016). Origin and characteristics of brackish groundwater in Abu madi coastal area, northern nile delta. Egypt. Estu. Coast Shelf Sci. 178, 21–35. doi:10.1016/j.ecss.2016.05.015
Salem, Z. E., Temamy, A. M., Salah, M. K., and Kassab, M. (2018a). “Evaluation of water resources qualities for agriculture irrigation in Abu madi area, northern middle nile delta,” in Conventional water resources and agriculture in Egypt (2019). The handbook of environmental chemistry. Editor A. M. Negm (Cham: Springer), Vol. 74.
Salman, S. A., Melegy, A, A., Shaban, A. M., and Hassaan, M. M. (2013). Hydrogeochemical characteristics and classification of groundwater in sohag governorate, Egypt. J. Appl. Sci. Res. Res. 9 (1), 758–769. 1819-544X.
Sherif, M. M. (1999). “The nile delta aquifer in Egypt,” in Seawater intrusion in coastal aquifers: Concepts, methods and practices. Theory and application of transport in porous media. Editors A. Cheng, D. Ouazar, I. Herrera, J. Bear, and S. Sorek (Netherlands: Kluwer Academic Publishers), Vol. 14, 559–590.
Shojaei, S., Jafarpour, A., Shojaei, S., Gyasi-Agyei, Y., and Rodrigo-Comino, J. (2021). Heavy metal uptake by plants from wastewater of different pulp concentrations and contaminated soils. J. Clean. Prod. 296, 126345. doi:10.1016/j.jclepro.2021.126345
Siddha, S., and Sahu, P. (2020). Status of seawater intrusion in coastal aquifer of Gujarat, India: A review. SN Appl. Sci. 2 (10), 1726. doi:10.1007/s42452-020-03510-7
Singh, A. K., Mondal, G. C., Singh, T. B., Singh, S., Tewary, B. K., and Sinha, A. (2012). Hydrogeochemical processes and quality assessment of groundwater in Dumka and Jamtara districts, Jharkhand, India. Environ. Earth Sci. 67, 2175–2191. doi:10.1007/s12665-012-1658-3
SNC (2010). Egypt’s second national communication. Egyptian Environmental Affairs Agency (EEAA-May 2010) under the United Nations framework convention on climate change
Todd, D. K., and Mays, L. W. (2005). Groundwater hydrology ed B zobrist. New Jersey: John Wiley & Sons.
Un-United Nations, (2003). Water for people, water for life; UN world development report (WWDR). New York, NY, USA: UN.
USGS (2011). A Graphical user interface to the geochemical model PHREEQC Interactive Computer Program of US GS 2.18.
Walraevens, K., Bakundukize, C., Mtoni, Y. E., and Van Camp, M. (2018). Understanding the hydrogeochemical evolution of groundwater in precambrian basement aquifers: A case study of bugesera region in Burundi. J. Geochem. Explor. 188, 24–42. doi:10.1016/j.gexplo.2018.01.003
WHO (World Health Organization) (2006). Guidelines for drinking-water quality. in First Addendum to Third Edition, Vol. 1 Recommendations. Geneva, Switzerland: WHO.
Wilson, J., Townley, R., and Sada Costa, A. (1979). Mathematical development and verification of a finite element aquifer flow model AQUIFEM-1. Technology adaptation program. Cambridge, MA. Report No.79–2.
Xie, X., Wang, Y., Li, J., Yu, Q., Wu, Y., Su, C., et al. (2015). Effect of irrigation on Fe (III)–SO42−redox cycling and arsenic mobilization in shallow groundwater from the datong basin, China: Evidence from hydrochemical monitoring and modeling. J. Hydrol. X. 523, 128–138. doi:10.1016/j.jhydrol.2015.01.035
Zeidan, B. A. (2017). “Groundwater degradation and remediation in the nile delta aquifer,” in The nile Delta, hdb. Editor A. M. Negm (© Springer International Publishing), 55, 159–232. doi:10.1007/698_2016_128
Zhang, B., Zhao, D., Zhou, P., Qu, S., Liao, F., and Wang, G. (2020). Hydrochemical characteristics of groundwater and dominant water–rock interactions in the delingha area, qaidam basin, northwest China. Water 12 (3), 836. doi:10.3390/w12030836
Zhen-Wu, B. Y., Dideriksen, K., Olsson, J., Raahauge, P. J., Stipp, S. L. S., and Oelkers, E. H. (2016). Experimental determination of barite dissolution and precipitation rates as a function of temperature and aqueous fluid composition. Geochim. Cosmochim. Acta 194, 193–210. doi:10.1016/j.gca.2016.08.041
Keywords: Nile Delta aquifer, seawater intrusion, hydrogeochemical processes, coastal aquifers, anthropogenic activities
Citation: Salem ZE, ElNahrawy A, Attiah AM and Edokpayi JN (2022) Vertical and spatial evaluation of the groundwater chemistry in the Central Nile Delta Quaternary aquifer to assess the effects of human activities and seawater intrusion. Front. Environ. Sci. 10:961059. doi: 10.3389/fenvs.2022.961059
Received: 03 June 2022; Accepted: 02 August 2022;
Published: 15 September 2022.
Edited by:
Saeed Shojaei, University of Tehran, IranReviewed by:
Venkatramanan Senapathi, Alagappa University, IndiaHamid Alipour, Yazd University, Iran
Copyright © 2022 Salem, ElNahrawy, Attiah and Edokpayi. This is an open-access article distributed under the terms of the Creative Commons Attribution License (CC BY). The use, distribution or reproduction in other forums is permitted, provided the original author(s) and the copyright owner(s) are credited and that the original publication in this journal is cited, in accordance with accepted academic practice. No use, distribution or reproduction is permitted which does not comply with these terms.
*Correspondence: Zenhom E. Salem, emVuaG9tc2FsZW1AeWFob28uY29t