 Najia Saqib
 Ivan A. Duran
 Ilma Sharif2
- 1Department of Finance, College of Business Administration, Prince Sultan University, Riyadh, Saudi Arabia
- 2Department of Applied Economics Research Center, University of Karachi, Karachi, Pakistan
Heterogeneous anthropogenic and insufficient development strategies have caused an international compromise between sustainable growth and environmental deterioration. Environmental concerns have necessitated rules and human capital to protect the global ecosystem. Literature is ambiguous on the usefulness of environmental rules in reducing environmental deterioration. This study examines the impact of environmental regulations and education as a proxy for human capital in Mexico, Indonesia, Nigeria, and Turkey (MINT) countries’ ecological footprints between 1990 and 2020. The econometric research shows that present environmental restrictions in MINT countries are unsuccessful at reducing their ecological footprints. Energy consumption and trade-openness also increase ecological footprints. The MINT countries panel also confirms the Environmental Kuznets Curve idea. The country-specific findings show that energy use silently harmed the environment in MINT nations, whereas environmental legislation, economic growth, and trade-openness had diverse effects. These findings suggest that in order for MINT nations to achieve environmental sustainability, they should strengthen and enforce environmental regulations; adopt policies that promote sustainable economic growth; reduce their reliance on fossil-fuels; improve quality education and awareness; and actively engage in sustainable trading activities.
Introduction
Researchers agree that anthropogenic global warming is one of the most important concerns facing the world today (Gamage and Sciulli, 2017). The United Nations Sustainable Development Goals (SDGs) have placed climate change as one of their top 17 goals to be fulfilled by the year 2030, making it one of the world’s largest issues. In a system where the cosmos works flawlessly, all of the segments of the universe are connected by a tremendous balance. Human life, as one of the components of the universe, relies on the balance element above all else. Natural equilibrium between humans and the natural world is the most potent component of this balance. As the natural balancing systems are intertwined, any damage to any one of them can have a ripple effect throughout the entire chain, causing environmental issues to arise. Because people have changed nature, this link has been broken, and the ecosystem is now in the process of getting worse. There was an increase in the number of people moving from rural areas to urban areas as a result of factories replacing local agricultural products with industrialization. People are using natural resources and energy production and consumption excessively and unconsciously as a result of increased industry, fast global population growth, urbanization, and better living conditions. So, the world has reached a point where it can no longer undo the effects of its reliance on natural resources (Saqib et al., 2022). In other words, the world can no longer renew itself. An ecological footprint measures ecological sustainability in a particular category of natural services. (Wackernagel and Rees, 1998) established this idea at the beginning of the 1990s. It specifies the sustainable productive areas required for natural resource production, such as agricultural, stock farming, fishing industry, and forest goods production, as well as CO2 absorption and infrastructure requirements. Learning about our ecological footprint can prevent environmental impact.
Environmental awareness and sensitivity should be fostered so people can live healthier and safer lives. Quality environmental education develops environmental knowledge and sensitivity in every segment of society (Katircioglu et al., 2020). Early education should include environmental understanding and awareness. For the sake of preserving the natural world, it is essential that people start learning how to behave in an environmentally responsible manner as early as preschool. Increases in sustainable development and renewable energy will take place as negative aspects of progress, such as the rapid depletion of non-renewable resources, the unquenchable aspirations of mankind, the destruction and deterioration of renewable resources, noise, and the degradation of aesthetics, become less severe. When it comes to educating students about the environment and the problems facing the environment, teachers play a crucial role. Students who are aware of environmental issues, ecology, sustainability, and ecological footprint are more likely to raise adults who are also aware of these topics. This is because students who are aware of these issues are more likely to educate future generations. The EKC hypothesis was used in the study that (Ulucak and Bilgili, 2018) conducted to investigate the relationship between human capital and the ecological footprint. Increasing the country’s score on the Human Capital Index will results in a less ecological footprint of all countries.
According to the findings of (Balsalobre-Lorente et al., 2018) anthropogenic activities have a negative impact on the ecosystem, leading to decreased productivity and damage to the aquatic environment. When this occurs, natural resources contribute to increased economic growth as well as improved environmental quality (Charfeddine, 2017; Hassan et al., 2019). Studies on the EKC hypothesis and its relevance to economic growth have been conducted in great detail over the years. According to the EKC theory, environmental quality strives to improve at a specific point in economic growth. There is a strong correlation between the quality of an economy’s ecological footprint and its economic growth (Ozturk and Acaravci, 2013; Shahbaz et al., 2015; Apergis, 2016; Aydin et al., 2019).
The term “resource curse” refers to the situation in which economies that have an abundance of a certain resource tend to experience slower economic growth than those that have a scarcity of that resource. In an effort to provide an explanation for this finding, a large number of studies have proposed a wide range of political, environmental, economic, and structural factors. Nonetheless, the results of these studies have been quite inconsistent (Robinson et al., 2006). One school of thought among economic thinkers holds that the quality of institutions determines how much of impact natural resources have on the economy (Mehlum et al., 2006; Sala-i-Martin and Subramanian, 2008), while another study showed that countries with high levels of human capital derived the maximum benefits from their natural resources (Gylfason, 2001). A third set of experts came to the conclusion that human capital and institutions are major contributors to an economy’s vulnerability to the “resources curse” (Sachs and Warner, 1995; Arezki and Ploeg, 2007). As a result, there is not a lot of consensuses regarding the effect that natural resources have on economic development. As a result of this difference, we decided to incorporate human capital into our analysis. Human capital’s influence on CO2 emissions can be investigated in order to assist economies in achieving their long-term economic growth objectives. According to (Zallé, 2019), the effective utilization of natural resources and the consumption of energy depends heavily on human capital. Human capital consists of a person’s health as well as their schooling, professional experience, capabilities, and training. Previous research has shown that human capital as measured by education can help improve the quality of the environment and reduce the amount of fossil fuels used. This study looks at how human capital as measured by education affects the environment.
Consumption of world resources has reached a stage where it exceeds the Earth’s capacity to produce them (Haberl et al., 2007). The rapid depletion of tropical forests, one of the world’s most important natural resources, is one of the most pressing economic issues of the last four decades. A significant increase in the amount of food consumed per person; an increase in the amount of carbon emissions that change the environment, which has a negative impact on the ecosystem; and an increase in the amount of pressure that is caused by humans on natural systems (Krausmann et al., 2009). All of these problems with limited resources show how important it is to look at MINT1 countries’ ecological footprint in terms of how they use natural resources. The EFP has increased 2.92 times globally and 1.2 times per capita from 1961 to 2019, according to (GFN, 2021). Figure 1 compares EFP (gha per person) and biocapacity (per capita) in MINT countries. This study focuses on MINT countries since they have great growth potential, advanced energy markets, young populations, job potential, and low ecological sensitivity compared to developed countries. The MINT countries’ geopolitical location may be a factor in this projection. Mexico’s proximity to the USA and its links with Latin America; Indonesia’s proximity to China and India; Nigeria’s ability to become Africa’s economic center; and Turkey’s presence on energy corridors and proximity to the EU demonstrate the importance of geopolitical position. All of the MINT nations have relatively young and expanding populations that are also highly engaged in the work force, which may help spur economic expansion (Asongu et al., 2018).
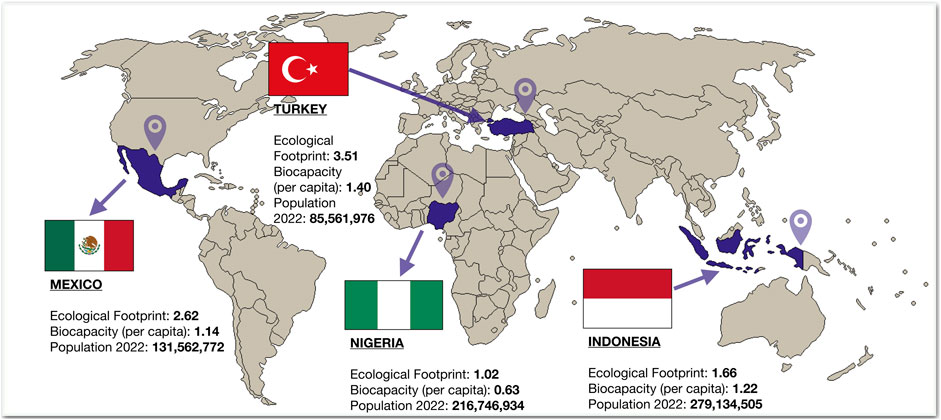
FIGURE 1. Ecological Footprint in MINT Countries Source: The authors.
In recent years, EFP has been interpreted as a measure of ecological degradation, but MINT countries have received little or no attention. Regarding the relationship between economic growth and ecological degradation, time-series analyses have been done for Turkey (Halicioglu, 2009; Ozturk and Acaravci, 2010), Indonesia (Shahbaz et al., 2013), and Nigeria (Akpan and Akpan, 2012). No study using economic growth, energy structure, trade openness, human capital, environmental regulation, and EFP has been done for the group of MINT countries, making this study unique and filling a gap. There are two ways this study contributes to the literature: Firstly, it adds empirical and, secondly, methodological value to the literature. We use annual frequency data from 1990 to 2020 for MINT countries in order to meet our research purpose. There are only a few studies to date that have used panel causality tests to examine the link between variables of interest for a group of countries like MINT. This is the first study that we know of that analyzes at economic growth, energy structure, trade openness, human capital, environmental regulation, and EFP in a group of MINT countries.
The study’s structure can be summarized as follows: following a review of relevant literature, empirical evaluations are conducted, followed by necessary testing. It includes the cointegration analysis, which shows long-term relationships between variables and the equations that describe them, and the last section gives the conclusion and policy implications.
Review literature
The section reviews the literature that has examined the impact of economic growth (GDP), trade openness (OPEN), energy structure (ES), environmental regulations (REG) and human capital (EDU) on ecological footprints (EFP).
Studies using diverse research methodologies and data collection methods have contributed to the EKC debate. (Gorus and Aslan, 2019) used Dynamic OLS to examine the relationship between macroeconomic variables and EFP, and the findings supported the EKC-hypothesis. (Pao and Chen, 2019) used panel OLS and VEC to quantify the G-20 EKC-hypothesis. (Sharif et al., 2019) also investigated 74 economies and found support for the EKC-hypothesis. (Álvarez-Herránz et al., 2017; Zhang Y. et al., 2019; Baležentis et al., 2019; Balsalobre-Lorente et al., 2019; Mert et al., 2019; Pao and Chen, 2019; Shahbaz, 2019; Assamoi et al., 2020; Dogan and Inglesi-Lotz, 2020; Muhammad et al., 2020) supported the same view for EKC by using carbon emission as a dependent variable. Using panel and time-series data, studies estimated the correlation between variables and supported EKC. (Aşıcı and Acar, 2018) examined the effect of selected determinants on EFP in 87 economies using data from 2004 to 2010. Robust results showed that EKC-hypothesis was unsupported. A case study by (Destek and Sinha, 2020) on OECD economies also supported this phenomenon, whereas earlier case studies validated the aspect of no EKC concept by using EFP as a proxy of environmental degradation (Masron and Subramaniam, 2018; Aydin et al., 2019).
Economic growth can be achieved through greater trade openness. According to (Işik et al., 2017), increased openness to international trade is linked to increased CO2 emissions in Greece and that the international tourism industry is to blame. While China exported more high-CO2 emission-embodied commodities to China than to the BRICS countries, the BRICS countries sold more low-CO2-emitted commodities to China than the BRICS countries. These countries’ increased engagement in international trade has been linked to an increase in the production of polluting These countries’ increased engagement in international trade has been linked to an increase in the production of polluting commodities (Zhang Z. et al., 2019). Environmental regulation is needed to protect the environment from international trade’s environmental consequences, as shown by the differing environmental outcomes of international trade.
(Aydin and Turan, 2020) found that trade openness increases South Africa’s ecological footprint but In China and India, the authors found evidence that trade openness reduced EFP. However, Brazil, Russia, and BRICS had no statistically significant impact. Increased international trade volumes increase the ecological footprint in high-income and upper-middle-income countries, but not in low-income and lower-middle-income countries, according to (Al-Mulali et al., 2015; Nathaniel S. and Khan S. A. R., 2020, Nathaniel S. and Khan, S. 2020) showed a favorable association between ASEAN trade openness and EFP. Country-specific studies showed that international trade damaged the environment by raising the Philippines’ ecological footprint. In other ASEAN countries, international trade didn’t affect ecological footprint. According to (Usman et al., 2021), higher trade openness improves the environment by lowering EFP in the top 15 CO2-generating countries. Bidirectional causality was also discovered. In another study on 27 pollution generating nations (Uddin et al., 2017) found that trade-openness did not explain changes in ecological footprint. These studies show that the impacts of international trade on the ecological footprint are equivocal, requiring further examination in the context of MINT countries.
Several studies use long-term cointegration techniques to examine the benefits of renewable energy on environmental mitigation at the level of groups of economies; for example, (Sulaiman et al., 2020; Sun et al., 2022a; Sun et al., 2022b) in 27 EU economies find that increasing biomass energy use in the production process can reduce EFP. (Bekun et al., 2019) find a long-term equilibrium relationship in the EU, suggesting that REC reduces EFP while GDP and natural resource income increase EFP. (Bilgili et al., 2016) analyzed 17 OECD nations using FMOLS and DOLS and concluded that REC reduces EFP, validating the EKC hypothesis. (Ben Jebli et al., 2016) analyzed 25 OECD nations from 1980 to 2010 using FMOLS, DOLS, and Granger causality tests and came to the conclusion that REC reduces EFP, proving the EKC theory. According to (Zoundi 2017), who investigated 25 African economies between 1980 and 2012, there is no indication that renewable energy reduces EFP in Africa. When it comes to the well-being of the environment and the economy, it is generally acknowledged that renewable energy sources are among the most sustainable (Saqib 2018; Yang et al., 2022). According to the findings of a number of studies, the use of energy sources that do not replenish themselves is one of the primary causes of the deterioration of the environment. According to (Sarkodie and Strezov 2019) as well as studies such as (Ozokcu and Ozdemir 2017; Ali et al., 2018), energy consumption significantly raises the overall pollution level in OECD countries between 1980 and 2010; in Nigeria, (Ali et al., 2018) discovered that energy use has a positive impact on the environment; on the other hand, renewable energy sources have been found to be beneficial to the environment. In conclusion, evidence supports the idea that the use of renewable sources of energy leads to significant improvements in environmental quality over the course of a lifetime. Previous research by (Saqib 2022c) discovered that using renewable energy has a significant impact on lowering an ecological footprint and the pollution in the air. (Saqib 2022b) investigated that the country’s power supply should be updated to include renewable energy technology in order to reduce the country’s reliance on fossil fuels and increase the country’s economic diversity.
Non-renewable energy consumption promotes economic growth but leads to pollution and environmental degradation (Saqib, 2018; 2022c). Various studies have analyzed the influence of nonrenewable energy on specific nations’ or regions’ ecosystems. (Adebayo et al., 2021) studied the relationship between non-renewable energy consumption and ecological footprint in Latin American economies from 1980 to 2017 and confirmed that a continual increase in non-renewable energy consumption adds to the increase in carbon emissions, leading to environmental deterioration. Using the PMG technique, (Ibrahim and Ajide, 2021) studied the G7 economies from 1990 to 2019 and found that non-renewable energy usage increases the ecological footprint. (Mahalik et al., 2021) studied the relationship between ecological footprint and non-renewable energy usage in BRICS economies from 1990 to 2015 and found a favorable impact. (Adedoyin et al., 2021) analyzed a dataset from 1996 to 2014 using the GMM technique for 32 nations and found a positive correlation between ecological footprint and non-renewable energy consumption. (Fatima et al., 2021) discovered a favorable relationship between ecological footprint and non-renewable energy consumption in eight nations. (Xie et al., 2019) used a dataset from 1965 to 2016 to find a positive relationship between ecological footprint and non-renewable energy consumption in China. They found that a growth in non-renewable energy consumption increases China’s ecological footprint. (Chen et al., 2019) confirmed a similar result in China using ARDL between 1980 and 2014. (Dogan and Inglesi-Lotz, 2020) found a favorable relationship between ecological footprint and non-renewable energy consumption in 10 African nations using the GMM. According to the findings of (Zhang et al., 2021) there was a substantial association between ecological footprint and consumption of non-renewable energy in Pakistan between the years 1970 and 2012.
Education as a proxy of human capital improves the productivity of people by enhancing production processes and raises the readiness of economies to embrace energy-efficient and pollution-free technology in the industrial, domestic, and transportation industries. Human capital and ecological footprint research can assist economies in achieving their long-term economic development objectives (Lan et al., 2012). According to (Zallé, 2019), human capital is critical to the efficient use of natural resources and energy consumption. This study examines how human capital has been shown to improve environmental quality and reduce fossil fuel use. Hence, this study examines the function of education as a proxy of human capital in the ecological footprint. As part of their EKC hypothesis, (Ulucak and Bilgili, 2018) evaluated the relationship between human capital and ecological footprint in countries classified as low-, middle-, and high-income from 1961 to 2013 while taking into account heterogeneity and the cross-sectional issue. According to their findings, the human capital index reduces the ecological footprint of all countries. (Hassan et al., 2019) used the ARDL method to study the relationship between natural resources, human capital, economic growth, and the ecological footprint in Pakistan from 1971 to 2014. They found that the ecological footprint grew as GDP and natural resources grew. As a policymaker and facilitator of potential leaders, the education sector plays a significant role in tackling this dilemma (Lozano, 2006; Adams, 2013) argues that education is key to a low-carbon economy and society. Universities have the ability to handle issues of sustainability and climate change by working toward the Sustainable Development Goals. This can be accomplished through the universities’ activities and disclosures related to these goals (Paletta and Bonoli, 2019; Rebelatto et al., 2019; Brandli et al., 2020). This study doesn’t examine how institutions could respond to sustainability calls.
Existing research have found that REG improves environmental quality. (Ulucak et al., 2020) claimed that REG reduce CO2 emissions in BRICS countries. (Ghazouani et al., 2020) emphasized the necessity of carbon pricing to reduce CO2 emissions. (Hashmi and Alam, 2019; Ouyang et al., 2019) found that REG improve the environment in OECD countries. (Cheng et al., 2017; Chen et al., 2018; Zhang Z. et al., 2019; Pei et al., 2019; Irfan et al., 2022; Sun and Razzaq 2022) found similar results in China. According to (Sarwar et al., 2019) putting environmental policy reforms, both economic and non-economic, into action can help alleviate China’s environmental problems. (Doytch, 2020) found in a study of 117 low-, middle-, and high-income nations that REG tends to worsen environmental quality in less-developed economies while enhancing it in developed ones. The author argues that strict REG in wealthy economies pushes them to move filthy commodity production to developing countries with weaker REG. Therefore, developed countries send polluting FDI to countries without strict environmental standards. Enforcing REG has a direct influence on environmental quality and an indirect impact on other major macroeconomic qualities that are closely linked to environmental quality. The enhancement of macroeconomic aggregates, such as economic growth, energy consumption, human capital, and trade-openness, can be one way that REG helps to make the environment a decent place to live. When it comes to ensuring the development of the environment, at first, REG is not very effective in ensuring the development of the environment, but over the long run, it improves the quality of the environment (Wenbo and Yan, 2018) observed a U-shaped link between REG and EFP in Chinese provinces. Long-term ER enforcement reduces China’s usage of fossil fuels, reducing CO2 emissions. Several studies have evaluated REG impact on CO2 emissions, but fewer have evaluated its global impact on EFP. (Aşıcı and Acar, 2018) found the REG–EFP link ineffective in 84 worldwide economies. Thus, their findings corroborated (Hao et al., 2018) for China, who also noted REG ineffectiveness un reducing environmental degradation. These findings show that the effects of REG on EFP need further study.
The literature examined reveals a strong connection between economic growth, trade openness, energy structure, environmental regulations and human capital and ecological footprints. As a result, the model does not adequately account for the effects of education and environmental regulation, particularly in the recently formed emerging economic block (MINT). Since there is a lack of research on energy–growth relationships between MINT countries, there is a need to bridge these gaps in order to contribute to the literature on these countries.
Data and econometrics methodology
Data sources
The purpose of this study was to analyze the dynamic link that exists between GDP, OPEN, ENS, EDU, REG, and EFP in MINT countries from the years 1990–2020. The decision to include data up until 2020 is dependent on the availability of data for certain variables that are incorporated into the regression analysis being used in this study. Table 1 includes a description of the various data sources.
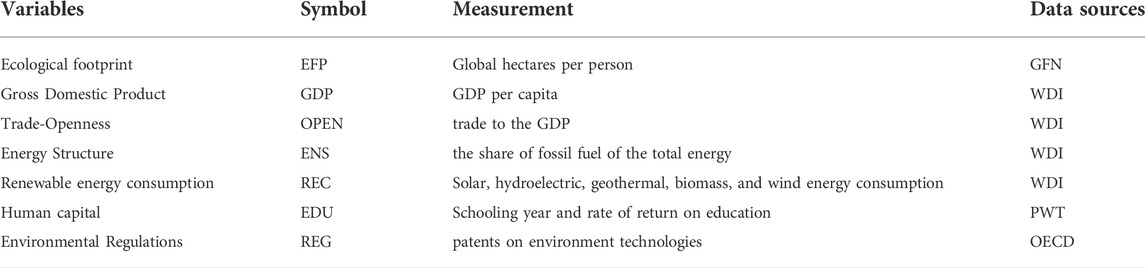
TABLE 1. Data variables and sources.
The econometric model
Explanatory variables and a set of control variables were added to the overall model for MINT nations. One of the explanatory variables included in the model was trade openness. As a result of the fact that the energy structure (ES) was found to be a significant predictor of the ecological footprint in a number of different studies, it was decided to include it as an explanatory variable in the model that is being presented here. Various control factors, including environmental regulation and human capital, were used to offset the problem of omitted variable bias. Equation 1 depict the econometric model and Figure 2 represents an econometric modeling strategy.
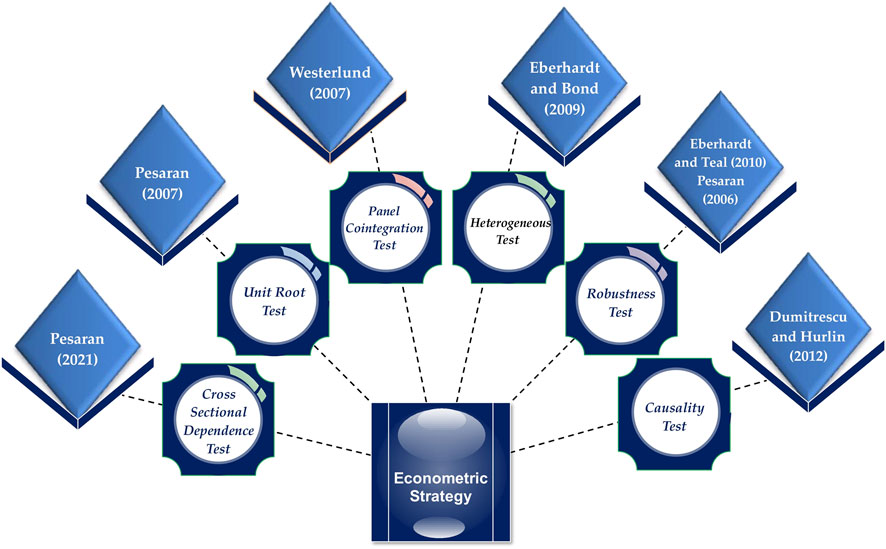
FIGURE 2. The Econometric Strategy Source: The authors.
Model: Ecological Footprints = f (Gross Domestic Product, Gross Domestic Product Squared, Trade-Openness, Energy Structure, Renewable Energy Consumption, Human Capital, Environmental Regulations)
Cross-sectional dependence test
In the first case of panel studies, the CD test must be examined. Otherwise, you’ll get erroneous outcomes. Cross-sectional dependency (CD) spanning social and economic systems and the usual unexplained shocks is a problem for standard panel estimate methods because of growing relationships. Analyze the heterogeneous panel data model as shown in Eq. 2.
where indexes refer to the units of the cross-sectional and t to the time series observations.
where
In the fixed n case and as T → ∞, the (Breusch and Pagan, 1980) LM test can be utilized to examine the cross-sectional dependence in heterogeneous panels. In this case it is given by Eq. 4:
This is asymptotically distributed under the null hypothesis as a
Bias-corrected scaled LM test statistic and CD test given as in Eqs 6, 7 (Pesaran, 2021).
Panel unit root test
In terms of cross-sectionally augmented Dickey Fuller (CADF), as described in Eq. 8, and cross sectionally augmented unit root test (CIPS), as mentioned in Eq. 12, this study utilizes (Pesaran, 2007).
where
and
Where,
Panel cointegration test
Conduct a test of co-integration on the variables in order to evaluate elasticity over the long term. In this investigation, we investigate for correlations by employing a method called panel co-integration by (Westerlund, 2007). It manages slope heterogeneity and cross-sectional dependence in the model. The error correction base cointegration test is in Eq. 13.
where cross-sections are indicated by N (i = 1………, N) and T (t = 1, ……, T) denotes number of observations. (Westerlund, 2007) presented in two group statistics (Eqs 14, 15) and two panel statistics (Eqs 16, 17). As a result of the CSD and data heterogeneity, the study conducted 400 bootstrap replications.
AMG heterogeneous and robustness test
The AMG estimator (Eberhardt and Bond, 2009) is also employed since it is resistant to CD and parameter heterogeneity. AMG is essential since it may be used with models with varied slopes. Despite CSD, non-stationarity, and endogeneity, the test is accurate (Eberhardt and Teal, 2010; Eberhardt, 2012) developed the AMG estimator as an alternative to (Pesaran, 2006; Eberhardt, 2012) CCEMG estimator. In the CCEMG estimator, the unobservable common factor
where
Because of its unbiased and efficient performance in Monte Carlo simulations, this study uses the AMG approach to analyze long-term parameters. This estimator also serves as a robustness test. Equation 20 illustrates the CCEMG estimation process.
Panel causality test
(Dumitrescu and Hurlin, 2012) proposed the test for the non-causality hypothesis by altering the non-causality test originally developed by (Granger, 1969) as follows in Eq. 21:
Where
Using Wald statistics is a reliable method for evaluating both the null and alternative hypotheses in relation to a particular subject. The findings of the panel test are represented by Eq. 22:
The z-test statistic given in Eq. 23 was advocated by (Dumitrescu and Hurlin, 2012) for larger time spans instead of cross-sections:
Empirical results discussion
The findings indicate that GDP2 has a mean of 17.0113, a minimum of 10.7265, and a maximum of 19.9851 accordingly. The tabular presentation of descriptive statistics for each variable may be found in Table 2.
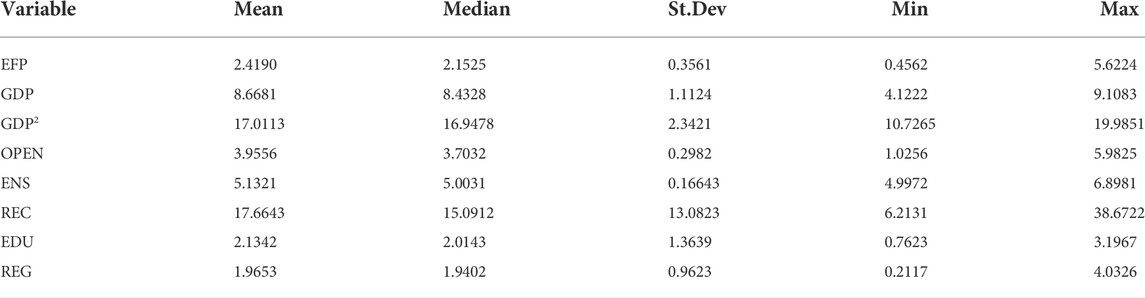
TABLE 2. Descriptive statistics.
Cross-sectional dependence test results
An essential aspect of developing cross-sectional dependency is the CD test (Pesaran, 2021). Table 3 shows that incredibly low p-values reject H (0), demonstrating that cross-sectional dependence occurs for all aforementioned variables. All potential problems must be evaluated before using unit root, cointegration, or long-run estimation. Since cross-sectional data wasn’t homogeneous, we created a regression equation. Ignoring the long-term panel dataset leads to improper assessment. We employed the (Pesaran, 2021) CD test for cross-sectional dependency as shown in Table 3. All variables are significant at the first difference, including EFP, which is stationary at I (1) under the heterogeneity modification framework.
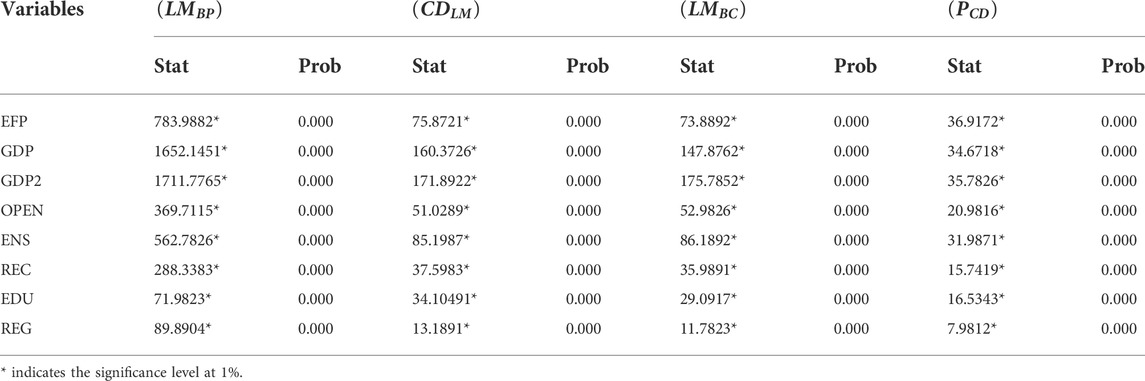
TABLE 3. Cross-sectional dependence tests results.
Unit root test results
The CADF and CIPS unit root tests (Pesaran, 2007, 2021) are appropriate for evaluating the stationarity of the variables after validating the presence of CD as shown in Table 4.
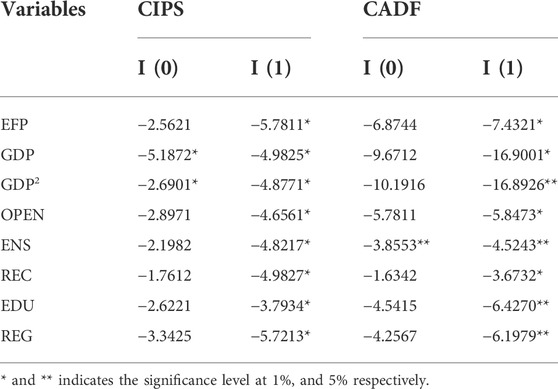
TABLE 4. Unit root Test Results.
Cointegration tests results
After the cross-sectional dependence test and order of integration, the robust cointegration test (Westerlund, 2007) is employed to find long-run association among variables. Table 5 indicates the long-term stability of the variables’ association and invalidates the null hypothesis. Long-term results can affect the dependent parameter by 1%–5%. (Westerlund, 2007) group and panel data support the long-term relationship between the variables.
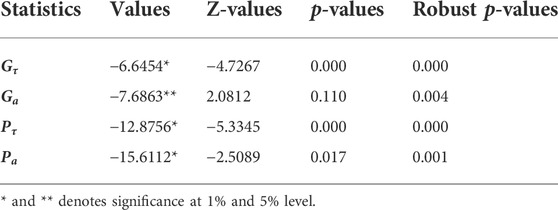
TABLE 5. Cointegration test results.
AMG heterogeneous and robustness test results
Using the AMG estimator, the country-specific long-run elasticity estimates are provided in Table 6. Consistent results are shown in Table 6, which shows the effect of economic expansion on EFP. In other words, all MINT countries are willing to give up environmental quality in exchange for economic progress. EKC hypothesis is confirmed for all MINT countries by the country-specific findings. The elasticity estimations showed that increasing levels of energy use uniformly exacerbated the EFP in all of the MINT nations, in terms of consumption. This suggests that the choice of energy source used is detrimental to the environment. This conclusion is justified because these countries rely heavily on fossil fuels. Furthermore, the environmental implications of international trade vary widely throughout the MINT countries. According to the elasticity estimations, trade openness in MINT nations raises the EFP. EDU has a long-term negative impact on the environment. EDU helps improve environmental quality and the efficient use of natural resources in MINT countries. This suggests that the MINT countries have engaged in unsustainable and environmentally destructive trading activity. However, enforcing REG in Mexico and Turkey is found to be more effective in reducing EFP than in Indonesia and Nigeria. This conclusion could be explained by the fact that REG is enforced at higher levels in Mexico and Turkey than in the other two MINT nations. So, the country-specific results show how important it is for MIINT countries to pass stronger REG in order to improve the environmental quality.

TABLE 6. AMG heterogeneous economy-specific test results.
Robustness test results
We checked the robustness by heterogeneous estimators (Pesaran, 2006) CCMG and the (Eberhardt and Teal, 2010) AMG estimator. Table 7 shows the AMG and CCEMG robustness test results. Both techniques verified the EKC hypothesis for EFP in MINT countries. Positive and negative indicators of GDP and GDP2 elasticity metrics confirm this. Thus, between 1990 and 2020, economic development and EF have an inverted-U-shaped relationship in MINT countries. Considering this data and the worsening patterns in MINT economic growth and EFP, it can be stated that MINT nations are still in the growth phase where they trade off economic progress with worst environmental quality activities. This means these nations haven't reached the economic growth threshold that would end the trade-off. MINT countries must accelerate economic growth to reach the growth threshold. Aligning economic growth policies with environmental sustainability is crucial. This finding doesn’t come as a surprise because MINT countries are developing countries that focus on economic growth early on and tend to neglect environmental degradation. Given how important it is to restore the health of the environment around the world, MINT countries must stop ignoring the damage to the environment.
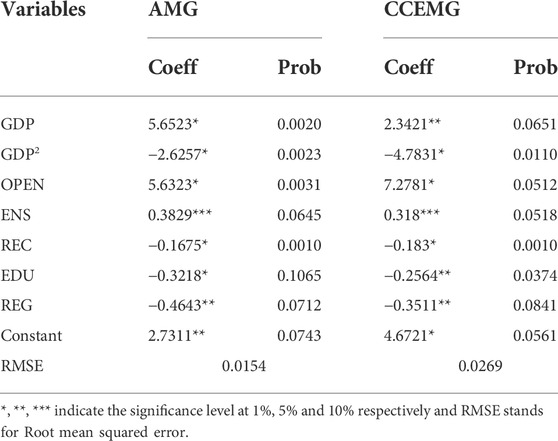
TABLE 7. Robustness test results.
According to various elasticity estimations, energy consumption in the MINT countries has a negative impact on the environment. Across all of the regression estimators employed in this study, the same result was obtained. These findings were supported by ENS positive sign and statistically significant elasticity parameter values. So, the MINT countries’ reliance on fossil-fuels explains the positive energy consumption–EFP connection observed in this study. In order to improve the environment, MINT countries should increase their electricity output from renewable sources. This switch from non-renewable to renewable energy could reduce the damage that energy use in MINT countries does to the environment (Saqib, 2022b; Yang et al., 2022). Similar to energy consumption, elasticity estimates revealed the negative effects of trade-openness on the MINT counties’ environment. The MINT countries have not participated in sustainable trade, but rather in commercial practices that have exaggerated EFP estimates. This is because these countries are markets for developed nations. These MINT economies are likely to export high CO2 emitting commodities to developed countries and import lower-emitting commodities from developed nations. The EFP will grow along with MINT nations’ involvement in international trade. The MINT nations may also import dirty technology, which could have worsened their EFP. Long-term, EDU has a negative and significant association with ecological footprint. EDU helps use natural resources efficiently and improves environmental quality.
The statistically insignificant elasticity characteristics associated with REG imply that imposing REG is not effective in decreasing EFP in MINT countries. According to this finding, existing REG in these nations are either inefficient at promoting environmental wellbeing or are not being implemented properly. Therefore, environmental protection measures must be credible. The ineffectiveness of REG to lower EFP is also due to weaker REG in MINT nations than in more advanced countries. Improving the environment requires stricter REGs in MINT countries. According to this finding, stringent REG could ensure environmental sustainability by minimizing EFP in MINT countries. Improving the environment requires increasing the severity of REG in MINT countries. Ineffective REG implementation does not guarantee greater environmental quality, according to (Hashmi and Alam, 2019) for the OECD and (Hao et al., 2018; Cheng et al., 2019) for the BRICS emphasized the positive environmental consequences of REG.
Panel causality test results
Finally, the D-H non-cause test confirmed the causal relationship between the variables. ' D-H causality test results are presented in Table 8. Economic growth boosts EFP in MINT nations, according to the data. This confirms their estimated elasticity. REG drive EFP; EFP affects international trade and energy use. The MINT nations must gradually reduce their reliance on nonrenewable resources and increase their use of renewable energy. Panel causality relationship also shown in Figure 3.
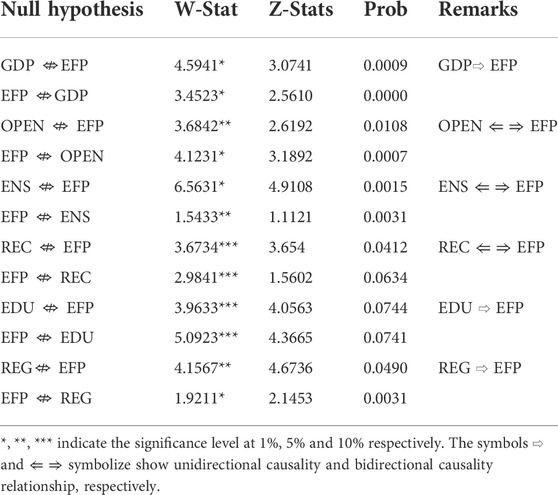
TABLE 8. Panel causality test results.
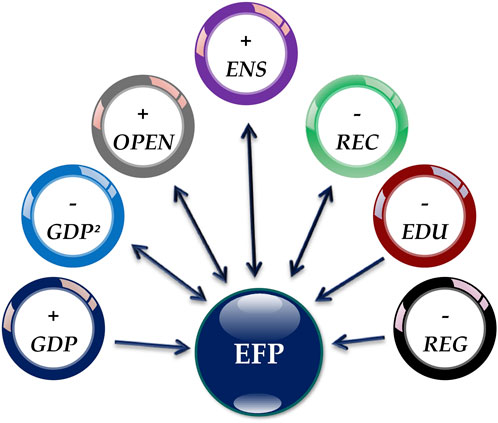
FIGURE 3. Causality Relationship Source: The authors.
Conclusion and policy implications
This study examined the effects of REG enforcement on environmental quality in MINT countries from 1990 to 2020, adjusted for economic growth, energy consumption, and trade openness. EFP measured environmental degradation in these countries. Advanced econometric tools that can handle CD difficulties in the data were used to determine the variables’ associations. Long-run elasticity estimations confirmed the EKC hypothesis for the MINT panel and revealed that poor environmental quality affected energy consumption and trade-openness. The results showed that the existing REG is unsuccessful at improving the environment in MINT nations. Country-by-country studies confirmed that energy use harmed the environment, whereas economic expansion, trade openness, and REG had diverse environmental implications. MINT nations verified the EKC hypothesis.
The ecological footprint and economic growth are linked. Economic expansion in MINT countries boosts the usage of fossil fuels, increasing their ecological footprint. High-emitter countries like the MINT should reduce their fossil fuel use. New technology can minimize emissions in the energy sector (Saqib, 2022a). Environmental policy helps reduce carbon emissions and control climate change. To fully enforce environmental regulations, MINT countries must implement the 5-year plan and strengthen their environmental tax systems. Sustainable energy consumption can be introduced by spending more on carbon emissions R&D to develop effective, environmentally friendly technology that reduces energy consumption’s carbon emissions. The government must also implement energy intensity and structural policies. Encouraging public participation and awareness at the school and university levels; international cooperation; the business community; non-governmental organizations; and active government participation all contribute to lowering carbon emissions intensity and promoting a sustainable environment.
It appears that there is a negative relationship between renewable energy and ecological footprint, as suggested by the long-run coefficient of renewable energy consumption for the situations of MINT countries. According to this research, one solution to the problem of reducing ecological footprint could be for these countries to increase the proportion of their energy consumption that comes from renewable sources. In order to achieve the efficient usage of renewable energy and to promote the adoption of clean technology in the production phase of renewable energy, the decision-makers of MINT countries should devote more resources in research and development (R&D) activities and invest more in clean technology. The effects of exports and imports (OPEN) on ecological footprint is an additional outstanding finding that was achieved as a result of the implementation of policy. In MINT countries, exports help improve environmental quality, whereas imports lead to an increase in the rate of environmental degradation. The decision-makers in these four countries ought to be aware of the good effects of imports and should take safeguards against the adverse effects of imports on the quality of the environment.
Data availability statement
The raw data supporting the conclusions of this article will be made available by the authors, without undue reservation.
Author contributions
NS: Supervision, Writing- Original draft preparation, Methodology, Software. ID: Data curation, Editing, Literature review. IS: Writing- Reviewing and Editing.
Acknowledgments
The authors would like to acknowledge the support of Prince Sultan University for paying the Article Processing Charges (APC) of this publication.
Conflict of interest
The authors declare that the research was conducted in the absence of any commercial or financial relationships that could be construed as a potential conflict of interest.
Publisher’s note
All claims expressed in this article are solely those of the authors and do not necessarily represent those of their affiliated organizations, or those of the publisher, the editors and the reviewers. Any product that may be evaluated in this article, or claim that may be made by its manufacturer, is not guaranteed or endorsed by the publisher.
Footnotes
1Mexico, Indonesia, Nigeria, and Turkey.
References
Adams, C. A. (2013). Sustainability reporting and performance management in universities: Challenges and benefits. Sustain. Account. Manag. Policy J. 4, 384–392. doi:10.1108/SAMPJ-12-2012-0044
Adebayo, T. S., Ramzan, M., Iqbal, H. A., Awosusi, A. A., and Akinsola, G. D. (2021). The environmental sustainability effects of financial development and urbanization in Latin American countries. Environ. Sci. Pollut. Res. 28, 57983–57996. doi:10.1007/S11356-021-14580-4
Adedoyin, F. F., Alola, A. A., and Bekun, F. V. (2021). The alternative energy utilization and common regional trade outlook in EU-27: Evidence from common correlated effects. Renew. Sustain. Energy Rev. 145, 111092. doi:10.1016/J.RSER.2021.111092
Akpan, G. E., and Akpan, U. F. (2012). Electricity consumption, carbon emissions and economic growth in Nigeria. Int. J. Energy Econ. Policy 2 (4), 292–306.
Al-Mulali, U., Weng-Wai, C., Sheau-Ting, L., and Mohammed, A. H. (2015). Investigating the environmental Kuznets curve (EKC) hypothesis by utilizing the ecological footprint as an indicator of environmental degradation. Ecol. Indic. 48, 315–323. doi:10.1016/J.ECOLIND.2014.08.029
Ali, H. S., Law, S. H., Lin, W. L., Yusop, Z., Chin, L., and Bare, U. A. A. (2018). Financial development and carbon dioxide emissions in Nigeria: Evidence from the ARDL bounds approach. GeoJournal 84 (3 84), 641–655. doi:10.1007/S10708-018-9880-5
Álvarez-Herránz, A., Balsalobre, D., Cantos, J. M., and Shahbaz, M. (2017). Energy innovations-GHG emissions nexus: Fresh empirical evidence from OECD countries. Energy Policy 101, 90–100. doi:10.1016/J.ENPOL.2016.11.030
Apergis, N. (2016). Environmental Kuznets curves: New evidence on both panel and country-level CO2 emissions. Energy Econ. 54, 263–271. doi:10.1016/J.ENECO.2015.12.007
Arezki, R., and Ploeg, F. (2007). Can the natural resource curse Be turned into a blessing? The role of trade policies and institutions. IMF Work. Pap. 07, 1. doi:10.5089/9781451866193.001
Aşıcı, A. A., and Acar, S. (2018). How does environmental regulation affect production location of non-carbon ecological footprint? J. Clean. Prod. 178, 927–936. doi:10.1016/J.JCLEPRO.2018.01.030
Asongu, S., Akpan, U. S., and Isihak, S. R. (2018). Determinants of foreign direct investment in fast-growing economies: Evidence from the BRICS and MINT countries. Financ. Innov. 4, 26. doi:10.1186/S40854-018-0114-0
Assamoi, G. R., Wang, S., Liu, Y., Gnangoin, T. B. Y., Kassi, D. F., and Edjoukou, A. J. R. (2020). Dynamics between participation in global value chains and carbon dioxide emissions: Empirical evidence for selected asian countries. Environ. Sci. Pollut. Res. 27, 16496–16506. doi:10.1007/S11356-020-08166-9
Aydin, C., Esen, Ö., and Aydin, R. (2019). Is the ecological footprint related to the Kuznets curve a real process or rationalizing the ecological consequences of the affluence? Evidence from PSTR approach. Ecol. Indic. 98, 543–555. doi:10.1016/J.ECOLIND.2018.11.034
Aydin, M., and Turan, Y. E. (2020). The influence of financial openness, trade openness, and energy intensity on ecological footprint: Revisiting the environmental Kuznets curve hypothesis for BRICS countries. Environ. Sci. Pollut. Res. 27, 43233–43245. doi:10.1007/S11356-020-10238-9
Baležentis, T., Streimikiene, D., Zhang, T., and Liobikiene, G. (2019). The role of bioenergy in greenhouse gas emission reduction in EU countries: An Environmental Kuznets Curve modelling. Resour. Conservation Recycl. 142, 225–231. doi:10.1016/J.RESCONREC.2018.12.019
Balsalobre-Lorente, D., Shahbaz, M., Chiappetta Jabbour, C. J., and Driha, O. M. (2019). The role of energy innovation and corruption in carbon emissions: Evidence based on the EKC hypothesis. Green Energy Technol., 271–304. doi:10.1007/978-3-030-06001-5_11
Balsalobre-Lorente, D., Shahbaz, M., Roubaud, D., and Farhani, S. (2018). How economic growth, renewable electricity and natural resources contribute to CO2 emissions? Energy Policy 113, 356–367. doi:10.1016/J.ENPOL.2017.10.050
Bekun, F. V., Alola, A. A., and Sarkodie, S. A. (2019). Toward a sustainable environment: Nexus between CO2 emissions, resource rent, renewable and nonrenewable energy in 16-EU countries. Sci. Total Environ. 657, 1023–1029. doi:10.1016/j.scitotenv.2018.12.104
Ben Jebli, M., ben Youssef, S., and Ozturk, I. (2016). Testing environmental Kuznets curve hypothesis: The role of renewable and non-renewable energy consumption and trade in OECD countries. Ecol. Indic. 60, 824–831. doi:10.1016/j.ecolind.2015.08.031
Bilgili, F., Koçak, E., and Bulut, Ü. (2016). The dynamic impact of renewable energy consumption on CO 2 emissions: A revisited environmental Kuznets curve approach. Renew. Sustain. Energy Rev. 54, 838–845. doi:10.1016/j.rser.2015.10.080
Brandli, L. L., Salvia, A. L., da Rocha, V. T., Mazutti, J., and Reginatto, G. (2020). The role of green areas in university campuses: Contribution to SDG 4 and SDG 15. World Sustain. Ser., 47–68. doi:10.1007/978-3-030-15604-6_4
Breusch, T. S., and Pagan, A. R. (1980). The Lagrange multiplier test and its applications to model specification in econometrics. Rev. Econ. Stud. 47, 239. doi:10.2307/2297111
Charfeddine, L. (2017). The impact of energy consumption and economic development on ecological footprint and CO2 emissions: Evidence from a markov switching equilibrium correction model. Energy Econ. 65, 355–374. doi:10.1016/J.ENECO.2017.05.009
Chen, H., Hao, Y., Li, J., and Song, X. (2018). The impact of environmental regulation, shadow economy, and corruption on environmental quality: Theory and empirical evidence from China. J. Clean. Prod. 195, 200–214. doi:10.1016/J.JCLEPRO.2018.05.206
Chen, Y., Zhao, J., Lai, Z., Wang, Z., and Xia, H. (2019). Exploring the effects of economic growth, and renewable and non-renewable energy consumption on China’s CO2 emissions: Evidence from a regional panel analysis. Renew. Energy 140, 341–353. doi:10.1016/J.RENENE.2019.03.058
Cheng, C., Ren, X., Wang, Z., and Yan, C. (2019). Heterogeneous impacts of renewable energy and environmental patents on CO2 emission - evidence from the BRIICS. Sci. Total Environ. 668, 1328–1338. doi:10.1016/J.SCITOTENV.2019.02.063
Cheng, Z., Li, L., and Liu, J. (2017). The emissions reduction effect and technical progress effect of environmental regulation policy tools. J. Clean. Prod. 149, 191–205. doi:10.1016/J.JCLEPRO.2017.02.105
Chudik, A., Pesaran, M. H., and Tosetti, E. (2011). Weak and strong cross-section dependence and estimation of large panels. Econom. J. 14, C45–C90. doi:10.1111/J.1368-423X.2010.00330.X
Destek, M. A., and Sinha, A. (2020). Renewable, non-renewable energy consumption, economic growth, trade openness and ecological footprint: Evidence from organisation for economic Co-operation and development countries. J. Clean. Prod. 242, 118537. doi:10.1016/J.JCLEPRO.2019.118537
Dogan, E., and Inglesi-Lotz, R. (2020). The impact of economic structure to the environmental Kuznets curve (EKC) hypothesis: Evidence from European countries. Environ. Sci. Pollut. Res. 27, 12717–12724. doi:10.1007/S11356-020-07878-2
Doytch, N. (2020). The impact of foreign direct investment on the ecological footprints of nations. Environ. Sustain. Indic. 8, 100085. doi:10.1016/J.INDIC.2020.100085
Dumitrescu, E. I., and Hurlin, C. (2012). Testing for Granger non-causality in heterogeneous panels. Econ. Model. 29, 1450–1460. doi:10.1016/J.ECONMOD.2012.02.014
Eberhardt, M., and Bond, S. (2009). Munich personal RePEc archive cross-section dependence in nonstationary panel models: A novel estimator cross-section dependence in nonstationary panel models: A novel estimator *.
Eberhardt, M. (2012). Estimating panel time-series models with heterogeneous slopes. Stata J. 12, 61–71. doi:10.1177/1536867X1201200105
Eberhardt, M., and Teal, F. (2010). Ghana and côte d’Ivoire: Changing places. International Development Policy| Revue internationale de politique de développement 33–49. doi:10.4000/poldev.136
Fatima, T., Shahzad, U., and Cui, L. (2021). Renewable and nonrenewable energy consumption, trade and CO2 emissions in high emitter countries: Does the income level matter? J. Environ. Plan. Manag. 64, 1227–1251. doi:10.1080/09640568.2020.1816532
Gamage, P., and Sciulli, N. (2017). Sustainability reporting by Australian universities. Aust. J. Public Adm. 76, 187–203. doi:10.1111/1467-8500.12215
GFN (2021). Global footprint network. http://data.footprintnetwork.org/ (Accessed July 9, 2022).
Ghazouani, A., Xia, W., Jebli, M. B., and Shahzad, U. (2020). Exploring the role of carbon taxation policies on co2 emissions: Contextual evidence from tax implementation and non-implementation European countries. Sustain. Switz. 12, 8680–8716. doi:10.3390/SU12208680
Gorus, M. S., and Aslan, M. (2019). Impacts of economic indicators on environmental degradation: Evidence from MENA countries. Renew. Sustain. Energy Rev. 103, 259–268. doi:10.1016/J.RSER.2018.12.042
Granger, C. W. J. (1969). Investigating causal relations by econometric models and cross-spectral methods. Econometrica 37, 424. doi:10.2307/1912791
Gylfason, T. (2001). Nature, power, and growth. Scott. J. Polit. Econ. 48, 558–588. doi:10.1111/1467-9485.00215
Hao, Y., Deng, Y., Lu, Z. N., and Chen, H. (2018). Is environmental regulation effective in China? Evidence from city-level panel data. J. Clean. Prod. 188, 966–976. doi:10.1016/J.JCLEPRO.2018.04.003
Haberl, H., Erb, K. H., Krausmann, F., Gaube, V., Bondeau, A., Plutzar, C., et al. (2007). Quantifying and mapping the human appropriation of net primary production in earth’s terrestrial ecosystems. Proc. Natl. Acad. Sci. U. S. A. 104, 12942–12947. doi:10.1073/PNAS.0704243104
Halicioglu, F. (2009). An econometric study of CO2 emissions, energy consumption, income and foreign trade in Turkey. Energy Policy 37, 1156–1164. doi:10.1016/J.ENPOL.2008.11.012
Hashmi, R., and Alam, K. (2019). Dynamic relationship among environmental regulation, innovation, CO2 emissions, population, and economic growth in OECD countries: A panel investigation. J. Clean. Prod. 231, 1100–1109. doi:10.1016/J.JCLEPRO.2019.05.325
Hassan, S. T., Xia, E., Khan, N. H., and Shah, S. M. A. (2019). Economic growth, natural resources, and ecological footprints: Evidence from Pakistan. Environ. Sci. Pollut. Res. 26, 2929–2938. doi:10.1007/S11356-018-3803-3
Ibrahim, R. L., and Ajide, K. B. (2021). Nonrenewable and renewable energy consumption, trade openness, and environmental quality in G-7 countries: The conditional role of technological progress. Environ. Sci. Pollut. Res. 28, 45212–45229. doi:10.1007/S11356-021-13926-2
Irfan, M., Razzaq, A., Sharif, A., and Yang, X. (2022). Influence mechanism between green finance and green innovation: Exploring regional policy intervention effects in China. Technol. Forecast. Soc. Change 182, 121882. doi:10.1016/j.techfore.2022.121882
Işik, C., Kasımatı, E., and Ongan, S. (2017). Analyzing the causalities between economic growth, financial development, international trade, tourism expenditure and/on the CO2 emissions in Greece. Energy Sources, Part B Econ. Plan. Policy 12, 665–673. doi:10.1080/15567249.2016.1263251
Kapetanios, G., Pesaran, M. H., and Yamagata, T. (2011). Panels with non-stationary multifactor error structures. J. Econ. 160, 326–348. doi:10.1016/J.JECONOM.2010.10.001
Katircioglu, S., Katircioĝlu, S., and Saqib, N. (2020). Does higher education system moderate energy consumption and climate change nexus? Evidence from a small island. Air Qual. Atmos. Health 2020, 153–160. doi:10.1007/S11869-019-00778-6
Krausmann, F., Gingrich, S., Eisenmenger, N., Erb, K. H., Haberl, H., and Fischer-Kowalski, M. (2009). Growth in global materials use, GDP and population during the 20th century. Ecol. Econ. 68, 2696–2705. doi:10.1016/J.ECOLECON.2009.05.007
Lan, J., Kakinaka, M., and Huang, X. (2012). Foreign direct investment, human capital and environmental pollution in China. Environ. Resour. Econ. (Dordr). 51, 255–275. doi:10.1007/S10640-011-9498-2
Lozano, R. (2006). Incorporation and institutionalization of SD into universities: Breaking through barriers to change. J. Clean. Prod. 14, 787–796. doi:10.1016/J.JCLEPRO.2005.12.010
Mahalik, M. K., Mallick, H., and Padhan, H. (2021). Do educational levels influence the environmental quality? The role of renewable and non-renewable energy demand in selected BRICS countries with a new policy perspective. Renew. Energy 164, 419–432. doi:10.1016/J.RENENE.2020.09.090
Masron, T. A., and Subramaniam, Y. (2018). The environmental Kuznets curve in the presence of corruption in developing countries. Environ. Sci. Pollut. Res. 25, 12491–12506. doi:10.1007/S11356-018-1473-9
Mehlum, H., Moene, K., and Torvik, R. (2006). Cursed by resources or institutions? World Econ. 29, 1117–1131. doi:10.1111/J.1467-9701.2006.00808.X
Mert, M., Bölük, G., and Çağlar, A. E. (2019). Interrelationships among foreign direct investments, renewable energy, and CO2 emissions for different European country groups: A panel ARDL approach. Environ. Sci. Pollut. Res. 26, 21495–21510. doi:10.1007/S11356-019-05415-4
Muhammad, S., Long, X., Salman, M., and Dauda, L. (2020). Effect of urbanization and international trade on CO2 emissions across 65 belt and road initiative countries. Energy 196, 117102. doi:10.1016/J.ENERGY.2020.117102
Nathaniel, S., and Khan, S. A. R. (2020b). The nexus between urbanization, renewable energy, trade, and ecological footprint in ASEAN countries. J. Clean. Prod. 272, 122709. doi:10.1016/J.JCLEPRO.2020.122709
Nathaniel, S., and Khan, S. (2020a). Public health financing, environmental quality, and the quality of life in Nigeria. J. Public Aff. 20. doi:10.1002/PA.2103
Ouyang, X., Shao, Q., Zhu, X., He, Q., Xiang, C., and Wei, G. (2019). Environmental regulation, economic growth and air pollution: Panel threshold analysis for OECD countries. Sci. Total Environ. 657, 234–241. doi:10.1016/J.SCITOTENV.2018.12.056
Özokcu, S., and Özdemir, Ö. (2017). Economic growth, energy, and environmental Kuznets curve. Renew. Sustain. Energy Rev. 72, 639–647. doi:10.1016/J.RSER.2017.01.059
Ozturk, I., and Acaravci, A. (2010). CO2 emissions, energy consumption and economic growth in Turkey. Renew. Sustain. Energy Rev. 14, 3220–3225. doi:10.1016/J.RSER.2010.07.005
Ozturk, I., and Acaravci, A. (2013). The long-run and causal analysis of energy, growth, openness and financial development on carbon emissions in Turkey. Energy Econ. 36, 262–267. doi:10.1016/J.ENECO.2012.08.025
Paletta, A., and Bonoli, A. (2019). Governing the University in the perspective of the united nations 2030 agenda: The case of the university of bologna. Int. J. Sustain. High. Educ. 20, 500–514. doi:10.1108/IJSHE-02-2019-0083
Pao, H. T., and Chen, C. C. (2019). Decoupling strategies: CO2 emissions, energy resources, and economic growth in the group of twenty. J. Clean. Prod. 206, 907–919. doi:10.1016/J.JCLEPRO.2018.09.190
Pei, Y., Zhu, Y., Liu, S., Wang, X., and Cao, J. (2019). Environmental regulation and carbon emission: The mediation effect of technical efficiency. J. Clean. Prod. 236, 117599. doi:10.1016/J.JCLEPRO.2019.07.074
Pesaran, M. H. (2007). A simple panel unit root test in the presence of cross-section dependence. J. Appl. Econ. Chichester. Engl. 22, 265–312. doi:10.1002/JAE.951
Pesaran, M. H. (2006). Estimation and inference in large heterogeneous panels with a multifactor error structure. Econometrica 74, 967–1012. doi:10.1111/J.1468-0262.2006.00692.X
Pesaran, M. H. (2021). General diagnostic tests for cross-sectional dependence in panels. Empir. Econ. 60, 13–50. doi:10.1007/S00181-020-01875-7
Pesaran, M. H., and Tosetti, E. (2011). Large panels with common factors and spatial correlation. J. Econ. 161, 182–202. doi:10.1016/J.JECONOM.2010.12.003
Rebelatto, B. G., Lange Salvia, A., Reginatto, G., Daneli, R. C., and Brandli, L. L. (2019). Energy efficiency actions at a Brazilian University and their contribution to sustainable development Goal 7. Int. J. Sustain. High. Educ. 20, 842–855. doi:10.1108/IJSHE-01-2019-0023
Robinson, J. A., Torvik, R., and Verdier, T. (2006). Political foundations of the resource curse. J. Dev. Econ. 79, 447–468. doi:10.1016/j.jdeveco.2006.01.008
Sachs, J. D., and Warner, A. M. (1995). Natural Resource Abundance and Economic Growth, Massachusetts, United States: NBER. doi:10.3386/W5398
Sala-i-Martin, X., and Subramanian, A. (2008). Addressing the natural resource curse: An illustration from Nigeria. Econ. Policy Options a Prosperous Niger., 61–92. doi:10.1057/9780230583191_4
Saqib, N. (2022a). Asymmetric linkages between renewable energy, technological innovation, and carbon-dioxide emission in developed economies: Non-linear ARDL analysis. Environ. Sci. Pollut. Res. Int. 2022, 1–15. doi:10.1007/S11356-022-20206-0
Saqib, N., Duran, I. A., and Hashmi, N. (2022). Impact of financial deepening, energy consumption and total natural resource rent on CO2 emission in the GCC countries: Evidence from advanced panel data simulation. Int. J. Energy Econ. Policy 12, 400–409. doi:10.32479/IJEEP.12907
Saqib, N. (2022b). Green energy, non-renewable energy, financial development and economic growth with carbon footprint: heterogeneous panel evidence from cross-country. Economic Research-Ekonomska Istraživanja, 1–20. doi:10.1080/1331677X.2022.2054454
Saqib, N. (2018). Greenhouse gas emissions, energy consumption and economic growth: Empirical evidence from gulf cooperation council countries. Int. J. Energy Econ. Policy 8, 392–400. doi:10.32479/IJEEP.7269
Saqib, N. (2022c). Nexus between the renewable and nonrenewable energy consumption and carbon footprints: Evidence from asian emerging economies. Environ. Sci. Pollut. Res. Int. 2022, 1–15. doi:10.1007/S11356-022-19948-8
Sarkodie, S. A., and Strezov, V. (2019). Effect of foreign direct investments, economic development and energy consumption on greenhouse gas emissions in developing countries. Sci. Total Environ. 646, 862–871. doi:10.1016/J.SCITOTENV.2018.07.365
Sarwar, S., Shahzad, U., Chang, D., and Tang, B. (2019). Economic and non-economic sector reforms in carbon mitigation: Empirical evidence from Chinese provinces. Struct. Change Econ. Dyn. 49, 146–154. doi:10.1016/J.STRUECO.2019.01.003
Shahbaz, M. (2019). Globalization–emissions nexus: Testing the EKC hypothesis in next-11 countries. sage 23, 75–100. doi:10.1177/0972150919858490
Shahbaz, M., Hye, Q. M. A., Tiwari, A. K., and Leitão, N. C. (2013). Economic growth, energy consumption, financial development, international trade and CO2 emissions in Indonesia. Renew. Sustain. Energy Rev. 25, 109–121. doi:10.1016/J.RSER.2013.04.009
Shahbaz, M., Loganathan, N., Zeshan, M., and Zaman, K. (2015). Does renewable energy consumption add in economic growth? An application of auto-regressive distributed lag model in Pakistan. Renew. Sustain. Energy Rev. 44, 576–585. doi:10.1016/J.RSER.2015.01.017
Sharif, A., Raza, S. A., Ozturk, I., and Afshan, S. (2019). The dynamic relationship of renewable and nonrenewable energy consumption with carbon emission: A global study with the application of heterogeneous panel estimations. Renew. Energy 133, 685–691. doi:10.1016/J.RENENE.2018.10.052
Sulaiman, C., Abdul-Rahim, A. S., and Ofozor, C. A. (2020). Does wood biomass energy use reduce CO2 emissions in European union member countries? Evidence from 27 members. J. Clean. Prod. 253, 119996. doi:10.1016/j.jclepro.2020.119996
Sun, Y., Guan, W., Razzaq, A., Shahzad, M., and Binh An, N. (2022a). Transition towards ecological sustainability through fiscal decentralization, renewable energy and green investment in OECD countries. Renew. Energy 190, 385–395. doi:10.1016/j.renene.2022.03.099
Sun, Y., Li, H., Andlib, Z., and Genie, M. G. (2022b). How do renewable energy and urbanization cause carbon emissions? Evidence from advanced panel estimation techniques. Renew. Energy 185, 996–1005. doi:10.1016/j.renene.2021.12.112
Sun, Y., and Razzaq, A. (2022). Composite fiscal decentralisation and green innovation: Imperative strategy for institutional reforms and sustainable development in OECD countries. Sustainable Development. doi:10.1002/sd.2292
Uddin, G. A., Salahuddin, M., Alam, K., and Gow, J. (2017). Ecological footprint and real income: Panel data evidence from the 27 highest emitting countries. Ecol. Indic. 77, 166–175. doi:10.1016/J.ECOLIND.2017.01.003
Ulucak, R., and Bilgili, F. (2018). A reinvestigation of EKC model by ecological footprint measurement for high, middle and low income countries. J. Clean. Prod. 188, 144–157. doi:10.1016/J.JCLEPRO.2018.03.191
Ulucak, R., Kassouri, Y., Çağrı İlkay, S., Altıntaş, H., and Garang, A. P. M. (2020). Does convergence contribute to reshaping sustainable development policies? Insights from sub-saharan Africa. Ecol. Indic. 112, 106140. doi:10.1016/J.ECOLIND.2020.106140
Usman, M., Makhdum, M. S. A., and Kousar, R. (2021). Does financial inclusion, renewable and non-renewable energy utilization accelerate ecological footprints and economic growth? Fresh evidence from 15 highest emitting countries. Sustain. Cities Soc. 65, 102590. doi:10.1016/J.SCS.2020.102590
Wackernagel, M., and Rees, W. (1998). Our ecological footprint: Reducing human impact on the earth. Canada: New society publishers.
Wenbo, G., and Yan, C. (2018). Assessing the efficiency of China’s environmental regulation on carbon emissions based on Tapio decoupling models and GMM models. Energy Rep. 4, 713–723. doi:10.1016/J.EGYR.2018.10.007
Westerlund, J. (2007). Testing for error correction in panel data. Oxf. Bull. Econ. Stat. 69, 709–748. doi:10.1111/J.1468-0084.2007.00477.X
Xie, P., Gao, S., and Sun, F. (2019). An analysis of the decoupling relationship between CO2 emission in power industry and GDP in China based on LMDI method. J. Clean. Prod. 211, 598–606. doi:10.1016/J.JCLEPRO.2018.11.212
Yang, Q., Huo, J., Saqib, N., and Mahmood, H. (2022). Modelling the effect of renewable energy and public-private partnership in testing EKC hypothesis: Evidence from methods moment of quantile regression. Renew. Energy 192, 485–494. doi:10.1016/j.renene.2022.03.123
Zallé, O. (2019). Natural resources and economic growth in Africa: The role of institutional quality and human capital. Resour. Policy 62, 616–624. doi:10.1016/J.RESOURPOL.2018.11.009
Zhang, L., Yang, B., and Jahanger, A. (2021). The role of remittances inflow, renewable and non-renewable energy consumption in the environment: Accounting ecological footprint indicators for top remittance-receiving countries. doi:10.21203/RS.3.RS-456013/V1
Zhang, Y., Chen, X., Wu, Y., Shuai, C., and Shen, L. (2019a). The environmental Kuznets curve of CO2 emissions in the manufacturing and construction industries: A global empirical analysis. Environ. Impact Assess. Rev. 79, 106303. doi:10.1016/J.EIAR.2019.106303
Zhang, Z., Xi, L., Bin, S., Yuhuan, Z., Song, W., Ya, L., et al. (2019b). Energy, CO2 emissions, and value added flows embodied in the international trade of the BRICS group: A comprehensive assessment. Renew. Sustain. Energy Rev. 116, 109432. doi:10.1016/J.RSER.2019.109432
Keywords: renewable energy structure, environmental regulations, growth, trade, ecological sustainability, higher educaction
Citation: Saqib N, Duran IA and Sharif I (2022) Influence of energy structure, environmental regulations and human capital on ecological sustainability in EKC framework; evidence from MINT countries. Front. Environ. Sci. 10:968405. doi: 10.3389/fenvs.2022.968405
Received: 13 June 2022; Accepted: 25 July 2022;
Published: 26 August 2022.
Edited by:
Asif Razzaq, Ilma University, PakistanCopyright © 2022 Saqib, Duran and Sharif. This is an open-access article distributed under the terms of the Creative Commons Attribution License (CC BY). The use, distribution or reproduction in other forums is permitted, provided the original author(s) and the copyright owner(s) are credited and that the original publication in this journal is cited, in accordance with accepted academic practice. No use, distribution or reproduction is permitted which does not comply with these terms.
*Correspondence: Najia Saqib, bnNhcWliQHBzdS5lZHUuc2E=