 Zhang Yu
 Abdul Rehman Khan2
 George Thomas
 Kiran Jameel
 Muhammad Tanveer
 Laeeq Janjua
- 1School of Economics and Management, Chang’an University, Xi’an, China
- 2Department of Business Administration, ILMA University, Karachi, Pakistan
- 3Department of Marketing, College of Business Administration, Prince Sultan University, Riyadh, Saudi Arabia
- 4College of Business Management, Institute of Business Management, Karachi, Pakistan
- 5Prince Sultan University, Riyadh, Saudi Arabia
- 6Poznan University of Economics and Business, Poznan, Poland
This research aims to investigate the connection between logistic indicators, trade, renewable energy, and ICT on transport services in the selected 33 developed European countries. The researchers used the panel data from the 33 developed European countries to test the hypothesis. Panel GMM is an optimal modeling choice in this study from data sets ranging from 2007 to 2020. The results revealed that transport services have a significant positive relationship with trade, renewable energy, ICT, and internet usage. Also, the logistic indicators have a significant positive connection with transport services. Furthermore, renewable energy and transport services have a significant positive association with transport services. ICT adoption positively affects road freight transport by enhancing operations’ safety, suitability, visibility, and accountability. The effectiveness of these indicators is considerably affected by transport flow predictions and resource allocation strategy. Moreover, the management of high-quality operations requires optimization, and using transport and logistic management systems for transportation services makes it feasible to get optimal outcomes.
Introduction
The economic environment developed over the last few years in developed economies, most significantly during the COVID-19 pandemic, has revealed certain behaviors and patterns among entities to boost their competitiveness. Due to the enforced modifications in the scope of activities and functions, entities and entire economies of the developed world have begun to concentrate on obtaining and sculpting information and communication technology from the environment. It also pertains to the transportation industry. In contrast, considerable volatility remains the primary link between individual market participants, sophisticated infrastructure, and logistic channels worldwide. These economies seek to maximize their cost-effectiveness through cutting-edge technology that enables the acquisition and processing of data to provide valuable logistic information. However, it is essential to evaluate strategies that may improve the quality of transportation services by lowering the cost of executing orders for existing clients or by increasing the efficiency of these processes by eliminating errors and leveraging the existing planning agility (Sałek, 2021).
The urgency to decarbonize the transportation industry has been emphasized in several kinds of research produced under the 2030 agenda for sustainable development goals.
Transport services are almost 95% oil-dependent and consume about 50% of the world’s oil. Transportation-related CO2 emissions are expected to continue their exponential growth, and energy-related CO2 emissions constitute 74% of total greenhouse emissions. Despite electricity and heat generation continue being the highest greenhouse gas-producing industries, accounting for 43% of total greenhouse emissions in 2017, transportation employed second with a 24% share of CO2 emissions in 2017 (Kulisic et al., 2021; Yu et al., 2022a; Din et al., 2022). However, 86% of emission from the transport sector comprises the road transport. Furthermore, 95% of the energy used globally in transportation is derived from petroleum-based products, and it also has the lowest renewable energy dissemination (Kulisic et al., 2021).
CO2 emissions are much heavier than they used to be at the start of the industrial revolution, with CO2 levels in the atmosphere reaching 409.8 ppm in 2019, the highest level in at least 800,000 years (Lindsey, 2019). Developed countries have increased their efforts in recent years to gain consent for industrial sector reform and to achieve relatively speedy development in energy consumption for the creation of products and services (Ahmed et al., 2022). Due to the recent alarming prevalence of carbon emissions, mitigation techniques must be developed to balance greenhouse gas concentrations. Unfortunately, there has been no worldwide agreement on strategies for reducing severe environmental damage. Significant advancements in renewable energy provide viable alternatives to conventional fossil fuel methods. Many renewable energy sources, unlike fossil fuels, are sustainable and emit low carbon, which justifies their growing prominence (Mohsin et al., 2021).
The transportation sector is undergoing considerable development in digitization and computerization these days. The process of transport digitization entails adopting digital communication services that facilitate compliance with existing rules and the management of logistic processes (The, 2021; Ziyadin et al., 2020). This has a considerable effect on the flow of information and may contribute to the growth of competitive advantage in the market (Gunasekaran, Subramanian, Papadopoulos, 2017). Moreover, it strengthens the possibilities for sustainable transportation on all frontiers: environmental, physical, economic, and social sectors (Sarkis et al., 2020).
Numerous research studies have already been conducted in recent years to determine the association between logistic indicators, renewable energy, trade, and the role of ICT on transport services (Rezagholizadeha et al., 2020; Sałek, 2021). Considering the uncertainties surrounding the current global pandemic, it is critical to examine the perspective and recommendations of transportation services from the relevant experts (Zhang et al., 2021). The significance of ICT integration in the transportation industry enables a quick and flexible link that assists enterprises in managing operations and control by assuring end-to-end, real-time visibility of each stage of the supply chain (E2E). In developed economies, the transport companies are competent carriers with extensive experience in offering freight delivery services through road transport. They provide comprehensive air and container transport services via vehicles.
Literature review and hypothesis development
Dynamic interfaces have dominated global change for decades among individuals, corporations, and entities. Trade performance requires strong acquaintances between all stakeholders on land, sea, air routes, telecommunications, financial markets, and knowledge acquisition.
Trade and transport services
At the end of World War II, significant economic expansion on an international market resulted from all economic and social indicator transformations that subsidized the emergence of globalization (Malkowska & Malkowski, 2021). The expansion of transport, on the one hand, provides the foundation for the economic development of competencies and the strengthening of their competitiveness. However, on the other hand, it leads to environmental degradation (van Veen-Groot and Nijkamp, 1999). Certain transport companies incorporate this issue into their development priorities and outline targets and long-term initiatives that can be categorized as quality standards in the relevant discipline (Gudmundsson et al., 2005; Khan et al., 2021b). The literature revealed that the transport services’ effectiveness is triggered by a variety of factors, including ecological location, innovativeness of applied technical and organizational solutions, quality of infrastructure, level of technological advancement of transport means, and implementation of sustainability considerations in the pursuit of transportation systems (Aditjandra et al., 2016). As a new concept for attaining regional and international competitiveness, green transportation is the remedy to these constraints (Khan et al., 2021c; Khan et al., 2021d).
This concept supports adopting innovative, eco-friendly technology and organizational alternatives in the transportation sector (Tsakalidis et al., 2020; Khan et al., 2022b; Yu et al., 2022b). The concept of green transportation is necessary to maintain equilibrium among economic, social, and natural components (McKinnon et al., 2015). It seems to have a considerable influence on the transport sector’s local and global functioning and development. It results in more significant international trade, the dissemination of information and innovation, and, perhaps, a better understanding of the need to balance economic and environmental goals. In Europe, the transport industry contributes to approximately 5 percent of the gross domestic product (GDP) and directly engages more than 10 million people in 1.1 million transport firms (Ali et al., 2018). Considering the importance of the transport sector on a regional and global scale, it is vital to conduct a theoretical and practical inquiry into the significant challenges and trends observed inside this sector of the economy (Ashmarina et al., 2020; Khan et al., 2021e). Therefore, based on the past literature, the following hypothesis has been proposed:
H1. Transportation services and trade have a positive relationship.
Renewable energy and transport services
Venturini (2019) revealed that persistent growth in global agility demand, paired with a long-standing dependence on fossil energy resources, poses a substantial obstacle to assuring the transport sector’s future sustainability. Transportation activity contributes to 23% of worldwide energy-related CO2 emissions. However, population, income, and trade expansion all contribute to a ramp-up in transportation energy demand, inadequate substitute fuels, notably in the heavy-duty component, coupled with lock-in effects in the fuel and transportation infrastructure, and have contributed to a slower rate of transformation to renewable energy than in other economic sectors. Venturini et al. (2019) investigated the effects and efficiency of transportation policy measures in attaining integrated energy and transportation system emission reduction targets in Denmark. They argued that CO2 and fossil fuels tend to substantially reduce carbon emissions from the transportation sector, while fostering mobility service is the most cost-effective strategy investigated. Long et al. (2021) studied the life cycle of CO2 emissions with hazel gasification methanation to create renewable biofuels to compare the RED recast’s heat and transport sustainability goals for 2026. They concluded that 97 percent of the greatest emissions associated were achieved by changing the arable land to transportation end-use.
Furthermore, Meneghetti et al. (2021) considered that refrigerated transport is witnessing rapid growth in terms of growing demand for chilled and frozen foods. Vehicles require gasoline for mobility and to power the diesel-powered refrigeration unit that preserves the vehicle inside at the desired temperature. This tendency makes things difficult for sustainable development as transportation substantially contributes to energy consumption and associated greenhouse gas (GHG) emissions globally. Transport accounted for 31% of total final energy consumption in the E.U. in 2017 (Meneghetti et al., 2021). Moreover, 27% of total GHG is due to transportation, including road transport accounting for 74%; heavy-duty vehicles contributed to 19% of these emissions (EEA, 2020).
Therefore, based on the past literature, the following hypothesis has been proposed:
H2. Transportation services and renewable energy usage have a positive relationship.
Information and communication technology service and transport services
Information and communication technology has been recognized as a growth enabler in developing and developed countries. Several scholars have analyzed ICT use in various scenarios (Sarfraz et al., 2022; Khan et al., 2022c). The acronym ICT has been used widely in the literature, encompassing cellphones, decision support applications, smart devices with applications, and technology gadgets. Ezenwa et al. (2020) examined ICT adaptation in road freight transport in Africa. ICT adoption positively affects road freight transport by enhancing safety, suitability, visibility, and accountability in operations. Furthermore, Hasegawa (2018) studied that the expansion of ICT may also significantly affect alternative concentration to enhance transportation systems. The study by Thomopoulos and Givoni (2015) shows ICT technologies as a remedy for transportation issues and creates a cognitive comprehension of the domain’s and related fields’ prevailing arguments. They explored mechanisms for innovation and commercialization inside the market for intelligent transport systems, with a particular emphasis on collaborative activities. However, they mainly elaborated on assessments of existing ICT implementations across Europe.
Bieser and Höjer (2021) studied that ICT enables new prospects to reduce CO2 emissions from passenger transport by reducing, transferring, or upgrading transportation. The research of Chatti and Majeed (2022) seeks to examine the relationship between information and communication technology usage in passenger transportation and a sustainable environment using a panel dataset of 46 countries from 1998 to 2016. Internet and phone penetration are used to quantify ICTs, whereas environmental degradation is quantified using three separate metrics of carbon emissions from various sources. They concluded that a strong correlation between ICTs and the passenger transportation activity seems to have the potential to transform environmental sustainability by reducing carbon emissions.
Hence, based on the available literature, the following hypotheses have been proposed:
H3. Transportation and information and communication technology services have a positive relationship.
H4. Transport services and internet usage have a significant positive relationship.
Logistic indicators and transport services
Since 2007, the World Bank has been compiling a survey-based index called the logistic performance index (LPI), which is generally accepted globally (160 countries are included in the 2018 version). The LPI is an efficient mechanism for countries to measure and evaluate their logistic performance worldwide and perhaps to recognize logistical hurdles and opportunities (Gogoneata, 2008; Sarfraz et al., 2021; Rehman Khan et al., 2022). LPI is acquiring recognition as a reliable technology rapidly used by governing bodies to design strategies. LPI has been employed by the European Commission in its Transport Evaluation Panel to review the performance assessment of the Customs Union. Therefore, the World Bank is accompanied by several international transport groups and agencies in developing and implementing LPI. Therefore, it is recognized that an increase in a country’s LPI score leads to growing trade volumes in a globalized economy. Many studies have discussed the significance of logistic indicators in transportation services. Observed that the business’s logistic chain develops a strategy regarding measures to be implemented inside transportation operations and then evaluates them competitively. Sirina and Zubkov (2021) argued that the mechanisms for regulating transportation services contribute in developing a transportation and logistic system. The effectiveness of these mechanisms is considerably influenced by the forecasting and planning of cargo flows and resource distribution. They further added that management of high-quality operations entails optimization. Implementing transport and logistic management systems for transportation services makes it possible to obtain a positive optimization outcome. Sałek (2021) exemplified the significance of specific logistical indicators in enhancing the quality of transportation services. The study also tested the application of dynamics, correlation, and regression analysis to specific logistic indicators that can be employed to forecast future actions to improve the quality of processes and services delivered. It further concluded that this insight could substantially impact the growth and competitiveness of transportation enterprises, specifically in quite an unpredictable market.
Therefore, based on the past literature, the following hypothesis has been proposed:
H5. Transportation services and logistic indicators have a positive relationship.
Methodology and data source
The researchers in this study explored the nexus between transportation services, renewable energy, trade, ICT, and logistic indicators while addressing the panel data of 33 selected developed European countries. Renewable energy plays an integral part in an economy by subsidizing the framework for transportation services, which leads to substantial trade volume and logistic performance. However, the following econometric equation briefed hypothesis of this research study:
where TNRS indicates transport services containing the percentage of services exports. Trade specifies with the percentage of GDP. However, RE is explained as the percentage of final consumption of renewable energy. ICT and INT are total exports of information communication technology services and internet usage by individuals, respectively. The logistic indicators have been explained as the ability of the consignment to track and trace efficiently (L1), the competitiveness of the logistic services (L2), the ability to place cost-effective shipment price (L3), efficient clearness process from the customs (L4), and frequency of the consignment received by consignee within the expected time (L5) and efficient transport infrastructure (L6). However, the index value ranging from 1 to 5 symbolizes low-to-high logistic performance, while α is constant, and ε designates an error correction in the model. The researcher used the panel data from 33 developed European countries to test the hypothesis. Hence, the following equation has been proposed to analyze the performance of transport services:
Typically, the researchers experienced the issue of serial correlation and heteroskedasticity while dealing with the panel data, which might mislead the accurate estimation of the model. Serial correlation is the term used to denote the disturbance phrase linked with any variable in the model that the disturbance could not influence in another variable of the proposed model (An et al., 2021). FGLS permits heteroskedasticity and the absence of cross-sectional correlation in models. Due to the heterogeneity caused by the estimates, the asymptotic efficiency of FGLS may not hold on to small sample sizes. Griliches and Rao (1969) revealed that FGLS seems more appropriate and efficient than least squares for large sample sizes and that FGLS can resolve heteroskedasticity and autocorrelation constraints (Khan et al., 2018).
Equation 2 elaborated country’s time effect and country’s fixed effect as the model observed the country-specific heterogeneity issues. This research study addressed this issue by transforming these specified equations using first difference estimators, namely, dynamic panel GMM estimators, that effectively mitigated serial correlation and heterogeneity. Generally, the panel data are confronted with serial correlation, heteroskedasticity, and heterogeneity, all of which could be resolved through panel GMMs (the generalized method of moments) (Khan et al., 2019). Moreover, the GMM estimator is effective when the cross-sectional identities are large in number compared to the period identifiers (Alonso-Borrego and Arellano, 1999). A panel of 33 countries was selected for the study (Table. 1).

TABLE 1. Source of data (period of review 2007–2020).
Results and discussion
As exhibited in Table 1, all variables have a strong mean and standard deviation and a prominent spike in their dispersion, demonstrating the transport service’s robustness with the panel of 33 developed European countries with good economic growth. The performance of logistic indicators has been explained as the ability of the consignment to track and trace efficiently, competitiveness of the logistic services, ability to place cost-effective shipment price, efficient clearness process from the customs, and frequency of the consignment received by consignee within the expected time, and efficient transport infrastructure. However, the index value ranging from 1 to 5 symbolizes low-to-high logistic performance. However, all logistic indicators have a positive mean and standard deviation. Furthermore, renewable energy, ICT, and trade also have significant positive mean and standard deviation.
Table 2 demonstrates the correlation among variables in this study. The researcher found that only renewable energy positively correlates with transport services. As the usage of renewable energy increases, the transport services will be more efficient in the 33 targeted countries. However, trade, ICT, Internet usage, and all logistic indicators negatively correlate with transport services.
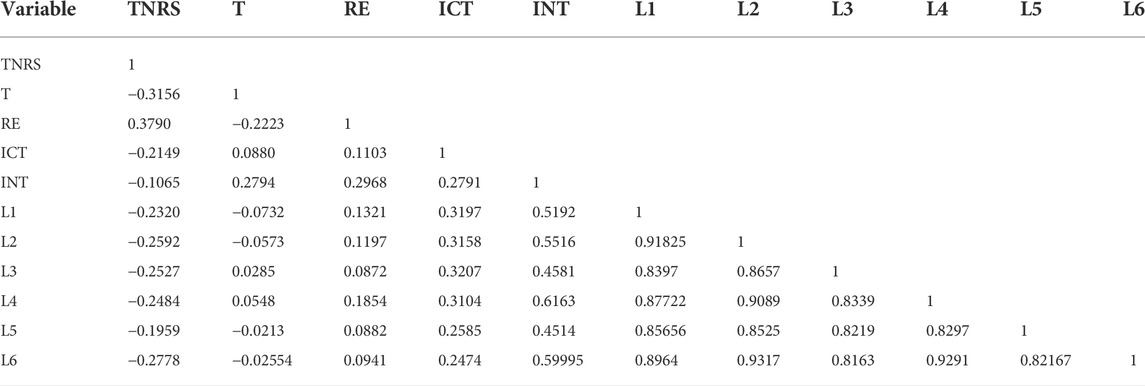
TABLE 2. Correlation matrix (developed E.U. countries).
Table 3 demonstrates the results of the static model while explaining the ordinary least square (OLS), fixed effect (F.E.), and random effect (RE). The results found that L2 has the ability to place cost-effective shipment price (L3), efficient clearness process from the customs (L4), and frequency of the consignment received by consignee within expected time and has a negative coefficient value with transport services on 1%, 5%, and 10% levels of confidence. In simple terminology, the competent logistic services, ease of competitive shipment prices, and efficient customs clearance process will significantly hurt the efficiency of the transport services. However, RE, ICT, INT, trade, and remaining logistic indices (L1, L5, and L6) significantly correlate with transport services. Renewable energy consumption will significantly improve the performance of transport services, and its less contribution to environmental degradation will help the country to achieve sustainable goals. Moreover, the efficient information and communication technology usage and usage of the Internet will significantly make the transport services efficient.
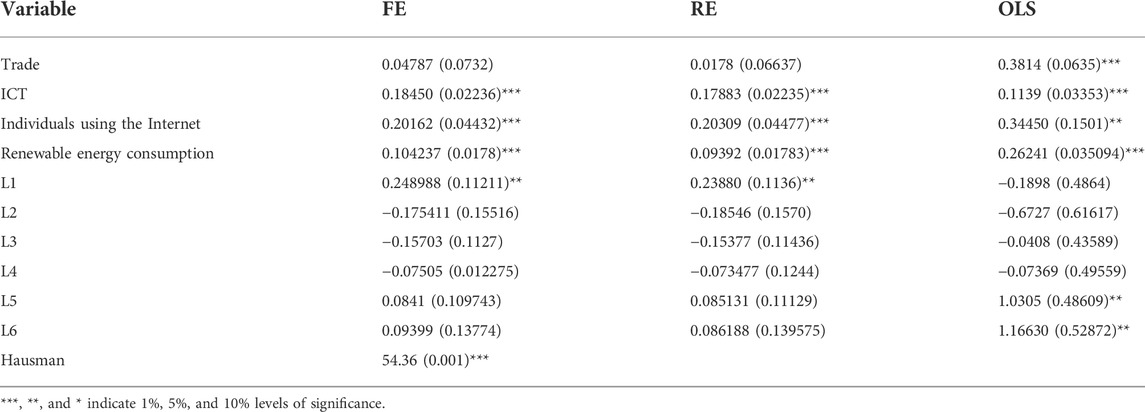
TABLE 3. Static model: the results of OLS, FE, and RE effects.
Table 4 demonstrates the panel estimation regression of GMM and FGLS. The results disclosed that transport services have a positive and significant relationship with trade, renewable energy, ICT, and internet usage at a 5% confidence level. The association between transport service and trade is directly proportional with a 0.0776 coefficient value. The significance of transport efficiency in trade cannot be denied. The economies can have a strong capacity to boost their trade balance by applying efficient transport services that drastically reduce cost and time.
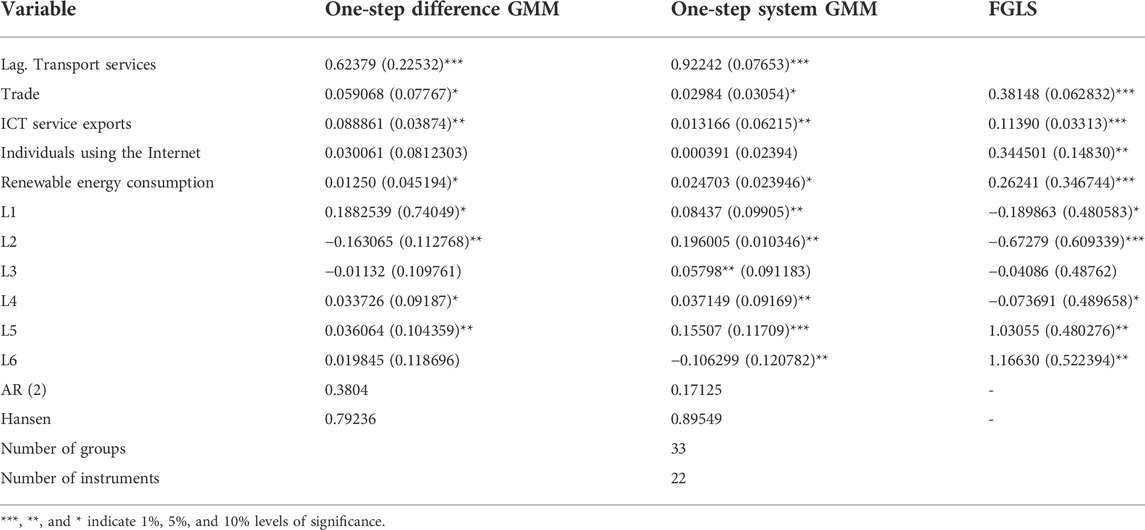
TABLE 4. Dynamic model.
Information, communication, and technology have a significant positive connection with transport services having a coefficient value of 0.038. The results revealed that ICT adoption positively affects road freight transport by enhancing safety, suitability, visibility, and accountability in operations. However, the expansion of ICT may also significantly affect the alternative concentration to enhance transportation systems. ICT technology is a means of resolving transportation difficulties and developing a cognitive understanding of the domain and related fields’ dominant arguments. Moreover, strategies for innovation and commercialization within the intelligent transport systems’ domain focus on collaborative endeavors. However, the findings mostly focus on evaluating existing ICT deployments in developed countries in Europe. It suggested that a significant association between ICTs and passenger transportation operations has the potential to transform environmental sustainability by reducing carbon emissions.
The results found that renewable energy and transport services have a significant positive association with transport services with a 0.045 coefficient value. The transportation sector produces 23% of global energy-related CO2 emissions. The population, income, and trade-economic expansion all lead to a rise in transportation energy demand; however, insufficient substitute fuels, primarily in the heavy-duty component, and lock-in effects in the fuel and transportation infrastructure have resulted in a slower rate of transformation to renewable energy than in other economic sectors. In 2017, the E.U.’s total final energy consumption for transportation accounted for 31% approximately. Additionally, 27% of total GHG emissions with road transport accounting for the majority (74%) of these emissions; heavy-duty vehicles accounted for 19% of these emissions.
Furthermore, the result findings revealed that logistic indicators positively connected with transport services, even though to develop a strategy for measures to be implemented within transportation operations and to evaluate their competitiveness within the business’s logistic chain. The efficiency of these indicators is significantly influenced by cargo flow forecasts and resource allocation planning. In addition, the management of high-quality operations requires optimization. By applying transport and logistic management systems for transportation services, it is feasible to achieve optimal outcomes.
Conclusion
Under transport services, the significance of global logistics in expanding financial operations is examined rigorously and debated. This debate is enlarged to include environmentally friendly logistical operations associated with renewable energy to tackle environmental degradation issues related to the economic expansion of developed nations. The research used the GMM and FGLS approach to predict the link between logistic indicators, trade, renewable energy, and ICT on transport services in selected 33 developed European countries. The use of renewable energy sources will considerably improve the performance of transportation services, and their reduced contribution to environmental deterioration will assist the country in achieving its sustainable goals. In addition, the use of information and communication technologies and the Internet will considerably improve the efficiency of transport services. Transport services have a considerable positive link with trade, renewable energy, ICT, and internet usage with a 5% confidence data level. The correlation between transport services and trade is directly proportional. The importance of transport efficiency in trade cannot be denied. By implementing cost-effective and time transportation services, economies can significantly improve their trade balances. The adoption of ICT positively influences road freight transport by improving operational safety, integrity, visibility, and accountability. However, the growth of ICT may also substantially impact the accumulation of opportunities to improve transport networks. However, there is a strong correlation between logistic indicators and transport services, although to establish a strategy for measures to be implemented within transportation operations and then evaluate their effectiveness within the business’s logistical system.
The effectiveness of these indicators is considerably affected by transport flow predictions and the resource allocation strategy. Moreover, the management of high-quality operations requires optimization. Using transport and logistic management systems for transportation services makes it feasible to get optimal outcomes (Table 5).
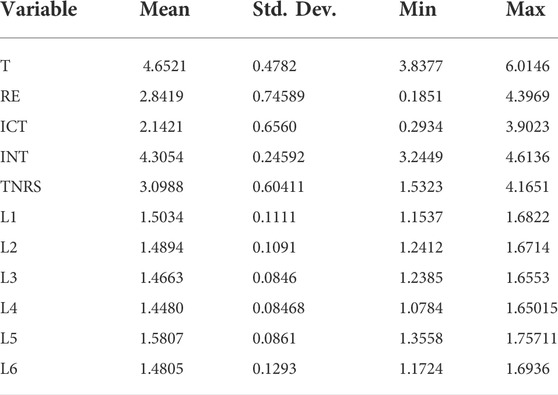
TABLE 5. Summary statistics (developed E.U. countries).
Data availability statement
The original contributions presented in the study are included in the article/supplementary material; further inquiries can be directed to the corresponding author.
Author contributions
All authors listed have made a substantial, direct, and intellectual contribution to the work and approved it for publication.
Funding
This research is supported by the Foundation of State Key Laboratory of Public Big Data (No. PBD 2022-17) and the Beijing Key Laboratory of Urban Spatial Information Engineering (NO. 20210218). Furthermore, the authors of this article would like to thank Prince Sultan University for its financial and academic support.
Conflict of interest
The authors declare that the research was conducted in the absence of any commercial or financial relationships that could be construed as a potential conflict of interest.
The reviewer [A.S] declared a shared affiliation with the author [K.J] to the handling editor at the time of review.
Publisher’s note
All claims expressed in this article are solely those of the authors and do not necessarily represent those of their affiliated organizations, or those of the publisher, the editors, and the reviewers. Any product that may be evaluated in this article, or claim that may be made by its manufacturer, is not guaranteed or endorsed by the publisher.
References
Aditjandra, P. T., Zunder, T. H., Islam, D. M. Z., and Palacin, R. (2016). “Green rail transportation: Improving rail freight to support green corridors,” in Green transportation logistics (Cham: Springer), 413–454.
Ahmed, F., Ali, I., Kousar, S., and Ahmed, S. (2022). The environmental impact of industrialization and foreign direct investment: Empirical evidence from asia-pacific region. Environ. Sci. Pollut. Res. 29, 29778–29792. doi:10.1007/s11356-021-17560-w
Ali, Y., Socci, C., Pretaroli, R., and Severini, F. (2018). Economic and environmental impact of transport sector on Europe economy. Asia-Pac. J. Reg. Sci. 2 (2), 361–397. doi:10.1007/s41685-017-0066-9
Alonso-Borrego, C., and Arellano, M. (1999). Symmetrically normalized instrumental-variable estimation using panel data. J. Bus. Econ. Statistics 17 (1), 36–49. doi:10.2307/1392237
An, H., Razzaq, A., Nawaz, A., Noman, S. M., and Khan, S. A. R. (2021). Nexus between green logistic operations and triple bottom line: Evidence from infrastructure-led Chinese outward foreign direct investment in belt and road host countries. Environ. Sci. Pollut. Res. 28 (37), 51022–51045. doi:10.1007/s11356-021-12470-3
Ashmarina, S. I., Mantulenko, V. V., and Vochozka, M. (Editors) (2020). Engineering economics: Decisions and solutions from eurasian perspective (Springer Nature), 139.
Bieser, J. C., and Höjer, M. (2021). “A framework for assessing impacts of information and communication technology on passenger transport and greenhouse gas emissions,” in Environmental informatics (Cham: Springer), 235–253.
Chatti, W., and Majeed, M. T. (2022). Investigating the links between ICTs, passenger transportation, and environmental sustainability. Environ. Sci. Pollut. Res. 29 (18), 26564–26574. doi:10.1007/s11356-021-17834-3
Din, S., Nazir, M. S., and Sarfraz, M. (2022). The climate change and stock market: Catastrophes of the Canadian weather. Environ. Sci. Pollut. Res. 29, 44806–44818. doi:10.1007/s11356-022-19059-4
EEA (2020). Final energy consumption by sector and fuel in Europe. Available at: https://www.eea.europa.eu/data-and-maps/indicators/final-energy-consumptionby-sector-10/assessment.
Ezenwa, A., Whiteing, A., Johnson, D., and Oledinma, A. (2020). Factors influencing information and communication technology diffusion in Nigeria's transport logistics industry: An exploratory study. Int. J. Intelligent Enterp. 13 (2/3), 252–276. doi:10.1504/ijism.2020.107846
Gogoneata, B. (2008). An analysis of explanatory factors of logistics performance of a country. Amfiteatru Econ. J. 10 (24), 143156.
Griliches, Z., and Rao, P. (1969). Small-sample properties of several two-stage regression methods in the context of autocorrelated disturbances. J. Am. Stat. Assoc. 64, 253–272. doi:10.1080/01621459.1969.10500968
Gudmundsson, H., Wyatt, A., and Gordon, L. (2005). Benchmarking and sustainable transport policy: Learning from the BEST network. Transp. Rev. 25 (6), 669–690. doi:10.1080/01441640500414824
Gunasekaran, A., Subramanian, N., and Papadopoulos, T. (2017). Information technology for competitive advantage within logistics and supply chains: A review. Transp. Res. Part E Logist. Transp. Rev. 99, 14–33. doi:10.1016/j.tre.2016.12.008
Hasegawa, T. (2018). Toward the mobility-oriented heterogeneous transport system based on new ICT environments–Understanding from a viewpoint of the systems innovation theory. IATSS Res. 42 (2), 40–48. doi:10.1016/j.iatssr.2018.07.001
Khan, S. A. R., Zhang, Y., Anees, M., Golpîra, H., Lahmar, A., and Qianli, D. (2018). Green supply chain management, economic growth and environment: A GMM based evidence. J. Clean. Prod. 185, 588–599. doi:10.1016/j.jclepro.2018.02.226
Khan, S. A. R., Jian, C., Zhang, Y., Golpîra, H., Kumar, A., and Sharif, A. (2019). Environmental, social and economic growth indicators spur logistics performance: From the perspective of south asian association for regional cooperation countries. J. Clean. Prod. 214, 1011–1023. doi:10.1016/j.jclepro.2018.12.322
Khan, S. A. R., Godil, D. I., Jabbour, C. J. C., Shujaat, S., Razzaq, A., and Yu, Z. (2021b). Green data analytics, blockchain technology for sustainable development, and sustainable supply chain practices: Evidence from small and medium enterprises. Ann. Oper. Res.. 1011–1023. doi:10.1007/s10479-021-04275-x
Khan, S. A. R., Godil, D. I., Yu, Z., Abbas, F., and Shamim, M. A. (2021c). Adoption of renewable energy sources, low-carbon initiatives, and advanced logistical infrastructure—An step toward integrated global progress. Sustain. Dev. 30, 275. Early View. doi:10.1002/sd.2243
Khan, S. A. R., Godil, D. I., Quddoos, M. U., Yu, Z., Akhtar, M. H., and Liang, Z. (2021d). Investigating the nexus between energy, economic growth, and environmental quality: A road map for the sustainable development. Sustain. Dev. 29 (5), 835–846. doi:10.1002/sd.2178
Khan, S. A. R., Yu, Z., and Sharif, A. (2021e). No silver bullet for de-carbonization: Preparing for tomorrow, today. Resour. Policy 71, 101942. doi:10.1016/j.resourpol.2020.101942
Khan, S. A. R., Piprani, A. Z., and Yu, Z. (2022b). Digital technology and circular economy practices: Future of supply chains. Oper. Manag. Res.. 588–599. doi:10.1007/s12063-021-00247-3
Khan, S. A. R., Umar, M., Asadov, A., Tanveer, M., and Yu, Z. (2022c). Technological revolution and circular economy practices: A mechanism of green economy. Sustainability 14 (8), 4524. doi:10.3390/su14084524
Kulisic, B., Dimitriou, I., and Mola-Yudego, B. (2021). From preferences to concerted policy on mandated share for renewable energy in transport. Energy Policy 155, 112355. doi:10.1016/j.enpol.2021.112355
Lindsey, R. (2019). Climate change: Atmospheric carbon dioxide. Available online: https://www.climate.gov/news-features/understanding-climate/climate-change-atmospheric-carbon-dioxide.
Long, A., Bose, A., O'Shea, R., Monaghan, R., and Murphy, J. D. (2021). Implications of European Union recast Renewable Energy Directive sustainability criteria for renewable heat and transport: Case study of willow biomethane in Ireland. Renew. Sustain. Energy Rev. 150, 111461. doi:10.1016/j.rser.2021.111461
Malkowska, A., and Malkowski, A. (2021). International trade in transport services between Poland and the European union. Sustainability 13 (1), 424. doi:10.3390/su13010424
McKinnon, A., Browne, M., Whiteing, A., and Piecyk, M. (Editors) (2015). Green logistics: Improving the environmental sustainability of logistics (London: Kogan Page Publishers).
Meneghetti, A., Dal Magro, F., and Romagnoli, A. (2021). Renewable energy penetration in food delivery: Coupling photovoltaics with transport refrigerated units. Energy 232, 120994. doi:10.1016/j.energy.2021.120994
Mohsin, M., Kamran, H. W., Nawaz, M. A., Hussain, M. S., and Dahri, A. S. (2021). Assessing the impact of transition from nonrenewable to renewable energy consumption on economic growth-environmental nexus from developing Asian economies. J. Environ. Manag. 284, 111999. doi:10.1016/j.jenvman.2021.111999
Rehman Khan, S. A., Hassan, S., Khan, M. A., Khan, M. R., Godil, D. I., and Tanveer, M. (2022). Nexuses between energy efficiency, renewable energy consumption, foreign direct investment, energy consumption, global trade, logistics and manufacturing industries of emerging economies: In the era of COVID-19 pandemic. Front. Environ. Sci. 10, 880200. doi:10.3389/fenvs.2022.880200
Rezagholizadeha, Mahdieh, Aghaei, Majid, and Dehghan, Omid (2020). Foreign direct investment, stock market development, and renewable energy consumption: Case study of Iran. J. Renew. Energy Environ. 7, 8–18. doi:10.30501/JREE.2020.105913
Sałek, R. (2021). The importance of telematic information and logistics indicators for the management of the quality of transport services. Prod. Eng. Arch. 27 (3), 176–183. doi:10.30657/pea.2021.27.23
Sarfraz, M., Ivascu, L., Abdullah, M. I., Ozturk, I., and Tariq, J. (2022). Exploring a pathway to sustainable performance in manufacturing firms: The interplay between innovation capabilities, green process, product innovations and digital leadership. Sustainability 14 (10), 5945. doi:10.3390/su14105945
Sarfraz, M., Mohsin, M., Naseem, S., and Kumar, A. (2021). Modeling the relationship between carbon emissions and environmental sustainability during COVID-19: A new evidence from asymmetric ARDL cointegration approach. Environ. Dev. Sustain. 23, 16208–16226. doi:10.1007/s10668-021-01324-0
Sarkis, J., Kouhizadeh, M., and Zhu, Q. S. (2020). Digitalization and the greening of supply chains. Industrial Manag. Data Syst. 121 (1), 65–85. doi:10.1108/IMDS-08-2020-0450
Sirina, N., and Zubkov, V. (2021). Transport services management on transport and logistic methods. Transp. Res. Procedia 54, 263–273. doi:10.1016/j.trpro.2021.02.072
Thomopoulos, N., and Givoni, M. (Editors) (2015). ICT for transport: Opportunities and threats (London: Edward Elgar Publishing).
Tsakalidis, A., van Balen, M., Gkoumas, K., and Pekar, F. (2020). Catalyzing sustainable transport innovation through policy support and monitoring: The case of TRIMIS and the European green deal. Sustainability 12 (8), 3171. doi:10.3390/su12083171
van Veen-Groot, D. B., and Nijkamp, P. (1999). Globalisation, transport and the environment: New perspectives for ecological economics. Ecol. Econ. 31 (3), 331–346. doi:10.1016/s0921-8009(99)00099-3
Venturini, G., Karlsson, K., and Münster, M. (2019). Impact and effectiveness of transport policy measures for a renewable-based energy system. Energy Policy 133, 110900. doi:10.1016/j.enpol.2019.110900
Venturini, G. (2019). Transition to sustainable transport systems: Perspectives on alternative fuels, collaborative development of coherent scenarios and policy analysis for the case of the Danish energy system. Denmark: Technical University of Denmark.
Yu, Z., Ridwan, I. L., Irshad, A. U. R., Tanveer, M., and Khan, S. A. R. (2022a). Investigating the nexuses between transportation Infrastructure, renewable energy Sources, and economic Growth: Striving towards sustainable development. Ain Shams Eng. J., 101843. doi:10.1016/j.asej.2022.101843
Yu, Z., Umar, M., and Rehman, S. A. (2022b). Adoption of technological innovation and recycling practices in automobile sector: Under the covid-19 pandemic. Oper. Manag. Res.. 835–846. doi:10.1007/s12063-022-00263-x
Zhang, J., Hayashi, Y., and Frank, L. D. (2021). COVID-19 and transport: Findings from a worldwide expert survey. Transp. Policy 103 (01), 68–85. doi:10.1016/j.tranpol.2021.01.011
Keywords: logistic indicators, transport services, trade, renewable energy, information communication technology
Citation: Yu Z, Khan AR, Thomas G, Jameel K, Tanveer M and Janjua L (2022) Nexuses between international trade, renewable energy, and transport services: Leading toward practical implications and trade policies. Front. Environ. Sci. 10:980648. doi: 10.3389/fenvs.2022.980648
Received: 28 June 2022; Accepted: 18 July 2022;
Published: 22 August 2022.
Edited by:
Jean Vasile Andrei, Universitatea Petrol Si Gaze Ploiesti, RomaniaReviewed by:
Asif Basit, University of Malaya, MalaysiaAdeel Shah, College of Business Management, Pakistan
Muddassar Sarfraz, Putra Malaysia University, Malaysia
Copyright © 2022 Yu, Khan, Thomas, Jameel, Tanveer and Janjua. This is an open-access article distributed under the terms of the Creative Commons Attribution License (CC BY). The use, distribution or reproduction in other forums is permitted, provided the original author(s) and the copyright owner(s) are credited and that the original publication in this journal is cited, in accordance with accepted academic practice. No use, distribution or reproduction is permitted which does not comply with these terms.
*Correspondence: Zhang Yu, emhhbmd5dTE5QGZveG1haWwuY29t