 Muhammad Bilal1*†
 Md. Arfan Ali1†
 Janet E. Nichol2
 Max P. Bleiweiss3
 Gerrit de Leeuw4,5,6
 Alaa Mhawish1
 Yuan Shi7
 Usman Mazhar8
 Tariq Mehmood9
 Jhoon Kim10
 Zhongfeng Qiu1*
 Wenmin Qin11
 Majid Nazeer12
- 1School of Marine Sciences, Nanjing University of Information Science and Technology, Nanjing, China
- 2Department of Geography, School of Global Studies, University of Sussex, Brighton, United Kingdom
- 3Department of Entomology, Plant Pathology and Weed Science, New Mexico State University, Las Cruces, NM, United States
- 4Royal Netherlands Meteorological Institute (KNMI), R & D Satellite Observations, De Bilt, Netherlands
- 5Aerospace Information Research Institute, Chinese Academy of Sciences (AirCAS), Beijing, China
- 6School of Environment Science and Spatial Informatics, University of Mining and Technology, Xuzhou, Jiangsu, China
- 7Department of Geography and Planning, School of Environmental Sciences, University of Liverpool, Liverpool, United Kingdom
- 8School of Remote Sensing and Geomatics Engineering, Nanjing University of Information Science and Technology, Nanjing, China
- 9College of Ecology and Environment, Hainan University, Haikou, Hainan Province, China
- 10Department of Atmospheric Sciences, Yonsei University, Seoul, South Korea
- 11Hunan Key Laboratory of Remote Sensing of Ecological Environment in Dongting Lake Area, School of Geography and Information Engineering, China University of Geosciences, Wuhan, China
- 12Urban Sector Policy and Management Services Unit (Pvt.) Limited, Lahore, Pakistan
Numerous studies (hereafter GA: general approach studies) have been made to classify aerosols into desert dust (DD), biomass-burning (BB), clean continental (CC), and clean maritime (CM) types using only aerosol optical depth (AOD) and Ångström exponent (AE). However, AOD represents the amount of aerosol suspended in the atmospheric column while the AE is a qualitative indicator of the size distribution of the aerosol estimated using AOD measurements at different wavelengths. Therefore, these two parameters do not provide sufficient information to unambiguously classify aerosols into these four types. Evaluation of the performance of GA classification applied to AErosol Robotic NETwork (AERONET) data, at sites for situations with known aerosol types, provides many examples where the GA method does not provide correct results. For example, a thin layer of haze was classified as BB and DD outside the crop burning and dusty seasons respectively, a thick layer of haze was classified as BB, and aerosols from known crop residue burning events were classified as DD, CC, and CM by the GA method. The results also show that the classification varies with the season, for example, the same range of AOD and AE were observed during a dust event in the spring (20th March 2012) and a smog event in the autumn (2nd November 2017). The results suggest that only AOD and AE cannot precisely classify the exact nature (i.e., DD, BB, CC, and CM) of aerosol types without incorporating more optical and physical properties. An alternative approach, AEROsol generic classification using a novel Satellite remote sensing Approach (AEROSA), is proposed to provide aerosol amount and size information using AOD and AE, respectively, from the Terra-MODIS (MODerate resolution Imaging Spectroradiometer) Collection 6.1 Level 2 combined Dark Target and Deep Blue (DTB) product and AERONET Version 3 Level 2.0 data. Although AEROSA is also based on AOD and AE, it does not claim the nature of aerosol types, instead providing information on aerosol amount and size. The purpose is to introduce AEROSA for those researchers who are interested in the generic classification of aerosols based on AOD and AE, without claiming the exact aerosol types such as DD, BB, CC, and CM. AEROSA not only provides 9 generic aerosol classes for all observations but can also accommodate variations in location and season, which GA aerosol types do not.
1 Introduction
Atmospheric aerosols, originating from both natural and anthropogenic sources, play a crucial role in influencing climate, atmospheric visibility, cloud microphysical properties, and the hydrological cycle by interacting with incoming solar and outgoing terrestrial radiation. The characterization of aerosol types helps to improve modeling aerosol radiative forcing and thus to understand their effects on climate and the Earth’s radiation budget. Previous studies have characterized aerosol types using ground-based remote sensing instruments such as Sunphotometers (Eck et al., 1999; Dubovik et al., 2002; Omar et al., 2005; Lee et al., 2010; Russell et al., 2010), and satellite-based remote sensing observations (Nakajima and Higurashi, 1998; Higurashi and Nakajima, 1999; Higurashi and Nakajima, 2002; Barnaba and Gobbi, 2004; Kim et al., 2007; Russell et al., 2014). In general, wavelength-dependent physical and optical properties are required to characterize aerosols into distinct types such as biomass-burning aerosol (source: forest fires and crop-residue burning), urban-industrial aerosol (source: fossil fuel combustion), maritime aerosol (source: ocean), dust aerosol (source: deserts), and clean continental aerosol (source: anthropogenic activities) (Dubovik et al., 2002).
The Ångström Exponent (AE) is a useful parameter for aerosol type characterization (Eck et al., 1999) as it provides an indication of the shape of the particle size distribution and can be estimated from ground-based measurements (Schuster et al., 2006) as well as satellite remote sensing retrievals (Nakajima and Higurashi, 1998). Previous studies show that AE values approaching 0 indicate the dominance of coarse-mode aerosols (with diameters larger than 1 µm) and AE values greater than 1.0 indicate the dominance of accumulation mode or fine-mode aerosol (smaller than 1 µm) (Kaufman et al., 1994; Eck et al., 1999). AE values for specific events have been reported using ground-based remote sensing instruments for biomass-burning aerosol (Eck et al., 1999; Reid et al., 1999; Eck et al., 2001a; Eck et al., 2001b; Eck et al., 2003; Keil and Haywood, 2003), urban aerosol (Eck et al., 1999), maritime aerosol (Smirnov et al., 2002), and dust aerosol (Eck et al., 1999; Kubilay et al., 2003; Masmoudi et al., 2003; Eck et al., 2005). Nakajima and Higurashi (1998) have estimated AE values from satellite-based observations to differentiate between coarse-mode and fine-mode aerosol on a global scale.
Aerosol types are associated with their sources. For example, biomass-burning results in the emission of smoke aerosol (Reid and Hobbs, 1998; Remer et al., 1998), volcanic eruption emits ash into the atmosphere (d'Almeida, 1987), breaking waves produce sea-salt aerosol (Hoppel et al., 1990; Smirnov et al., 2002; de Leeuw et al., 2011), biogenic aerosol particles and their precursor gases are emitted by plants (Artaxo et al., 1998; Kavouras et al., 1998), and fossil fuel combustion produces urban-industrial aerosol (Remer et al., 1998). Seaspray aerosol and desert dust aerosol are governed by directly emitted coarse particles. The other sources predominantly produce fine mode particles, either directly, such as BC (black carbon), or through precursor gases such as AVOC and BVOC (anthropogenic and biogenic volatile organic compounds), NH3 (ammonium), SO2 (sulphurdioxide) and NO2 (nitrogen oxide). Furthermore, the aerosol particles are emitted in a pool of aerosol particles and thus a “pure” aerosol type is hard to find in the atmosphere, except maybe for dust during a dust storm, or seaspray aerosol during a storm at sea and at remote locations. Usually, the aerosol is a mixture and therefore the type is hard to identify. Also, the aerosol size distribution and composition change due to chemical and physical transformation processes in the atmosphere such as aerosol aging (Reid and Hobbs, 1998), changes in response to variations in relative humidity, and the interactions between aerosol particles and clouds (Remer et al., 1998).
For the classification of aerosol types, approaches based on the use of aerosol optical depth (AOD) and AE have been developed (Toledano et al., 2007; Kalapureddy et al., 2009; Kaskaoutis et al., 2009; Pathak et al., 2012; Yu et al., 2016; Kumar et al., 2018). In general, there are two types of approaches for characterization of aerosol types using AOD and AE: 1) Specific Events Approach (SEA) studies which report the AOD and AE values along with other optical and physical properties from AErosol Robotic NETwork (AERONET)/Sunphotometer measurements for specific events such as biomass-burning, urban-industrial emissions, and dust storms (Table 1) (Kaufman and Sendra, 1988; Remer et al., 1998; Eck et al., 1999; Reid et al., 1999; Eck et al., 2001a; Eck et al., 2001b; Dubovik et al., 2002; Eck et al., 2003; Kubilay et al., 2003; Eck et al., 2005; Giles et al., 2012); 2) General Approach (GA) studies use a wide range of AOD and AE values (Table 2), reported by SEA studies, to characterize aerosol into 4 distinct types such as 1) Desert Dust aerosol (DD: coarse particles with high AOD), 2) Biomass Burning/Urban-Industrial aerosol (BB/UI: fine particles with high AOD), 3) Clean Continental aerosol (CC: fine particles with low AOD), and 4) Clean Maritime aerosol (CM: mixed particles with low AOD) (Kaskaoutis et al., 2007; Kalapureddy et al., 2009; Kaskaoutis et al., 2009; Pathak et al., 2012; Li et al., 2013; Sreekanth, 2014; Rama et al., 2015; Bibi et al., 2016; Tiwari et al., 2016; Xia et al., 2016; Alam et al., 2018; Gharibzadeh et al., 2018; de Oliveira et al., 2019; Yousefi et al., 2020). The AOD and AE ranges used in GA methods for each of these 4 types are those defined for local/regional scales covered by the SEA studies and hence have limited applicability, i.e., for the location and during the seasons where and when the SEA measurements were made. Such point measurements are representative of a relatively small area around the location. As AOD refers to the amount of aerosol and the AE provides an indication of the size of the governing aerosol particles, this information is not sufficient to unambiguously characterize aerosol types such as DD, BB, CC, or CM unless a specific aerosol event occurs with a governing aerosol type for which most of the properties are evident. Therefore, the hypothesis (objective) of this study is that “the use of AOD and AE is insufficient for characterizing aerosols into 4 distinct types unless additional information is available.” To test this hypothesis, AOD and AE were obtained from Sunphotometer measurements at two AERONET sites in Pakistan and from the Terra-MODIS (MODerate resolution Imaging Spectroradiometer) Collection 6.1 (C6.1) Level 2 combined Dark Target and Deep Blue (DTB) aerosol product to characterize the aerosol into the four aerosol types (DD, BB, CC, and CM) using GA methods (Table 2). The MODIS and AERONET results were compared and evaluated. In addition, an alternative generic classification method, AEROSA (AEROsol generic classification using a novel Satellite remote sensing Approach), is described in Methods, with 9 generic aerosol classes defined based on the AOD and AE values, rather than assigning any connection to chemical composition. These classes were named based on the definition of AOD (low, medium, and high) and AE (coarse, mixed, and fine). The reason for proposing this approach is the limited amount of information available from most satellite-based sensors which limits the detail which can be provided from the retrieval, similar to the approach followed for aerosol retrieval in ESA’s cci project (European Space Agency; climate change initiative) Aerosol_cci (de Leeuw et al., 2015). The AEROSA approach was implemented using spatially distributed AOD and AE data provided from satellite retrievals, as well as AOD and AE from local ground-based Sunphotometer measurements. This approach can improve confidence in the characterization of aerosols from remote sensing instruments, and provide a more accurate, generic standard for aerosol class recognition. It is important to clearly state that the objective of this study is not to determine exact aerosol types and identify their sources; this is not possible using AOD and AE alone. The determination of more detailed aerosol information and aerosol sources requires multiple optical and physical aerosol properties as reported by previous SEA studies (Eck et al., 1999; Dubovik et al., 2002). The purpose is to test the hypothesis of this study and show that the classification of aerosol types by GA methods using only AOD and AE (Table 2) may not always be accurate and unambiguous, in particular in specific situations as illustrated in this study. CALIOP Level 2 Verison 4.2 images were also used for validation of aerosol type classification results by GA methods. In this study, AEROSA is proposed for defining generic aerosol classes, for those researchers who are interested in the generic classification of aerosol based on AOD and AE, without claiming the exact nature of aerosol types (i.e., DD, BB, CC, and CM).
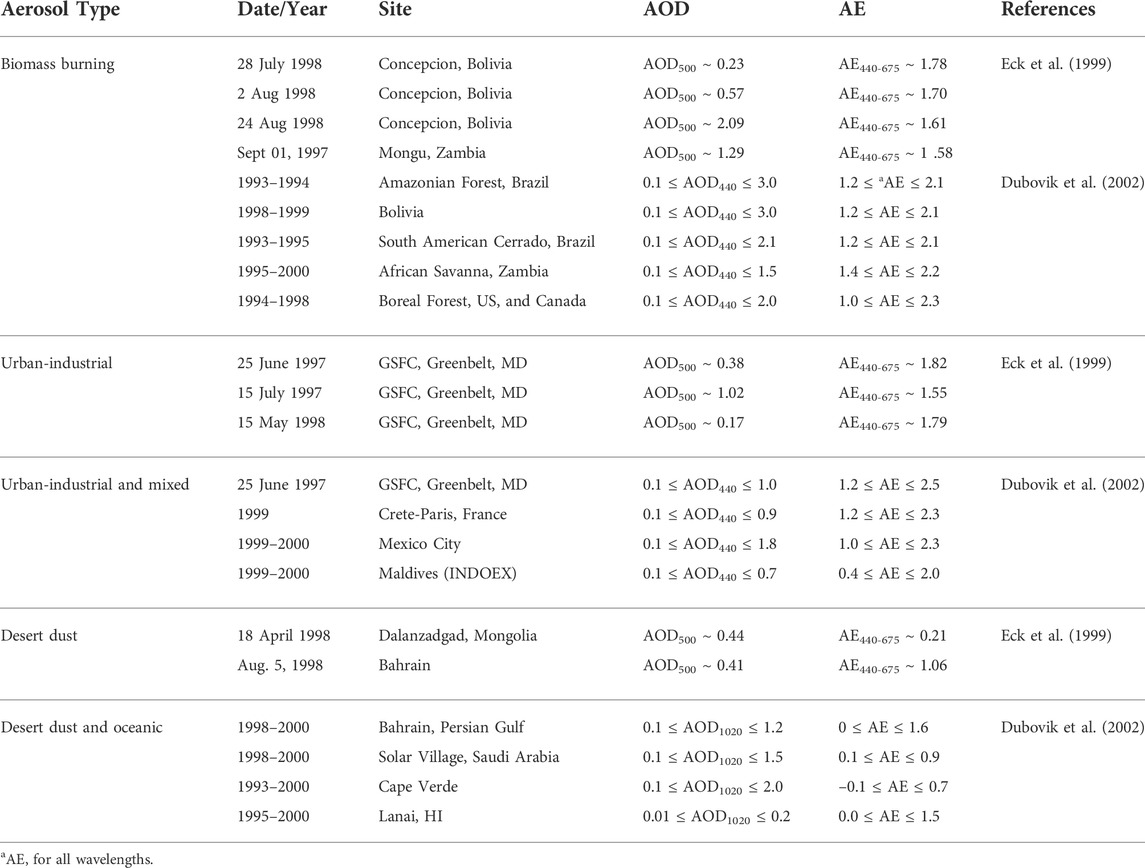
TABLE 1. AOD and AE for aerosol types retrieved from AERONET by SEA studies.
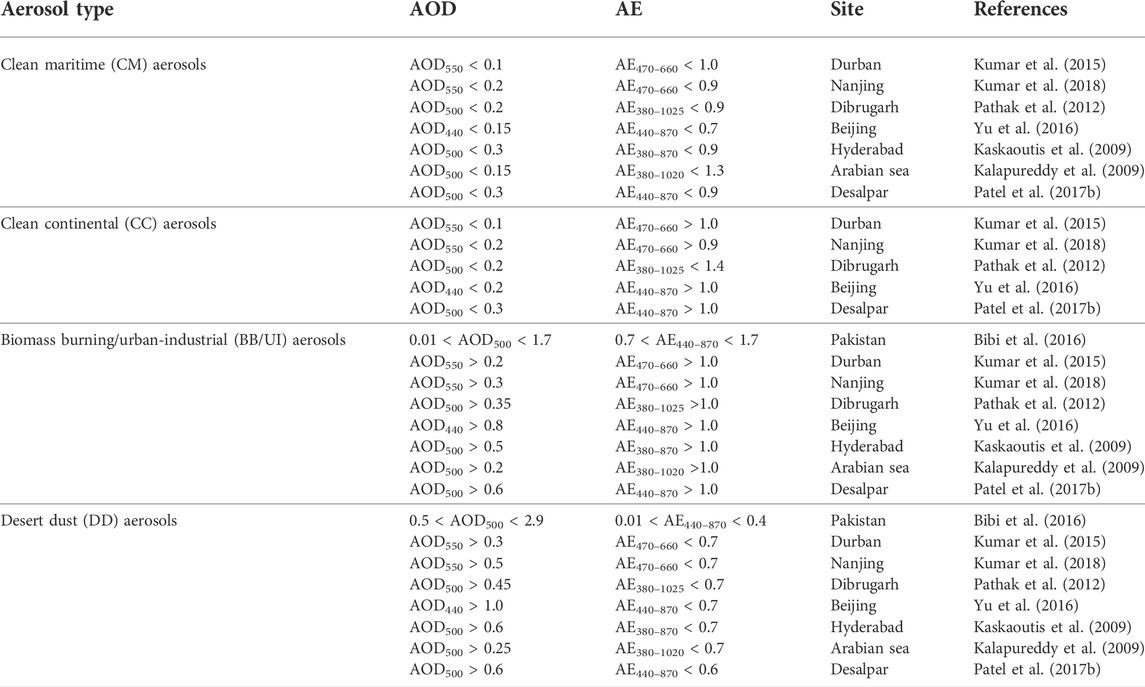
TABLE 2. The ranges of AOD and AE for aerosol types used in GA methods.
2 Datasets
2.1 Terra-MODIS products
The MODIS Level 2 aerosol product (MOD04) provides spectral AOD retrievals at 10 km spatial resolution based on the Dark Target (DT) (Levy et al., 2013) algorithms over land and ocean, and the Deep Blue (DB) algorithm (Hsu et al., 2013) over land. Over- and under-estimations in DT and DB AOD retrievals have been reported (Bilal and Nichol, 2015), especially in the study area (Pakistan) (Bilal et al., 2016). In the present study, the combined DT and DB (DTB) AOD retrievals based on the Terra-MODIS Collection 6.1 Level 2 aerosol product were used for the development of AEROSA. The MODIS aerosol product over Pakistan was obtained from March 2000 to February 2018 (18 years) from the NASA Level-1 and Atmosphere Archive and Distribution System (LAADS) Distributed Active Archive Center (DAAC) (https://ladsweb.modaps.eosdis.nasa.gov/). Furthermore, the MODIS Level 1 swath product (MOD021KM) at 1 km spatial resolution and MODIS thermal/fire anomaly data during the known aerosol events were obtained to check the classification results.
2.2 AErosol Robotic NETwork version 3 level 2.0 data
The Aerosol Robotic Network (AERONET) (Holben et al., 1998; Holben et al., 2001), a global network of well-calibrated Sunphotometers (see https://aeronet.gsfc.nasa.gov/for detail), provides regular measurements of the AOD at 340, 380, 440, 500, 675, 870, 1,020, and 1,640 nm, and the AE at 340–440 nm, 380–500 nm, 440–675 nm, and 500–870 nm at three data quality levels i.e., Level 1.0 (unscreened), Level 1.5 (cloud-screened), and Level 2.0 (cloud-screened and quality-assured), under cloud-free skies (Smirnov et al., 2000) for every 15 min with an uncertainty of 0.01–0.02 (Holben et al., 2001). For comparison purposes, 8 years (2007–2014) of AERONET Version 3 Level 2.0 data (AOD500 and AE440–675) (Giles et al., 2019) for Lahore and Karachi (Pakistan), were obtained from the AERONET website (https://aeronet.gsfc.nasa.gov/). AERONET data from 1999 to 2018 were also obtained for Solar village and KAUST-Campus sites (Saudi Arabia) for comparison purposes.
2.3 Cloud-aerosol lidar infrared pathfinder satellite observation aerosol subtypes data
The Cloud-Aerosol Lidar with Orthogonal Polarization (CALIOP) on the Cloud-Aerosol Lidar Infrared Pathfinder Satellite Observation (CALIPSO), was launched by NASA on 28th April 2006. CALIOP provides information on the vertical distribution of aerosols in the atmosphere along the flight track, i.e., aerosol backscatter and extinction as well as aerosol types, for both day and night times at the global scale. However, the lidar footprint is very small, with a laser beam diameter of 70 m on the ground. The new updated CALIOP V4.2 algorithm classifies the tropospheric aerosol types into seven subtypes: clean marine, pure dust, polluted continental/smoke, clean continental, polluted dust, elevated smoke, and dusty marine. The CALIOP aerosol classification algorithm classifies aerosol subtypes based on several physical characteristics, including altitude, location (i.e., latitude and longitude), surface type, particulate depolarization ratio, and integrated attenuated backscatter (Kim et al., 2018). Each aerosol subtype is associated with extinction-to-backscatter ratio (i. e., lidar ratio), which is considered a key parameter in retrieval algorithm and determined based on observation, modeling, and cluster analysis of a multiyear dataset obtained from AEWRONET measurements (Omar et al., 2009; Winker et al., 2009; Kim et al., 2018; Young et al., 2018). Several studies showed that the aerosol subtypes are reliable (Rupakheti et al., 2019; Ali et al., 2020; Qiu et al., 2021) and highly consistent with those classified by AERONET measurements (Mielonen et al., 2009; Burton et al., 2013; Falah et al., 2022). In addition, the V4.2 algorithm revised the lidar ratio for aerosol subtypes and introduced new aerosol subtypes (dusty marine), improving aerosol optical properties retrieval (Kim et al., 2018). In the present study, CALIOP Level 2 V4.2 images were used (https://www-calipso.larc.nasa.gov/products/lidar/browse_images/std_v4_index.php?d=2012, accessed on 20 June 2021) for validation of aerosol classification results by GA methods.
3 Research methodology
The research methodology of the present study is based on the following steps:
1) Aerosols were classified into 4 distinct types (Table 3) such as DD, BB, CC, and CM using GA methods. In this exercise, AOD at 550 nm (AOD550) and AE at 440–675 nm (AE440–675) measured at the AERONET sites in Lahore and Karachi were used with the thresholds provided by GA studies in Table 2. AERONET does not provide AOD at 550 nm (AOD550), therefore AOD550 was obtained from interpolation using AERONET AOD500 and AE440–675 measurements (Eq. 1).
2) The GA aerosol types (Table 3) results were evaluated by comparison with the CALIOP aerosol subtypes obtained over the above-mentioned AERONET sites between 2009 and 2015. Due to the low temporal resolution (16 days) and narrow swath width of CALIOP data only 8 co-located CALIOP-AERONET images were identified.
3) The GA aerosol types (Table 3) were also verified over the Lahore AERONET site using true-color composites of the Terra-MODIS Level 1 swath product (MOD021KM) at 1 km spatial resolution and MODIS thermal/fire anomaly data during the known aerosol events.
4) This study hypothesizes that AOD and AE cannot be used to precisely and unambiguously define distinct aerosol types (BB, DD, CC, and CM). However, one can define generic aerosol classes based on AOD and AE, i.e., on the aerosol amount (low, medium, or high) using AOD as a proxy and aerosol size (coarse, mixed, or fine mode) using AE as a proxy. To this end, 9 new generic aerosol classes (Table 4) were defined based on MODIS AOD550 and AE470-660 (see below). The AE470-660 was computed from AOD470 and AOD660 using Eq. 2 (Eck et al., 1999) using MODIS DTB AOD470 and AOD660 together with AOD550, which were generated using the Simplified Merge Scheme (SMS) (Bilal et al., 2017; Bilal et al., 2018a; Bilal et al., 2018b). SMS provides AOD data with a quality that is comparable to that of the combined DTB AOD retrievals available in the Scientific Data Set (SDS) “AOD_550_Dark_Target_Deep_Blue_Combined” which significantly improved the spatio-temporal coverage. For this purpose, only the highest quality-assured DT (QA = 3) and DB (QA ≥ 2) regionally distributed daily spectral AOD retrievals at 470, 550, and 660 nm were considered, as recommended in the literature (Levy et al., 2013; Sayer et al., 2013; Sayer et al., 2014; Levy et al., 2015). The DTB AOD550 and AE470–660 data were validated against AERONET AOD550 and AE440–675 measurements to assure MODIS data quality and reliability. To increase the number of AERONET-MODIS collocations, at least two AERONET AOD measurements were considered between 10:00 and 12:00 Pakistan Standard Time (PKT), matching the Terra-MODIS overpass time over the region, and at least 2 out of 9 MODIS pixels were considered within a spatial window of 3 × 3 pixels centered on the AERONET site.
5) For AEROSA, coincident DTB AOD550 and AE470-660 retrievals were extracted for a spatial window of 1 × 1 pixel (10 km × 10 km) for 63 cities in Pakistan (Supplemenatry Table S1), which represent a variety of different land-use types and atmospheric conditions. A total of 9 generic aerosol classes (Table 4) were introduced using the descriptive statistics (N = 180297, Q1 = 0.17, and Q3 = 0.56) of the extracted AOD550 retrievals and fixed AE470–660 ranges (<0.5, 0.5–1.0, and >1.0). The present study does not use aerosol types such as DD, BB, CC, and CM referring to their source. Instead, AEROSA defines new names of generic aerosol classes based on the definition of AOD and AE only. AEROSA was also implemented using AERONET AOD and AE and all available data were classified. Note that when using GA methods, which provide 4 aerosol types based on ground-based AOD and AE measurements, most of the data remain unclassified.
6) In this study, the same ranges of AOD and AE cannot be used as used by GA methods (Table 2) to define AEROSA generic classes because 1) the ranges of AOD and AE used in GA methods are defined for a specific region, which may not apply to aerosol types in other regions and thus introduce error and inaccurate classification of aerosol types, 2) 41%–56% of the data remain unclassified by GA methods (Patel et al., 2017a; Patel et al., 2017b; Kumar et al., 2018), and 3) GA methods can be used to classify only 4 aerosol types, whereas, for AEROSA, 9 generic aerosol classes are defined. The novel AEROSA approach uses first (Q1) and third quartile (Q3) values of AOD to define thresholds thresholds for low, moderate, and high aerosol amounts and fixed AE ranges to define coarse (<0.5), mixed (0.5–1.0), and fine (>1.0) mode aerosols based on SEA studies. Results from the application of the AEROSA generic aerosol classification to MODIS DTB AOD data extracted for 63 cities in Pakistan, using the descriptive statistics (Q1 = 0.17 and Q3 = 0.56), are graphically presented in Figure 1. The fixed AE ranges used in Table 4 and Figure 1 are supported by previous studies (Kaufman et al., 1994; Eck et al., 1999; Reid et al., 1999; Giles et al., 2012). AEROSA can be implemented for any region using both spatially distributed satellite-retrieved AOD data and ground-based Sunphotometer measurements to define AOD thresholds (Q1 and Q3) based on the descriptive statistics. As this study hypothesizes that AOD and AE alone cannot always precisely characterize BB, DD, CC, and CM aerosol types and their sources, new names were introduced as given in Table 4, to recognize generic aerosol classes using the ranges of AOD and AE, which characterize them.
7) AEROSA generic classes using MODIS data were evaluated against the generic classification using AERONET data and AEROSA performance was reported using Pearson’s correlation coefficient (r). The results from GA (Table 2) and AEROSA (Table 4) applications to two extreme events, i.e., a dust storm in spring (20th March 2012) and a smog event in autumn (2nd November 2017), were evaluated. In addition, the GA (Table 2) and AEROSA approaches (Table 4) were compared using both AERONET and MODIS AOD and AE retrievals.
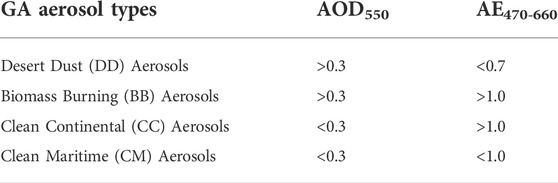
TABLE 3. The GA aerosol types used for evaluation against CALIOP aerosol subtypes and MODIS true-color composites.
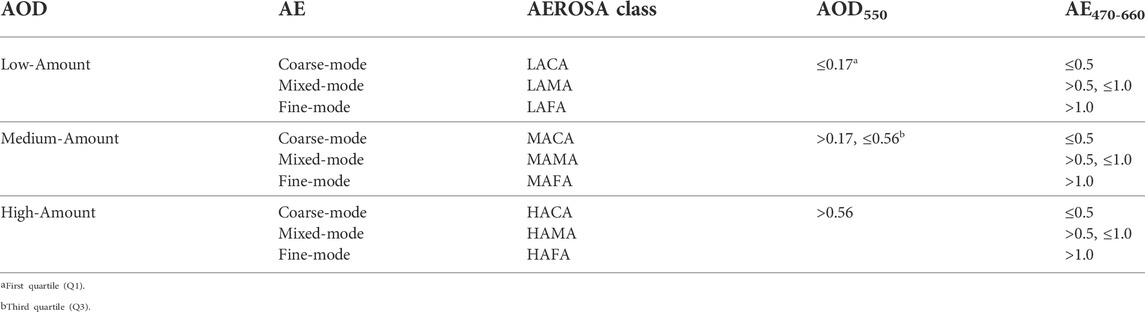
TABLE 4. AEROSA generic classes using MODIS DTB AOD and AE retrievals.
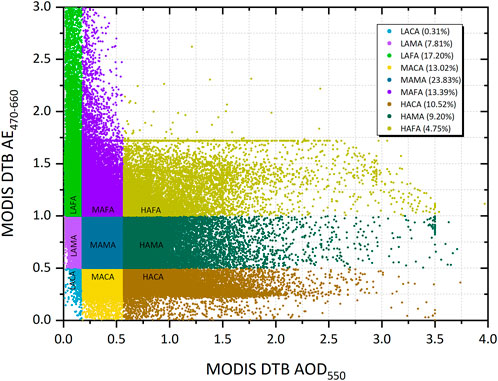
FIGURE 1. AEROSA generic classes using spatially distributed coincident Terra-MODIS DTB AOD550 and AE470-660 retrievals (N = 180297) from March 2000 to February 2018. Where LACA: low-amount coarse-mode aerosols, LAMA: low-amount mixed-mode aerosols, LAFA: low-amount fine-mode aerosols; MACA: medium-amount coarse-mode aerosols, MAMA: medium-amount mixed-mode aerosols, MAFA: medium-amount fine-mode aerosols; and HCCA: high-amount coarse-mode aerosols, HAMA: high-amount mixed-mode aerosols, HAFA: high-amount fine-mode aerosols (see Table 4).
4 Results
4.1 Verification of general approach aerosol types
Data suitable for the validation of the aerosol types classified by application of GA methods using Sunphotometer AOD and AE are not available. Therefore, CALIOP standard daytime aerosol subtype images over the Lahore and Karachi AERONET sites were used for comparison, as recommended by previous studies (Rupakheti et al., 2019; Ali et al., 2020). To this end, CALIOP aerosol subtype profiles were collected over the AERONET sites for overpasses within ±30 min of the AERONET AOD and AE observations. This resulted in only 8 collocated images (Supplemenatry Figure S1). The collocated CALIOP data show that the aerosol subtypes at the Lahore and Karachi AERONET sites were dominated by Dust, Polluted Dust, and Dusty Marine aerosol (Supplemenatry Figure S1), whereas the GA aerosol types using the collocated AERONET AOD and AE data show BB, CM, and CC aerosol types (Table 5). This discrepancy supports the hypothesis that the GA classification using only AOD and AE does not provide the same aerosol types as the independent classification using CALIOP data. This will be further investigated using data from events for which the aerosol type is known.
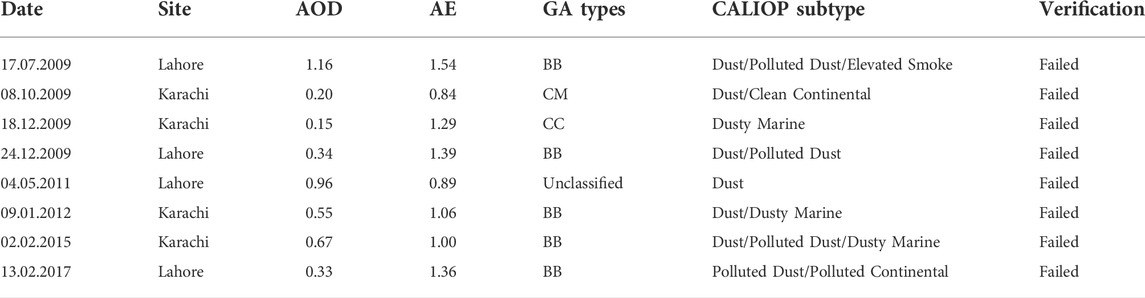
TABLE 5. Verification of GA aerosol types against CALIOP aerosol subtypes over the Lahore (31.48° N, 74.264° E) and Karachi (24.946° N, 67.136° E) AERONET sites located in Pakistan.
The GA classification of the BB, DD, CC, and CM aerosol types was further examined using AOD and AE data from the Lahore AERONET site. Figure 2 shows MODIS true-colour composite images overlaid with MODIS thermal/fire anomaly data, for 16 different days, over areas including the Lahore AERONET site. The images in Figure 2 suggest the occurrence of haze or biomass burning over the area, i.e., events with known aerosol types, as summarized in Table 6, where also results from GA aerosol types classification using AOD and AE (Table 3) from the Lahore AERONET site are presented. In particular, the images during the overpasses on 2006-12-30 and 2010-08-10 suggest the occurrence of a thin layer of haze over the Lahore AERONET site, in the vicinity of clouds, and on 2007-11-12 and 2010-10-19 a thick layer of haze. For each of these cases, the GA classification using AERONET data resulted in the aerosol type as BB, although crop residue (biomass) burning or forest fires, the source of BB aerosols (Dubovik et al., 2002), was not identified in the MODIS fire data. Similarly, aerosols during the crop residue burning events on 2009-05-24 and 2010-04-16, and a very thin layer of haze on 2010-09-19 and 2014-07-11 were instead classified as DD aerosol types. The crop residue burning produces both fine and mixed-mode aerosols (Le Blond et al., 2017) which were classified as DD because AOD and AE only provide specific information about aerosol properties integrated over the whole atmospheric column. For the classification of aerosols into distinct aerosol types and to characterize their properties, multiple physical and optical properties are required. Similarly, a thin layer of haze and aerosol particles produced by crop residue burning were classified as CC (row 3) and CM (row 4). CM particles are produced by the interaction between the wind and the ocean surface (Dubovik et al., 2002), but the Lahore AERONET site is approximately 1,200 km from the ocean and it is unlikely that coarse mode particles are transported over such long distances. This can also be seen in Figure 2 (row 4) which clearly shows the presence of haze or crop residue burning aerosol which by GA methods are classified as CM. The 16 images presented in Figure 2 were selected from the more than 400 images we have analyzed, as examples to illustrate the hypothesis, based on AERONET AOD and AE values (Table 6). For example, we analyzed 103 cases from 2007 to 2014 where the GA method classified the aerosol type as BB, based on AOD and AE values given in Table 3, but for only 10 (9.7%) of these cases (103), aerosol particles due to crop residue burning were present in the region. The remainder represented haze (thin or thick layers) and clouds, and even those containing dust particles were classified as BB aerosols. These results support the hypothesis of this study and demonstrate that the aerosol type is often incorrectly classified by GA methods using AOD and AE only.
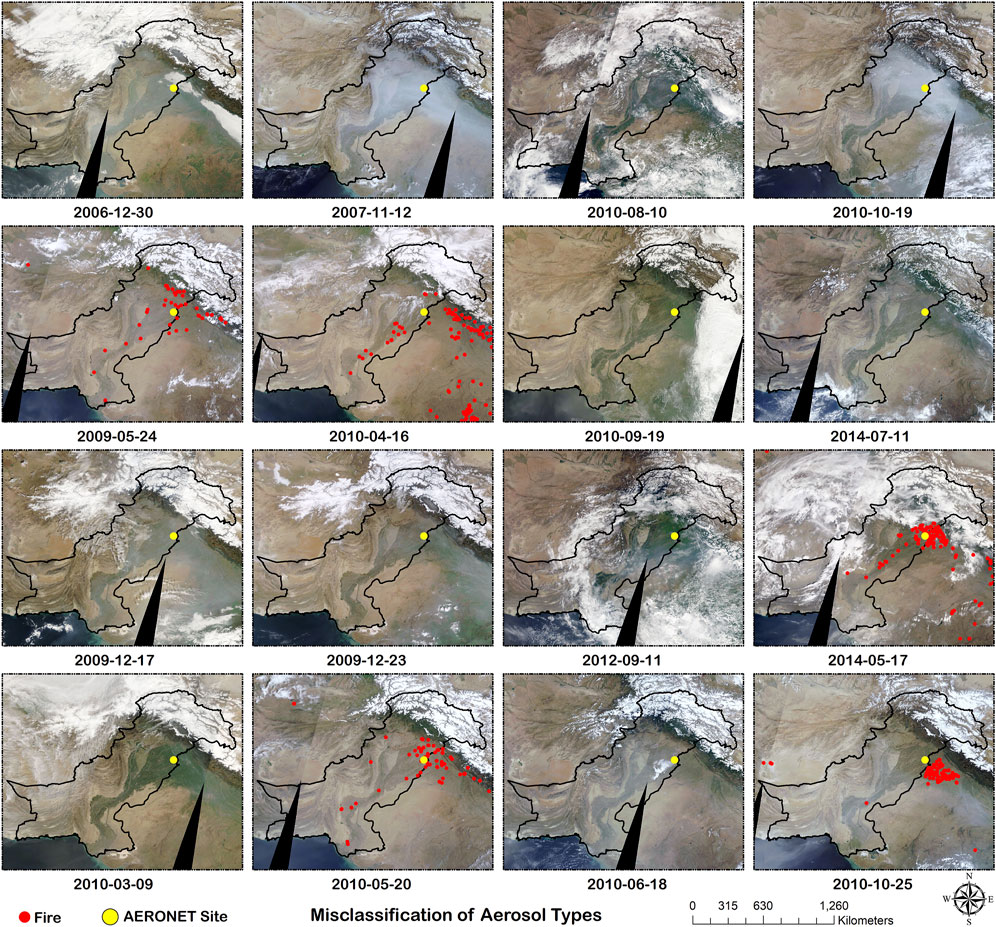
FIGURE 2. MODIS true-color composite images with MODIS thermal/fire anomaly data overlaid (red dots). The Lahore AERONET site is indicated with a yellow dot. Rows 1,2,3, and 4 are examples of incorrect classifications of BB, DD, CC, and CM aerosol types, during known aerosol conditions.
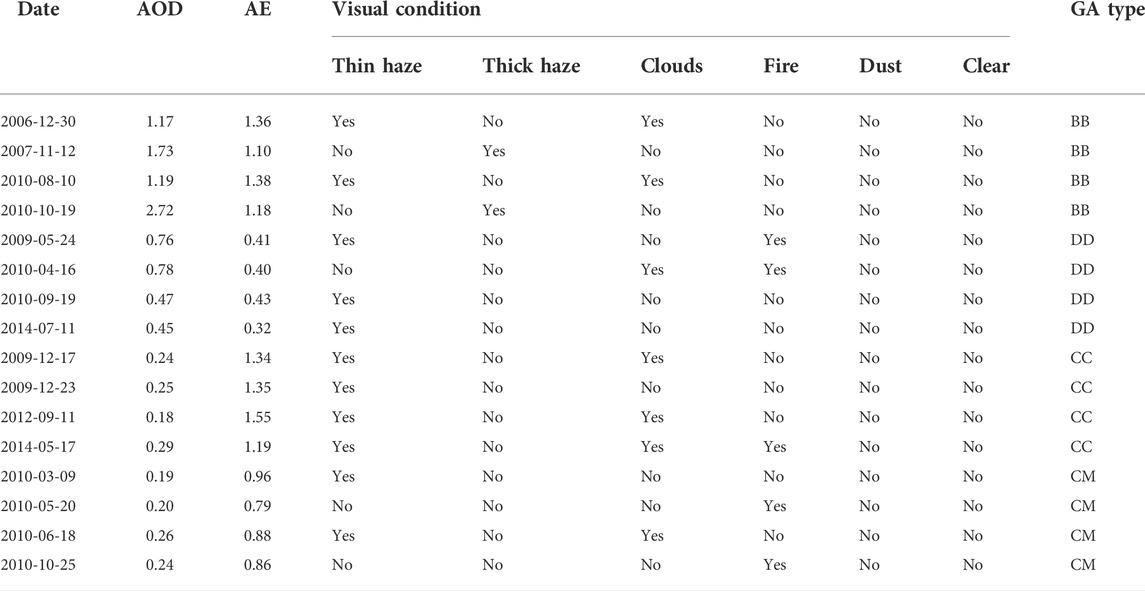
TABLE 6. Evaluation of GA aerosol types using AERONET AOD and AE for specific events governed by known aerosol types; for all events, the GA classification did not assign the expected aerosol types.
4.2 Comparison of AEROSA aerosol generic classification using MODIS and AERONET aerosol optical depth and angström exponent
To verify the robustness and accuracy of AEROSA for the generic aerosol classes, AEROSA was implemented with both MODIS and AERONET data and the results were compared. For this purpose, Lahore and Karachi AERONET AOD550 and AE440-675 measurements were obtained from 2007 to 2014, and collocated MODIS DTB AOD550 and AE470-660 retrievals over these two AERONET sites were extracted. The results in Table 7 show that the generic classes determined by the application of AEROSA to MODIS and AERONET data provide similar percentages for each class, with a Pearsons correlation coefficient (r) of 0.92. The differences between generic aerosol classes determined from MODIS and AERONET data, especially in LAFA, MAMA, and HAMA, are related to uncertainties in both MODIS AOD and AE. Overall, these results suggest that the AEROSA performance is similar for the use of either MODIS or AERONET data, and can be implemented using satellite data to define generic aerosol classes over regions where no AERONET stations are available.
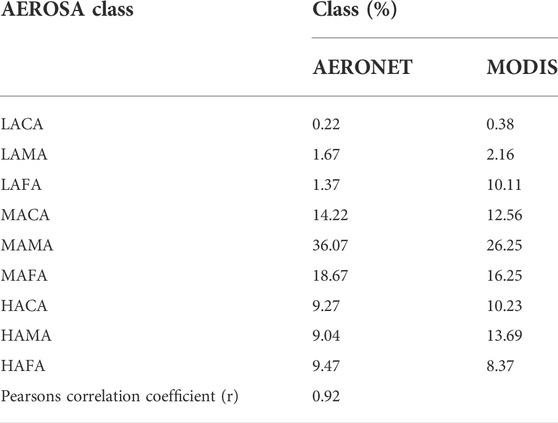
TABLE 7. Comparison of the AEROSA generic classes using MODIS and AERONET AOD and AE.
To further verify the robustness and performance of AEROSA, the method was applied to a data set from AERONET sites located in the Solar Village and on the KAUST campus, Saudi Arabia. The aerosol optical characteristics including AOD and AE vary from region to region and in Saudi Arabia, they are entirely different from those observed in Pakistan. Therefore, the thresholds of AOD defined by AEROSA need to be adjusted for each region, as described in Section 3. For Saudi Arabia, AOD thresholds (Q1 = 0.20 and Q3 = 0.44) were determined using descriptive statistics of the AERONET data obtained from 1999 to 2018. The results in Table 8 show the large percentage of coarse-mode aerosol types (LACA, MACA, and HACA: 49.92%) over the region, followed by mixed-mode (LAMA, MAMA, and HAMA: 39.26%) and fine-mode (LAFA, MAFA, and HAFA: 10.82%) aerosol types. The large percentage of coarse- and mixed-mode aerosols in Saudi Arabia was also reported by previous work (Lee et al., 2010; Ali et al., 2020; Logothetis et al., 2020) which supports the AEROSA results for Saudi Arabia. These results demonstrate the application of AEROSA over another region than Pakistan and show the different percentages of generic aerosol classes due to different atmospheric conditions and aerosol sources.
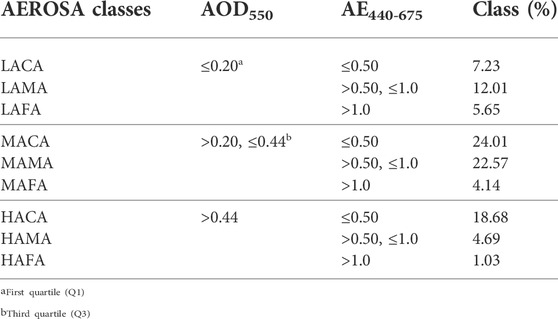
TABLE 8. The percentage of AEROSA generic classes in Saudi Arabia using AERONET data from 1999 to 2020. The thresholds used for the AEROSA approach over Saudi Arabia are presented in the second and third columns.
4.3 Evaluation during extreme pollution events
To demonstrate the hypothesis that “GA methods based on only AOD and AE often incorrectly and unambiguously characterize the nature/properties of aerosol types (e.g., dust, bio-mass, industrial, continental or maritime),” two extreme pollution events over Pakistan; namely, a dust storm (20th March 2012), and a smog event (2nd November 2017) were used. For comparison and evaluation, also the AEROSA approach was applied to these same data sets.
4.3.1 Evaluation during an extreme dust storm event (20th March 2012)
To demonstrate that GA methods do not always accurately classify CC, CM, BB/UI, and DD aerosol types, AEROSA was applied to a dust storm over Pakistan and neighboring countries on 20th March 2012, and the results were compared with those resulting from the application of GA aerosol type classification methods published by Bibi et al. (2016), Kaskaoutis et al. (2009), Pathak et al. (2012), and Patel et al. (2017b). Figure 3A shows a MODIS true-color composite of an extreme dust storm over Pakistan and neighboring countries, and the spatial distribution of the generic aerosol classes by AEROSA is shown in Figure 3B. Results from earlier GA methods (Table 2) mentioned above are reproduced in Figures 3C–F. In Figure 3, some areas are indicated by circles and ellipses where the GA classification results were not matched with the visualization of the true-color composite image (Figure 3A), and/or no classification was achieved. Figure 3B shows that the AEROSA approach provided generic aerosol classes for all cloud-free areas. For example, the black ellipse in the MODIS true-color composite (Figure 3A) indicates dust aerosols and fire spots due to biomass burning, suggesting the presence of mixed-mode aerosols inside the circle. However, none of the 4 GA methods (Figures 3C–F) identifies a mixture of dust and biomass-burning aerosols. Similarly, dust aerosols over the desert and arid land (red circle) and mixed aerosols (yellow circle) were erratically classified by the GA methods as CM by Kaskaoutis et al. (2009) and Patel et al. (2017b), CC and CM by Pathak et al. (2012), and BB/UI by Bibi et al. (2016). These studies do not consider AOD and AE ranges for medium-amount mixed-mode aerosols (violet circles), therefore no classification was achieved. On the other hand, AEROSA was able to classify mixed-mode aerosols (black ellipse) as HAMA, representing mixed-aerosols with higher AOD; aerosols over the desert and arid land were classified as LACA and MACA, and mixed aerosols (yellow circle) were classified as LAMA, LAFA, MAMA, and MAFA. These results demonstrate that AOD and AE alone are able to characterize generic aerosol classes. However, these optical properties (AOD and AE) cannot characterize the nature of aerosol types such as BB, DD, CC, and CM. These results also confirm that, in specific cases, the classification of aerosol types using GA methods with only AOD and AE does not provide the desired results. However, the application of the AEROSA approach provides generic aerosol classes with good coverage.
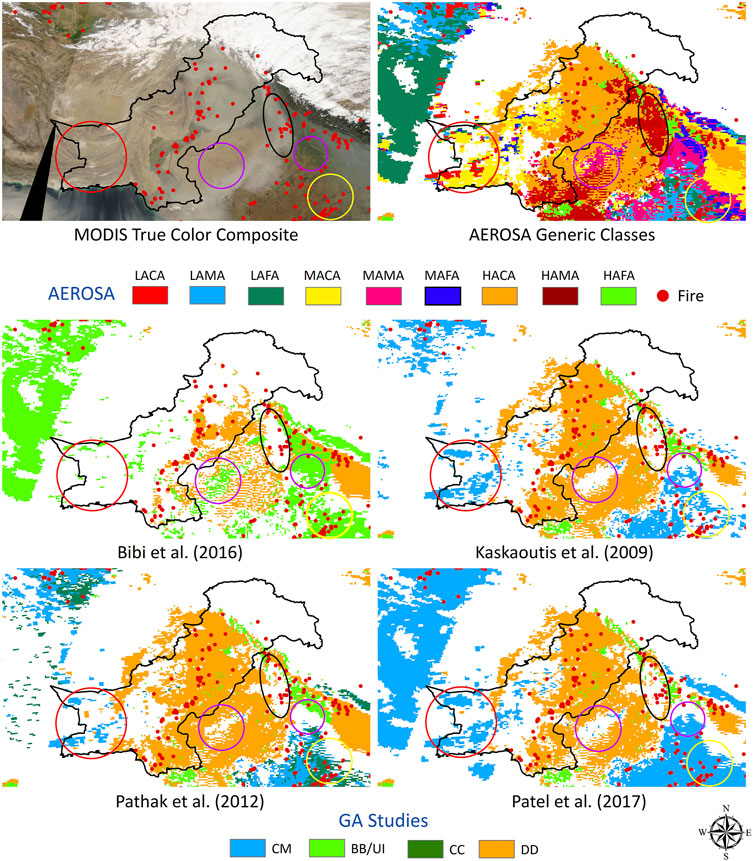
FIGURE 3. A severe dust storm over Pakistan and neighboring countries on 20th Match 2012. (A) True color composite using MODIS data, showing the occurrence of dust and fires (red dots); the white areas indicate clouds; (B) AEROSA generic classes. (C–F) Aerosol types were classified using the GA methods published by Bibi et al. (2016) (C); Kaskaoutis et al. (2009) (D); Pathak et al. (2012) (E); Patel et al. (2017b) (F). Where LACA: low-amount coarse-mode aerosols, LAMA: low-amount mixed-mode aerosols, LAFA: low-amount fine-mode aerosols; MACA: medium-amount coarse-mode aerosols, MAMA: medium-amount mixed-mode aerosols, MAFA: medium-amount fine-mode aerosols; and HACA: high-amount coarse-mode aerosols, HAMA: high-amount mixed-mode aerosols, HAFA: high-amount fine-mode aerosols; CM = clean maritime aerosols; CC = clean continental aerosols; BB/UI: biomass burning/urban-industrial aerosols; and DD: desert dust aerosols.
4.3.2 Evaluation during an extreme smog event (2nd November 2017)
Smog is defined as a mixture of smoke and fog, and fog is defined as tiny water droplets suspended in the lower atmosphere with high concentrations. The smoke in this event was emitted from crop residue burning which is confirmed by fire data (Figure 4) and the fog was confirmed by ground-based weather station data obtained from the University of Wyoming (http://weather.uwyo.edu/cgi-bin/wyowx.fcgi?TYPE=sflist&DATE=20171103&HOUR=05&UNITS=A&STATION=OPLA). Figure 4A shows the MODIS true-color composite over Pakistan and neighboring countries, on 2nd November 2017, when an extreme smog event occurred over the area, accompanied by biomass burning events (black dots). Figure 4B shows the spatial distribution of generic aerosol classes using the AEROSA approach and in Figures 4C–F aerosol types are reproduced which were classified using the GA method with the AOD and AE thresholds for aerosol types reported by Bibi et al. (2016), Kaskaoutis et al. (2009), Pathak et al. (2012), and Patel et al. (2017b) (similar to Figure 3). The violet circle represents smog, with a very thick aerosol layer, and the red dots represent fire spots from crop residue burning. Our hypothesis that the use of AOD and AE is insufficient for characterizing aerosols into 4 distinct types is illustrated by referring to the circles in Figure 4. For example, blue circles show that the GA method classified coarse particles as DD aerosol type; however, no dust particles were present inside the blue circle as can be seen in the MODIS true-color composite; red circles show that aerosols over the sandy deserts were classified as CM or CC aerosols, whereas these sandy deserts are far from the ocean where CM aerosols are produced and it is unlikely that coarse particles are transported over such long distances; black circles show the classification of aerosol particles as CM aerosols over the arid and desert surfaces. For this particular smog event, the violet circle shows that none of GA methods were able to achieve the classification results for the smog which is composed of mixed aerosol particles i.e., all pixels remain un-classified. On the other hand, AEROSA shows complete spatial coverage over cloud-free areas. The results also show that the Bibi et al. (2016) thresholds result in the classification of most of the aerosols in the region as BB/UI, especially over Southern Pakistan as well as over sandy deserts, where dust aerosol types are more likely. Using the thresholds from the other three studies, classification for medium and high amounts of mixed-mode aerosols was not achieved, thus leaving pixels unclassified. On the other hand, AEROSA classified smog and smoke haze (a less thick layer of aerosol) as HAMA (dark-red color) and HAFA (green color), respectively. These results suggest that the smog and smoke haze are composed of mixed and fine mode particles, respectively, and both have extremely high AOD values. Smog was formed when these particles mixed with the fog present over the region. It should be noted that an area of mixed aerosol particles was also present, categorized as MAMA (magenta color), suggesting that crop residue burning produced both fine- and mixed-mode particles, which is supported by a study in South America (Le Blond et al., 2017). The sandy deserts (red circles) generate aerosols composed of mixed particles classified as LAMA, LAFA, and MAMA. It should also be noted that, during this smog event, no dust aerosols were present inside the blue circle, which were as DD by GA methods; however, AEROSA found different generic classes. In fact, these circles represent coarse particles other than dust, as coarse, as well as fine particles, may often originate from crop-residue burning (Le Blond et al., 2017) as well as from other sources. These results suggest that the characterization of aerosol types based on AOD and AE is seasonally variable and that a single set of AOD/AE values cannot characterize the same aerosol type throughout the year. For example, dust aerosol in spring (20th March 2012) and smog in autumn (2nd November 2017) have the same ranges of AOD and AE. The designation as HAMA by AEROSA can accommodate both aerosol types. These results support the hypothesis of this study that GA classification does not always provide a plausible solution for the aerosol type. Aerosol can more confidently be characterized into generic classes using AEROSA, with good spatial coverage. AEROSA is especially useful over regions where AERONET stations are not available to obtain knowledge about aerosol amount and size.
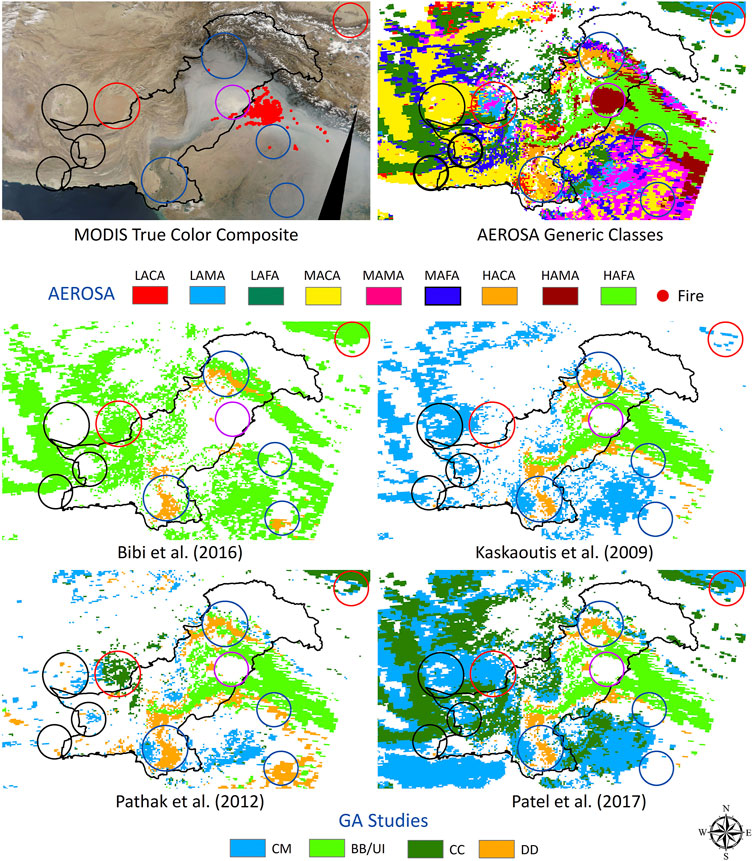
FIGURE 4. Same as Figure 3 but for an extreme smog event on 2nd November 2017.
4.4 Comparison between AEROSA generic aerosol classes and GA aerosol types
To further demonstrate the performance of the AEROSA and GA methods, a comparative analysis was conducted using both MODIS and AERONET data over Pakistan (Table 9). For this purpose, GA methods such as those presented by Pathak et al. (2012), Yu et al. (2016), Kaskaoutis et al. (2009), Kalapureddy et al. (2009), Patel et al. (2017b), Kumar et al. (2018), and Bibi et al. (2016) were considered. For a simple understanding of the comparative analysis, AEROSA generic classes were merged to match with the aerosol types by GA methods (Table 9). The results show a similar percentage of aerosol types by GA methods, to those generic classes defined by AEROSA, as regards the AOD and AE ranges. AEROSA was able to classify all available MODIS and AERONET data, whereas the application of the GA methods left 30–91% of the data and image pixels unclassified. These results demonstrate the greater coverage and advantages of AEROSA compared to GA methods.
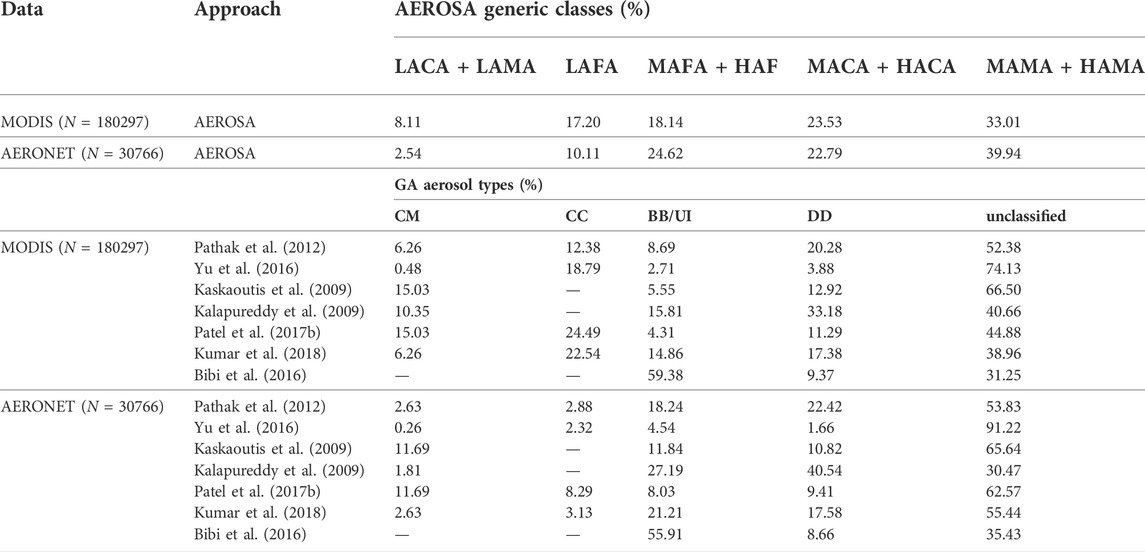
TABLE 9. Comparison between the aerosol classification results using the AEROSA and GA methods over Pakistan using MODIS data from March 2000 to February 2018 and AERONET data from 2007 to 2014.
5 Discussion and conclusion
General approach (GA) methods use AOD and AE obtained from ground-based Sunphotometer measurements (AERONET) to characterize aerosol types such as DD, BB/UI, CC, and CM aerosol, with thresholds for each aerosol type which vary between different locations. In this study, aerosol types were classified using GA methods with AERONET AOD and AE measurements, and the results were compared with CALIOP aerosol subtypes images and Terra-MODIS true-color composite images. Aerosol types were also spatially classified using the GA method with MODIS AOD and AE data, during an extreme dust storm event in spring (20th March 2012) and a smog event in autumn (2nd November 2017). Evaluation of the GA classification results shows that a thin haze layer was classified as BB, DD, CC, and CM, and crop residue burning aerosols were classified as DD, CC, and CM, i.e., types which do not accurately describe the aerosol during the occurrence of haze or crop residue burning. The results also suggest that a single set of parameter ranges for AOD and AE may correspond to different aerosol types depending on the time of year. For example, dust aerosols in spring (20th March 2012) and smog in autumn (2nd November 2017) have the same ranges of AOD and AE. Therefore, additional seasonal information would be required to know the exact nature of the aerosol types. The results also show that a single aerosol type is characterized by multiple ranges of AOD and AE, which is not included in the GA method. For example, dust can be composed of mixed as well as coarse-mode aerosols and can exist at low as well as high concentrations.
The results from these studies indicate the following disadvantages of GA methods based on AOD and AE alone: 1) the values of AE and AOD used in GA methods cannot precisely and unambiguously classify aerosol types, 2) for application of GA methods, AOD and AE ranges for aerosol classification vary for different regions, 3) GA methods are limited to point locations and cannot provide spatial distributions of aerosol types, 4) if values of AOD and AE obtained from point measurements for a specific location and season are used for another location and season, the inferred aerosol type may be inaccurate, 5) GA methods do not provide a solution for the classification of all available data, and much of the data remain “unclassified”, 6) GA methods are unable to identify and distinguish between mixed-mode dust and smog aerosols, and 7) GA methods classify dust aerosols as CM and coarse-mode aerosols originating during biomass burning activities in autumn, as DD aerosols. These incorrect classifications may overlook the implications of extreme pollution events such as dust storms and biomass burning activities. For example, dust storms can bring harmful pollution as well as dust, which may affect human health and regional air quality. Furthermore, the incorrect classification of aerosol types can introduce significant errors in the calculation of aerosol radiative forcing, aerosol modeling, the Earth’s radiation budget, and the understanding of aerosol effects on climate, cloud microphysical properties, and the hydrological cycle.
Therefore, an alternative approach is proposed which provides an aerosol classification into 9 generic classes based on AOD and AE. This approach, called AEROSA (AEROsol classification using a novel Satellite remote sensing Approach) only provides information on the amount of aerosol and the size range, using AOD and AE respectively as proxies. The application of AEROSA to AOD and AE data from both AERONET and MODIS provides a solution for all cases for which successful retrieval results (AOD, AE) are available, with an accuracy depending on the uncertainties in the AOD and AE. The AEROSA approach has the following advantages: 1) this approach does not depend on ground-based Sunphotometer measurements, 2) can be used to define generic aerosol classes for any region based on the descriptive statistics of AOD, 3) can identify spatiotemporal variations in generic aerosol classes, 4) classifies all available data and no data remain “unclassified”, 5) this approach can be implemented with either satellite or ground-based Sunphotometer data, or both, and 6) can be implemented using available satellite aerosol data including aerosol products from geostationary satellites such as GOCI (the Geostationary Ocean Color Imager) (Choi et al., 2018) and Himawari-8 AHI (Advanced Himawari Imager) (Lim et al., 2021). Also, AEROSA can be used to define generic aerosol classes using regionally distributed daily satellite data and can provide generic classes that are representative of true aerosol conditions over a region. For more specific and distinct aerosol types, additional data such as multiple optical and physical properties from AERONET or UV satellite sensors would be required as AOD and AE alone are not useful in this regard, as concluded from this study. In the future, the authors will implement AEROSA with Himari-8 AHI and VIIRS AOD and AE retrievals to study the AEROSA–based generic aerosol classes at regional to global scales.
Data availability statement
The original contributions presented in the study are included in the article/Supplementary Material, further inquiries can be directed to the corresponding author.
Author contributions
Conceptualization: MB; Methodology: MB, and MAA; Software: MB; Validation: MB, and MAA; Formal analysis: MB and MA; Investigation: MB, MA, and MB; Resources: MB and ZQ; Data curation: MB, and MA; Writing—original draft preparation: MB; Writing—review and editing: MB, MA JN, MB, GL, AM, YS, TM, and JK; Visualization: MB, MA, UM, TM, and MN; Supervision: MB; Project administration: MB; Funding acquisition: MB and ZQ. All authors have read and agreed to the published version of the manuscript.
Funding
This work was supported by the National Key Research and Development Program of China (2016YFC1400901), the scientific research projects of China Three Gorges Corporation (202003111), the Special Project of Jiangsu Distinguished Professor (R2018T22), and the Startup Foundation for Introduction Talent of NUIST (2017r107). AM acknowledges Foreign Young Talent Program (No. QN20211014016L) and Jiangsu Funding Program for Excellent Postdoctoral Talent (2022ZB410). Additional support came from the New Mexico State University College of Agriculture Consumer and Environmental Sciences’ Agricultural Experiment Station.
Acknowledgments
The authors would like to acknowledge NASA’s Level-1 and Atmosphere Archive and Distribution System (LAADS) Distributed Active Archive Center (DAAC) (https://ladsweb.modaps.eosdis.nasa.gov/) for MODIS data and Principal Investigators of Lahore AERONET site. The authors are thankful to Dr. Devin White (Oak Ridge National Laboratory) for MODIS Conversion Tool Kit (MCTK).
Conflict of interest
MN was employed by Urban Sector Policy and Management Services Unit (Pvt.) Limited
The remaining authors declare that the research was conducted in the absence of any commercial or financial relationships that could be construed as a potential conflict of interest.
Publisher’s note
All claims expressed in this article are solely those of the authors and do not necessarily represent those of their affiliated organizations, or those of the publisher, the editors and the reviewers. Any product that may be evaluated in this article, or claim that may be made by its manufacturer, is not guaranteed or endorsed by the publisher.
Supplementary material
The Supplementary Material for this article can be found online at: https://www.frontiersin.org/articles/10.3389/fenvs.2022.981522/full#supplementary-material
References
Alam, K., Khan, R., Sorooshian, A., Blaschke, T., Bibi, S., and Bibi, H. (2018). Analysis of aerosol optical properties due to a haze episode in the himalayan foothills: Implications for climate forcing. Aerosol Air Qual. Res. 18, 1331–1350. doi:10.4209/aaqr.2017.06.0222
Ali, M. A., Nichol, J. E., Bilal, M., Qiu, Z., Mazhar, U., Wahiduzzaman, M., et al. (2020). Classification of aerosols over Saudi Arabia from 2004–2016. Atmos. Environ. 241, 117785. doi:10.1016/j.atmosenv.2020.117785
Artaxo, P., Storms, H., Bruynseels, F., Grieken, R. V., and Maenhaut, W. (1998). Composition and sources of aerosols from the amazon basin. J. Geophys. Res. 93, 1605–1615. doi:10.1029/jd093id02p01605
Barnaba, F., and Gobbi, G. P. (2004). Aerosol seasonal variability over the Mediterranean region and relative impact of maritime, continental and Saharan dust particles over the basin from MODIS data in the year 2001. Atmos. Chem. Phys. 4, 2367–2391. doi:10.5194/acp-4-2367-2004
Bibi, H., Alam, K., and Bibi, S. (2016). In-depth discrimination of aerosol types using multiple clustering techniques over four locations in Indo-Gangetic. Atmos. Res. 181, 106–114. doi:10.1016/j.atmosres.2016.06.017
Bilal, M., and Nichol, J. E. (2015). Evaluation of MODIS aerosol retrieval algorithms over the Beijing-Tianjin-Hebei region during low to very high pollution events. J. Geophys. Res. Atmos. 120, 7941–7957. doi:10.1002/2015jd023082
Bilal, M., Nichol, J. E., and Nazeer, M. (2016). Validation of aqua-MODIS C051 and C006 operational aerosol products using AERONET measurements over Pakistan. IEEE J. Sel. Top. Appl. Earth Obs. Remote Sens. 9, 2074–2080. doi:10.1109/jstars.2015.2481460
Bilal, M., Nichol, J., and Wang, L. (2017). New customized methods for improvement of the MODIS C6 Dark Target and Deep Blue merged aerosol product. Remote Sens. Environ. 197, 115–124. doi:10.1016/j.rse.2017.05.028
Bilal, M., Nazeer, M., Qiu, Z., Ding, X., and Wei, J. (2018a). Global validation of MODIS C6 and C6.1 merged aerosol products over diverse vegetated surfaces. Remote Sens. 10, 475. doi:10.3390/rs10030475
Bilal, M., Qiu, Z., Campbell, J. R., Spak, S., Shen, X., and Nazeer, M. (2018b). A new MODIS C6 dark Target and Deep blue merged aerosol product on a 3 km spatial grid. Remote Sens. 10, 463. doi:10.3390/rs10030463
Burton, S. P., Ferrare, R. A., Vaughan, M. A., Omar, A. H., Rogers, R. R., Hostetler, C. A., et al. (2013). Aerosol classification from airborne HSRL and comparisons with the CALIPSO vertical feature mask. Atmos. Meas. Tech. 6, 1397–1412.
Choi, M., Kim, J., Lee, J., Kim, M., Park, Y.-J., Holben, B., et al. (2018). GOCI yonsei aerosol retrieval version 2 products: An improved algorithm and error analysis with uncertainty estimation from 5-year validation over east asia. Atmos. Meas. Tech. 11, 385–408. doi:10.5194/amt-11-385-2018
d'Almeida, G. A. (1987). On the variability of desert aerosol radiative characteristics. J. Geophys. Res. 92, 3017. doi:10.1029/jd092id03p03017
de Leeuw, G., Andreas, E. L., Anguelova, M. D., Fairall, C. W., Lewis, E. R., O'Dowd, C., et al. (2011). Production flux of sea spray aerosol. Rev. Geophys. 49, RG2001. doi:10.1029/2010rg000349
de Leeuw, G., Holzer-Popp, T., Bevan, S., Davies, W. H., Descloitres, J., Grainger, R. G., et al. (2015). Evaluation of seven European aerosol optical depth retrieval algorithms for climate analysis. Remote Sens. Environ. 162, 295–315. doi:10.1016/j.rse.2013.04.023
de Oliveira, A. M., Cristina, T. S., Nara, P. M. D. O., Aline, K. S. M., Fabio, J. S. L., Eduardo, L., et al. (2019). Analysis of atmospheric aerosol optical properties in the northeast Brazilian atmosphere with remote sensing data from MODIS and CALIOP/CALIPSO satellites, AERONET photometers and a ground-based lidar. Atmosphere 10, 594. doi:10.3390/atmos10100594
Dubovik, O., Holben, B., Eck, T. F., Smirnov, A., Kaufman, Y. J., King, M. D., et al. (2002). Variability of absorption and optical properties of key aerosol types observed in worldwide locations. J. Atmos. Sci. 59, 590–608. doi:10.1175/1520-0469(2002)059<0590:voaaop>2.0.co;2
Eck, T. F., Holben, B. N., Reid, J. S., Dubovik, O., Smirnov, A., O'Neill, N. T., et al. (1999). Wavelength dependence of the optical depth of biomass burning, urban, and desert dust aerosols. J. Geophys. Res. 104, 31333–31349. doi:10.1029/1999jd900923
Eck, T. F., Holben, B. N., Dubovik, O., Smirnov, A., Slutsker, I., Lobert, J. M., et al. (2001a). Column-integrated aerosol optical properties over the Maldives during the northeast monsoon for 1998-2000. J. Geophys. Res. 106, 28555–28566. doi:10.1029/2001jd000786
Eck, T. F., Holben, B. N., Ward, D. E., Dubovik, O., Reid, J. S., Smirnov, A., et al. (2001b). Characterization of the optical properties of biomass burning aerosols in Zambia during the 1997 ZIBBEE field campaign. J. Geophys. Res. 106, 3425–3448. doi:10.1029/2000jd900555
Eck, T. F., Holben, B. N., Ward, D. E., Mukelabai, M. M., Dubovik, O., Smirnov, A., et al. (2003). Variability of biomass burning aerosol optical characteristics in southern Africa during the SAFARI 2000 dry season campaign and a comparison of single scattering albedo estimates from radiometric measurements. J. Geophys. Res. 108. doi:10.1029/2002jd002321
Eck, T. F., Holben, B. N., Dubovik, O., Smirnov, A., Goloub, P., Chen, H. B., et al. (2005). Columnar aerosol optical properties at AERONET sites in central eastern Asia and aerosol transport to the tropical mid-Pacific. J. Geophys. Res. 110. doi:10.1029/2004jd005274
Falah, S., Mhawish, A., Omar, A. H., Sorek-Hamer, M., Lyapustin, A. I., Banerjee, T., et al. (2022). Intercomparison of aerosol types reported as part of aerosol product retrieval over diverse geographic regions. Remote Sens. 14.
Gharibzadeh, M., Alam, K., Abedini, Y., Bidokhti, A. A., Masoumi, A., and Bibi, H. (2018). Characterization of aerosol optical properties using multiple clustering techniques over Zanjan, Iran, during 2010-2013. Appl. Opt. 57, 2881–2889. doi:10.1364/ao.57.002881
Giles, D. M., Holben, B. N., Eck, T. F., Sinyuk, A., Smirnov, A., Slutsker, I., et al. (2012). An analysis of AERONET aerosol absorption properties and classifications representative of aerosol source regions. J. Geophys. Res. 117, 1–16. doi:10.1029/2012jd018127
Giles, D. M., Sinyuk, A., Sorokin, M. G., Schafer, J. S., Smirnov, A., Slutsker, I., et al. (2019). Advancements in the Aerosol Robotic Network (AERONET) Version 3 database – automated near-real-time quality control algorithm with improved cloud screening for Sun photometer aerosol optical depth (AOD) measurements. Atmos. Meas. Tech. 12, 169–209. doi:10.5194/amt-12-169-2019
Higurashi, A., and Nakajima, T. (1999). Development of a two-channel aerosol retrieval algorithm on a global scale using NOAA AVHRR. J. Atmos. Sci. 56, 924–941. doi:10.1175/1520-0469(1999)056<0924:doatca>2.0.co;2
Higurashi, A., and Nakajima, T. (2002). Detection of aerosol types over the East China Sea near Japan from four-channel satellite data. Geophys. Res. Lett. 29, 17-1–17-4174. doi:10.1029/2002gl015357
Holben, B. N., Eck, T. F., Slutsker, I., Tanré, D., Buis, J. P., Setzer, A., et al. (1998). AERONET—a federated instrument network and data archive for aerosol characterization. Remote Sens. Environ. 66, 1–16. doi:10.1016/s0034-4257(98)00031-5
Holben, N., Tanr, D., Smirnov, A., Eck, T. F., Slutsker, I., Newcomb, W. W., et al. (2001). An emerging ground-based aerosol climatology : Aerosol optical depth from AERONET. J. Geophys. Res. 106, 12067–12097. doi:10.1029/2001jd900014
Hoppel, W. A., Fitzgerald, J. W., Frick, G. M., Larson, R. E., and Mack, E. J. (1990). Aerosol size distributions and optical properties found in the marine boundary layer over the Atlantic Ocean. J. Geophys. Res. 95, 3659. doi:10.1029/jd095id04p03659
Hsu, N. C., Jeong, M.-J., Bettenhausen, C., Sayer, A. M., Hansell, R., Seftor, C. S., et al. (2013). Enhanced Deep Blue aerosol retrieval algorithm: The second generation. J. Geophys. Res. Atmos. 118, 9296–9315. doi:10.1002/jgrd.50712
Kalapureddy, M. C. R., Kaskaoutis, D. G., Ernest Raj, P., Devara, P. C. S., Kambezidis, H. D., Kosmopoulos, P. G., et al. (2009). Identification of aerosol type over the arabian sea in the premonsoon season during the integrated campaign for aerosols, gases and radiation budget (ICARB). J. Geophys. Res. 114, D17203. doi:10.1029/2009jd011826
Kaskaoutis, D. G., Kambezidis, H. D., Hatzianastassiou, N., Kosmopoulos, P. G., and Badarinath, K. V. S. (2007). Aerosol climatology: on the discrimination of aerosol types over four AERONET sites. Atmos. Chem. Phys. Discuss. 7, 6357–6411.
Kaskaoutis, D. G., Badarinath, K. V. S., Kharol, S. K., Sharma, A. R., and Kambezidis, H. D. (2009). Variations in the aerosol optical properties and types over the tropical urban site of Hyderabad, India. J. Geophys. Res. 114, 222044–D32196. doi:10.1029/2009jd012423
Kaufman, Y. J., and Sendra, C. (1988). Algorithm for automatic atmospheric corrections to visible and near-IR satellite imagery. Int. J. Remote Sens. 9, 1357–1381. doi:10.1080/01431168808954942
Kaufman, Y. J., Gitelson, A., Karnieli, A., Ganor, E., Fraser, R. S., Nakajima, T., et al. (1994). Size distribution and scattering phase function of aerosol particles retrieved from sky brightness measurements. J. Geophys. Res. 99, 10341. doi:10.1029/94jd00229
Kavouras, I. G., Nikolaos, M., and Euripides, G. S. (1998). Formation of atmospheric particles from organic acids produced by forests. Nature 395, 683–686. doi:10.1038/27179
Keil, A., and Haywood, J. M. (2003). Solar radiative forcing by biomass burning aerosol particles during SAFARI 2000: A case study based on measured aerosol and cloud properties. J. Geophys. Res. 108. doi:10.1029/2002jd002315
Kim, J., Lee, J., Lee, H. C., Higurashi, A., Takemura, T., and Song, C. H. (2007). Consistency of the aerosol type classification from satellite remote sensing during the Atmospheric Brown Cloud–East Asia Regional Experiment campaign. J. Geophys. Res. 112, D22S33. doi:10.1029/2006jd008201
Kim, M. H., Omar, A. H., Tackett, J. L., Vaughan, M. A., Winker, D. M., Trepte, C. R., et al. (2018). The CALIPSO version 4 automated aerosol classification and lidar ratio selection algorithm. Atmos. Meas. Tech. 11, 6107–6135. doi:10.5194/amt-11-6107-2018
Kubilay, N., Cokacar, T., and Oguz, T. (2003). Optical properties of mineral dust outbreaks over the northeastern Mediterranean. J. Geophys. Res. 108. doi:10.1029/2003jd003798
Kumar, K. R., Yin, Y., Sivakumar, V., Kang, N., Yu, X., Diao, Y., et al. (2015). Aerosol climatology and discrimination of aerosol types retrieved from MODIS, MISR and OMI over Durban (29.88°S, 31.02°E), South Africa. Atmos. Environ. 117, 9–18. doi:10.1016/j.atmosenv.2015.06.058
Kumar, K. R., Kang, N., and Yin, Y. (2018). Classification of key aerosol types and their frequency distributions based on satellite remote sensing data at an industrially polluted city in the Yangtze River Delta, China. Int. J. Climatol. 38, 320–336. doi:10.1002/joc.5178
Le Blond, J. S., Woskie, S., Horwell, C. J., and Williamso, B. J. (2017). Particulate matter produced during commercial sugarcane harvesting and processing: A respiratory health hazard? Atmos. Environ. 149, 34–46. doi:10.1016/j.atmosenv.2016.11.012
Lee, J., Kim, J., Song, C. H., Kim, S. B., Chun, Y., Sohn, B. J., et al. (2010). Characteristics of aerosol types from AERONET sunphotometer measurements. Atmos. Environ. 44, 3110–3117. doi:10.1016/j.atmosenv.2010.05.035
Levy, R. C., Mattoo, S., Munchak, L. A., Remer, L. A., Sayer, A. M., Patadia, F., et al. (2013). The Collection 6 MODIS aerosol products over land and ocean. Atmos. Meas. Tech. 6, 2989–3034. doi:10.5194/amt-6-2989-2013
Levy, R. C., Munchak, L. A., Mattoo, S., Patadia, F., Remer, L. A., and Holz, R. E. (2015). Towards a long-term global aerosol optical depth record: Applying a consistent aerosol retrieval algorithm to MODIS and VIIRS-observed reflectance. Atmos. Meas. Tech. 8, 4083–4110. doi:10.5194/amt-8-4083-2015
Li, S., Xiang-Ao, X., Pu-Cai, W., Hong-Bin, C., Goloub, P., and Wen-Xing, Z. (2013). Identification of aerosol types and their optical properties in the North China plain based on long-term AERONET data. Atmos. Ocean. Sci. Lett. 6, 216–222. doi:10.3878/j.issn.1674-2834.13.0028
Lim, H., Go, S., Kim, J., Choi, M., Lee, S., Song, C.-K., et al. (2021). Integration of GOCI and AHI Yonsei aerosol optical depth products during the 2016 KORUS-AQ and 2018 EMeRGe campaigns. Atmos. Meas. Tech. 14, 4575–4592. doi:10.5194/amt-14-4575-2021
Logothetis, S.-A., Salamalikis, V., and Kazantzidis, A. (2020). Aerosol classification in europe, Middle East, North africa and arabian peninsula based on AERONET version 3. Atmos. Res. 239, 104893. doi:10.1016/j.atmosres.2020.104893
Masmoudi, M., Chaabane, M., Tanré, D., Gouloup, P., Blarel, L., and Elleuch, F. (2003). Spatial and temporal variability of aerosol: size distribution and optical properties. Atmos. Res. 66, 1–19. doi:10.1016/s0169-8095(02)00174-6
Mielonen, T., Arola, A., Komppula, M., Kukkonen, J., Koskinen, J., De Leeuw, G., et al. (2009). Comparison of CALIOP level 2 aerosol subtypes to aerosol types derived from AERONET inversion data. Geophys. Res. Lett., 36.
Nakajima, T., and Higurashi, A. (1998). A use of two-channel radiances for an aerosol characterization from space. Geophys. Res. Lett. 25, 3815–3818. doi:10.1029/98gl02151
Omar, A. H., Won, J.-G., Winker, D. M., Yoon, S.-C., Dubovik, O., and Mccormick, M. P. (2005). Development of global aerosol models using cluster analysis of Aerosol Robotic Network (AERONET) measurements. J. Geophys. Res. 110, D10S14. doi:10.1029/2004jd004874
Omar, A. H., Winker, D. M., Kittaka, C., Vaughan, M. A., Liu, Z., Hu, Y., et al. (2009). The CALIPSO automated aerosol classification and lidar ratio selection algorithm. J. Atmos. Ocean. Technol. 26, 1994–2014. doi:10.1175/2009jtecha1231.1
Patel, P. N., Dumka, U. C., Babu, K. N., and Mathur, A. K. (2017a). Aerosol characterization and radiative properties over Kavaratti, a remote island in southern Arabian Sea from the period of observations. Sci. Total Environ. 599–600, 165–180. doi:10.1016/j.scitotenv.2017.04.168
Patel, P. N., Dumka, U. C., Kaskaoutis, D. G., Babu, K. N., and Mathur, A. K. (2017b). Optical and radiative properties of aerosols over Desalpar, a remote site in western India: Source identification, modification processes and aerosol type discrimination. Sci. Total Environ. 575, 612–627. doi:10.1016/j.scitotenv.2016.09.023
Pathak, B., Bhuyan, P. K., Gogoi, M., and Bhuyan, K. (2012). Seasonal heterogeneity in aerosol types over Dibrugarh-North-Eastern India. Atmos. Environ. 47, 307–315. doi:10.1016/j.atmosenv.2011.10.061
Qiu, Z., Ali, M. A., Nichol, J. E., Bilal, M., Tiwari, P., Habtemicheal, B. A., et al. (2021). Spatiotemporal investigations of multi-sensor air pollution data over Bangladesh during COVID-19 lockdown. Remote Sens. 13, 877. doi:10.3390/rs13050877
Rama, G., Arafath, S. M., Balakrishnaiah, G., Raja, O. R., Siva, K. R., Lingaswamy, A. P., et al. (2015). Columnar-integrated aerosol optical properties and classification of different aerosol types over the semi-arid region, Anantapur, Andhra Pradesh. Sci. Total Environ. 527-528, 507–519. doi:10.1016/j.scitotenv.2015.04.086
Reid, J. S., and Hobbs, P. V. (1998). Physical and optical properties of young smoke from individual biomass fires in Brazil. J. Geophys. Res. 103, 32013–32030. doi:10.1029/98jd00159
Reid, J. S., Eck, T. F., Christopher, S. A., Hobbs, P. V., and Holben, B. (1999). Use of the Ångstrom exponent to estimate the variability of optical and physical properties of aging smoke particles in Brazil. J. Geophys. Res. 104, 27473–27489. doi:10.1029/1999jd900833
Remer, L. A., Kaufman, Y. J., Holben, B. N., Thompson, A. M., and Mcnamara, D. (1998). Biomass burning aerosol size distribution and modeled optical properties. J. Geophys. Res. 103, 31879–31891. doi:10.1029/98jd00271
Rupakheti, D., Kang, S., Rupakheti, M., Cong, Z., Panday, A. K., and Holben, B. N. (2019). Identification of absorbing aerosol types at a site in the northern edge of Indo-Gangetic Plain and a polluted valley in the foothills of the central Himalayas. Atmos. Res. 223, 15–23. doi:10.1016/j.atmosres.2019.03.003
Russell, P. B., Bergstrom, R. W., Shinozuka, Y., Clarke, A. D., Decarlo, P. F., Jimenez, J. L., et al. (2010). Absorption Angstrom Exponent in AERONET and related data as an indicator of aerosol composition. Atmos. Chem. Phys. 10, 1155–1169. doi:10.5194/acp-10-1155-2010
Russell, P. B., Kacenelenbogen, M., Livingston, J. M., Hasekamp, O. P., Burton, S. P., Schuster, G. L., et al. (2014). A multiparameter aerosol classification method and its application to retrievals from spaceborne polarimetry. J. Geophys. Res. Atmos. 119, 9838–9863. doi:10.1002/2013jd021411
Sayer, A. M., Hsu, N. C., Bettenhausen, C., and Jeong, M.-J. (2013). Validation and uncertainty estimates for MODIS Collection 6 “Deep Blue” aerosol data. J. Geophys. Res. Atmos. 118, 7864–7872. doi:10.1002/jgrd.50600
Sayer, A. M., Munchak, L. A., Hsu, N. C., Levy, R. C., Bettenhausen, C., and Jeong, M. J. (2014). MODIS Collection 6 aerosol products: Comparison between Aqua's e‐Deep Blue, Dark Target, and “merged” data sets, and usage recommendations. J. Geophys. Res. Atmos. 119, 13965–13989. doi:10.1002/2014jd022453
Schuster, G. L., Dubovik, O., and Holben, B. N. (2006). Angstrom exponent and bimodal aerosol size distributions. J. Geophys. Res. 111, D07207. doi:10.1029/2005jd006328
Smirnov, A., Holben, B. N., Eck, T. F., Dubovik, O., and Slutsker, I. (2000). Cloud-Screening and quality control algorithms for the AERONET database. Remote Sens. Environ. 73, 337–349. doi:10.1016/s0034-4257(00)00109-7
Smirnov, A., Holben, B. N., Kaufman, Y. J., Dubovik, O., Eck, T. F., Slutsker, I., et al. (2002). Optical properties of atmospheric aerosol in maritime environments. J. Atmos. Sci. 59, 501–523. doi:10.1175/1520-0469(2002)059<0501:opoaai>2.0.co;2
Sreekanth, V. (2014). On the classification and sub-classification of aerosol key types over south central peninsular India: MODIS-OMI algorithm. Sci. Total Environ. 468-469, 1086–1092. doi:10.1016/j.scitotenv.2013.09.038
Tiwari, S., Tiwari, S., Hopke, P. K., Attri, S. D., Soni, V. K., and Singh, A. K. (2016). Variability in optical properties of atmospheric aerosols and their frequency distribution over a mega city "New Delhi, " India. Environ. Sci. Pollut. Res. 23, 8781–8793. doi:10.1007/s11356-016-6060-3
Toledano, C., Cachorro, V. E., Berjon, A., de Frutos, A. M., Sorribas, M., de la Morena, B. A., et al. (2007). Aerosol optical depth and Ångström exponent climatology at El Arenosillo AERONET site (Huelva, Spain). Q. J. R. Meteorol. Soc. 133, 795–807. doi:10.1002/qj.54
Winker, D. M., Vaughan, M. A., Omar, A., Hu, Y., Powell, K. A., Liu, Z., et al. (2009). Overview of the CALIPSO mission and CALIOP data processing algorithms. J. Atmos. Ocean. Technol. 26, 2310–2323. doi:10.1175/2009jtecha1281.1
Xia, X., Che, H., Zhu, J., Chen, H. B., Cong, Z., Deng, X., et al. (2016). Ground-based remote sensing of aerosol climatology in China: Aerosol optical properties, direct radiative effect and its parameterization. Atmos. Environ. 124, 243–251. doi:10.1016/j.atmosenv.2015.05.071
Young, S. A., Vaughan, M. A., Garnier, A., Tackett, J. L., Lambeth, J. D., and Powell, K. A. (2018). Extinction and optical depth retrievals for CALIPSO's Version 4 data release. Atmos. Meas. Tech. 11, 5701–5727. doi:10.5194/amt-11-5701-2018
Yousefi, R., Wang, F., Ge, Q., and Shaheen, A. (2020). Long-term aerosol optical depth trend over Iran and identification of dominant aerosol types. Sci. Total Environ. 722, 137906. doi:10.1016/j.scitotenv.2020.137906
Keywords: MODIS, AERONET, AOD, Ångström exponent, aerosol types, classification, biomass burning, dust particles
Citation: Bilal M, Ali MA, Nichol JE, Bleiweiss MP, de Leeuw G, Mhawish A, Shi Y, Mazhar U, Mehmood T, Kim J, Qiu Z, Qin W and Nazeer M (2022) AEROsol generic classification using a novel Satellite remote sensing Approach (AEROSA). Front. Environ. Sci. 10:981522. doi: 10.3389/fenvs.2022.981522
Received: 29 June 2022; Accepted: 03 August 2022;
Published: 26 August 2022.
Edited by:
Guo Wei, University of North Carolina at Pembroke, United StatesReviewed by:
Manish Kumar, Centre for Environment and Energy Development, IndiaNasim Hossein Hamzeh, Ferdowsi University of Mashhad, Iran
Salman Tariq, University of the Punjab, Pakistan
Copyright © 2022 Bilal, Ali, Nichol, Bleiweiss, de Leeuw, Mhawish, Shi, Mazhar, Mehmood, Kim, Qiu, Qin and Nazeer. This is an open-access article distributed under the terms of the Creative Commons Attribution License (CC BY). The use, distribution or reproduction in other forums is permitted, provided the original author(s) and the copyright owner(s) are credited and that the original publication in this journal is cited, in accordance with accepted academic practice. No use, distribution or reproduction is permitted which does not comply with these terms.
*Correspondence: Zhongfeng Qiu, emhvbmdmZW5nLnFpdUBudWlzdC5lZHUuY24=
†These authors have contributed equally to this work