 Alireza Kamal
 Zhaohui Lin
 Chenglai Wu
- 1International Center for Climate and Environment Sciences, Institute of Atmospheric Physics, Chinese Academy of Sciences, Beijing, China
- 2College of Earth and Planetary Sciences, University of Chinese Academy of Sciences, Beijing, China
- 3China-Pakistan Joint Research Center on Earth Sciences, CAS-HEC, Islamabad, Pakistan
Western Iran is an important dust source region in Middle East, with strong dust activities occurring in springtime. Based on a three-hourly meteorological station data, remarkable decadal change of dust frequency in the spring season has been found in the west and southwest of Iran, with less dust activities during 1992–2005 (hereafter as “P1”) and more frequent dust activities occurring during 2006–2015 (hereafter as “P2”). The decadal change signal in dust activities is closely associated with the corresponding decadal difference in precipitation and atmospheric moisture transportation in the region. Compared with P1 period during 1992–2005, anomalous moisture divergence over the center of Middle East can be found in P2 period during 2006–2015, suggesting less moisture transport to the western Iran from the Arabian Sea, Red Sea, and the Persian Gulf, hence there is relatively less precipitation and dry soil moisture over the main dust source regions in the study region, which is favorable for more frequent dust emissions in P2 period. Meanwhile, westerly anomaly in P2 period can also be found in western Iran and upstream regions, such as Iraq and Syria, which is favorable for more dust transport to western Iran from upstream dust source region in Middle East. Furthermore, negative SST anomalies in central and western North Pacific and positive SST anomalies in the eastern North Pacific can be found in P1 period, which is corresponding to positive phase of Pacific Decadal Oscillation (PDO). Conversely, a negative phase of PDO can be found during P2 period. This suggests that PDO is the key influential factor for the decadal change of spring dust activities in western Iran.
1 Introduction
Dust aerosol plays a pervasive role in the Earth system (Goudie and Middleton 2006; UNEP, 2016). Large amounts of dust emit in the dust source areas of the Earth, which can be transported over thousands of kilometers and deposited far away from the source regions (Shao et al., 2011; Van der Does et al., 2018). The main dust sources of the world are mostly located in dry and semi-dry lands with sparse vegetation, and alluvial plains (Prospero et al., 2002; Ginoux et al., 2012).
Middle East is one of the key dust sources in the world (Prospero et al., 2002; Ginoux et al., 2012; Wu et al., 2020). Air quality in the Middle East is strongly affected by dust aerosol, posing a serious threat to human health (Fountoukis et al., 2020). There are large regions prone to dust emission in Middle East, with the Iraqi Alluvial plain, the Syrian Desert, and Rub al-Khali and Ad-Dahna deserts in Saudi Arabia being identified as major dust sources (Draxler et al., 2001; Goudie and Middleton, 2001; Léon and Legrand, 2003). In general, dust emissions strongly depend on meteorological factors (precipitation, near-surface winds, etc.) and land surface conditions (soil moisture, soil properties, and surface vegetation cover, etc.) (Qian et al., 2002; Shao et al., 2011; Wu et al., 2018). The meteorological factors are subject to the large-scale circulations and they vary greatly with time, which leads to the strong temporal variations of dust activity in Middle East.
Previous studies have shown that there is remarkable variability in dust activity in Middle East in interannual to decadal time scale, which are closely associated with the variation in large-scale circulation and sea surface temperature (SST) (e. g., Yu et al., 2015; Pu and Ginoux, 2016; Kamal et al., 2020). In particular, there is a significant decadal enhancement of dust activity in Saudi Arabia, which is suggested to be linked to prolonged drought and the consequent reduction in vegetation cover across the Saudi Arabia and upstream region in Sahel (e.g., Piccarreta et al., 2006; Zoljoodi et al., 2013). A relatively high dust period is found in late 1980s and early 1990s, indicating there is a 10-to-16-years cycle in dust activity in Saudi Arabia (Yu et al., 2015). However, few studies have been conducted to investigate the decadal variations of dust activity in other countries of Middle East other than Saudi Arabia. Since there is large difference in the temporal variations of dust activity in different regions of Middle East due to the different influencing factors (Furman, 2003), it is unclear whether there is also a decadal change in dust activity in other countries as Saudi Arabia. As found in East Asia and North Africa, the occurrence of dust storms is closely associated with an anomalous atmospheric circulation pattern (e.g., Fan and Wang, 2004; Ding et al., 2005; Gong et al., 2006; Fan et al., 2016; Francis et al., 2018). So, if the decadal variation of dust activities in Middle East is driven by similar large-scale circulation, it is likely that the dust activity might show similar decadal variations as in Saudi Arabia (Yu et al., 2015; Jin et al., 2021).
As a key dust source region in Middle East, Western and southwestern Iran is a regional belt of high-frequency dust outbreaks (Alizadeh-Choobari, et al., 2016; Kamal et al., 2020; Broomandi et al., 2021). It is found that dust activity is this region shows different variability from other regions in Iran (e.g., Alizadeh-Choobari, et al., 2016; Rashki et al., 2021). The main reason is that this region can be affected not only by the local dust events, but also by dust aerosols transported from upstream regions, such as Saudi Arabia and Syria (e.g., Boloorani et al., 2014; Alizadeh-Choobaril et al., 2016; Alizadeh-Choobaril and Najafi 2018; Namdari et al., 2018; Kamal et al., 2020). Taking this region as the focus domain, we will try to investigate whether there also exists decadal change of dust activity in western Iran, and what is the roles of local meteorological factors and the associated atmospheric circulation on these possible decadal changes, as well as its possible linkages to the sea surface temperature (SST) anomaly signals.
The paper is organized as follows. Section 2 introduces the research data and methodology. In Section 3 the results of decadal dust variations and underlying mechanisms are presented. Finally, conclusions and discussions are given in Section 4.
2 Data and methodology
2.1 Observation data
The dust weather data were extracted based on the code of the present meteorological observation, i.e., a description of the weather phenomena present at the time of observation. The three-hourly weather code from 10 meteorological stations across western Iran during 1979–2018 are used in this study, which are provided by the Islamic Republic of Iran Meteorological Organization (IRIMO). The dust-related weather codes are listed in Table 1. The spatial distribution of these stations is illustrated in Figure 1.
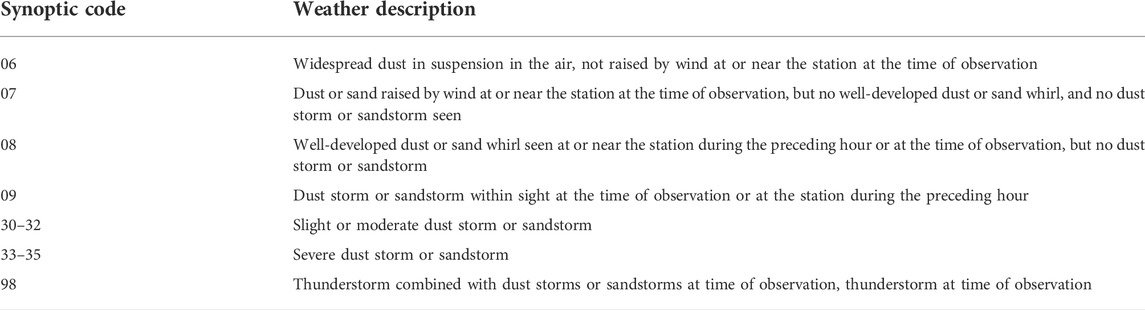
TABLE 1. Phenomena related to dust according to the World Meteorological Organization (WMO) weather codes.
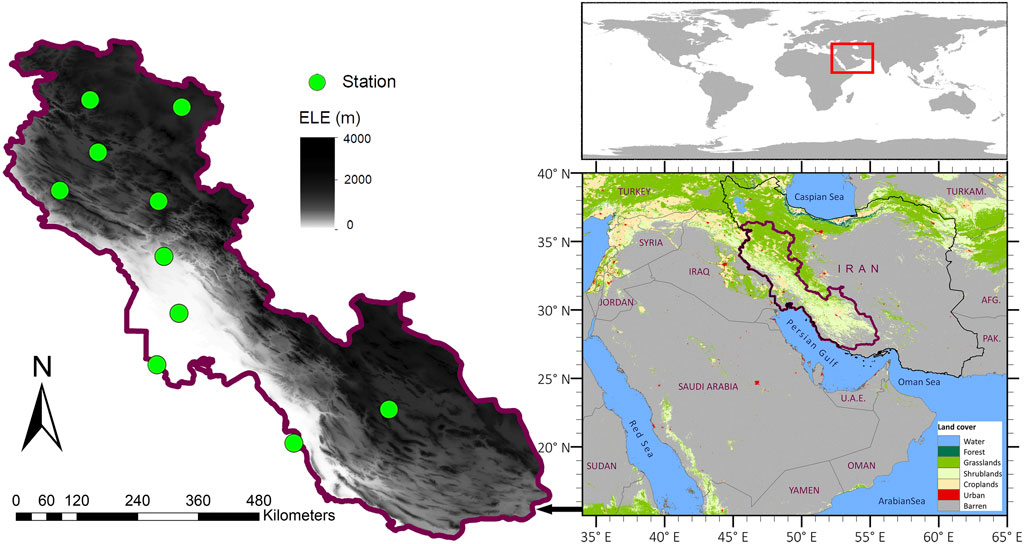
FIGURE 1. Map of Iran in the Middle East with the shaded land cover product of MODIS (MCD12Q1; Friedl and Sulla-Menashe 2015) and the topographic map of western and southwestern Iran. The stations used for three-hourly dust observations in this study are shown with green circles.
In this study, a day was considered a “dusty day” if any dust-related weather code (06–09, 30–35, 98) is reported once during the day, following Shao and Wang (2003). Dust events are further classified into two categories: dust outbreak (present weather code 07–09; 30–35; 98) and dust-in-suspension (present weather code 06). The numbers of days for either category and all dust events are also derived. Then three types of dusty day frequency (DDFs) were derived: 1) Dust Outbreak Day Frequency (DODF), 2) Dust-in-Suspension Day Frequency (DiSDF), and 3) Dust Event Day Frequency (DEDF). Following Kamal et al. (2020), for a given station, the monthly frequency of dust day for each category is calculated by dividing the number of dust days for a specific category by the total number of days with available weather observations in a specific month. The months with missing observations more than 5 days were excluded. The regional mean DDF time series is based on the average of the 10 observation stations. The interannual variations of DDF is very consistent with the MODIS dust optical depth in the recent 2 decades when MODIS observations (Song et al., 2021) are available (Supplementary Figure S1).
As we focus on the decadal variation of spring dust activities over western Iran, the linear trend has been removed from the original DDFs dataset, then a 9-years running mean is further applied to the time series of all DDFs. The spring season in this study refers to the months of March, April, and May.
Time series data of monthly accumulated precipitation at 10 synoptic stations over western Iran during the period of 1979–2018 are obtained from IRIMO. In addition, monthly precipitation dataset from the Global Precipitation Climatology Centre (GPCC) Version 7, with a spatial resolution of 1° × 1° (Schneider et al., 2017), is also used to calculate precipitation anomalies.
In order to investigate the role of vegetation cover change, we also use leaf area index (LAI) from Moderate-Resolution Imaging Spectroradiometer (MODIS) during 2000–2018 (Myneni et al., 2015). MODIS LAI is provided continuously every 8-days on a 0.05° × 0.05° grid. Note that although MODIS observation is only available in a shorter period (i.e., after year 2000) compared to dust and precipitation observations, vegetation cover difference between two periods of high dust and low dust activity, respectively, can be calculated and thus is also shown to demonstrate its role in dust variations.
2.2 Reanalysis data
To demonstrate the variations of meteorological conditions associated with decadal changes of DDF, we also use the ERA5 reanalysis, which is the fifth ECMWF atmospheric reanalysis of the global climate (Hersbach et al., 2020). For this study, we use specific humidity (q), zonal (u) and meridian (v) wind at the 27 different atmospheric levels, sea level pressure (SLP), sea surface temperature (SST), and geopotential at 850 hPa from ERA5. ERA5 reanalysis is provided originally at ∼30 km grid and is interpolated to 0.25° × 0.25° for public use.
We also use the soil moisture from ERA5-Land. ERA5-Land is generated by replaying the land component of the ERA5 climate reanalysis but at a higher-resolution (∼9 km) and with an elevation correction for the thermodynamic near-surface state (Muñoz-Sabater et al., 2021). The data is interpolated to 0.1° × 0.1° for public use. Soil moisture in the topsoil level (0–7 cm) is used. To identify the decadal change of the atmospheric water vapor transport, the vertically integrated moisture flux (VIMF) is also calculated by the following equation (Li et al., 2009):
where q is the specific humidity; u and v are the x- and y-components of the wind, respectively; p is the pressure; Psurf is the surface pressure; Ptop is the pressure at the top of the atmospheric layer; and g is the acceleration due to gravity. VIMF is calculated by integrating the horizontal moisture flux convergence over the lower to middle layers of troposphere (1,000–700 hPa). Note values of VIMF is expressed in units of 10–5 kg m−2s−1.
To remove the long-term trend signal, all calculations are based on the linear detrended data for the period 1979 to 2018. We use the t-test to determine the significance of the correlation coefficient between climatic factors and dust-day frequency, as well as the significance of the difference between two selected periods, as shown in Section 3.
3 Results
3.1 Decadal change of spring dust activity
Figure 2 shows the time series of spring dust days’ frequency for DODF, DiSDF, and DEDF in western Iran from 1979 to 2018, and their corresponding 9-years running means. There are apparent interannual variations of DDF in the region, which is also presented in Kamal et al. (2020). The interannual variations are underlain by the strong decadal variations. It is found that dust activities are relatively weaker during 1992–2005 (hereafter P1), with negative anomalies of dust day frequency, but strong positive anomalies of dust day frequency from 2006 to 2015 (hereafter P2) can also be found, suggesting that dust activities are stronger during 2006–2015. The most extreme DiSDF (normalized anomalies = 1.5–2.0) occurred in western Iran during 2007–2012, which is consistent with the peak of dust activities in Saudi Arabia (Yu et al., 2015) and Syria (Pu and Ginoux, 2016). DODF shows similar variations with DiSDF in most years, but they differ greatly during 2009–2018 when DiSDF shows significantly decreasing trends while there is no apparent decreasing trend in DODF. This can be explained by the fact that DODF indicates local dust emission while DiSDF indicates dust transport from upstream regions in addition to dust suspension after local dust emission. According to the temporal variations, we can identify two periods, with relatively weak dust activities in P1 during 1992–2005, and relatively strong dust activities in P2 during 2006–2015.
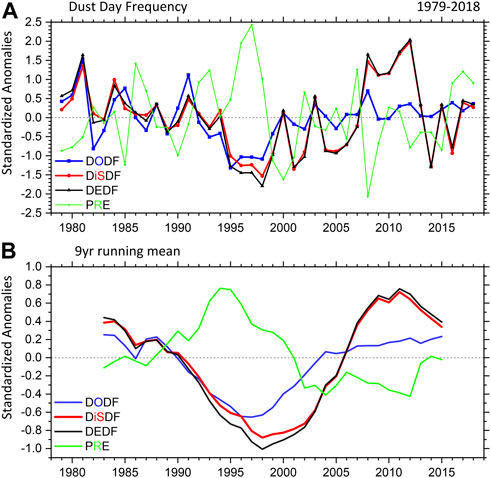
FIGURE 2. Time series of spring (A) dust days’ frequency; Dust Outbreak Day Frequency (DODF; blue line), Dust-in-Suspension Day Frequency (DiSDF; red line), and Dust Event Day Frequency (DEDF; black line) along with precipitation (PER; green line) from 1979 to 2018 and (B) their corresponding 9-yr running means in western Iran (1983–2015).
As precipitation is an important factor not only for the suppression of dust emission but also for the wet deposition of dust, it greatly modulates the dust activities (e.g., Zoljoodi et al., 2013; Kamal et al., 2020). In western Iran, in P1 (P2), positive (negative) precipitation anomaly corresponds well with weaker (stronger) dust activities. This suggests that both the DODF and DiSDF are regulated by spring precipitation on the decadal time scale. The correlations between dust days’ frequency and precipitation are strong with the correlation coefficients −0.58 and −0.51, respectively for DODF and DiSDF in western Iran. In next sections we will further examine the role of climatic factors and atmospheric circulation in the Middle East on the decadal DiSDF changes.
3.2 Decadal differences in climatic factor and associated atmospheric circulation
Figure 3 shows the anomalies of precipitation and soil moisture in spring during P1 and P2 relative to the climatological mean from ERA5 and ERA5-Land, respectively. We can find that there is a notable decadal difference of precipitation over western Iran and surrounding regions between P1 and P2. The anomaly of spring precipitation is positive (+2 mm/month) in most parts of the region, especially in western Iran and upwind areas (Iraq and Arabian Peninsula) for P1, while precipitation anomaly is negative (−1.8 mm/month) for P2 in this region (Figures 3A,B). The soil moisture in the topsoil layer also shows a similar pattern of anomalies as precipitation (Figures 3C,D) in most regions, with regional averages + 1.5 and −1.5 m3 m−3 for P1 and p2, respectively. Note that in the southwestern part of Iran, there is some difference between precipitation anomaly and soil moisture anomaly. In this region, there is only weak dry anomaly in precipitation in P2, but there is large soil moisture deficit in the region, which may be due to enhanced evaporation during the period compared to P1 due to the increase of surface temperature.
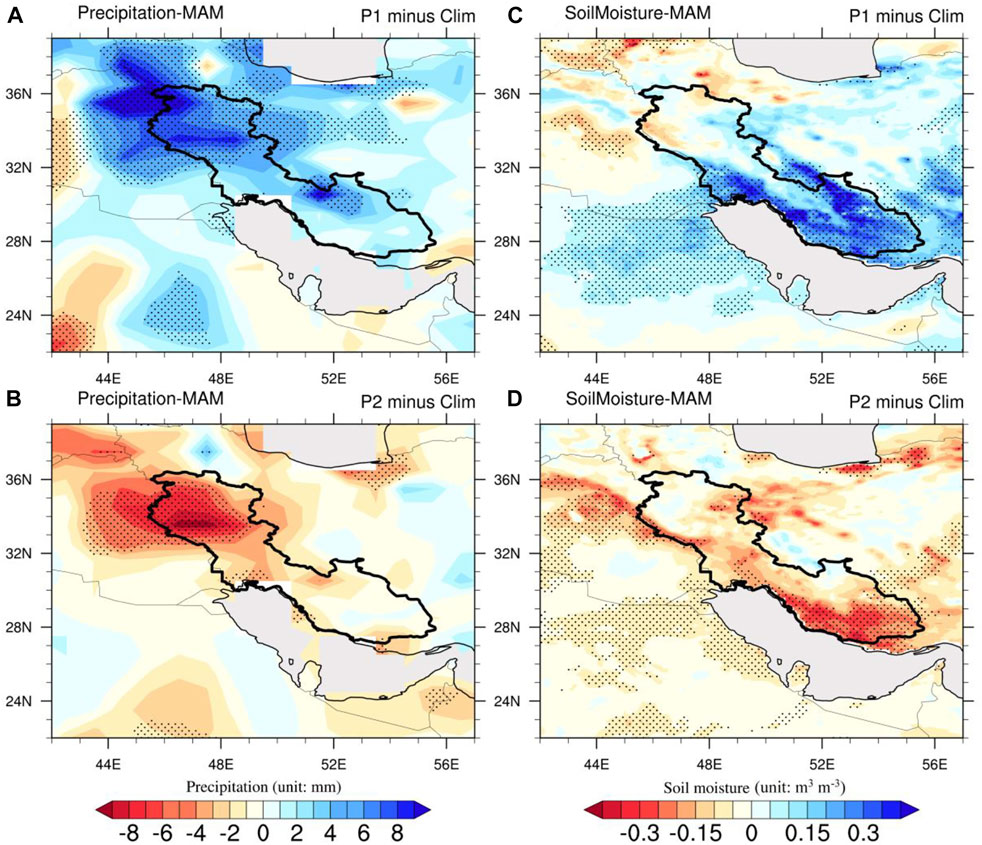
FIGURE 3. The anomalous spring precipitation (unit: mm) and soil moisture (unit: m3 m−3) corresponding to the decadal variation of spring DiSDF over western Iran for the (A,C) P1 (1992–2005) and (B,D) P2 (2006–2015) periods. The climatology (Clim) of precipitation and soil moisture is calculated for the 1979–2018 and 1981–2018 periods, respectively. The black dots indicate the statistical significance at the 95% confidence level.
The less precipitation and smaller soil moisture in P2 have led to a smaller vegetation cover (in terms of LAI) in P2 (Supplementary Figure S2). Although LAI data is not available for a whole period of P1, compared to the period of 2000–2005 (a part of P1) when MODIS LAI data is available, LAI is significantly smaller in western Iran and surrounding regions in P2, which can also contribute to the fact that DiSDF is larger in P2 than in P1. This is consistent with conclusions from previous studies (e.g., Kelley et al., 2015; Notaro et al., 2015), which pointed out that the reduced vegetation covers and agricultural collapse across these regions after 2007 was favorable for dust generation and transport to neighboring regions.
Atmospheric water vapour transport is the moisture source for western Iran. Figure 4 shows the mean of vertical profiles of water vapor flux in P1, P2, and climatology for the whole period (1979–2018). The results revealed that during the weak dust period, low level westerlies are strengthened at about 700 hPa which displaces the meridional transport to lower to lower levels. Hence, the strong water vapour transport (1.5 × 10⁻⁵ kg m−2 s−1) induced by westerlies is associated with enhanced precipitation during P1 over the Middle East. Conversely, the P2 period is characterized by weak water vapour transport (1.3 × 10⁻⁵ kg m−2 s−1) than climatology. Hence, the observed precipitation deficit over the region during P2.
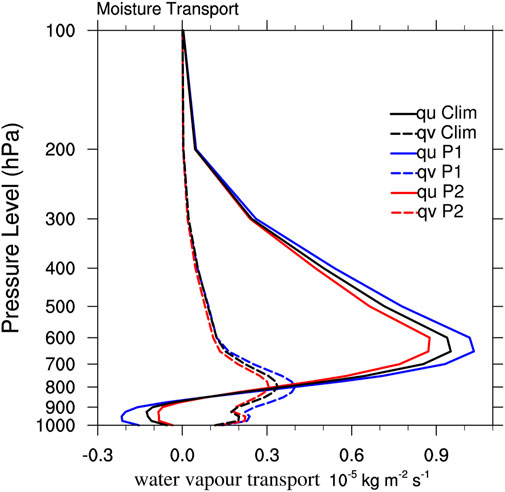
FIGURE 4. Climatology of vertical profile of water vapour transport (unit: 10−5 kg m−2 s−1) over Middle East (22–38°N; 42–56°E) corresponding to the decadal variation of spring DiSDF over western Iran for the P1 (1992–2005; blue lines) and P2 (2006–2015; red lines) periods. The climatology of water vapour transport (black lines) was calculated for the 1979–2018 period. The solid lines indicate zonal transportation, while the dashed lines represent the meridional.
Figure 5 further shows the climatology of vertically integrated moisture flux (VIMF) and its convergence/divergence and their anomalies corresponding to the decadal variation of spring DiSDF over western Iran. In general, atmospheric moisture sources for Iran are mainly Mediterranean Sea in the northwest, oceans to the south such as Red Sea, Arabic Sea, and Persian Gulf, and water vapor is transported toward Iran by Saudi Arabia Dynamic High-Pressure System and Sudan’s Low-Pressure System (e.g., Heydarizad et al., 2018; Darand and Pazhoh 2019) (Figure 5A). In P1, the VIMF convergence flux flow is much higher in western Iran and upwind areas of Iraq and Arabian Peninsula in the lower to middle layers of the troposphere (VIMF: 0.03 × 10⁻⁵ kg m−2 s−1), which is consistent to the positive precipitation anomalies in this period (Figure 5B). In P1, water vapor transported into Middle East from the Arabian Sea and Red Sea is enhanced, leading to more convergence in western Iran. Unlike P1, in P2 the northward and eastward water vapour transport to western Iran is reduced (VIMF: 0.01 × 10⁻⁵ kg m−2 s−1), leading to less water vapour convergence and thus less precipitation over western Iran and surrounding regions in this period (Figure 5C).
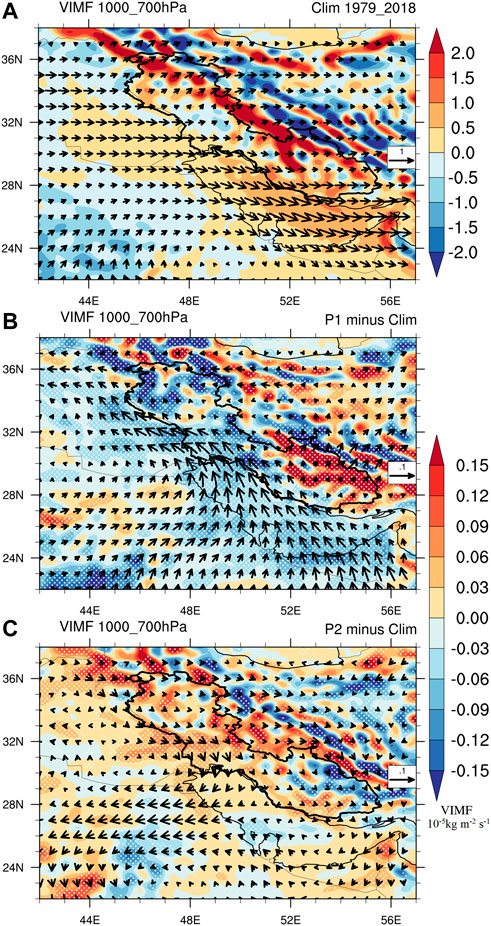
FIGURE 5. Vertically integrated moisture flux convergence/divergence (VIMF, shaded, unit: 10−5 kg m−2 s−1) over the lower-middle layers of troposphere (1,000–700 hPa), superimposed with vertically integrated moisture transportation vector (arrows, Unit: kg m−1s−1) during MAM season (A) climatology averaged over 1979–2018; (B) anomalies for P1 period (1992–2005) from the climatology and (C) anomalies for P2 period (2006–2015) from climatology, corresponding to the decadal variation of spring DiSDF over western Iran. The reference arrow for moisture transportation vector is 1 kg m−1s−1 for climatology and 0.1 kg m−1s−1 for anomalies. The white dots (B,C) indicate the statistical significance at the 95% confidence level.
In addition to precipitation, surface wind is another factor that strongly affects dust emission. In the spring, predominant wind direction is west over most parts of western Iran, northwest over the alluvial plain in Iraq, and east over Rub al-Khali and Ad Dahna Desert in Arabian Peninsula (Figure 6A). Figures 6B,C shows the anomaly of UV-wind in lower layers of the troposphere (averaged at the levels of 1,000, 975, 950, 925, 900, 875, 850 hPa) over center of the Middle East in the periods P1&P2. Compared to climatology during 1979–2018, the spring wind speed over the Shamal region is relatively lower in P1, while it is relatively higher in northern Iraq, Syria, and west part of Iran in P2, which leads to both greater dust transport from upstream regions to western Iran and larger local dust emission in western Iran. From the upstream dust sources for western Iran is mainly the Tigris-Euphrates basin in Iraq (Rezazadeh et al., 2013; Notaro et al., 2015; Mohammadpour et al., 2021), Syrian desert in Syria and Jordon (Zoljoodi et al., 2013; Sotoudeheian et al., 2016).
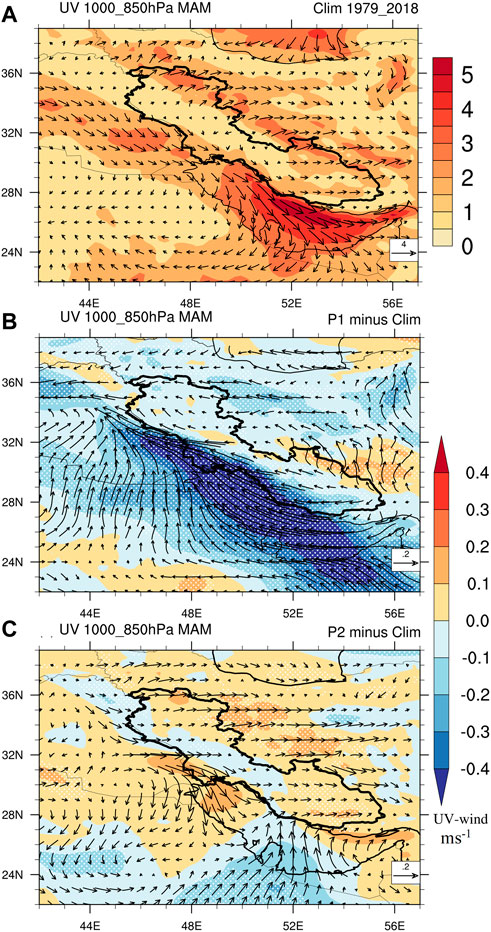
FIGURE 6. The UV-wind climatology and anomalies at 1,000–850 hPa (averaged at the seven levels: 1,000, 975, 950, 925, 900, 875, 850 hPa available from ERA5 reanalysis) during MAM season (A) climatology averaged over 1979–2018; (B) anomalies for P1 period (1992–2005) from the climatology and (C) anomalies for P2 period (2006–2015) from climatology, corresponding to the decadal variation of spring DiSDF over western Iran. Colored shading indicates the wind speed (unit: ms−1) and is superimposed with wind vector. The reference arrow for wind vector is 4 ms−1 for climatology and 0.2 ms−1 for anomalies. The white dots (B,C) indicate the statistical significance at the 95% confidence level.
3.3 Linkage with decadal change of sea surface temperature
The decadal shift in atmospheric circulation can be closely linked to the variations of sea surface temperature. As shown in Figure 7A, associated with the low DiSDF in P1, there exist negative SST anomalies in central and western North Pacific and positive SST anomalies in the eastern North Pacific, which is corresponding to positive phase of Pacific Decadal Oscillation (PDO). In P2 period, the pattern of SST anomaly is almost opposite to that in P1 (Figure 7B), with positive SST anomalies found in central and western North Pacific, and negative SST anomalies found in the eastern North Pacific. The pattern of SST anomalies in Pacific Ocean during P2 period resembles that for negative phase of PDO. Besides the SST anomaly signal in Pacific Ocean, opposite SST anomalies can also be found in Indian ocean for P1 and P2 period, with positive SST anomalies found in Indian Ocean and Arabian Sea in P1 period, and opposite anomalies found for P2 period.
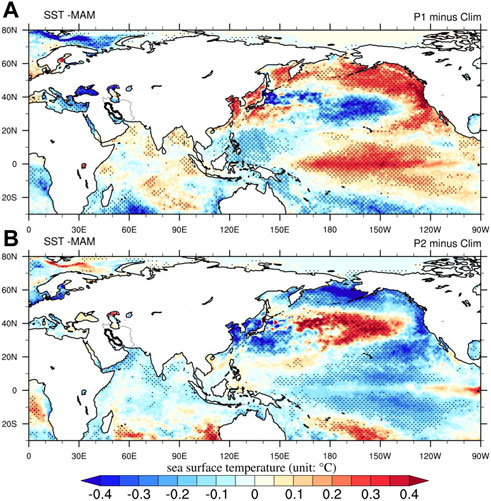
FIGURE 7. Anomalies of decadal sea surface temperature (unit: °C) for (A) P1 (1992–2005) and (B) P2 (2006–2015), relative to climatological mean corresponding to the decadal variation of spring DiSDF over western Iran. The climatology (Clim) is calculated for the 1979–2018 period. The black dots indicate the statistical significance at the 95% confidence level.
Figure 8 shows the time series of Pacific Decadal Oscillation (PDO), Indian Ocean Basin Mode (IOBM) and Indian Ocean Dipole (IOD) indices in MAM and DiSDF over western Iran, as well as their 9-years running mean. From Figure 8A, we can find the correlation coefficient between PDO and DiSDF is about −0.34 in interannual time scale, which is statistically significance at 95% confidence level.
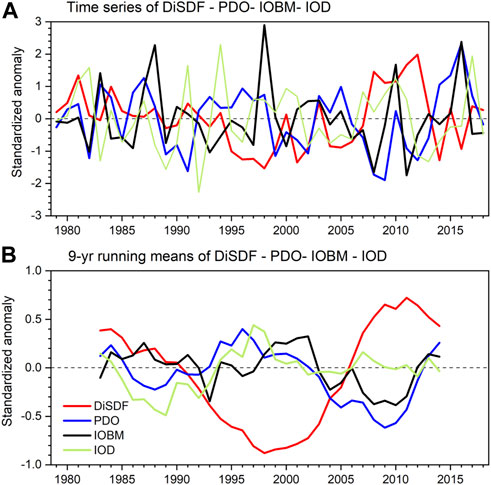
FIGURE 8. (A) Time series of spring DiSDF, PDO, IOBM, and IOD from 1979 to 2018 and (B) their corresponding 9-yr running means (1983–2014). The monthly standardized PDO index is derived from the leading principal component of monthly sea surface temperature anomalies in the northern Pacific Ocean (20° N) after the global average sea surface temperature has been removed. The IOBM index is defined as SST anomalies over the tropical Indian Ocean (40°E−120°E, 20°S−25°N). The IOD index is defined as the difference in SST anomalies between the west region (50°E-70°E and 10°S-10°N) and the east region (90°E-110°E and 10°S-0) in the Indian Ocean.
In decadal time scale, the variation of PDO and DiSDF are quite opposite (Figure 8B), with correlation coefficient of −0.54, which is statistically significant at the 99% confidence level (Table 2). This implies that PDO is a key influential factor for the decadal change of dust activities in western Iran. During negative PDO phase in P2 period, it is also the high dust period, while in the low dust period in P1, the PDO is in its positive phase (Figure 8B). Pu and (Ginoux et al., 2012) has revealed that there exists a significantly negative correlation between the dust activities in Syrian and the PDO in spring at interannual time scale from 2003 to 2015. The results from our study further demonstrate that, at the interdecadal time scale, PDO also play an important role in modulating the dust variations in Middle East.
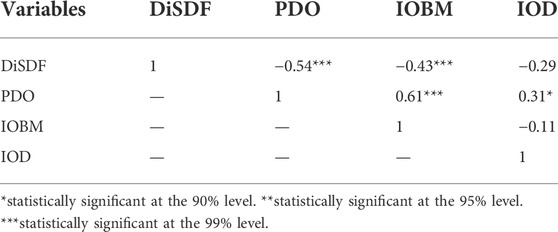
TABLE 2. The correlation coefficients among DiSDF, PDO, IOBM, and IOD in spring based on 9-yr running means of original series.
For the impacts of Indian Ocean, we can find from Figure 8A that the correlation between DiSDF and IOBM is −0.29, and correlation between DiSDF and IOD is 0.19. Both of them are not exceeding the 90% significance level, suggesting that the DiSDF is not affected by IOD and IOBM in interannual time scale.
The correlation between DiSDF and IOBM, IOD at decadal time scale are shown in Table 2, and we can find that the correlation coefficient between IOBM and DiSDF is −0.43, which is statistically significant at the 99% confidence level, although it is lower than the correlation coefficient for PDO. The correlation coefficient between IOD index and DiSDF is weak, with the value of −0.29, which is not statistically significance at the 90% confidence level. This result suggests that in addition to Pacific Ocean, decadal variation of IOBM might also play an important role in modulating the decadal dust variations in western Iran.
Previous studies have suggested that the decadal IOBM variations may be a response to the remote forcing from North Pacific Ocean and thus modulated by PDO (Han, Meehl et al., 2014; Han, Vialard et al., 2014; Dong et al., 2016). From Table 2, a strong positive correlation between PDO and IOBM is found, with correlation coefficient reaching 0.61, which is at statistically 99% confidence level. In order to distinguish whether the impact of IOBM on dust variations in western Iran in decadal time scale is distinct from that for PDO, we further use partial cross-correlation analysis (Yuan et al., 2015) to re-calculate the correlation among PDO, IOBM, and DiSDF. The results show that, after removing the influence of PDO, there is no significant correlation between DiSDF and IOBM in decadal time scale (R = −0.14). However, after excluding the IOBM signal, the correlation between DiSDF and PDO in decadal time scale is kept strong and significant (-0.39; statistically significant at the 95% confidence level). These results imply that POD plays a determining role on both IOBM and DiSDF, and IOBM may serve as an intermediary between PDO and DiSDF in western Iran.
Figure 9 shows the anomalies of geopotential height and wind at 850hpa over the Arabian Peninsula for P1 and P2 period respectively. We can find that there exist negative anomalies of geopotential height at 850 hpa over most part of the Arabian Peninsula in negative PDO phase during 2006–2015 (P2 period) as shown in Figure 9B, while positive anomalies of 850 hpa geopotential height in the same region can be found in positive PDO phase during 1992–2005 (Figure 9A). This is consistent with previous findings that negative PDO will be favorable for the negative anomalies of geopotential height at 850 hPa in this region, and lower geopotential height over the Middle East and Africa will facilitate the formation of the cyclones that are important for the spring peak of dust storms (e.g., Dayan et al., 2008; Pu and Ginoux 2016). The opposite pattern can be found for the P1, with positive anomalies of geopotential over the Arabian Peninsula, and this is favorable for the weaking of spring dust activities in the region.
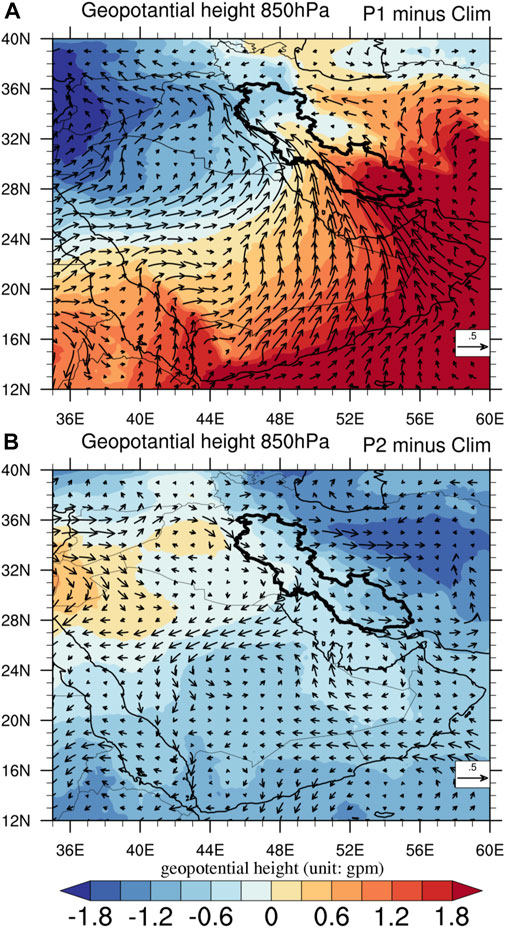
FIGURE 9. Anomalies of decadal geopotential height (colored shading; unit: gpm) and UV-wind (vectors; ms−1) at 850 hPa during (A) P1 (1992–2005) and (B) P2 (2006–2015), relative to climatological mean. The climatology (Clim) is calculated for the 1979–2018 period. The reference arrow for wind vector is 0.5 ms−1 for anomalies.
4 Conclusion and discussion
Based on station observation data, we revealed a decadal change of dust in-suspension day frequency over western Iran, and further pointed out that the atmospheric circulation may play an important role in modulating this decadal variation. Two periods with strong (P2: 2006–2015) and weak (P1: 1992–2005) dust activities are identified, then the surface wind, precipitation, soil moisture, water vapor transport and divergence during P1 and P2 are compared. The results show the northwesterly winds, which can either enhance the dust emission locally or transport dust from the main dust source areas to western Iran, predominate in P2 than P1.
There is anomalous convergence in the lower to middle troposphere over the western Iran in P1, resulting in more moisture transport from southern seas to the upper region and thus more precipitation in this period. The moisture transport is closely relatively to the large-scale circulations including subtropical high-pressure system on Saudi Arabia as pointed out (Darand and Pazhoh 2019). In contrast, in P2 the negative anomalies of spring precipitation and soil moisture are evident over the region because of anomalous water vapor divergence. The negative anomalies of spring precipitation and evident has also led to the deteriorated vegetation cover in P2 in the western Iran, which also partly contributes to the high dust frequency in P2. In addition, the SST anomalies show distinct differences between the decadal change of DiSDF in P1&P2. The findings showed that a negative PDO is connected with circulation and geopotential height patterns favorable to high dust frequency in P2 in the western Iran. Previous studies have shown the PDO influences the climate factors and thus on dust in Arabian Peninsula and Syria at interannual scales (e.g., Notaro et al., 2015; Pu and Ginoux 2016). The periods of their analysis are relative short, and our study further give direct evidence on the dominant impacts of PDO on dust variations in western Iran on decadal scales. Even the significant decadal correlation between DiSDF and IOBM can be found, this correlation is no longer significant after removing the influence of PDO, and this suggests that IOBM may serve as an intermediary for the impact of PDO on DiSDF in western Iran.
With respect to various sources of dust in the Middle East, western Iran is affected by local and transported dust storms. In general, western Iran shows similar decadal changes in dust activity with Saudi Aria during 1988–2012, which suggests that decadal dust activities in both western Iran and Saudi Arabia are all associated with decadal changes in regional climate and circulations. However, whether other regions of Middle East other than Saudi Arabia and western Iran, such as Syria, Iraq and Sudan, experienced similar decadal variations need further confirmation with dust observations in these regions. In particular, as dust particles in these regions can be transported to affect western Iran, it is desirable to separate the contributions of these upstream areas to the decadal variations of dust activities in western Iran, as revealed in this study. Numerical simulation with meteorological models could be conducted to quantify the impacts of dust transportation and local dust emission on the dust storm episode, as well as the variation of dust activities in different time scales (e.g., Ledari et al., 2022). In addition to western Iran, other parts of Iran, in particular eastern Iran which is regarded as one of the most dusty regions in Middle East, also suffer from heavy dust pollution (Rashki et al., 2021), and it is desirable to conduct similar analysis as in this study for these regions to enhance our understanding of dust variations in Middle East.
Data availability statement
Meteorological data are available on the Islamic Republic of Iran Meteorological Organization (IRIMO) website: https://data.irimo.ir. MODIS DOD retrieval data are available at https://doi.org/10.5194/acp-21-13369-2021 (Song et al., 2021). Reanalysis data from ERA-5 is available at the following website: https://cds.climate.copernicus.eu. Precipitation dataset from GPCC V7 is available at the following website: https://www.esrl.noaa.gov/psd/data/gridded/data.gpcc.html. PDO index is available at the NOAA Climate Prediction Center website: http://www.esrl.noaa.gov/psd/data/climateindices/list.
Author contributions
All authors equally collaborated in the research presented in this publication by making the following contributions: research conceptualization, AK, ZL, and CW; methodology, AK, ZL, and CW; formal analysis, AK, ZL, and CW; data curation, AK, ZL, and CW; writing original draft preparation, AK, ZL, and CW; writing review and editing, AK, ZL, and CW; supervision, ZL
Funding
This study is jointly supported by the National Key Research and Development Program of China (grant 2020YFA0607801) and the National Natural Science Foundation of China (grant nos. 42075166 and 41975119). The authors acknowledge the support of the CAS-TWAS President Fellowship (No. 2017CTF116).
Acknowledgments
We would like to thank the Islamic Republic of Iran Meteorological Organization (IRIMO) for providing weather data. We also thank the European Centre for Medium-Range Weather Forecasts (ECMWF) reanalysis project for providing wind field and soil moisture data, and the Global Precipitation Climatology Centre (GPCC) for providing precipitation data over Middle East.
Conflict of interest
The handling editor RM declared a past co-authorship with the authors CW and ZL.
The authors declare that the research was conducted in the absence of any commercial or financial relationships that could be construed as a potential conflict of interest.
Publisher’s note
All claims expressed in this article are solely those of the authors and do not necessarily represent those of their affiliated organizations, or those of the publisher, the editors and the reviewers. Any product that may be evaluated in this article, or claim that may be made by its manufacturer, is not guaranteed or endorsed by the publisher.
Supplementary material
The Supplementary Material for this article can be found online at: https://www.frontiersin.org/articles/10.3389/fenvs.2022.983048/full#supplementary-material
References
Alizadeh-Choobari, O., Ghafarian, P., and Owlad, E. (2016). Temporal variations in the frequency and concentration of dust events over Iran based on surface observations. Int. J. Climatol., 36(4), 2050–2062. doi:10.1002/joc.4479
Alizadeh-Choobari, O., and Najafi, M. S. (2018). Extreme weather events in Iran under a changing climate. Clim. Dyn., 50(1-2), 249–260. doi:10.1007/s00382-017-3602-4
Boloorani, A. D., Nabavi, S. O., Bahrami, H. A., Mirzapour, F., Kavosi, M., Abasi, E., et al. (2014). Investigation of dust storms entering Western Iran using remotely sensed data and synoptic analysis. J. Environ. Health Sci. Eng., 12(1), 124. doi:10.1186/s40201-014-0124-4
Broomandi, P., Karaca, F., Guney, M., Fathian, A., Geng, X., and Kim, J. R. (2021). Destinations frequently impacted by dust storms originating from southwest Iran. Atmos. Res., 248, 105264. doi:10.1016/j.atmosres.2020.105264
Darand, M., and Pazhoh, F. (2019). Vertically integrated moisture flux convergence over Iran. Clim. Dyn., 53(5-6), 3561–3582. doi:10.1007/s00382-019-04726-z
Dayan, U., Ziv, B., Shoob, T., and Enzel, Y. (2008). Suspended dust over southeastern Mediterranean and its relation to atmospheric circulations. Int. J. Climatol., 28(7), 915–924. doi:10.1002/joc.1587
Ding, R., Li, J., Wang, S., and Ren, F. (2005). Decadal change of the spring dust storm in northwest China and the associated atmospheric circulation. Geophys. Res. Lett., 32, L02808(2). doi:10.1029/2004GL021561
Dong, L., Zhou, T., Dai, A., Song, F., Wu, B., and Chen, X. (2016). The footprint of the inter-decadal Pacific oscillation in Indian Ocean sea surface temperatures. Sci. Rep., 6(1), 21251–21258. doi:10.1038/srep21251
Draxler, R. R., Gillette, D. A., Kirkpatrick, J. S., and Heller, J. (2001). Estimating PM10 air concentrations from dust storms in Iraq, Kuwait and Saudi Arabia. Atmos. Environ., 35(25), 4315–4330. doi:10.1016/S1352-2310(01)00159-5
Fan, K., and Wang, H. (2004). Antarctic oscillation and the dust weather frequency in North China. Geophys. Res. Lett., 31 10. doi:10.1029/2004GL019465
Fan, K., Xie, Z. M., and Xu, Z. Q. (2016). Two different periods of high dust weather frequency in northern China. Atmos. Ocean. Sci. Lett., 9(4), 263–269. doi:10.1080/16742834.2016.1176300
Fountoukis, C., Harshvardhan, H., Gladich, I., Ackermann, L., and Ayoub, M. A. (2020). Anatomy of a severe dust storm in the Middle East: Impacts on aerosol optical properties and radiation budget. Aerosol Air Qual. Res., 20, 155–165. doi:10.4209/aaqr.2019.04.0165
Francis, D., Eayrs, C., Chaboureau, J. P., Mote, T., and Holland, D. M. (2018). Polar jet associated circulation triggered a Saharan cyclone and derived the poleward transport of the African dust generated by the cyclone. J. Geophys. Res. Atmos., 123(21), 11,899–11,917. doi:10.1029/2018jd029095
Friedl, M., and Sulla-Menashe, D. (2015). MCD12Q1 MODIS/Terra+ aqua land cover type yearly L3 global 500m SIN grid V006 [data set]. NASA EOSDIS Land Process. DAAC, 10, 200. doi:10.5067/MODIS/MCD12Q1.006
Furman, H. K. H. (2003). Dust storms in the Middle East: Sources of origin and their temporal characteristics. Indoor Built Environ., 12(6), 419–426. doi:10.1177/1420326X03037110
Ginoux, P., Prospero, J. M., Gill, T. E., Hsu, N. C., and Zhao, M. (2012). Global‐scale attribution of anthropogenic and natural dust sources and their emission rates based on MODIS Deep Blue aerosol products. Rev. Geophys., 50 3005 (3). doi:10.1029/2012RG000388
Gong, D. Y., Mao, R., and Fan, Y. D. (2006). East asian dust storm and weather disturbance: Possible links to the arctic oscillation. Int. J. Climatol., 26(10), 1379–1396. doi:10.1002/joc.1324
Goudie, A., and Middleton, N. (2001). Saharan dust storms: Nature and consequences. Earth-science Rev., 56(1-4), 179–204. doi:10.1016/S0012-8252(01)00067-8
Goudie, A. S., and Middleton, N. J. (2006). Desert dust in the global system. Springer Science & Business Media, Germany.
Han, W., Meehl, G. A., Hu, A., Alexander, M. A., Yamagata, T., Yuan, D., et al. (2014). Intensification of decadal and multi-decadal sea level variability in the Western tropical Pacific during recent decades. Clim. Dyn., 43(5), 1357–1379. doi:10.1007/s00382-013-1951-1
Han, W., Vialard, J., McPhaden, M. J., Lee, T., Masumoto, Y., Feng, M., et al. (2014). Indian ocean decadal variability: A review. Bull. Am. Meteorol. Soc., 95(11), 1679–1703. doi:10.1175/BAMS-D-13-00028.1
Hersbach, H., Bell, B., Berrisford, P., Hirahara, S., Horányi, A., Muñoz‐Sabater, J., et al. (2020). The ERA5 global reanalysis. Q. J. R. Meteorol. Soc., 146(730), 1999–2049. doi:10.1002/qj.3803
Heydarizad, M., Raeisi, E., Sori, R., and Gimeno, L. (2018). The identification of Iran’s moisture sources using a Lagrangian Particle Dispersion Model. Atmosphere, 9(10), 408. doi:10.3390/atmos9100408
Jin, Q., Wei, J., Lau, W. K., Pu, B., and Wang, C. (2021). Interactions of Asian mineral dust with Indian summer monsoon: Recent advances and challenges. Earth-Science Rev., 215, 103562. doi:10.1016/j.earscirev.2021.103562
Kamal, A., Wu, C., and Lin, Z. (2020). Interannual variations of dust activity in Western Iran and their possible mechanisms. Big Earth Data, 4(2), 175–190. doi:10.1080/20964471.2019.1685825
Kelley, C. P., Mohtadi, S., Cane, M. A., Seager, R., and Kushnir, Y. (2015). Climate change in the Fertile Crescent and implications of the recent Syrian drought. Proc. Natl. Acad. Sci. U. S. A., 112(11), 3241–3246. doi:10.1073/pnas.1421533112
Ledari, D. G., Hamidi, M., and Shao, Y. (2022). Numerical simulation of the 18 February 2017 frontal dust storm over southwest of Iran using WRF-Chem, satellite imagery, and PM10 concentrations. J. Arid Environ., 196, 104637. doi:10.1016/j.jaridenv.2021.104637
Léon, J. F., and Legrand, M. (2003). Mineral dust sources in the surroundings of the north Indian Ocean. Geophys. Res. Lett., 30(6). doi:10.1029/2002GL016690
Li, H., Lin, Z., and Chen, H. (2009). Interdecadal variability of spring precipitation over South China and its associated atmospheric water vapor transport. Atmos. Ocean. Sci. Lett., 2(2), 113–118. doi:10.1080/16742834.2009.11446783
Mohammadpour, K., Sciortino, M., and Kaskaoutis, D. G. (2021). Classification of weather clusters over the Middle East associated with high atmospheric dust-AODs in West Iran. Atmos. Res., 259, 105682. doi:10.1016/j.atmosres.2021.105682
Muñoz-Sabater, J., Dutra, E., Agustí -Panareda, A., Albergel, C., Arduini, G., Balsamo, G., et al. (2021). Era5-land: A state-of-the-art global reanalysis dataset for land applications. Earth Syst. Sci. Data., 13, 4349–4383. doi:10.5194/essd-13-4349-2021
Myneni, R., Knyazikhin, Y., and Park, T. (2015). MOD15A2H MODIS/Terra leaf area Index/FPAR 8-Day L4 global 500m SIN grid V006. NASA EOSDIS Land Processes DAAC, South Dakota. doi:10.5067/MODIS/MOD15A2H.006
Namdari, S., Karimi, N., Sorooshian, A., Mohammadi, G., and Sehatkashani, S. (2018). Impacts of climate and synoptic fluctuations on dust storm activity over the Middle East. Atmos. Environ., 173, 265–276. doi:10.1016/j.atmosenv.2017.11.016
Notaro, M., Yu, Y., and Kalashnikova, O. V. (2015). Regime shift in Arabian dust activity, triggered by persistent Fertile Crescent drought: J. Geophys. Res. Atmos., 120(19), 10–229. doi:10.1002/2015JD023855
Piccarreta, M., Capolongo, D., Boenzi, F., and Bentivenga, M. (2006). Implications of decadal changes in precipitation and land use policy to soil erosion in Basilicata, Italy. Catena, 65(2), 138–151. doi:10.1016/j.catena.2005.11.005
Prospero, J. M., Ginoux, P., Torres, O., Nicholson, S. E., and Gill, T. E. (2002). Environmental characterization of global sources of atmospheric soil dust identified with the Nimbus 7 Total Ozone Mapping Spectrometer (TOMS) absorbing aerosol product. Rev. Geophys., 40(1), 2-1-2-31. doi:10.1029/2000RG000095
Pu, B., and Ginoux, P. (2016). The impact of the Pacific Decadal Oscillation on springtime dust activity in Syria. Atmos. Chem. Phys., 16(13), 13431–13448. doi:10.5194/acp-16-13431-2016
Qian, W., Quan, L., and Shi, S. (2002). Variations of the dust storm in China and its climatic control. J. Clim., 15(10), 1216–1229. doi:10.1175/1520-0442(2002)015<1216:VOTDSI>2.0.CO;2
Rashki, A., Middleton, N. J., and Goudie, A. S. (2021). Dust storms in Iran–Distribution, causes, frequencies and impacts. Aeolian Res., 48, 100655. doi:10.1016/j.aeolia.2020.100655
Rezazadeh, M., Irannejad, P., and Shao, Y. (2013). Climatology of the Middle East dust events. Aeolian Res., 10, 103–109. doi:10.1016/j.aeolia.2013.04.001
Schneider, U., Finger, P., Meyer-Christoffer, A., Rustemeier, E., Ziese, M., and Becker, A. (2017). Evaluating the hydrological cycle over land using the newly-corrected precipitation climatology from the Global Precipitation Climatology Centre (GPCC). Atmosphere, 8(3), 52. doi:10.3390/atmos8030052
Shao, Y., and Wang, J. (2003). A climatology of Northeast Asian dust events. metz., 12(4), 187–196. doi:10.1127/0941-2948/2003/0012-0187
Shao, Y., Wyrwoll, K. H., Chappell, A., Huang, J., Lin, Z., McTainsh, G. H., et al. (2011). Dust cycle: An emerging core theme in Earth system science. Aeolian Res., 2(4), 181–204. doi:10.1016/j.aeolia.2011.02.001
Song, Q., Zhang, Z., Yu, H., Ginoux, P., and Shen, J. (2021). Global dust optical depth climatology derived from CALIOP and MODIS aerosol retrievals on decadal timescales: Regional and interannual variability. Atmos. Chem. Phys., 21(17), 13369–13395. doi:10.5194/acp-21-13369-2021
Sotoudeheian, S., Salim, R., and Arhami, M. (2016). Impact of middle eastern dust sources on PM10in Iran: Highlighting the impact of Tigris-Euphrates basin sources and lake urmia desiccation: J. Geophys. Res. Atmos., 121(23), 14,018–14,034. doi:10.1002/2016JD025119
Unep, W. U. N. C. C. D. (2016) Global assessment of sand and dust storms. United Nations Environment Programme, Nairobi.
Van Der Does, M., Knippertz, P., Zschenderlein, P., Giles Harrison, R., and Stuut, J. B. W. (2018). The mysterious long-range transport of giant mineral dust particles. Sci. Adv., 4(12), eaau2768. doi:10.1126/sciadv.aau2768
Wu, C., Lin, Z., Liu, X., Li, Y., Lu, Z., and Wu, M. (2018). Can climate models reproduce the decadal change of dust aerosol in East Asia? Geophys. Res. Lett., 45(18), 9953–9962. doi:10.1029/2018GL079376
Wu, C., Lin, Z., and Liu, X. (2020). The global dust cycle and uncertainty in CMIP5 (Coupled Model Intercomparison Project phase 5) models. Atmos. Chem. Phys., 20(17), 10401–10425. doi:10.5194/acp-20-10401-2020
Yu, Y., Notaro, M., Liu, Z., Wang, F., Alkolibi, F., Fadda, E., et al. (2015). Climatic controls on the interannual to decadal variability in Saudi Arabian dust activity: Toward the development of a seasonal dust prediction model. J. Geophys. Res. Atmos., 120(5), 1739–1758. doi:10.1002/2014JD022611
Yuan, N., Fu, Z., Zhang, H., Piao, L., Xoplaki, E., and Luterbacher, J. (2015). Detrended partial-cross-correlation analysis: A new method for analyzing correlations in complex system. Sci. Rep., 5(1), 8143–8147. doi:10.1038/srep08143
Keywords: spring dust activity, decadal change, moisture transport, pacific decadal oscillation, western Iran
Citation: Kamal A, Lin Z and Wu C (2022) Decadal change of spring dust activity in western Iran and its mechanism. Front. Environ. Sci. 10:983048. doi: 10.3389/fenvs.2022.983048
Received: 30 June 2022; Accepted: 24 August 2022;
Published: 26 September 2022.
Edited by:
Rui Mao, Beijing Normal University, ChinaReviewed by:
Bangjun Cao, Chengdu University of Information Technology, ChinaQinjian Jin, University of Kansas, United States
Copyright © 2022 Kamal, Lin and Wu. This is an open-access article distributed under the terms of the Creative Commons Attribution License (CC BY). The use, distribution or reproduction in other forums is permitted, provided the original author(s) and the copyright owner(s) are credited and that the original publication in this journal is cited, in accordance with accepted academic practice. No use, distribution or reproduction is permitted which does not comply with these terms.
*Correspondence: Zhaohui Lin, bHpoQG1haWwuaWFwLmFjLmNu