 Caroline Fadeke Ajilogba
 Sue Walker
- 1Division of Agrometeorology, Agricultural Research Council—Natural Sciences and Engineering, Pretoria, South Africa
- 2Food Security and Safety Niche Area, Faculty of Natural and Agricultural Science, North-West University, Mmabatho, South Africa
- 3Department of Soil, Crop and Climate Sciences, University of the Free State, Bloemfontein, South Africa
Plant diseases have caused serious challenges in the production of food globally. This has led to hunger and food insecurity. Different solutions for crop diseases have been introduced in the recent past that include cultural control using farm management methods, chemical control, resistant cultivars, and recently, biocontrol. Each of these solutions has varied weaknesses. Faced with the changes in climate and the recurrences of crop diseases, new strategies incorporating preventive measures would be important by reducing risks to crop production from crop diseases, thus alleviating food insecurity. Strategies for the prevention of these diseases and/or forecasting favorable environmental conditions for disease development have not been fully employed as preventive measures. The use of crop modeling has been used to advise farmers on planting procedures that would bring maximum yields using different management procedures at the farm level. Little is known about the use of crop models in crop disease control. In order to increase the use of crop models for these objectives, this review provides the current status quo and will help to stimulate more research in this regard.
1 Introduction
Diseases of crops are known to be critical worldwide challenges to optimal food production. Different means are used to combat this menace and to reduce the impacts of pathogens and diseases in crop production (Ajilogba and Babalola, 2013).
Cultural control of crop diseases involves making the environment unfit for the growth and development of plant diseases and disease-causing factors by using local or international management procedures (Ajilogba and Babalola, 2013). In their study, Ajilogba and Babalola emphasized that the application of the working knowledge of environmental conditions aiding the growth of such pathogens and diseases would play an important role in mitigating the spread and impact of diseases. Some other cultural methods are used as part of the integrated control of pests and diseases (Ogle and Dale, 1997). These include mulching, crop rotation, and fallowing the land, while others that are seldom used include grafting of fruit trees (Ogle and Dale, 1997). Cultural control is always important as a support in farm management systems and can be used as additional support to the main preventive strategy.
In modern agriculture, chemical sprays are mostly used to control pest and diseases in a preventative fashion even before they are detected on the crop (Ajilogba and Babalola, 2013). Such chemicals can be called eradicants, which help to kill disease pathogens present in soils and plant parts. Protectants are chemicals that protect plants and stand as an interface between plants and pathogens while therapeutic chemicals are useful in situations where the disease is already progressing (Pelczar et al., 2020). One of the chemicals that is commonly used as a fumigant before planting to manage disease-causing microbes and weeds of plant diseases globally is methyl bromide (Mao et al., 2017).
The use of methyl bromide as a means of control of soil-borne crop diseases has been phased out although it is still used in a few cropping situations. It is normally used as a fumigant in the soil against nematodes of soil, parasites, and pathogenic inoculum. Because of environmental pollution and the risk of health hazards, it is now only used for critical situations (Mao et al., 2017). 1,3-Dichloropropene (1,3-D) and metam sodium (Sadrati et al., 2013) were observed to be as effective as using methyl bromide against soil nematodes. One of the critical challenges with the use of chemicals is an increase in the number of pathogens developing resistance to such chemicals. This makes suppression and elimination of such pathogens more burdensome (Leadbeater, 2015). Another challenge with the use of chemicals is the cost price in comparison to the final production obtained. This normally discourages some farmers from using chemical control methods.
Use of chemical applications is gradually being phased out, while the production of resistant cultivars and, recently, biocontrol methods are being increased (Ajilogba and Babalola, 2013).
Biological control is one of the integrated disease management practices of plant and animal diseases that reduce the yield loss by suppressing the disease and reducing the use of chemicals in order to promote sustainable crop production and human health (O’Brien, 2017; Thurman et al., 2017; Köhl et al., 2019b). It is the control of plant and animal diseases and pests by the application of biological agents to a host animal or plant that prevents the development of a disease by a pathogen (O’Brien, 2017). It can also include the use of microbial antagonists to suppress the disease (Heydari and Pessarakli, 2010; Ajilogba and Walker, 2020). These microbial antagonists can be bacterial, fungal, viral, or by nematodes, although bacterial and fungal antagonists are more common; recently, the use of bacteriophages, which are viruses that kill bacteria, have been reported to be effective (Jones et al., 2007; Buttimer et al., 2017). Sometimes, these microbial antagonists are used singly or as a consortium (O’Brien, 2017; Köhl et al., 2019b; Bradáčová et al., 2019). These microbial antagonists have different modes of operation which include hyperparasitism, phosphate solubilization, predation, antagonism, hydrogen cyanide production, and induced resistance (Jones et al., 2007; Ajilogba and Babalola, 2016). The mode of operation or action of a microbial or biological control agent (M/BCA) is dependent on different events happening in and around the M/BCA (Junaid et al., 2013; Köhl et al., 2019a). These range from how the M/BCA is able to establish itself, and its ability to produce and release metabolites and/or signaling compounds that can induce the defense mechanism of the plants and also how the pathogen in question will respond to the defense mechanism (Köhl et al., 2019b). Furthermore, other determining factors to ensure the effectiveness of the antagonist include the plant cultivar, mode of inoculation, time and duration of inoculation, available conditions for germination and infection of pathogens, physiology, and growing conditions of the plant (Junaid et al., 2013; Ajilogba and Walker, 2020). These growing conditions of pathogens, M/BCA, and plants are very important and form a trio impacted by environmental conditions.
Biological control and M/BCA will be affected by climate change both positively and negatively, as environmental conditions affect agricultural productivity. The biocontrol agents that are effective as a result of the positive impact of climate change might be ineffective in the future as the climate changes (Thurman et al., 2017). As the climate changes in terms of increases in temperature, decreases in precipitation and rainfall, and drought spells, the amount of water in the soil is reduced, which can impact the quality and quantity of soil microbes available depending on their various living conditions. This proceeds to change the incidence of pest and disease patterns and definitely the effectiveness, or lack of it, of M/BCA (Fuhrer, 2003; Jones and Thornton, 2003; Lin, 2011; Thornton et al., 2011).
Biocontrol has been effective against a host of wheat plant diseases including stem rust disease of wheat using a combination of Trichoderma spp. and arbuscular mycorrhizal (AM) fungi based on their efficiency and eco-safety (El-Sharkawy et al., 2018). The research by Larran et al. (2016) concluded that endophytes have potential in the biological control of the tan spot of wheat caused by Drechslera tritici-repentis, and particularly Trichodema hamatum and Bacillus sp. Pseudomonas fluorescens strains significantly improved the establishment and harvest yield of winter wheat infected by the Microdochium nivale causal agent of wheat-seedling blight (Amein et al., 2008). In different field trials, this led to an increase in the wheat yield and plant number by 26.5% and 48%, respectively. Suppression of the growth of wheat take-all disease caused by Gaeumannomyces graminis var. tritici (Ggt) was observed using a combination of Trichodema isolates (Zafari et al., 2008) and bacterial strains from wheat rhizosphere (Nasraoui et al., 2007). According to Bouanaka et al. (2021), Trichoderma afroharzianum is a promising biocontrol agent against Fusarium culmorum, which is responsible for fusarium head blight (FHB) and crown rot (FCR). Furthermore, Lactobacillus plantarum SLG17 and Bacillus amyloliquefaciens FLN13 were observed as biocontrol antagonists against FHB applied starting from the heading period until anthesis of wheat plants (Baffoni et al., 2015). Acceptance of the usage of these biocontrol agents has been slow. This is because farmers, due to different perceptions, including the learning process about new innovations, the ability to evaluate the relative advantages of a new innovation over previously used methods, and the ease of applying a new innovation (Cullen et al., 2010), have not accepted most biocontrol methods.
Use of resistant genes by genetic manipulation has been used to increase the growth of crops and crop yields. Certain genes have been inserted to combat infection by diseases (Dong and Ronald, 2019; Van Esse et al., 2020). This is because resistant genes are able to recognize an attack from a disease pathogen and resist such an attack. They have also been used to increase favorable traits in crops. Beyond this, genetics have also helped in improving genes resistant to pests and diseases and introducing them into other cultivars or crops (Gómez et al., 2009). For example, durable disease-resistant gene Lr34 (= Yr18/Sr57/Pm38) from bread wheat (Triticum aestivum) confers the resistance against multiple fungal diseases, namely leaf rust (Puccinia triticina), stripe rust (Puccinia striiformis f.sp. tritici), stem rust (Puccinia graminis f.sp. tritici), and powdery mildew (Blumeria graminis f.sp. tritici) (Bräunlich et al., 2021).
However, these different strategies are not short-term processes, and implementation can take decades; in order to forestall this, the projection of climate change effects on the severity and intensity of crop diseases and yield losses becomes imperative (Newbery et al., 2016).
Geocontrol is a coined term that means the use of geographical factors to control the incidences of plant diseases. It involves the use of climate data to forecast the activities of microbes in terms of their positive or negative responses to climatic factors including temperature, rainfall, solar radiation, and other factors (Plantegenest et al., 2007; Charaya et al., 2021). This is important because when the climatic factors affect the growth of pathogens by suppressing them, then disease incidence can also be suppressed, reduced, and/or, if possible, eliminated (Varma and Meena, 2020). Factors that can increase the growth of causative organisms are monitored and decreased and even removed where possible, while factors that will suppress growth are increased and encouraged. This leads to other preventive measures so that plant diseases are not initiated, crop losses are avoided, and invariably, crop yields are increased (Varma and Meena, 2020; Charaya et al., 2021).
It is important to note that changes in the climate affect both spatial and temporal distributions of diseases, pathogens, and pests affecting plants (Varma and Meena, 2020). Climate factors such as temperature, rainfall, and radiation are quite important in the growth and development of diseases in any given plant (Charaya et al., 2021; Skendžić et al., 2021). They affect all the different stages in the lifecycle of the pathogen and affect the disease process from the site of infection to sporulation and multiplication and survival of the pathogen in the system (Gautam et al., 2013; Skendžić et al., 2021). These environmental factors also affect the survival of the biocontrol agent in any system (Ahanger, 2013).
2 Climate change and its effect on wheat crop diseases
Climate change has been observed to affect the incidence of plant diseases and the growth of pathogens. In some cases, climatic conditions favored the spread of plant diseases (Juroszek and von Tiedemann, 2013; Seidel, 2014), while in other cases, climate had little to no impact on the progress of plant diseases (Chakraborty et al., 2000; Juroszek and von Tiedemann, 2013). The growth of wheat varies according to the altitude and different rainfall regions in South Africa, either in the summer or winter. The winter rainfall areas support the optimal growth of spring wheat cultivars while the high altitude summer rainfall areas support the growth of winter and intermediate wheat cultivars, and the warm western irrigation areas grow in mostly spring-type cultivars (Jordaan, 2002). The development of stem rust, stripe rust, and leaf rust disease of wheat caused by Puccinia graminis Pers. f. sp. tritici (Pgt), P. striiformis f. sp. tritici (Pst), and P. triticina Eriks (Pt), respectively, varies in their distribution across the wheat-growing regions (Pretorius et al., 2007). Thus, it is clear that environmental factors are very important in the establishment of diseases in plants (Table 1).
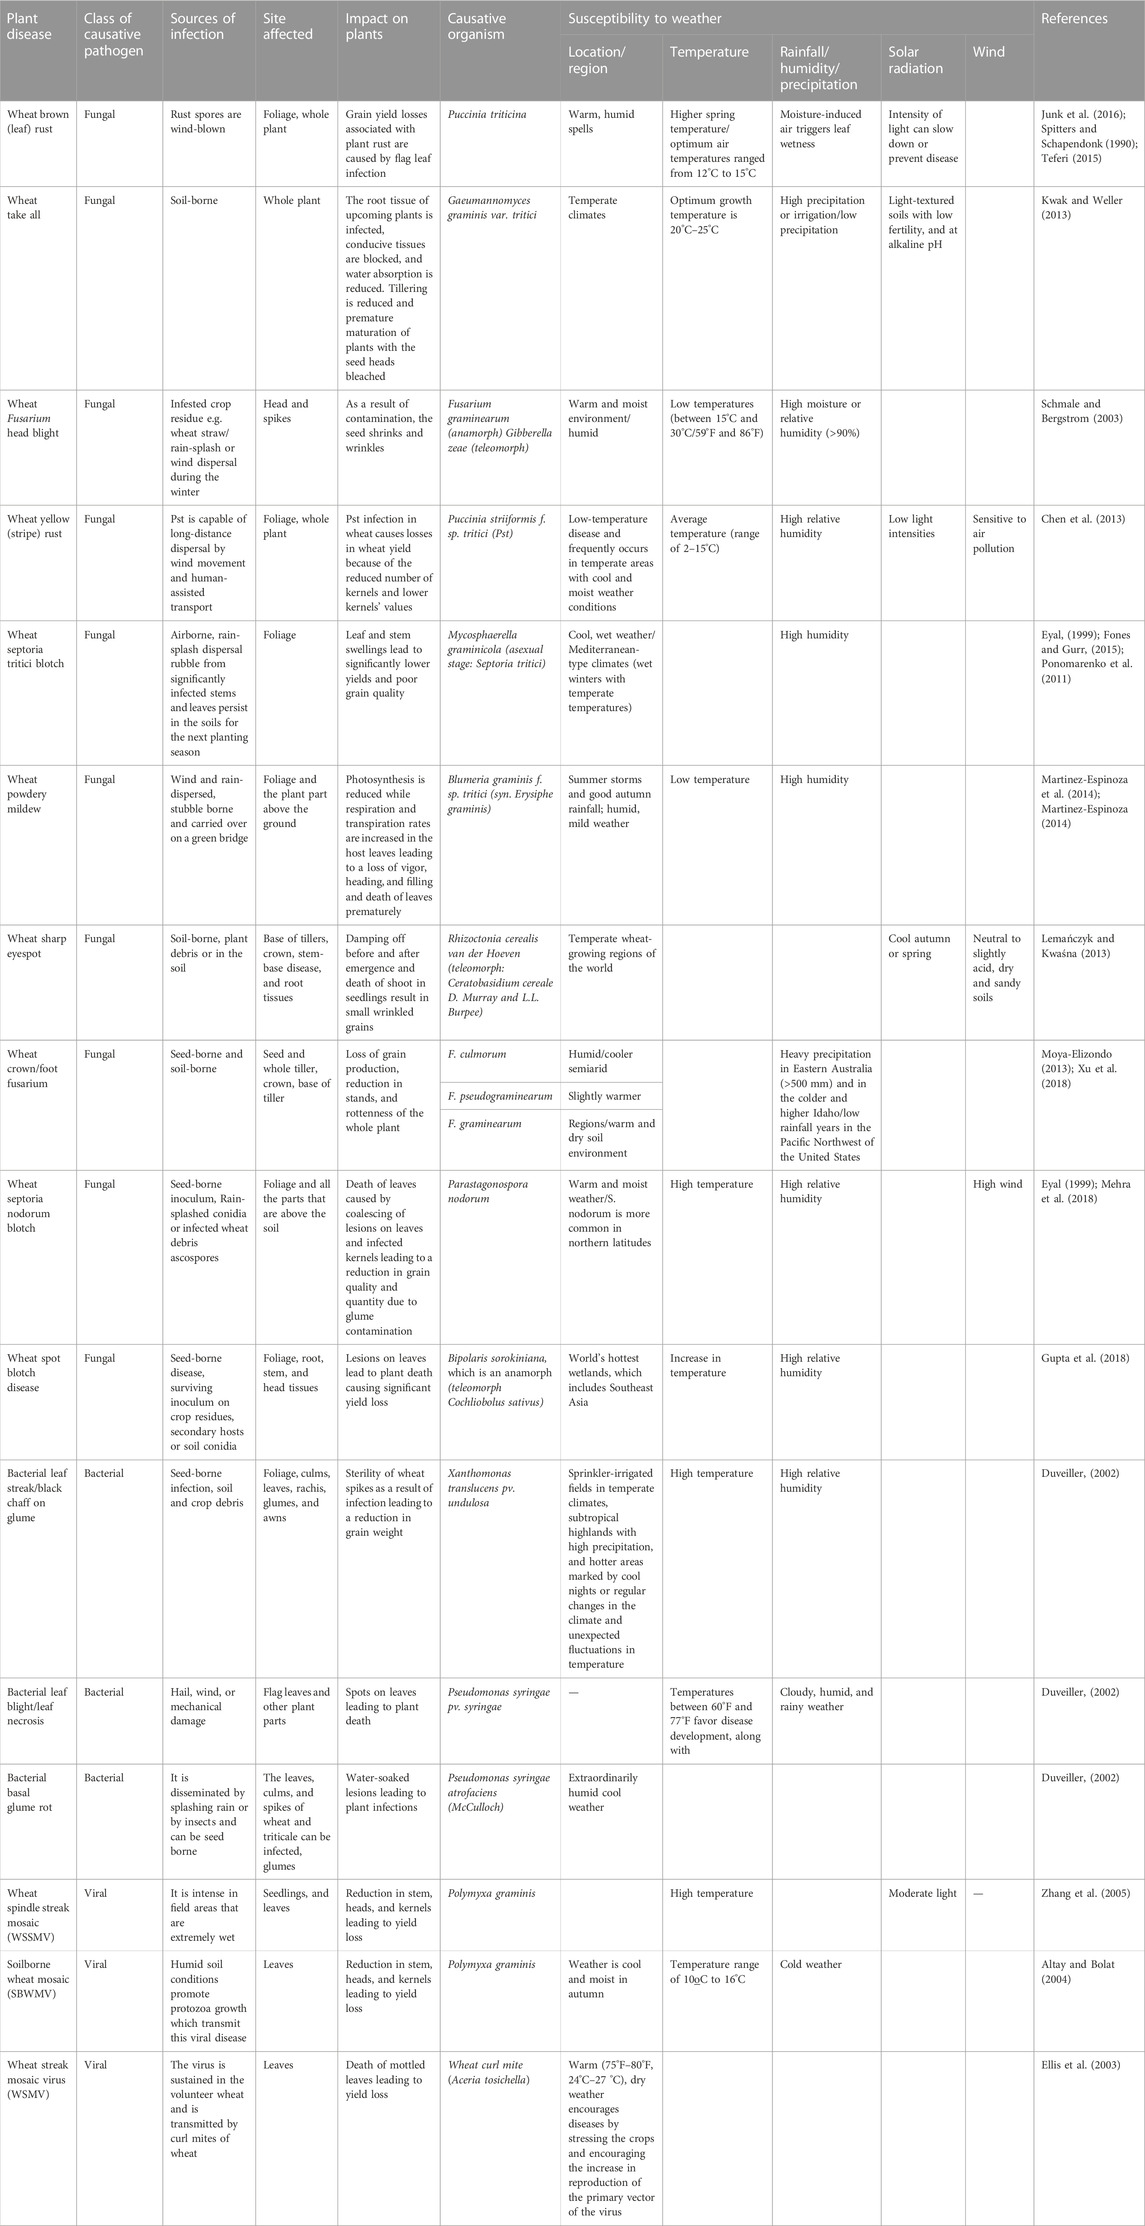
TABLE 1. Climate change and implication on plant disease susceptibility.
It has been observed that areas with high elevations had lower disease incidence in cereals compared with areas with lower altitude, probably due to variations in the temperature. This brings into perspective the classic disease triangle, which includes the interaction between the plant, deleterious microbe, and the ecosystem (including weather conditions) (Ghini et al., 2008). Humidity, heat, and wind are the three main climatic factors that increase the outbreaks of the wheat rusts diseases, even though in some wheat growing areas globally, an increase in temperature may decrease growth, development, and survival of some pathogens (Luck et al., 2011).
An alert system for wheat rusts should be established as part of the preventive strategies for combating wheat stem rust. This will include the use of weather data to forecast and provide advisories dependent on different climate and weather conditions (Saunders et al., 2019).
3 Climatic change impact on the development process of wheat diseases
Some of the climatic factors that affect the development process of plant diseases include, temperature, water availability/rainfall/precipitation, and carbon dioxide concentration (Helfer, 2014). Because crop diseases are greatly impacted by environmental conditions, a plant host will not be affected by a disease pathogen even if it is virulent, especially in a situation where climatic conditions are not favorable for pathogen establishment and disease progression (Velásquez et al., 2018). With changes in the climate pattern, the ability of plant pathogens to adjust to the environmental changes keeps changing, which results in new bacterial infections. Plants, pathogens, and the environment form the disease triangle because for a disease to occur, there must be an interplay between these three factors (Figure 1) (Velásquez et al., 2018; Ajilogba and Walker, 2020).
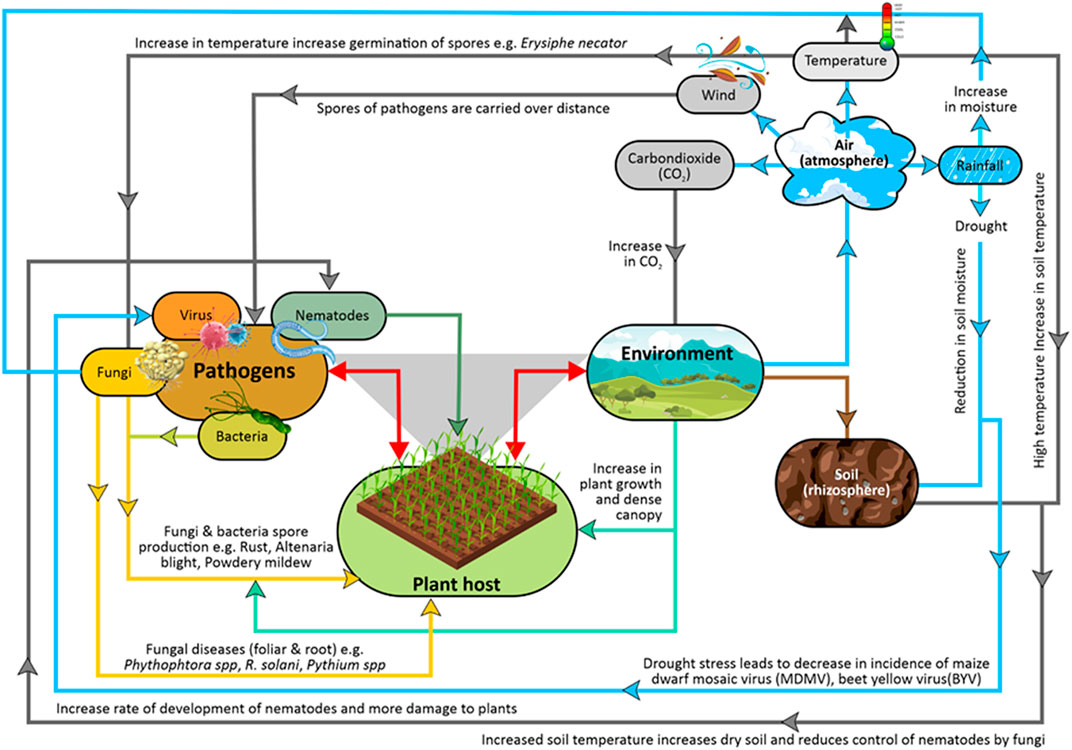
FIGURE 1. Schematic diagram of how climate affects the spread of plant diseases.
As both plants and disease pathogens have optimal conditions under which they will grow and reproduce, environmental conditions then must be favorable for this to happen (Juroszek and von Tiedemann, 2013; Velásquez et al., 2018).
In recent times, when the temperature was warm during winter, wheat head blight thrived in China. The stripe rust’s causative pathogen Puccinia striiformis was able to cause infection in the field experiment at a temperature range between 18°C and 30°C. This optimal temperature range helped the fungus to grow, establish, and be able to cause an infection (Velásquez et al., 2018). Furthermore, it is observed that warm winter temperatures also encouraged the infection rate of stem rust in wheat caused by the fungus Puccinia graminis f. sp. tritici. This is because, sometimes during the winter, wheat plants mature early and they are not able to withstand the accumulation of stem rust pathogen inoculum as was also observed in Germany in 2013 (Olivera Firpo et al., 2017; Saunders et al., 2019).
Furthermore, the geographical distribution of hosts and pathogens will alter as it is clear that the location where wheat is grown can impact the health of the crop as climate variability increases. For example, in the United Kingdom, there is a high probability that by the middle of this century, Fusarium head blight disease incidence will increase according to the analysis by Juroszek and von Tiedemann, 2013, while the opposite will be the case in France for Septoria tritici blotch disease incidence, which will decrease. This means that, even though climate change is affecting plants negatively, there is hope that climatic change may also improve the health situation of wheat crops depending on the location. Using experimental observation data in China, the increase or decrease in wheat production was varied based on the regional climate, as wheat yields in Northern China rose by 1%–13%, while in Southern China, it reduced by 1%–10% (Wang et al., 2018).
As the level of atmospheric carbon dioxide (CO2) increases, the disease severity in wheat (780 ppm) also increases (Váry et al., 2015). When the CO2 level increases for the fungal pathogen Fusarium graminearum, the virulence of the causative agent of Fusarium wheat head blight increases, and different varieties of the wheat plant become highly susceptible. This is turn results in increased overall severity of the diseases (Váry et al., 2015). As temperature and carbon dioxide increases, there is also an increase in the fecundity of fungi (Chakraborty and Newton, 2011).
Thompson et al. (2014) suggested that the elevated and increasing temperature can increase the range of plant pathogens and thereby increase the range of plant infections and diseases. Furthermore, the spread of wheat diseases such stripe rust (Puccinia striiformis) is increased. It has been observed that migration of pathogenic rhizospheric nematodes would increase by over 160 km to the north as the temperature rises by 1°C (Dixon, 2012). In the United States, warmer and increased temperature has led to the increase in the emergence of Puccinia striiformis f. sp. tritici strains that are adapted to warmer temperatures. They are also resistant to wheat genes Yr8 and Yr9 (Gautam et al., 2013).
Disease development and severity is also increased because of rainfall, precipitation, high soil moisture, and air humidity for most plant bacterial and fungal infections (Pietraszko et al., 2018). The amount of time that water from rain, dew, and humidity stays on a leaf is also very critical for disease development from especially fungal pathogens. For example, for stripe rust infection caused by Puccinia striiformis to occur on a wheat plant, the leaf must have been wet for 5 h. In a situation where the sky is clear and it is not windy, the time needed for dew to accumulate on the leaf is longer. The opposite is the case when the temperature is higher; this will increase the amount of water vapor in the air and also increase the accumulation of dew which will invariably lead to an increased rate of disease infection (Rowlandson et al., 2015). Furthermore, for pathogenic rhizospheric microorganisms, soil moisture is very important in disease development, especially with wilting in plants (Velásquez et al., 2018).
Life cycles, growth stages, and development of pathogens and pests are also being affected by climate change, as host resistance and host–pathogen interactions are being modified (Chakraborty and Newton, 2011).
3.1 Rust diseases of wheat
One of the leading reasons for crop yield loss and food insecurity is plant diseases. They are important hindrances to the production of food and the value of such production. They are a threat to food security, as they can cause up to 10% loss of global food production (Strange and Scott, 2005). Diseases such as rusts on wheat not only affect the quality of food production but also the safety of the food when it is consumed by animals and humans and is thus a big concern (Chakraborty and Newton, 2011). Wheat rusts are one of the major plant diseases that cause economic losses across the world and, in particular, in South Africa as a result of the biotic stress factors caused in wheat (Singh et al., 2006). Wheat rusts are plant diseases caused by fungi and include stem rust (black rust), leaf rust (brown rust), and stripe rust (yellow rust) and are all found in South Africa. Warm temperatures (>20°C) favor the spread of stem and leaf rust while cooler temperatures encourage the growth of stripe or yellow rust (<15°C) (Terefe et al., 2016). According to Singh et al. (2011), 90% of wheat varieties grown worldwide are prone to Ug99 variety of the stem rust. Ug99 is a different variety of wheat stem rust fungus that is extremely virulent with Sr31 wheat varieties and was discovered in 1999 in Uganda (Schumann and Leonard, 2000). Stem rust is likely to reduce grain yields of susceptible varieties by 10%–50% with higher losses, up to 90%, reported in rare but more severe cases (Beard et al., 2005). In 1726, for the first time, wheat stem rust was discovered around the wheat-growing areas located in the southwest of Western Cape according to Pretorius et al., 2007. As it gradually became an epidemic, it spread and affected the Free State summer rainfall regions and Western Cape winter rainfall regions (Figlan et al., 2014).
The causative agent of stem rust is Puccinia graminis f. sp. tritici (pgt). Stem rust is important as one of wheat’s most devastating diseases globally, causing about 100% crop failure to the susceptible varieties under favorable climatic and soil characteristics (Leonard and Szabo, 2005). Of the three rust disease pathogens, pgt is highly aggressive and is a great concern for wheat farmers, breeders, and crop pathologists. This is because the disease pathogen can build up in the stem of the infected plant even a few weeks before harvest, and severely infected stems can prevent the flow of nutrients from the roots to the developing grain head, thereby leading to shriveled heads with little or no market value (Figlan et al., 2014).
4 Climate change, crop modeling, and their impact on wheat productivity
In order to mitigate the impact of pathogens and to develop models that will predict climate change, “plant disease models themselves must capture a thorough quantitative understanding of disease epidemiology and their reliability in disease forecasting must be proven through rigorous testing and validation” (Shaw, 2009). Furthermore, such models and management practices must include monitoring, forecasting, planning, and mitigation for diseases (Sturrock et al., 2011).
Due to the current relevance of wheat for food safety, various crop models were designed to model the growth and development of wheat crops. Some of these crop models include the Decision Support System for Agrotechnology Transfer (DSSAT) - CERES-Wheat, Nwheat, DSSAT-CROPSIM-Wheat, and the Agricultural Production Systems Simulator (APSIM)-Wheat model. According to Hussain et al. (2018), only the APSIM model had poor accuracy of the simulated performance of days to maturity of wheat compared to the other models (Asseng, 2015). A detailed list of wheat crop models and the purpose of their development and documentation are given in Table 2.
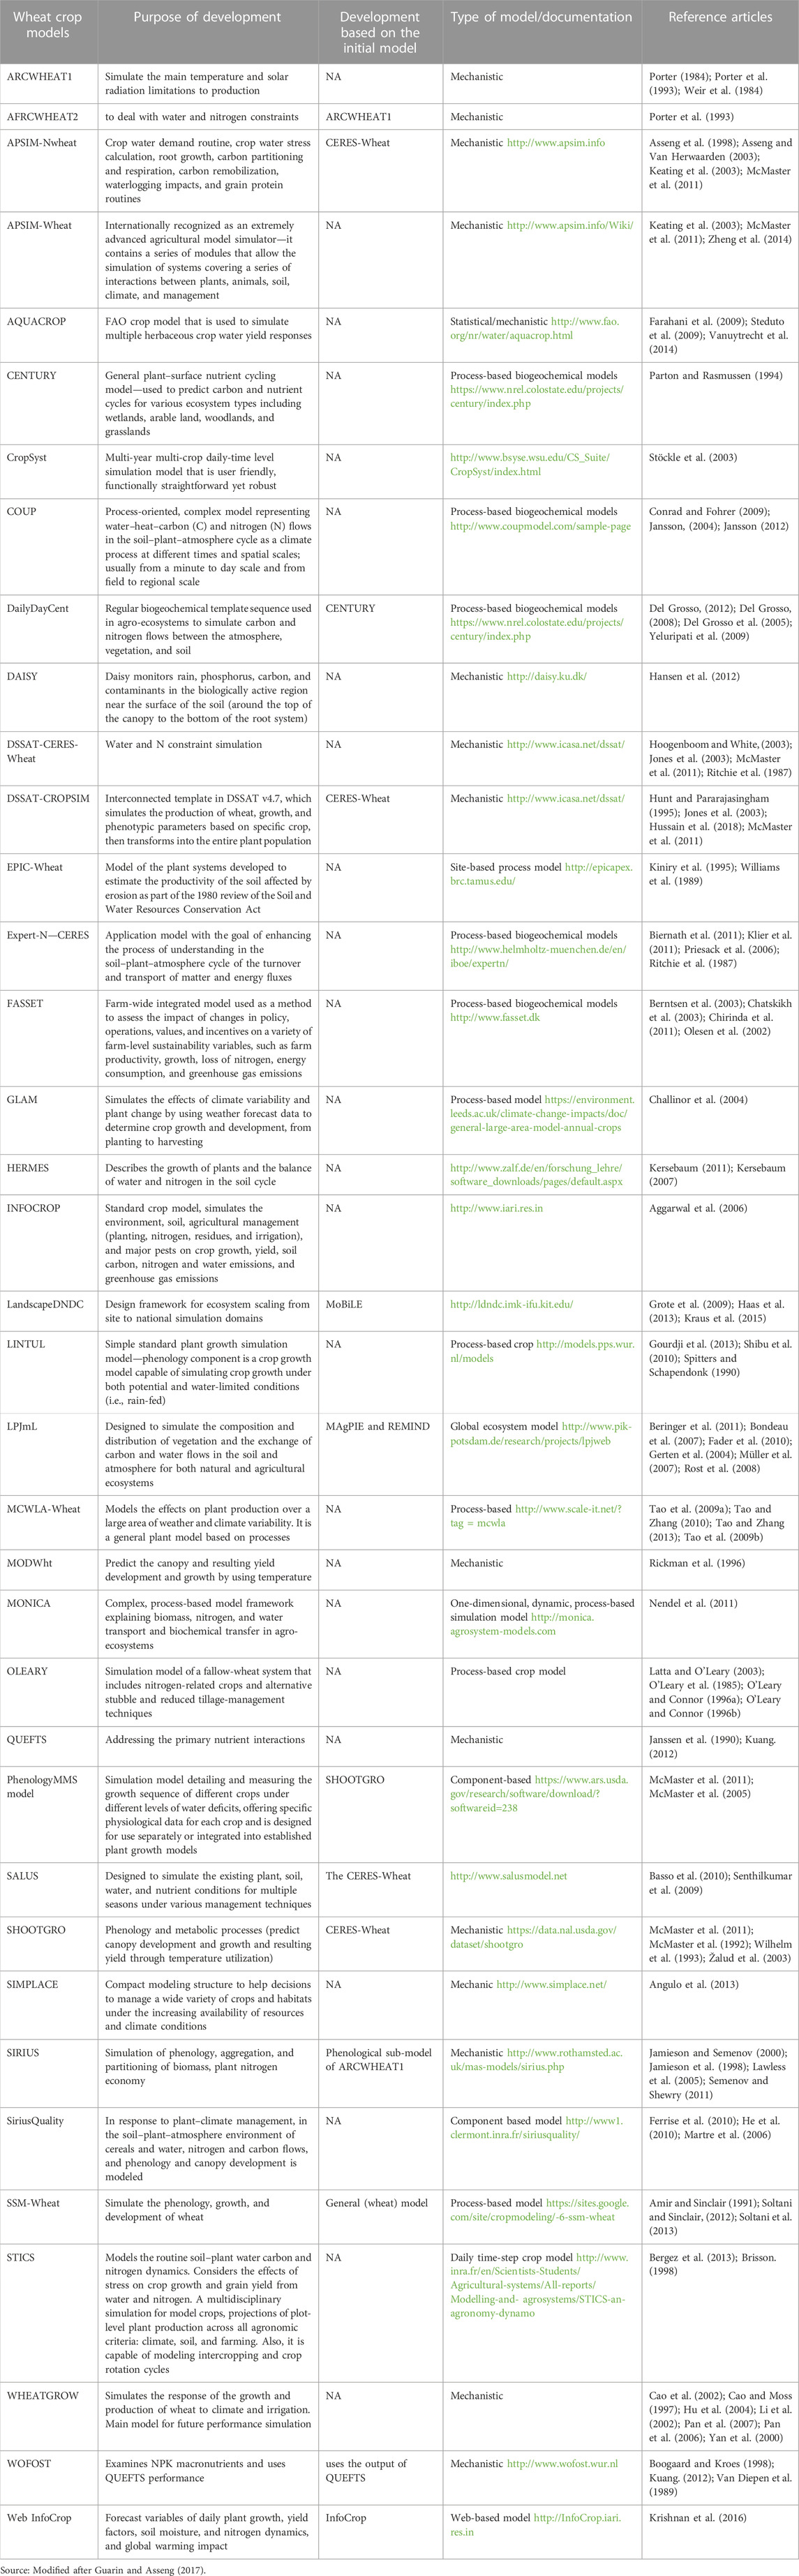
TABLE 2. Overview of wheat crop models with the purpose of their development and documentation.
Using the CropSyst model to assess crop growth and yield of 14 wheat varieties in the study by Sommer et al. (2013), elevated temperature resulted in early and fast growth of wheat. Simulations also revealed that higher temperature during flowering could increase the risk of flower sterility and thus crop yield would be reduced. Zhao et al. (2017) found that temperature increase decreased the global wheat yield by 6.0%, rice by 3.2%, maize by 7.4%, and soybean by 3.1% using multi-method analysis. The impacts of climate change have been studied on different wheat models based on different underlying factors such as management, nitrogen availability (Abeledo et al., 2008), rainfall or irrigation impact, differences in cultivar/genetic coefficient, water-use efficiency, and canopy level. In the study carried out by Valizadeh et al., 2014, it was observed that in Iran, using the CERES-Wheat model of DSSAT to simulate wheat growth in the future, wheat production was affected by climate change, possibly because of an increase in temperature and wheat growth rate. This means that different strategies to mitigate this climate change impact should be considered in order to manage the situation so that wheat can be properly adapted. It is also very interesting to note that climate change with an increase in temperature can also bring an increase in the yield based on location and topography, such as that which was observed in the simulation using the CERES-WHEAT model in Mexico from 1988 to 2002 (Janjua et al., 2010). In a mechanistic wheat model in northwestern Turkey, at a stable climatic condition, increased atmospheric CO2 led to an increase in wheat yield. But when the climate varied with temperature and precipitation, the winter wheat yield declined (between 5% and 35%) depending on the GCM inputs used (Özdoğan, 2011).
In China, several studies based on experimental observations have also shown that an increase in temperature increased wheat productivity. For the past 20 years, the impact of climate change has been positive in wheat production in North-Central China (Zhang and Huang, 2013; Zhai et al., 2017). It was also observed that wheat production increased in northern China but decreased in southern China by .9%–12.9% and 1.2%–10.2%, respectively, because of the climate change in temperature, precipitation, and solar radiation. This was also true for simulated future climate scenarios in the northern China plain using a new process-based model to capture the crop–weather relationship over a large area (MCWLA) and a new super ensemble-based probabilistic projection system (SuperEPPS) (Tao and Zhang, 2013; Tao et al., 2014; Zhai et al., 2017).
4.1 Crop modeling of wheat diseases
Use of crop modeling techniques as found in DSSAT (Jones and Thornton, 2003) and APSIM (Keating et al., 2003) can increase the diversity in the agricultural system in terms of control of plant diseases by increasing the resilience of the system to variability in the climate (Lin, 2011). This ultimately leads to increasing and maintaining of high yields in crop production (Lin, 2011). In the study by Savary and Willocquet, 2014, an applied simulation model was proposed for the estimation of disease risk using the DSSAT model and/or the APSIM model. The GENEPEST is a good example of the simulation of crop growth, yield including yield losses. This was done by incorporating the presence/absence of damage/destructions caused by pests into the crop growth model GENECROP. (Savary and Willocquet, 2014). Using the DYMEX-APSIM crop disease model to simulate the rust disease of wheat, it was showed that the model was able to predict the disease proportion in some of the years examined and was able to change the development of the wheat plant to the rust population that was growing (Whish et al., 2015). This invariably translates to improved crop growth and yield.
In order to reduce the usage of chemicals such as fungicides and to increase the crop yield in the midst of plant disease epidemics, two risk models were used to collect decisions on the control of leaf blotch disease in wheat (caused by Zymoseptoria tritici, Parastagonospora nodorum, and Pyrenophora tritici-repentis) (Jørgensen et al., 2020). The two risk models, Crop Protection Online (CPO) and humidity model (HM), both use precipitation and relative humidity to determine the need for fungicide application. Using the models forecasted, very few treatments thereby reduced the amount of chemicals applied before disease inception, leading to 95% correctness in prediction during the 2018 trials (Jørgensen et al., 2020).
A site-specific model (coffee leaf rust model) and hhh4 model (spatial) were evaluated in predicting wheat stripe (yellow) rust caused by (Puccinia striiformis f.sp. tritici) in Alberta, Canada. These two models were effective in reproducing the observed pattern of the disease, with the hhh4 model having the highest forecast accuracy. This disease prediction is important as a preventive measure to forestall crop disease epidemics and thereby reducing crop losses to diseases (Newlands, 2018).
Optimal weather conditions are important for the development of wheat rust diseases with temperature and moisture as the major environmental factors that increase disease severity and limit regional production and the yield of wheat species. So, in order to control these lethal wheat diseases, in-depth knowledge of the requirements of the host plant, the disease cycles of the pathogen, and the environmental factors influencing the cycle are required (Rodríguez-Moreno et al., 2020). Using two weather-based models and lassification and regression trees (CARTs) for data analysis, Rodríguez-Moreno et al. (2020) were able to predictively forecast the presence of leaf rust (LR) and stripe rust (SR) on wheat in Mexico. These predictions are important as early warning systems to enhance informed strategies to reduce yield losses due to the rust diseases.
The forecasting of the pattern of spread of wheat diseases is a preventive measure that can be used to give governments, authorities, and farmers enough time to act in order to prevent crop losses using satellite imagery, machine learning, and forecasting models in Europe based on the study by Patil et al. (2018).
4.2 Impact of crop modeling on wheat rust/crop disease control
It is now very clear that the effect of change in climate on plant diseases leading to yield loss is enormous, and weather forecasts and projections are being used by researchers to combat this challenge (Collins, 2013; Morley and Lewis, 2014; Newlands, 2018). Since climate variability affects the biology of pathogens both directly and indirectly, this interaction and the impact on crop yield is made available by the inclusion of crop models in such assessments (Sparks et al., 2014; Zhang et al., 2014; Duku et al., 2016) (Figure 2).
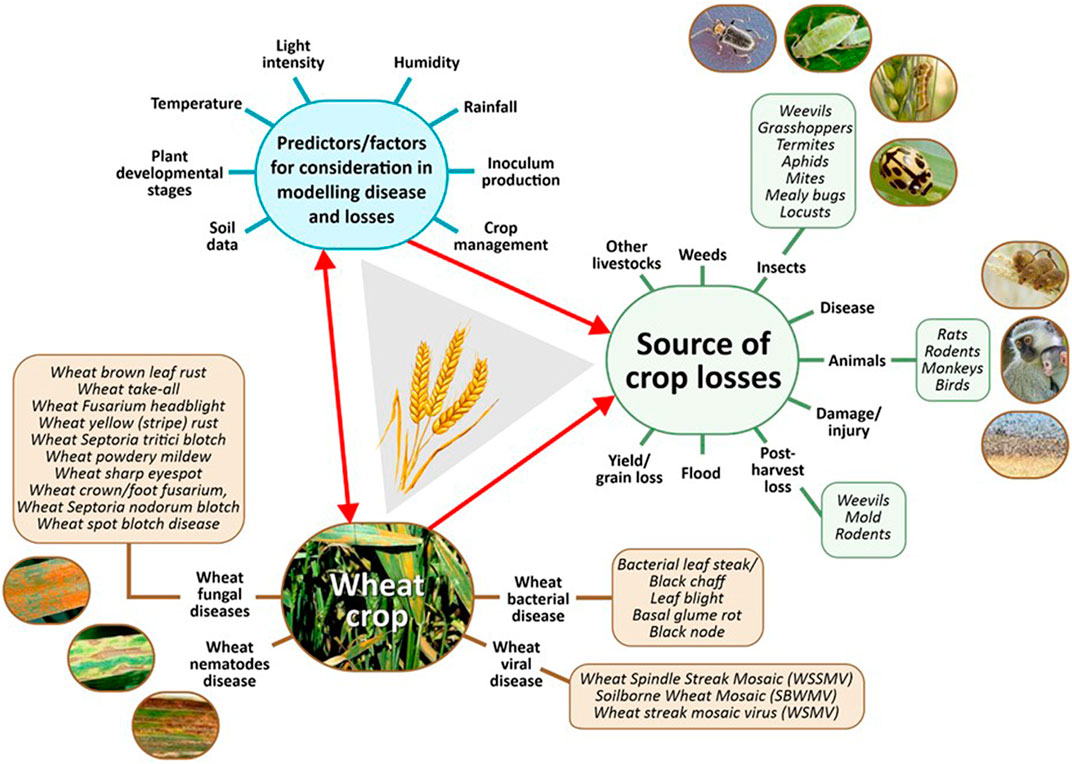
FIGURE 2. Factors involved in crop modeling of wheat disease.
According to Madgwick et al. (2011), a wheat growth model and a weather-based model were used for forecasting the dates of wheat anthesis and Fusarium ear blight incidences, respectively, in a research carried out in the United Kingdom. The projections showed that the anthesis date will be earlier while disease incidence will be more severe. Such relationships and predictions are very important to improve the control of disease incidence and formulation of adaptive measures to ensure food security. The average annual wheat losses to diseases in Australia were estimated at 913 million dollars or $76.64 per hectare (Murray and Brennan, 2009).
According to Newlands (2018), in a study on the wheat stripe rust disease, crop modeling had the ability to provide advice about implementing some measure of control of crop diseases in fields or on farms in record time such that it is an effective and preventive measure using an integrated forecasting approach. It is also important in helping reduce crop losses while reducing financial costs and the effect on the environment. The study concluded that crop modeling using a forecasting approach and data from the satellite monitoring of disease inoculum in the air when used by farmers could be a preventive approach against multiple disease threats while protecting crops.
4.3 Crop growth models’ gaps, challenges, and possible interventions
The purpose of a model or what the model aims to achieve determines the data to be collected (Harou et al., 2021). A constant challenge to crop model simulation, especially for future crop performance projections and impact studies under varied conditions, is the unavailability of reliable historical data for model calibrations (Kephe et al., 2021). The historical data available are also not consistent for different locations and crops, and the same inconsistency is observed with the parameters collected and the units in which they were collected. That means that the amount of available input data may not be sufficient, and the type of input data to drive the crop models may also not be available (Lüke and Hack, 2017). For example, apart from the fact that data units may be different from what the modeler is used to, the modeler may not be able to do the conversion from one unit to another. Furthermore, using climate data as another example, if the climate data available are coded in a programming language unfamiliar to the modeler, then the data will be available but of no use to the modeler.
It is also clear that one model cannot solve all agricultural challenges even though it has been a challenge as modelers sometimes are tempted to use a one-size-fit-all approach in modeling. Therefore, to face the diversity in modeling, modelers will certainly have to adopt some approaches that will be able to inculcate these challenges, maybe not in one model but in several models interconnected together (Boote et al., 1996; Gary et al., 1998). The use of a particular model should depend on whether the complexity of the model is able to answer the research question and whether the model has been tested in diverse environments. As a result of this, there should be need for both complex and simple models, and depending on the research question, either complex or simple models could be used or both could be coupled and integrated (Ewert et al., 2015).
However, integration of models also has its own pros and cons. Ewert et al. (2015) emphasized that crop models must link with other sub-models by providing information and responding to information needed by those sub-models in such a way that there is a feedback mechanism between models. This could be done in such a way that the output from a model is the input for another model and there must be compatibility in terms of units and scales.
Furthermore, parameters should be in place and be agreed upon to determine what makes a model simple or complex. This is because, in some cases, simple models are not appropriate, as they are not programmed to address the particular phenomenon in question, which means they were programmed for other phenomena. However, in other cases, complex models are not appropriate because they may require more input data that are not feasible to obtain in a field situation and so cannot be used to run the simulation (Boote et al., 1996). It is also important that modelers inform themselves on the capabilities of models, what the models can do, what they cannot do, and the assumptions under which the models can run. Even though minimum data are advocated for crop models, these minimum data are also not available and not accessible (Kasampalis et al., 2018).
Even though the study by Zinyengere et al. (2015) in South Africa with minimum data was able to simulate crop yield in specific locations using DSSAT, studies by Gaiser et al. (2010) using EPIC and Raes et al. (2017) using Aquacrop observed that use of limited data impacted the result from these models thereby assumed to be a challenge for crop modeling.
It is also important to note that some public and private companies, institutions, and organizations have done thorough investigations, experiments, and data collection about several crops; these data, if available to the public, can be used to resolve the issues of qualitative and quantitative data in specific locations and for specific crops. The use of databases is also important, and acknowledgement of the use for the data from the original depositor should be encouraged, especially with private establishments (Kephe et al., 2021).
Furthermore, the use of spatial data over regions may also be another solution even though it is thought to be an arduous task, and there are different limitations to coupling it with crop models, which include the low spatial resolution of satellites and missing information from the collected data because of the frequency of using remote sensing. Spatial data can be used where, due to poor growth conditions, plant models are not able to identify a solution (Kumari, 2020).
It is worth noting that because weather data are not available in every location where crops are grown, the Geographical Information System (GIS) approach has opened a whole field of crop modeling applications at the spatial scale—from the field level for site-specific management to the regional level for productivity analysis and food security (Hoogenboom, 2000; Murthy, 2004; Resop et al., 2012).
Furthermore, using the examples of models such as APSIM (Al-Azri et al., 2015) and DSSAT with examples of crop disease simulations underway, there should be more disease models for different crop diseases which can then be coupled with any of the wheat growth models having numerical weather forecasting. These disease models should consider seasonalities as well as the climate suitability for such wheat diseases.
Using the example of wheat blast, a new wheat model has been created in DSSAT which is under validation in Brazil and Bangladesh, and can predict the yield in the presence or absence of the wheat blast disease (Krupnik, 2019; Molero Milan et al., 2019).
4.4 Future perspective using crop disease models
The use of a decision support system has been ongoing to predict future crop yield and agricultural productivity in the face of environmental factors that can enhance the onset of crop disease. To forestall the wastage of resources and prevent disease progression, disease forecasting and integration of decision support systems for managing plant diseases are important (Figure 3).
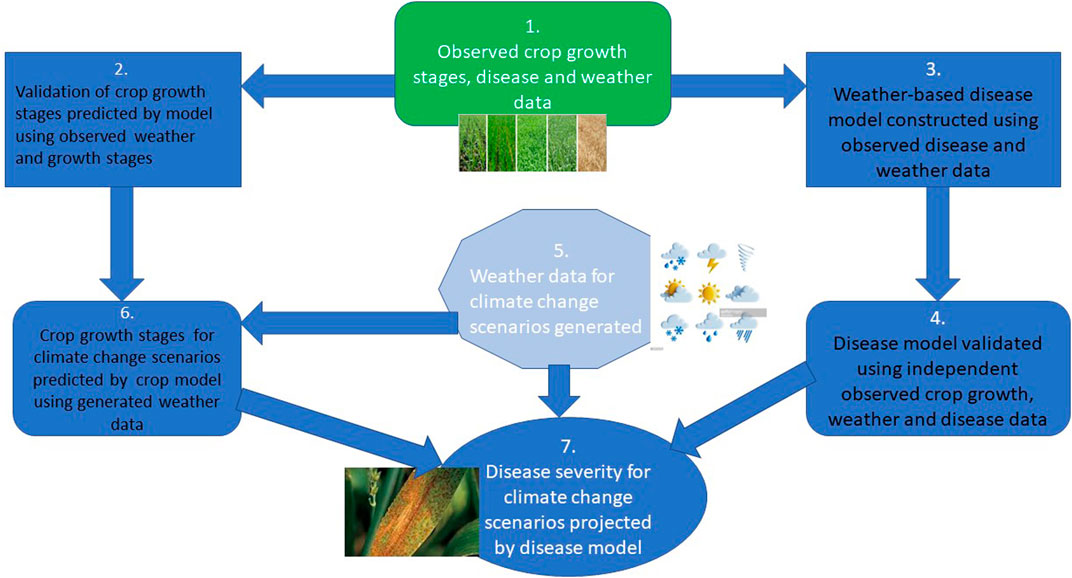
FIGURE 3. An illustration of how climate, crop growth, and disease models can be combined to produce projections of crop growth stages and disease incidence/severity for different climate change scenarios (Source: Modified after Newbery et al., 2016).
Crop disease modeling and forecasting involve predicting the occurrence of a plant disease in a specified area, location, or region ahead of time, so that suitable preventive and control measures can be undertaken in advance to avoid losses (Martinelli et al., 2015; Charaya et al., 2021).
Because of advancements in computer technology, it is now possible to create computer programs that simulate outbreaks of plant diseases. Some of the crop disease models that have been developed and used previously include BLITECAST (for late blight of potato), TOM-CAST (for tomato early blight), PLASMO (for downy mildew of grapes), EPIBLAST (for rice blast), and “Indian Stem Rust Rules”, JHULSACAST (Charaya et al., 2021).
Other computer simulation models that were created that have helped to produce an immense understanding of mechanisms affecting disease epidemics include EPIDEM (early blight of tomato and potato), CERCOS (Cercospora blight of celery), MYCOS (Mycosphaerella blight of chrysanthemum), EPICORN (Southern corn leaf blight), and EPIVEN (apple scab). These models were all created to fit into different locations to prevent an outbreak of plant diseases (Charaya et al., 2021).
Some of the crop disease models that have been developed for wheat are black stem rust of wheat, brown rust of wheat in India, and EPIDEMIC for stripe rust of wheat. It is worth noting that crop disease modeling is location-specific based on the environmental and climatic factors in such areas (Newbery et al., 2016; Donatelli et al., 2017). Even though there are no such models for wheat diseases in South Africa yet, with data collection of pathogen, plants, and environment, the emergence of new information and communication technologies (ICT) such as Internet of Things (IoT), remote sensing, Geographic Information Systems (GIS), and Global Positioning Systems (GPS), which have revolutionized precision farming in the last few decades, can be a new research area in precision agriculture in South Africa.
5 Conclusion
The use of crop modeling to forecast crop diseases is a new and upcoming field of research that should be embraced, as it will work on the principle of “prevention is better than cure.” This is because this concept will help predict the impact and effect of the different climatic factors on the different growth stages, with application to wheat production as a pilot, then later to other crops in general. Furthermore, it will help predict which favorable conditions for microbe growth and development have been activated as a result of the climatic factors.
Under the current advances in technology and modeling expertise, it is now possible to incorporate the template of a calibrated crop and disease model to use the current weather forecast as an input to the combined models, following an update to the current time position in the growing season so as to provide an outlook for possible disease infestations in the following 10–14 days for a current weather forecast, etc. This combination will also make it possible for other modules to be incorporated, such as a module on the effect of weather conditions on pesticide and fungicide spray activities. This will be possible when parameters such as heat, wind, and humidity are available in the model to give advice for when and when not to spray the field.
Ultimately, farmers and stakeholders can be advised on the impacts of this chain reaction on crop yield and crop productivity. They can also be advised on the timing of management practices that can reduce the creation of favorable conditions for pathogenic microbial growth, development, and spread.
Furthermore, data collection for crop disease modeling can be carried out systematically, considering the use of artificial intelligence (AI) techniques, machine learning (ML), and deep learning (DL) techniques, as they are playing a pivotal role in the analysis of big data in order to confer useful findings that can help chart the way forward in crop disease modeling.
Author contributions
CA and SW conceived the project, CA carried out the project, and SW supervised the project. Both wrote the manuscript.
Acknowledgments
The authors would like to thank the National Research Foundation for the post-doctoral grant to the first author and the Agricultural Research Council—Soil, Climate, and Water for logistical support.
Conflict of interest
The authors declare that the research was conducted in the absence of any commercial or financial relationships that could be construed as a potential conflict of interest.
Publisher’s note
All claims expressed in this article are solely those of the authors and do not necessarily represent those of their affiliated organizations, or those of the publisher, the editors, and the reviewers. Any product that may be evaluated in this article, or claim that may be made by its manufacturer, is not guaranteed or endorsed by the publisher.
References
Abeledo, L. G., Savin, R., and Slafer, G. A. (2008). Wheat productivity in the Mediterranean Ebro Valley: Analyzing the gap between attainable and potential yield with a simulation model. Eur. J. Agron. 28 (4), 541–550. doi:10.1016/j.eja.2007.12.001
Aggarwal, P. K., Kalra, N., Chander, S., and Pathak, H. (2006). InfoCrop: A dynamic simulation model for the assessment of crop yields, losses due to pests, and environmental impact of agro-ecosystems in tropical environments. I. Model description. Agric. Syst. 89 (1), 1–25. doi:10.1016/j.agsy.2005.08.001
Ahanger, R. A. (2013). Impact of climate change on plant diseases. Int. J. Mod. Plant Animal Sci. 1 (3), 105–115.
Ajilogba, C. F., and Babalola, O. O. (2013). Integrated management strategies for tomato Fusarium wilt. Biocontrol Sci. 18 (3), 117–127. doi:10.4265/bio.18.117
Ajilogba, C. F., and Babalola, O. O. (2016). RAPD profiling of Bacillus spp with PGPR potential and their effects on mineral composition of tomatoes. J. Hum. Ecol. 56 (1-2), 42–54. doi:10.1080/09709274.2016.11907036
Ajilogba, C. F., and Walker, S. (2020). “Climate change adaptation: Implications for food security and nutrition,” in African handbook of climate change adaptation (Cham: Springer Nature).
Al-Azri, M., Leibovici, D., Karunaratne, A., and Ray, R. (2015). Simulating eyespot disease development and yield loss using APSIM for UK wheat. Procedia Environ. Sci. 29, 256–257. doi:10.1016/j.proenv.2015.07.192
Altay, F., and Bolat, N. (2004). Effect of soilborne wheat mosaic virus on winter wheat yield and yield components. Acta Agron. Hung. 52 (3), 309–317. doi:10.1556/aagr.52.2004.3.12
Amein, T., Omer, Z., and Welch, C. (2008). Application and evaluation of Pseudomonas strains for biocontrol of wheat seedling blight. Crop Prot. 27 (3), 532–536. doi:10.1016/j.cropro.2007.08.007
Amir, J., and Sinclair, T. (1991). A model of water limitation on spring wheat growth and yield. Field Crops Res. 28 (1-2), 59–69. doi:10.1016/0378-4290(91)90074-6
Angulo, C., Rotter, R., Lock, R., Enders, A., Fronzek, S., and Ewert, F. (2013). Implication of crop model calibration strategies for assessing regional impacts of climate change in Europe. Agric. For. Meteorology 170, 32–46. doi:10.1016/j.agrformet.2012.11.017
Asseng, S., Keating, B., Fillery, I., Gregory, P., Bowden, J., Turner, N., et al. (1998). Performance of the APSIM-wheat model in western Australia. Field Crops Res. 57, 163–179. doi:10.1016/s0378-4290(97)00117-2
Asseng, S. (2015). Rising temperatures reduce global wheat production. Nat. Clim. Change 5 (2), 143.
Asseng, S., and Van Herwaarden, A. (2003). Analysis of the benefits to wheat yield from assimilates stored prior to grain filling in a range of environments. Plant Soil 256 (1), 217–229. doi:10.1023/a:1026231904221
Baffoni, L., Gaggia, F., Dalanaj, N., Prodi, A., Nipoti, P., Pisi, A., et al. (2015). Microbial inoculants for the biocontrol of Fusarium spp. in durum wheat. BMC Microbiol. 15 (1), 242. doi:10.1186/s12866-015-0573-7
Basso, B., Cammarano, D., Troccoli, A., Chen, D., and Ritchie, J. T. (2010). Long-term wheat response to nitrogen in a rainfed Mediterranean environment: Field data and simulation analysis. Eur. J. Agron. 33 (2), 132–138. doi:10.1016/j.eja.2010.04.004
Beard, C., Thomas, G., Loughman, R., and Jayasena, K. (2005). Managing stripe rust and leaf rust of wheat. Western Australia: Farmnote. Department of Agriculture, Govternment of Western Australia.
Bergez, J. E., Chabrier, P., Gary, C., Jeuffroy, M., Makowski, D., Quesnel, G., et al. (2013). An open platform to build, evaluate and simulate integrated models of farming and agro-ecosystems. Environ. Model. Softw. 39, 39–49. doi:10.1016/j.envsoft.2012.03.011
Beringer, T., Lucht, W., and Schaphoff, S. (2011). Bioenergy production potential of global biomass plantations under environmental and agricultural constraints. GCB Bioenergy 3 (4), 299–312. doi:10.1111/j.1757-1707.2010.01088.x
Berntsen, J., Petersen, B. M., Jacobsen, B. H., Olesen, J. E., and Hutchings, N. (2003). Evaluating nitrogen taxation scenarios using the dynamic whole farm simulation model FASSET. Agric. Syst. 76 (3), 817–839. doi:10.1016/s0308-521x(02)00111-7
Biernath, C., Gayler, S., Bittner, S., Klein, C., Hogy, P., Fangmeier, A., et al. (2011). Evaluating the ability of four crop models to predict different environmental impacts on spring wheat grown in open-top chambers. Eur. J. Agron. 35 (2), 71–82. doi:10.1016/j.eja.2011.04.001
Bondeau, A., Smith, P. C., Zaehle, S., Schaphoff, S., Lucht, W., Cramer, W., et al. (2007). Modelling the role of agriculture for the 20th century global terrestrial carbon balance. Glob. change Biol. 13 (3), 679–706. doi:10.1111/j.1365-2486.2006.01305.x
Boogaard, H., and Kroes, J. (1998). Leaching of nitrogen and phosphorus from rural areas to surface waters in The Netherlands, Soil and water quality at different scales. Dordrecht: Springer, 321–324.
Boote, K. J., Jones, J. W., and Pickering, N. B. (1996). Potential uses and limitations of crop models. Agron. J. 88 (5), 704–716. doi:10.2134/agronj1996.00021962008800050005x
Bouanaka, H., Bellil, I., Harrat, W., Boussaha, S., Benbelkacem, A., and Khelifi, D. (2021). On the biocontrol by Trichoderma afroharzianum against Fusarium culmorum responsible of fusarium head blight and crown rot of wheat in Algeria. Egypt. J. Biol. Pest Control 31 (1), 68. doi:10.1186/s41938-021-00416-3
Bradáčová, K., Florea, A., Bar-Tal, A., Minz, D., Yermiyahu, U., Shawahna, R., et al. (2019). Microbial consortia versus single-strain inoculants: An advantage in PGPM-assisted tomato production? Agronomy 9 (2), 105. doi:10.3390/agronomy9020105
Bräunlich, S., Koller, T., Glauser, G., Krattinger, S. G., and Keller, B. (2021). Expression of the wheat disease resistance gene Lr34 in transgenic barley leads to accumulation of abscisic acid at the leaf tip. Plant Physiology Biochem. 166, 950–957. doi:10.1016/j.plaphy.2021.07.001
Brisson, N. (1998). Stics: A generic model for the simulation of crops and their water and nitrogen balances. I. Theory and parameterization applied to wheat and corn. Agronomie 18, 311–346. doi:10.1051/agro:19980501
Buttimer, C., McAuliffe, O., Ross, R. P., Hill, C., O’Mahony, J., and Coffey, A. (2017). Bacteriophages and bacterial plant diseases. Front. Microbiol. 8 (34), 34. doi:10.3389/fmicb.2017.00034
Cao, W., Liu, T., Luo, W., Wang, S., Pan, J., and Guo, W. (2002). Simulating organ growth in wheat based on the organ-weight fraction concept. Plant Prod. Sci. 5 (3), 248–256. doi:10.1626/pps.5.248
Cao, W., and Moss, D. (1997). Modelling phasic development in wheat: A conceptual integration of physiological components. J. Agric. Sci. 129 (2), 163–172. doi:10.1017/s0021859697004668
Chakraborty, S., and Newton, A. C. (2011). Climate change, plant diseases and food security: An overview. Plant Pathol. 60 (1), 2–14. doi:10.1111/j.1365-3059.2010.02411.x
Chakraborty, S., Tiedemann, A., and Teng, P. S. (2000). Climate change: Potential impact on plant diseases. Environ. Pollut. 108 (3), 317–326. doi:10.1016/s0269-7491(99)00210-9
Challinor, A., Wheeler, T., Craufurd, P., Slingo, J., and Grimes, D. (2004). Design and optimisation of a large-area process-based model for annual crops. Agric. For. Meteorology 124 (1-2), 99–120. doi:10.1016/j.agrformet.2004.01.002
Charaya, M., Upadhyay, A., Bhati, H., and Kumar, A. (2021). “Plant disease forecasting: Past practices to emerging technologies,” in Plant disease management strategies (Jodhpur, Agrobios (India): M/s AGROBIOS RESEARCH), 1–30.
Chatskikh, D., Olesen, J., Berntsen, J., Regina, K., and Yamulki, S. (2003). Simulation of effect of climate, soils and management on N2O emission from grassland. Biogeochemistry 76, 395–419. doi:10.1007/s10533-005-6996-8
Chen, W., Wellings, C., Chen, X., Kang, Z., and Liu, T. G. (2013). Wheat stripe (yellow) rust caused by Puccinia striiformis f. sp. tritici. Mol. Plant Pathol. 15, 433–446. doi:10.1111/mpp.12116
Chirinda, N., Kracher, D., Lægdsmand, M., Porter, J. R., Olesen, J. E., Petersen, B. M., et al. (2011). Simulating soil N2O emissions and heterotrophic CO2 respiration in arable systems using FASSET and MoBiLE-DNDC. Plant Soil 343 (1-2), 139–160. doi:10.1007/s11104-010-0596-7
Collins, M. (2013). “Long-term climate change: Projections, commitments and irreversibility,” in Climate change 2013-the physical science basis: Contribution of working group I to the fifth assessment report of the intergovernmental panel on climate change (Cambridge, United Kingdom and New York, NY, United States: Cambridge University Press), 1029–1136.
Conrad, Y., and Fohrer, N. (2009). A test of CoupModel for assessing the nitrogen leaching in grassland systems with two different fertilization levels. J. Plant Nutr. Soil Sci. 172 (6), 745–756. doi:10.1002/jpln.200800264
Cullen, R., Forbes, S. L., Grout, R., and Smallman, C. (2010). Evaluation of conservation biological control innovation in winegrowing. Nelson, New Zealand: New Zealand Agricultural amd Resource Economics Society (Inc). NZARES, 1–13.
Del Grosso, S. (2012). DayCent model simulations for estimating soil carbon dynamics and greenhouse gas fluxes from agricultural production systems. New York, NY, United States: Elsevier, 241–250.
Del Grosso, S. (2008). DAYCENT simulated effects of land use and climate on county level N loss vectors in the USA, Nitrogen in the Environment. Elsevier, 571–595.
Del Grosso, S. j., Mosier, A. R., Parton, W., and Ojima, D. (2005). DAYCENT model analysis of past and contemporary soil N2O and net greenhouse gas flux for major crops in the USA. Soil Tillage Res. 83, 9–24. doi:10.1016/j.still.2005.02.007
Dixon, G. R. (2012). Climate change–impact on crop growth and food production, and plant pathogens. Can. J. Plant Pathology 34 (3), 362–379. doi:10.1080/07060661.2012.701233
Donatelli, M., Magarey, R., Bregaglio, S., Willocquet, L., Whish, J., and Savary, S. (2017). Modelling the impacts of pests and diseases on agricultural systems. Agric. Syst. 155, 213–224. doi:10.1016/j.agsy.2017.01.019
Dong, O. X., and Ronald, P. C. (2019). Genetic engineering for disease resistance in plants: Recent progress and future perspectives. Plant physiol. 180 (1), 26–38. doi:10.1104/pp.18.01224
Duku, C., Sparks, A. H., and Zwart, S. J. (2016). Spatial modelling of rice yield losses in Tanzania due to bacterial leaf blight and leaf blast in a changing climate. Clim. Change 135 (3-4), 569–583. doi:10.1007/s10584-015-1580-2
Duveiller, E. (2002). Bacterial leaf streak and black chaff. Rome, Italy: FAO Plant Production and Protection Series FAO.
El-Sharkawy, H. H. A., Rashad, Y. M., and Ibrahim, S. A. (2018). Biocontrol of stem rust disease of wheat using arbuscular mycorrhizal fungi and Trichoderma spp. Physiological Mol. Plant Pathology 103, 84–91. doi:10.1016/j.pmpp.2018.05.002
Ellis, M., Rebetzke, G., Mago, R., and Chu, P. (2003). First report of Wheat streak mosaic virus in Australia. Australas. Plant Pathol. 32 (4), 808–553. doi:10.1111/j.1365-3059.2003.00933.x
Ewert, F., Rotter, R., Bindi, M., Webber, H., Trnka, M., Kersebaum, K., et al. (2015). Crop modelling for integrated assessment of risk to food production from climate change. Environ. Model. Softw. 72, 287–303. doi:10.1016/j.envsoft.2014.12.003
Eyal, Z. (1999). The Septoria tritici and Stagonospora nodorum blotch diseases of wheat. Eur. J. Plant Pathology 105 (7), 629–641.
Fader, M., Rost, S., Müller, C., Bondeau, A., and Gerten, D. (2010). Virtual water content of temperate cereals and maize: Present and potential future patterns. J. Hydrology 384 (3-4), 218–231. doi:10.1016/j.jhydrol.2009.12.011
Farahani, H. J., Izzi, G., and Oweis, T. Y. (2009). Parameterization and evaluation of the AquaCrop model for full and deficit irrigated cotton. Agron. J. 101 (3), 469–476. doi:10.2134/agronj2008.0182s
Ferrise, R., Triossi, A., Stratonovitch, P., Bindi, M., and Martre, P. (2010). Sowing date and nitrogen fertilisation effects on dry matter and nitrogen dynamics for durum wheat: An experimental and simulation study. Field Crops Res. 117 (2-3), 245–257. doi:10.1016/j.fcr.2010.03.010
Figlan, S., Cobus, L. R., Tarekegn, T., Willem, B., Botma, V., Hussein, S., et al. (2014). Wheat stem rust in South Africa: Current status and future research directions. Afr. J. Biotechnol. 13 (44), 4188–4199. doi:10.5897/ajb2014.14100
Fones, H., and Gurr, S. (2015). The impact of Septoria tritici Blotch disease on wheat: An EU perspective. Fungal Genet. Biol. 79, 3–7. doi:10.1016/j.fgb.2015.04.004
Fuhrer, J. (2003). Agroecosystem responses to combinations of elevated CO2, ozone, and global climate change. Agric. Ecosyst. Environ. 97 (1-3), 1–20. doi:10.1016/s0167-8809(03)00125-7
Gaiser, T., de Barros, I., Sereke, F., and Lange, F. M. (2010). Validation and reliability of the EPIC model to simulate maize production in small-holder farming systems in tropical sub-humid West Africa and semi-arid Brazil. Agric. Ecosyst. Environ. 135 (4), 318–327. doi:10.1016/j.agee.2009.10.014
Gary, C., Jones, J., and Tchamitchian, M. (1998). Crop modelling in horticulture: State of the art. Sci. Hortic. 74 (1-2), 3–20. doi:10.1016/s0304-4238(98)00080-6
Gautam, H., Bhardwaj, M., and Kumar, R. (2013). Climate change and its impact on plant diseases. Curr. Sci. 2013, 1685–1691.
Gerten, D., Schaphoff, S., Haberlandt, U., Lucht, W., and Sitch, S. (2004). Terrestrial vegetation and water balance—Hydrological evaluation of a dynamic global vegetation model. J. Hydrology 286 (1-4), 249–270. doi:10.1016/j.jhydrol.2003.09.029
Ghini, R., Hamada, E., and Bettiol, W. (2008). Climate change and plant diseases. Sci. Agric. 65 (SPE), 98–107. doi:10.1590/s0103-90162008000700015
Gómez, P., Rodríguez-Hernández, A., Moury, B., and Aranda, M. (2009). Genetic resistance for the sustainable control of plant virus diseases: Breeding, mechanisms and durability. Eur. J. Plant Pathology 125 (1), 1–22. doi:10.1007/s10658-009-9468-5
Gourdji, S. M., Mathews, K. L., Reynolds, M., Crossa, J., and Lobell, D. B. (2013). An assessment of wheat yield sensitivity and breeding gains in hot environments. Proc. R. Soc. B Biol. Sci. 280 (1752), 20122190. doi:10.1098/rspb.2012.2190
Grote, R., Lehmann, E., Brummer, C., Bruggemann, N., Szarzynski, J., and Kunstmann, H. (2009). Modelling and observation of biosphere–atmosphere interactions in natural savannah in Burkina Faso, West Africa. Phys. Chem. Earth, Parts A/B/C 34 (4-5), 251–260. doi:10.1016/j.pce.2008.05.003
Guarin, J. R., and Asseng, S. (2017). Wheat crop modelling to improve yields. In Achieving Sustainable Cultivation of Wheat 67, 107–141. doi:10.19103/AS.2016.0004.27
Gupta, P., Chand, R., Vasistha, N. K., Pandey, S. P., Kumar, U., Mishra, V. K., et al. (2018). Spot blotch disease of wheat: The current status of research on genetics and breeding. Plant Pathol. 67 (3), 508–531. doi:10.1111/ppa.12781
Haas, E., Klatt, S., Frohlich, A., Kraft, P., Werner, C., Kiese, R., et al. (2013). LandscapeDNDC: A process model for simulation of biosphere–atmosphere–hydrosphere exchange processes at site and regional scale. Landsc. Ecol. 28 (4), 615–636. doi:10.1007/s10980-012-9772-x
Hansen, S., Abrahamsen, P., Petersen, C. T., and Styczen, M. (2012). Daisy: Model use, calibration, and validation. Trans. ASABE 55, 1315–1333.
Harou, I. L., Whitney, C., Kung'u, J., and Luedeling, E. (2021). Crop modelling in data-poor environments–A knowledge-informed probabilistic approach to appreciate risks and uncertainties in flood-based farming systems. Agric. Syst. 187, 103014. doi:10.1016/j.agsy.2020.103014
He, J., Stratonovitch, P., Allard, V., Semenov, M. A., and Martre, P. (2010). Global sensitivity analysis of the process-based wheat simulation model SiriusQuality1 identifies key genotypic parameters and unravels parameters interactions. Procedia-Social Behav. Sci. 2 (6), 7676–7677. doi:10.1016/j.sbspro.2010.05.174
Helfer, S. (2014). Rust fungi and global change. New phytologist 201 (3), 770–780. doi:10.1111/nph.12570
Heydari, A., and Pessarakli, M. (2010). A review on biological control of fungal plant pathogens using microbial antagonists. J. Biol. Sci. 10 (4), 273–290. doi:10.3923/jbs.2010.273.290
Hoogenboom, G. (2000). Contribution of agrometeorology to the simulation of crop production and its applications. Agric. For. meteorology 103 (1-2), 137–157. doi:10.1016/s0168-1923(00)00108-8
Hoogenboom, G., and White, J. W. (2003). Improving physiological assumptions of simulation models by using gene-based approaches. Agron. J. 95 (1), 82–89. doi:10.2134/agronj2003.0082
Hu, J. C., Cao, W. X., Zhang, J. B., Jiang, D., and Feng, J. (2004). Quantifying responses of winter wheat physiological processes to soil water stress for use in growth simulation modeling. Pedosphere 14 (4), 509–518.
Hunt, L., and Pararajasingham, S. (1995). CROPSIM—wheat: A model describing the growth and development of wheat. Can. J. Plant Sci. 75 (3), 619–632. doi:10.4141/cjps95-107
Hussain, J., Khaliq, T., Ahmad, A., and Akhtar, J. (2018). Performance of four crop model for simulations of wheat phenology, leaf growth, biomass and yield across planting dates. PloS One 13 (6), e0197546. doi:10.1371/journal.pone.0197546
Jamieson, P., Semenov, M., Brooking, I., and Francis, G. (1998). Sirius: A mechanistic model of wheat response to environmental variation. Eur. J. Agron. 8 (3-4), 161–179. doi:10.1016/s1161-0301(98)00020-3
Jamieson, P., and Semenov, M. (2000). Modelling nitrogen uptake and redistribution in wheat. Field Crops Res. 68 (1), 21–29. doi:10.1016/s0378-4290(00)00103-9
Janjua, P. Z., Samad, G., Khan, N. U., and Nasir, M. (2010). Impact of climate change on wheat production: A case study of Pakistan. Pak. Dev. Rev. 49, 799–822. doi:10.30541/v49i4iipp.799-822
Janssen, B. H., Guiking, F., van der Eijk, D., Smaling, E., Wolf, J., and van Reuler, H. (1990). A system for quantitative evaluation of the fertility of tropical soils (QUEFTS). Geoderma 46 (4), 299–318. doi:10.1016/0016-7061(90)90021-z
Jansson, P. E. (2004). Coupled heat and mass transfer model for soil-plant-atmosphere systems. Stockholm: Coupmodel.
Jansson, P. E. (2012). CoupModel: Model use, calibration, and validation. Trans. ASABE 55, 1337–1346. doi:10.13031/2013.42245
Jones, J., Hoogenboom, G., Porter, C., Boote, K., Batchelor, W., Hunt, L., et al. (2003). The DSSAT cropping system model. Eur. J. Agron. 18, 235–265. doi:10.1016/s1161-0301(02)00107-7
Jones, J., Jackson, L., Balogh, B., Obradovic, A., Iriarte, F., and Momol, M. (2007). Bacteriophages for plant disease control. Annu. Rev. Phytopathol. 45, 245–262. doi:10.1146/annurev.phyto.45.062806.094411
Jones, P. G., and Thornton, P. K. (2003). The potential impacts of climate change on maize production in Africa and Latin America in 2055. Glob. Environ. Change 13 (1), 51–59. doi:10.1016/s0959-3780(02)00090-0
Jordaan, J. P. (2002). Cereal production in Africa with the focus on South Africa. J. New Seeds 4 (4), 69–81. doi:10.1300/j153v04n04_05
Jørgensen, L. N., Matzen, N., Ficke, A., Nielsen, G. C., Jalli, M., Ronis, A., et al. (2020). Validation of risk models for control of leaf blotch diseases in wheat in the Nordic and Baltic countries. Eur. J. Plant Pathology 157 (3), 599–613. doi:10.1007/s10658-020-02025-6
Junaid, J. M., Dar, N. A., Bhat, T. A., Bhat, A. H., and Bhat, M. A. (2013). Commercial biocontrol agents and their mechanism of action in the management of plant pathogens. Int. J. Mod. Plant & Animal Sci. 1 (2), 39–57.
Junk, J., Kouadio, L., Delfosse, P., and El Jarroudi, M. (2016). Effects of regional climate change on Brown rust disease in winter wheat. Clim. Change 135 (3-4), 439–451. doi:10.1007/s10584-015-1587-8
Juroszek, P., and von Tiedemann, A. (2013). Climate change and potential future risks through wheat diseases: A review. Eur. J. Plant Pathology 136 (1), 21–33. doi:10.1007/s10658-012-0144-9
Kasampalis, D. A., Alexandridis, T., Deva, C., Challinor, A., Moshou, D., and Zalidis, G. (2018). Contribution of remote sensing on crop models: A review. J. Imaging 4 (4), 52. doi:10.3390/jimaging4040052
Keating, B. A., Carberry, P., Hammer, G., Probert, M., Robertson, M., Holzworth, D., et al. (2003). An overview of APSIM, a model designed for farming systems simulation. Eur. J. Agron. 18 (3-4), 267–288. doi:10.1016/s1161-0301(02)00108-9
Kephe, P. N., Ayisi, K. K., and Petja, B. M. (2021). Challenges and opportunities in crop simulation modelling under seasonal and projected climate change scenarios for crop production in South Africa. Agric. Food Secur. 10 (1), 10–24. doi:10.1186/s40066-020-00283-5
Kersebaum, K. C. (2007). Modelling nitrogen dynamics in soil–crop systems with HERMES, Modelling water and nutrient dynamics in soil–crop systems. Dordrecht: Springer, 147–160.
Kersebaum, K. (2011). “Special features of the HERMES model and additional procedures for parameterization, calibration, validation, and applications, Methods of introducing system models into agricultural research,” in Advances in agricultural systems modeling (Madison, United States: Wiley), 65–94.
Kiniry, J. R., Williams, J. R., Major, D. J., Izaurralde, R. C., Gassman, P. W., Morrison, M., et al. (1995). EPIC model parameters for cereal, oilseed, and forage crops in the northern Great Plains region. Can. J. Plant Sci. 75 (3), 679–688. doi:10.4141/cjps95-114
Klier, C., Gayler, S., Haberbosch, C., Ruser, R., Stenger, R., Flessa, H., et al. (2011). Modeling nitrous oxide emissions from potato-cropped soil. Vadose Zone J. 10, 184–194. doi:10.2136/vzj2009.0194
Köhl, J., Booij, K., Kolnaar, R., and Ravensberg, W. J. (2019a). Ecological arguments to reconsider data requirements regarding the environmental fate of microbial biocontrol agents in the registration procedure in the European Union. BioControl 64 (5), 469–487. doi:10.1007/s10526-019-09964-y
Köhl, J., Kolnaar, R., and Ravensberg, W. J. (2019b). Mode of action of microbial biological control agents against plant diseases: Relevance beyond efficacy. Front. Plant Sci. 10 (845), 845. doi:10.3389/fpls.2019.00845
Kraus, D., Weller, S., Klatt, S., Haas, E., Wassmann, R., Kiese, R., et al. (2015). A new LandscapeDNDC biogeochemical module to predict CH4 and N2O emissions from lowland rice and upland cropping systems. Plant Soil 386 (1-2), 125–149. doi:10.1007/s11104-014-2255-x
Krishnan, P., Sharma, R., Dass, A., Kukreja, A., Srivastav, R., Singhal, R. J., et al. (2016). Web-based crop model: Web InfoCrop – wheat to simulate the growth and yield of wheat. Comput. Electron. Agric. 127, 324–335. doi:10.1016/j.compag.2016.06.008
Krupnik, T. J. (2019). Combining crop and disease modeling with numerical weather forecasting to inform wheat blast early warning systems in Bangladesh, Brazil and beyond, Platform for Big Data in Agriculture. CGIAR.
Kuang, B. (2012). “Sensing soil properties in the laboratory, in situ, and on-line: A review,” in Advances in agronomy (Elsevier), 155–223.
Kumari, R. (2020). Application of remote sensing and GIS in crop modelling: A Review. SGVU J. of Climate Change and Water 7, 34–46.
Kwak, Y. S., and Weller, D. M. (2013). Take-all of wheat and natural disease suppression: A review. Plant Pathology J. 29 (2), 125–135. doi:10.5423/ppj.si.07.2012.0112
Larran, S., Simon, M. R., Moreno, M. V., Siurana, M. S., and Perelló, A. (2016). Endophytes from wheat as biocontrol agents against tan spot disease. Biol. control 92, 17–23. doi:10.1016/j.biocontrol.2015.09.002
Latta, J., and O’Leary, G. J. (2003). Long-term comparison of rotation and fallow tillage systems of wheat in Australia. Field Crops Res. 83 (2), 173–190. doi:10.1016/s0378-4290(03)00073-x
Lawless, C., Semenov, M., and Jamieson, P. (2005). A wheat canopy model linking leaf area and phenology. Eur. J. Agron. 22 (1), 19–32. doi:10.1016/j.eja.2003.11.004
Leadbeater, A. (2015). Recent developments and challenges in chemical disease control – a review. Plant Prot. Sci. 51 (4), 163–169. doi:10.17221/83/2015-pps
Lemańczyk, G., and Kwaśna, H. (2013). Effects of sharp eyespot (Rhizoctonia cerealis) on yield and grain quality of winter wheat. Eur. J. Plant Pathology 135 (1), 187–200. doi:10.1007/s10658-012-0077-3
Leonard, K. J., and Szabo, L. J. (2005). Stem rust of small grains and grasses caused by Puccinia graminis. Mol. Plant Pathol. 6 (2), 99–111. doi:10.1111/j.1364-3703.2005.00273.x
Li, C., Cao, W., and Zhang, Y. (2002). Comprehensive pattern of primordium initiation in shoot apex of wheat. ACTA Bot. Sin. 44 (3), 273–278.
Lin, B. B. (2011). Resilience in agriculture through crop diversification: Adaptive management for environmental change. BioScience 61 (3), 183–193. doi:10.1525/bio.2011.61.3.4
Luck, J., Spackman, M., Freeman, A., Tre˛bicki, P., Griffiths, W., Finlay, K., et al. (2011). Climate change and diseases of food crops. Plant Pathol. 60 (1), 113–121. doi:10.1111/j.1365-3059.2010.02414.x
Lüke, A., and Hack, J. (2017). Modelling Hydrological Ecosystem Services–A state of the art model comparison. Hydrology Earth Syst. Sci. Discuss. 2017, 1–29. doi:10.5194/hess-2017-436
Madgwick, J. W., West, J. S., White, R. P., Semenov, M. A., Townsend, J. A., Turner, J. A., et al. (2011). Impacts of climate change on wheat anthesis and Fusarium ear blight in the UK. Eur. J. Plant Pathology 130 (1), 117–131. doi:10.1007/s10658-010-9739-1
Mao, L., Jiang, H., Zhang, L., Zhang, Y., Sial, M. U., Yu, H., et al. (2017). Replacing methyl bromide with a combination of 1, 3-dichloropropene and metam sodium for cucumber production in China. PloS One 12 (11), e0188137. doi:10.1371/journal.pone.0188137
Martinelli, F., Scalenghe, R., Davino, S., Panno, S., Scuderi, G., Ruisi, P., et al. (2015). Advanced methods of plant disease detection. A review. A Rev. Agron. Sustain. Dev. 35 (1), 1–25. doi:10.1007/s13593-014-0246-1
Martinez-Espinoza, A. D. (2014). Disease management in wheat, 2013-2014 wheat production guide. Georgia: Griffin.
Martinez-Espinoza, A., Kichler, J., Yomans, J., and Buck, J. (2014). Identification and control of powdery mildew of wheat in Georgia. UGA Ext. C 1059, 1–3.
Martre, P., Jamieson, P. D., Semenov, M. A., Zyskowski, R. F., Porter, J. R., and Triboi, E. (2006). Modelling protein content and composition in relation to crop nitrogen dynamics for wheat. Eur. J. Agron. 25 (2), 138–154. doi:10.1016/j.eja.2006.04.007
McMaster, G. S., Edmunds, D., Wilhelm, W., Nielsen, D., Prasad, P., and Ascough, J. (2011). PhenologyMMS: A program to simulate crop phenological responses to water stress. Comput. Electron. Agric. 77 (1), 118–125. doi:10.1016/j.compag.2011.04.003
McMaster, G. S., Morgan, J. A., and Wilhelm, W. (1992). Simulating winter wheat spike development and growth. Agric. For. Meteorology 60 (3-4), 193–220. doi:10.1016/0168-1923(92)90038-6
McMaster, G. S., Wilhelm, W., and Frank, A. (2005). Developmental sequences for simulating crop phenology for water-limiting conditions. Aust. J. Agric. Res. 56 (11), 1277–1288. doi:10.1071/ar05068
Mehra, L., Adhikari, U., Cowger, C., and Ojiambo, P. S. (2018). Septoria nodorum blotch of wheat. PeerJ Preprints, 2167–9843.
Molero Milan, A., Reynolds, M. P., and Sonder, K. (2019). Plan for sharing crop modeling expertise during 2019. CGIAR Platform for Big Data in Agriculture.
Morley, N., and Lewis, J. (2014). Extreme climatic events and host–pathogen interactions: The impact of the 1976 drought in the UK. Ecol. Complex. 17, 1–19. doi:10.1016/j.ecocom.2013.12.001
Moya-Elizondo, E. A. (2013). Fusarium crown rot disease: Biology, interactions, management and function as a possible sensor of global climate change. Cienc. E Investig. Agrar. 40 (2), 235–252. doi:10.4067/s0718-16202013000200001
Müller, C., Eickhout, B., Zaehle, S., Bondeau, A., Cramer, W., and Lucht, W. (2007). Effects of changes in CO2, climate, and land use on the carbon balance of the land biosphere during the 21st century. J. Geophys. Res. Biogeosciences 112 (G2), G02032. doi:10.1029/2006jg000388
Murray, G. M., and Brennan, J. P. (2009). The current and potential costs from diseases of wheat in Australia. Canberra, Australia: Australian Grains Research and Development Corporation Australia, 66.
Murthy, V. R. K. (2004). “Crop growth modeling and its applications in agricultural meteorology,” in Satellite remote sensing and GIS applications in agricultural meteorology (Hazratbal: University of Kashmir), 235.
Nasraoui, B., Hajlaoui, M., Aïssa, A., and Kremer, R. (2007). Biological control of wheat take-all disease: I-Characterization of antagonistic bacteria from diverse soils toward Gaeumannomyces graminis var. tritici. Tunis. J. Plant Prot. 2, 23–34.
Nendel, C., Berg, M., Kersebaum, K., Mirschel, W., Specka, X., Wegehenkel, M., et al. (2011). The MONICA model: Testing predictability for crop growth, soil moisture and nitrogen dynamics. Ecol. Model. 222 (9), 1614–1625. doi:10.1016/j.ecolmodel.2011.02.018
Newbery, F., Qi, A., and Fitt, B. D. (2016). Modelling impacts of climate change on arable crop diseases: Progress, challenges and applications. Curr. Opin. Plant Biol. 32, 101–109. doi:10.1016/j.pbi.2016.07.002
Newlands, N. K. (2018). Model-based forecasting of agricultural crop disease risk at the regional scale, integrating airborne inoculum, environmental, and satellite-based monitoring data. Front. Environ. Sci. 6, 63. doi:10.3389/fenvs.2018.00063
O'leary, G., Connor, D., and White, D. (1985). A simulation model of the development, growth and yield of the wheat crop. Agric. Syst. 17 (1), 1–26. doi:10.1016/0308-521x(85)90019-8
O'Leary, G. J., and Connor, D. J. (1996b). A simulation model of the wheat crop in response to water and nitrogen supply: II. Model validation. Agric. Syst. 52 (1), 31–55. doi:10.1016/0308-521x(96)00002-9
O'Leary, G. J., and Connor, D. J. (1996a). A simulation model of the wheat crop in response to water and nitrogen supply: I. Model construction. Agric. Syst. 52 (1), 1–29. doi:10.1016/0308-521x(96)00003-0
O’Brien, P. A. (2017). Biological control of plant diseases. Australas. Plant Pathol. 46 (4), 293–304. doi:10.1007/s13313-017-0481-4
Ogle, H., and Dale, M. (1997). Disease management: Cultural practices. Massachusetts, United States: Plant pathogens and plant diseases, 390–404.
Olesen, J. E., Petersen, B., Berntsen, J., Hansen, S., Jamieson, P., and Thomsen, A. (2002). Comparison of methods for simulating effects of nitrogen on green area index and dry matter growth in winter wheat. Field Crops Res. 74 (2-3), 131–149. doi:10.1016/s0378-4290(01)00204-0
Olivera Firpo, P., Newcomb, M., Flath, K., Sommerfeldt-Impe, N., Szabo, L. J., Carter, M., et al. (2017). Characterization of Puccinia graminis f. sp. tritici isolates derived from an unusual wheat stem rust outbreak in Germany in 2013. Plant Pathol. 66 (8), 1258–1266. doi:10.1111/ppa.12674
Özdoğan, M. (2011). Modeling the impacts of climate change on wheat yields in Northwestern Turkey. Agric. Ecosyst. Environ. 141 (1-2), 1–12. doi:10.1016/j.agee.2011.02.001
Pan, J., Zhu, Y., and Cao, W. (2007). Modeling plant carbon flow and grain starch accumulation in wheat. Field Crops Res. 101 (3), 276–284. doi:10.1016/j.fcr.2006.12.005
Pan, J., Zhu, Y., Jiang, D., Dai, T., Li, Y., and Cao, W. (2006). Modeling plant nitrogen uptake and grain nitrogen accumulation in wheat. Field Crops Res. 97 (2-3), 322–336. doi:10.1016/j.fcr.2005.11.006
Parton, W. J., and Rasmussen, P. (1994). Long-term effects of crop management in wheat-fallow: II. CENTURY model simulations. Soil Sci. Soc. Am. J. 58 (2), 530–536. doi:10.2136/sssaj1994.03615995005800020040x
Patil, A. J., Sivakumar, S., and Witt, R. (2018). Forecasting disease spread to reduce crop losses. Münster, Germany: University of Münster.
Pelczar, M. J., Shurtleff, M. C., Kelman, A., and Pelczar, R. M. (2020). Plant disease. Chicago, IL, United States: Encyclopædia Britannica.
Pietraszko, M., Gryń, G., and Przewodowski, W. (2018). An effect of weather and soil conditions and their interaction on infection of leaves and tubers of potato with bacteria clavibacter michiganensis subsp. sepedonicus. Am. J. Potato Res. 95 (3), 278–285. doi:10.1007/s12230-017-9629-6
Plantegenest, M., Le May, C., and Fabre, F. (2007). Landscape epidemiology of plant diseases. J. R. Soc. Interface 4 (16), 963–972. doi:10.1098/rsif.2007.1114
Ponomarenko, A., Goodwin, S. B., and Kema, G. H. J. (2011). Septoria tritici blotch (STB) of wheat. Plant Health Instructor. JAMA. doi:10.1094/PHI-I-2011-0407-01
Porter, J. (1984). A model of canopy development in winter wheat. J. Agric. Sci. 102 (2), 383–392. doi:10.1017/s0021859600042714
Porter, J., Jamieson, P., and Wilson, D. (1993). Comparison of the wheat simulation models AFRCWHEAT2, CERES-Wheat and SWHEAT for non-limiting conditions of crop growth. Field Crops Res. 33 (1-2), 131–157. doi:10.1016/0378-4290(93)90098-8
Pretorius, Z., Pakendorf, K., Marais, G., Prins, R., and Komen, J. (2007). Challenges for sustainable cereal rust control in South Africa. Aust. J. Agric. Res. 58 (6), 593–601. doi:10.1071/ar06144
Priesack, E., Gayler, S., and Hartmann, H. P. (2006). The impact of crop growth sub-model choice on simulated water and nitrogen balances. Nutrient Cycl. Agroecosyst. 75 (1-3), 1–13. doi:10.1007/s10705-006-9006-1
Raes, D., Steduto, P., Hsiao, T., and Fereres, E. (2017). Reference manual, chapter 2, AquaCrop model, version 6.0. Rome, Italy: Food and Agriculture Organization of the United Nations, 314.
Resop, J. P., Fleisher, D. H., Wang, Q., Timlin, D. J., and Reddy, V. R. (2012). Combining explanatory crop models with geospatial data for regional analyses of crop yield using field-scale modeling units. Comput. Electron. Agric. 89, 51–61. doi:10.1016/j.compag.2012.08.001
Rickman, R. W., Waldman, S. E., and Klepper, B. (1996). MODWht3: A development-driven wheat growth simulation. Agron. J. 88 (2), 176–185. doi:10.2134/agronj1996.00021962008800020010x
Ritchie, S., Nguyen, H., and Holaday, A. (1987). “Genetic diversity in photosynthesis and water-use efficiency of wheat and wheat relatives,” in Proceedings of the 4th international workshop of the wheat yield consortium (NEW YORK, NY: WILEY-LISS DIV JOHN WILEY & SONS INC 605 THIRD AVE), 43.
Rodríguez-Moreno, V. M., Jiménez-Lagunes, A., Estrada-Avalos, J., Mauricio-Ruvalcaba, J. E., and Padilla-Ramírez, J. S. (2020). Weather-data-based model: An approach for forecasting leaf and stripe rust on winter wheat. Meteorol. Appl. 27 (2), e1896. doi:10.1002/met.1896
Rost, S., Gerten, D., Bondeau, A., Lucht, W., Rohwer, J., and Schaphoff, S. (2008). Agricultural green and blue water consumption and its influence on the global water system. Water Resour. Res. 44 (9), 6331. doi:10.1029/2007wr006331
Rowlandson, T., Gleason, M., Sentelhas, P., Gillespie, T., Thomas, C., and Hornbuckle, B. (2015). Reconsidering leaf wetness duration determination for plant disease management. Plant Dis. 99 (3), 310–319. doi:10.1094/pdis-05-14-0529-fe
Sadrati, N., Daoud, H., Zerroug, A., Dahamna, S., and Bouharati, S. (2013). Screening of antimicrobial and antioxidant secondary metabolites from endophytic fungi isolated from wheat (Triticum durum). J. Plant Prot. Res. 53 (2), 128–136. doi:10.2478/jppr-2013-0019
Saunders, D. G., Pretorius, Z. A., and Hovmøller, M. S. (2019). Tackling the re-emergence of wheat stem rust in Western Europe. Commun. Biol. 2 (1), 51. doi:10.1038/s42003-019-0294-9
Savary, S., and Willocquet, L. (2014). Simulation modeling in botanical epidemiology and crop loss analysis. Plant Health Instr. 173, 1. doi:10.1094/PHI-A-2014-0314-01
Schmale III, D. G., and Bergstrom, G. C. (2003). Fusarium head blight. The Plant Health Instructor. doi:10.1094/PHI-I-2003-0612-01
Schumann, G., and Leonard, K. (2000). Stem rust of wheat (black rust). Plant Health Instr 58, 1–12. doi:10.1094/PHI-I-2000-0721-01
Seidel, P. (2014). Extreme weather and influences on plant pests: Extreme knowledge gap. Gesunde Pflanz. 66 (3), 83–92. doi:10.1007/s10343-014-0319-8
Semenov, M. A., and Shewry, P. R. (2011). Modelling predicts that heat stress, not drought, will increase vulnerability of wheat in Europe. Sci. Rep. 1, 66. doi:10.1038/srep00066
Senthilkumar, S., Basso, B., Kravchenko, A., and Robertson, G. (2009). Contemporary evidence of soil carbon loss in the US corn belt. Soil Sci. Soc. Am. J. 73 (6), 2078–2086. doi:10.2136/sssaj2009.0044
Shaw, M. W. (2009). Preparing for changes in plant disease due to climate change. Plant Prot. Sci. 45, S3–S10. doi:10.17221/2831-PPS
Shibu, M., Leffelaar, P., Van Keulen, H., and Aggarwal, P. (2010). LINTUL3, a simulation model for nitrogen-limited situations: Application to rice. Eur. J. Agron. 32 (4), 255–271. doi:10.1016/j.eja.2010.01.003
Singh, R. P. (2006). Current status, likely migration and strategies to mitigate the threat to wheat production from race Ug99 (TTKS) of stem rust pathogen. CAB Rev. Perspect. Agric. Veterinary Sci. Nutr. Nat. Resour. 1 (54), 1–13. doi:10.1079/PAVSNNR20061054
Singh, R. P., Hodson, D. P., Huerta-Espino, J., Jin, Y., Bhavani, S., Njau, P., et al. (2011). The emergence of Ug99 races of the stem rust fungus is a threat to world wheat production. Annu. Rev. Phytopathology 49, 465–481. doi:10.1146/annurev-phyto-072910-095423
Skendžić, S., Zovko, M., Živković, I. P., Lešić, V., and Lemić, D. (2021). The impact of climate change on agricultural insect pests. Insects 12 (5), 440. doi:10.3390/insects12050440
Soltani, A., Maddah, V., and Sinclair, T. (2013). SSM-Wheat: A simulation model for wheat development, growth and yield. Int. J. Plant Prod. 7 (4), 711–740. doi:10.22069/IJPP.2013.1266
Soltani, A., and Sinclair, T. R. (2012). Modeling physiology of crop development, growth and yield. Wallington, United Kingdom: CABI International. doi:10.1079/9781845939700.0000
Sommer, R., Glazirina, M., Yuldashev, T., Otarov, A., Ibraeva, M., Martynova, L., et al. (2013). Impact of climate change on wheat productivity in Central Asia. Agric. Ecosyst. Environ. 178, 78–99. doi:10.1016/j.agee.2013.06.011
Sparks, A. H., Forbes, G. A., Hijmans, R. J., and Garrett, K. A. (2014). Climate change may have limited effect on global risk of potato late blight. Glob. change Biol. 20 (12), 3621–3631. doi:10.1111/gcb.12587
Spitters, C., and Schapendonk, A. (1990). Evaluation of breeding strategies for drought tolerance in potato by means of crop growth simulation, Genetic aspects of plant mineral nutrition. Dordrecht: Springer, 151–161. doi:10.1007/978-94-009-2053-8_24
Steduto, P., Hsiao, T. C., Raes, D., and Fereres, E. (2009). AquaCrop—the FAO crop model to simulate yield response to water: I. Concepts and underlying principles. Agron. J. 101 (3), 426–437. doi:10.2134/agronj2008.0139s
Stöckle, C. O., Donatelli, M., and Nelson, R. (2003). CropSyst, a cropping systems simulation model. Eur. J. Agron. 18 (3-4), 289–307. doi:10.1016/s1161-0301(02)00109-0
Strange, R. N., and Scott, P. R. (2005). Plant disease: A threat to global food security. Annu. Rev. Phytopathology 43, 83–116. doi:10.1146/annurev.phyto.43.113004.133839
Sturrock, R., Frankel, S. J., Brown, A. V., Hennon, P. E., Kliejunas, J. T., Lewis, K. J., et al. (2011). Climate change and forest diseases. Plant pathol. 60 (1), 133–149. doi:10.1111/j.1365-3059.2010.02406.x
Tao, F., Yokozawa, M., and Zhang, Z. (2009a). Modelling the impacts of weather and climate variability on crop productivity over a large area: A new process-based model development, optimization, and uncertainties analysis. Agric. For. Meteorology 149 (5), 831–850. doi:10.1016/j.agrformet.2008.11.004
Tao, F., and Zhang, Z. (2010). Adaptation of maize production to climate change in North China plain: Quantify the relative contributions of adaptation options. Eur. J. Agron. 33 (2), 103–116. doi:10.1016/j.eja.2010.04.002
Tao, F., and Zhang, Z. (2013). Climate change, wheat productivity and water use in the north China plain: A new super-ensemble-based probabilistic projection. Agric. For. Meteorology 170, 146–165. doi:10.1016/j.agrformet.2011.10.003
Tao, F., Zhang, Z., Liu, J., and Yokozawa, M. (2009b). Modelling the impacts of weather and climate variability on crop productivity over a large area: A new super-ensemble-based probabilistic projection. Agric. For. Meteorology 149 (8), 1266–1278. doi:10.1016/j.agrformet.2009.02.015
Tao, F., Zhang, Z., Xiao, D., Zhang, S., Rotter, R. P., Shi, W., et al. (2014). Responses of wheat growth and yield to climate change in different climate zones of China, 1981–2009. Agric. For. Meteorology 189, 91–104. doi:10.1016/j.agrformet.2014.01.013
Teferi, T. A. (2015). Wheat leaf rust (Puccinia triticina) epidemics and host plant response in South tigray, Ethiopia. Int. J. Plant Pathology 6 (1), 21–28. doi:10.3923/ijpp.2015.21.28
Terefe, T., Visser, B., and Pretorius, Z. (2016). Variation in Puccinia graminis f. sp. tritici detected on wheat and triticale in South Africa from 2009 to 2013. Crop Prot. 86, 9–16. doi:10.1016/j.cropro.2016.04.006
Thompson, S. E., Levin, S., and Rodriguez-Iturbe, I. (2014). Rainfall and temperatures changes have confounding impacts on P hytophthora cinnamomi occurrence risk in the southwestern USA under climate change scenarios. Glob. change Biol. 20 (4), 1299–1312. doi:10.1111/gcb.12463
Thornton, P. K., Jones, P. G., Ericksen, P. J., and Challinor, A. J. (2011). Agriculture and food systems in sub-Saharan Africa in a 4 C+ world. Philosophical Trans. R. Soc. A Math. Phys. Eng. Sci. 369, 117–136. doi:10.1098/rsta.2010.0246
Thurman, J. H., Crowder, D. W., and Northfield, T. D. (2017). Biological control agents in the anthropocene: Current risks and future options. Curr. Opin. Insect Sci. 23, 59–64. doi:10.1016/j.cois.2017.07.006
Valizadeh, J., Ziaei, S., and Mazloumzadeh, S. (2014). Assessing climate change impacts on wheat production (a case study). J. Saudi Soc. Agric. Sci. 13 (2), 107–115. doi:10.1016/j.jssas.2013.02.002
Van Diepen, C. v., Wolf, J., Van Keulen, H., and Rappoldt, C. (1989). Wofost: A simulation model of crop production. Soil Use Manag. 5 (1), 16–24. doi:10.1111/j.1475-2743.1989.tb00755.x
Van Esse, H. P., Reuber, T. L., and van der Does, D. (2020). Genetic modification to improve disease resistance in crops. New Phytol. 225 (1), 70–86. doi:10.1111/nph.15967
Vanuytrecht, E., Raes, D., Steduto, P., Hsiao, T. C., Fereres, E., Heng, L. K., et al. (2014). AquaCrop: FAO's crop water productivity and yield response model. Environ. Model. Softw. 62, 351–360. doi:10.1016/j.envsoft.2014.08.005
Varma, S., and Meena, A. (2020). Chapter -7 modern epidemiological approaches in plant disease management. Plant Pathol. 56, 337–338. doi:10.1111/j.1365-3059.2006.01506.x
Váry, Z., Mullins, E., McElwain, J. C., and Doohan, F. M. (2015). The severity of wheat diseases increases when plants and pathogens are acclimatized to elevated carbon dioxide. Glob. change Biol. 21 (7), 2661–2669. doi:10.1111/gcb.12899
Velásquez, A. C., Castroverde, C. D. M., and He, S. Y. (2018). Plant-pathogen warfare under changing climate conditions. Curr. Biol. 28 (10), R619–R634. doi:10.1016/j.cub.2018.03.054
Wang, J., Vanga, S. K., Saxena, R., Orsat, V., and Raghavan, V. (2018). Effect of climate change on the yield of cereal crops: A review. Climate 6 (2), 41. doi:10.3390/cli6020041
Weir, A. H., Bragg, P., Porter, J., and Rayner, J. (1984). A winter wheat crop simulation model without water or nutrient limitations. J. Agric. Sci. 102 (2), 371–382. doi:10.1017/s0021859600042702
Whish, J. P., Herrmann, N. I., White, N. A., Moore, A. D., and Kriticos, D. J. (2015). Integrating pest population models with biophysical crop models to better represent the farming system. Environ. Model. Softw. 72, 418–425. doi:10.1016/j.envsoft.2014.10.010
Wilhelm, W., McMaster, G. S., Rickman, R., and Klepper, B. (1993). Above-ground vegetative development and growth of winter wheat as influenced by nitrogen and water availability. Ecol. Model. 68 (3-4), 183–203. doi:10.1016/0304-3800(93)90016-l
Williams, J., Jones, C. A., Kiniry, J., and Spanel, D. (1989). EPIC crop growth model. Trans. ASAE 32, 8.
Xu, F., Yang, G., Wang, J., Song, Y., Liu, L., Zhao, K., et al. (2018). Spatial distribution of root and crown rot fungi associated with winter wheat in the North China Plain and its relationship with climate variables. Front. Microbiol. 9, 1054. doi:10.3389/fmicb.2018.01054
Yan, M., Cao, W., Li, C., and Wang, Z. (2000). Validation and evaluation of a mechanistic model of phasic and phenological development of wheat. Sci. Agric. Sin. 33 (2), 43–50.
Yeluripati, J., van Oijen, M., Wattenbach, M., Neftel, A., Ammann, A., Parton, W., et al. (2009). Bayesian calibration as a tool for initialising the carbon pools of dynamic soil models. Soil Biol. Biochem. 41, 2579–2583. doi:10.1016/j.soilbio.2009.08.021
Zafari, D., Koushki, M. M., and Bazgir, E. (2008). Biocontrol evaluation of wheat take-all disease by Trichoderma screened isolates. Afr. J. Biotechnol. 7, 20.
Žalud, Z., McMaster, G. S., and Wilhelm, W. W. (2003). Evaluating SHOOTGRO 4.0 as a potential winter wheat management tool in the Czech Republic. Eur. J. Agron. 19, 495–507. doi:10.1016/s1161-0301(02)00186-7
Zhai, S., Song, G., Qin, Y., Ye, X., and Lee, J. (2017). Modeling the impacts of climate change and technical progress on the wheat yield in inland China: An autoregressive distributed lag approach. PloS one 12 (9), e0184474. doi:10.1371/journal.pone.0184474
Zhang, Q., Li, Q., Wang, X., Wang, H., Lang, S., Wang, Y., et al. (2005). Development and characterization of a Triticum aestivum-Haynaldia villosa translocation line T4VS⋅ 4DL conferring resistance to wheat spindle streak mosaic virus. Euphytica 145 (3), 317–320. doi:10.1007/s10681-005-1743-8
Zhang, T., and Huang, Y. (2013). Estimating the impacts of warming trends on wheat and maize in China from 1980 to 2008 based on county level data. Int. J. Climatol. 33 (3), 699–708. doi:10.1002/joc.3463
Zhang, X., Halder, J., White, R., Hughes, D., Ye, Z., Wang, C., et al. (2014). Climate change increases risk of fusarium ear blight on wheat in central China. Ann. Appl. Biol. 164 (3), 384–395. doi:10.1111/aab.12107
Zhao, C. B., Liu, S., Piao, X., Wang, D. B., Lobell, Y., Huang, M., et al. (2017). “Temperature increase reduces global yields of major crops in four independent estimates,” in Proceedings of the National Academy of Sciences 114 (35), 9326–9331. doi:10.1073/pnas.1701762114
Zheng, B., Chenu, K., Doherty, A., and Chapman, S. (2014). “The APSIM-wheat module (7.5 R3008),” in Agricultural production systems simulator (APSIM) initiative: Toowoomba (Australian: APSIM).
Keywords: climate change, crop model, crop yield, disease control, microbes, pathogens, disease forecasting
Citation: Ajilogba CF and Walker S (2023) Using crop modeling to find solutions for wheat diseases: A review. Front. Environ. Sci. 10:987765. doi: 10.3389/fenvs.2022.987765
Received: 06 July 2022; Accepted: 23 December 2022;
Published: 10 January 2023.
Edited by:
Ana Maria Tarquis, Polytechnic University of Madrid, SpainReviewed by:
Calogero Schillaci, Joint Research Centre, ItalyKaransher Singh Sandhu, Bayer Crop Science, United States
Mukhtar Ahmed, Pir Mehr Ali Shah Arid Agriculture University, Pakistan
Copyright © 2023 Ajilogba and Walker. This is an open-access article distributed under the terms of the Creative Commons Attribution License (CC BY). The use, distribution or reproduction in other forums is permitted, provided the original author(s) and the copyright owner(s) are credited and that the original publication in this journal is cited, in accordance with accepted academic practice. No use, distribution or reproduction is permitted which does not comply with these terms.
*Correspondence: Caroline Fadeke Ajilogba, Y2Fyb2xpbmUuYWppbG9nYmFAZ21haWwuY29t; Sue Walker, d2Fsa2Vyc0BhcmMuYWdyaWMuemE=;