 Shuo Wei
 Su‐Ting Cheng
- School of Forestry and Resource Conservation, National Taiwan University, Taipei, Taiwan
Urban trees provide multiple ecosystem services (ES) to city residents and are used as environmentally friendly solutions to ameliorate problems in cities worldwide. Effective urban forestry management is essential for enhancing ES, but challenging to develop in densely populated cities where tradeoffs between high ES provision and issues of periodic disaster-caused risks or maintenance costs must be balanced. With the aim of providing practical guidelines to promote green cities, this study developed an AI-based analytical approach to systematically evaluate tree conditions and detect management problems. By using a self-organizing map technique with a big dataset of Taipei street trees, we integrated the ES values estimated by i-Tree Eco to tree attributes of DBH, height, leaf area, and leaf area index (LAI) to comprehensively assess their complex relationship and interlinkage. We found that DBH and leaf area are good indicators for the provision of ES, allowing us to quantify the potential loss and tradeoffs by cross-checking with tree height and the correspondent ES values. In contrast, LAI is less effective in estimating ES than DBH and leaf area, but is useful as a supplementary one. We developed a detailed lookup table by compiling the tree datasets to assist the practitioners with a rapid assessment of tree conditions and associated loss of ES values. This analytical approach provides accessible, science-based information to appraise the right species, criteria, and place for landscape design. It gives explicit references and guidelines to help detect problems and guide directions for improving the ES and the sustainability of urban forests.
1 Introduction
In urban areas, trees are used as nature-based solutions to ameliorate environmental problems arising from global warming and urbanization (Robinson and Lundholm, 2012; Abdi et al., 2020). They provide a range of ecosystem services (ES) to improve the livability of metropolitan environments and mitigate urban environmental degradation (Revelli and Porporato, 2018; Miao et al., 2021; Koricho et al., 2022; Speak et al., 2022), including reducing air pollution (Nowak and Crane, 2000; Nowak et al., 2006; Miao et al., 2021), regulating water and climate, recreation and promoting quality of life (Jansson, 2013; Riondato et al., 2020). Maintaining or enhancing the ES provided by trees is an important task for urban forestry managers. This mission is typically managed by multiple tasks, like planting, regular maintenance and inspecting, long-term monitoring, and curing tree diseases to increase the aesthetics and functions of urban trees to improve the effectiveness and sustainability of the urban green infrastructure.
In large cities, with extensive networks of streets and urban plantings, the urban forestry plan can be highly complex, challenging local governments and communities to manage the urban forest estate (Pataki et al., 2021). For example, in Taipei, the capital of Taiwan with 2.6 million people, there are more than eighty-thousand street trees in the city. These trees are regularly maintained for multiple social objectives, such as attractive shapes, increasing light penetration, improving air movement, and providing aesthetic views (Clark and Matheny, 2010; Ryder and Moore, 2013). Taipei street trees are also routinely pruned during periodic typhoons or storm seasons to reduce risks of property damage and threats to lives from tree failures, but the intensive pruning may cause potential losses in ES (Wei and Cheng, 2022). However, the status of the present ES to the optimal ES provision is rarely assessed.
Quantification of ES is a useful instrument to raise awareness of biodiversity conservation, attract public attention and engagement, evaluate compensation for damage/loss to natural capital, influence policy, and determine policy effectiveness (Sang et al., 2021). Valuation of ES provided by urban trees can aid understanding of the role of trees in sustaining people’s well-being, and drive the protection of trees, investment in tree planting, and improvement of resilience by urban forestry planning (Nytch et al., 2019; Riondato et al., 2020; Koricho et al., 2022; Speak et al., 2022). While many studies have developed methods to value ES provided by trees, most require a considerable effort to quantify values related to energy savings, water-related disaster avoidance, and carbon sequestration and storage (Livesley et al., 2016; McPherson et al., 2016; Berland et al., 2017; Tsoka et al., 2021) and rely on extensive (often unavailable) datasets or measurements of trees and environmental conditions involving complex mixes of spatial-temporal scales (Revelli and Porporato, 2018; Zinia and Mcshane, 2021). Most of the time, the complex parameterization and data requirements limit the accessibility or applicability of such methods.
The i-Tree Eco (http://www.itreetools.org/eco/) is a widely-used, open-access, and reliable software developed by the US Forest Service in 2006 to estimate the various ES values provided by individual trees and forest stands (USDA Forest Service, 2016). It requires minimum input data of tree species, DBH, and height, or more detailed information on crown length and crown width. Users also need to define the regional climate and upload local meteorological measurements, to give reference for adjusting the variations in tree growth to local weather and environmental conditions (Riondato et al., 2020). By uploading the surveyed information of trees to the i-Tree Eco, users will receive the estimated ES and ES values of each tree from the i-Tree (Nowak and Crane, 2000; Riondato et al., 2020; Koricho et al., 2022). However, the estimates of ES of the individual tree are simply numbers that do not point out if the trees have health problems or provide governance suggestions, nor do they cover efficient indicators of ES for the frontline personnel (Speak et al., 2022).
In this study, we sought to develop an AI-based method integrating the urban forestry inventory with the ES estimates to support improved urban forestry management for promoting a greener urban city. Our tool harnessed comprehensive information on tree attributes, functions, and benefits for >87,000 street trees in Taipei, Taiwan, with an advanced AI-based approach of a self-organizing map (SOM). It can be used as a rapid evaluation tool that helps gain organized knowledge from big data in assisting systematic assessment of tree conditions and examination of potential ES loss for urban forestry planning in a real-world setting. Here, we describe the development of the new analytical method to explore the associations of tree attributes to ES and provide critical information and readily searchable lookup tables for fast and efficient inspection for improving urban forestry management and ecosystem services.
2 Materials and methods
We assembled inventory data for a total of 87,014 Taipei street trees from 2015 to 2017 provided by the Parks and Street Lights Office of the Taipei City Government. The inventory contains complete information on diameter at breast height (DBH) > 1 cm, total tree height, tree species, habitat form, and GPS coordinates. We applied the i-Tree Eco Version 6.0.14. (http://www.itreetools.org/eco/) (USDA Forest Service, 2016) to evaluate the ES values of each street tree on carbon sequestration, runoff avoidance, and air pollution removal. Then these values were summed as the gross ES. Input data prepared and uploaded to i-Tree Eco include tree ID, species, location in GPS, DBH, tree total height, hourly meteorological observations of temperature, precipitation, wind, humidity, and air pollutant fluxes in 2015. Measurements for crown size (i.e., crown width and crown length) were lacking for all the street trees, so crown width was estimated using the empirical DBH-crown width equations embedded in i-Tree Eco for applicable species, family, or order, with an assumption of a circular shape for even crown width in every direction. The crown length was set as half of the total tree height (rather than estimates for naturally open-grown trees of 0.78; USDA Forest Service, 2016), to reflect the reality of smaller crown lengths in Taipei due to intensive pruning practices that remove a certain proportion of leaves and branches from trees (Badrulhisham and Othman, 2016).
The massive urban forestry information reflects the complex interaction of trees with the surroundings or represents the outcomes from the disturbances by nature and anthropogenic activities. Interpreting such information can be challenging for urban forestry management. A simple classification can aid efficient efforts in urban forestry governance by determining the systematic relation of tree attributes to the provision of ES. To avoid subjective and arbitrary classifications, we employed an artificial intelligence (AI) technique— a self-organizing map (SOM) for a primary task of unsupervised clustering (Cheng et al., 2018; Chen et al., 2020) based on the big datasets of 87,014 Taipei street trees. The SOM applies a competitive learning procedure to the discrete input space of the training datasets to produce a reduced dimensional visualization in a feature map (Chang et al., 2017; Tsai et al., 2017). This technique has been used to identify potential impacts or problems among complex interactions and processes (Cheng et al., 2018) based on multidimensional datasets for resource planning (Chang et al., 2017), disaster forecasting (Chen et al., 2020; Chang et al., 2021), and urban forest management (Klobucar and Subasic, 2012). Variables were selected based on the criteria of 1) basic measurements in the tree inventory, including tree attributes of DBH and height, and 2) commonly-used ES indicators, including leaf area and LAI. By bundling these four variables from the 87,014 street trees to their correspondent ES of carbon sequestration, runoff avoidance, pollution removal, and gross ES estimated by i-Tree Eco, we implemented a SOM analysis using MATLAB 2017a software. Values of each variable were transformed into an unbiased formation from 0 to 1 by an independent normalization process.
To preserve the topological properties of the input space, a Gaussian neighborhood function was applied to train different map sizes of SOM. The optimal size of SOM (i.e., the primary clustering size) was determined by the criteria of local minimum quantization error (QE) and topographic error (TE) (Kohonen, 2001). The quantization error (QE) estimates the average distance between the input vector and the weight vector of its best-matching unit, and is calculated by (Tsai et al., 2017; Chen et al., 2020):
where xi is the input vector, uc is the vector of the best-matching unit, and n is the number of data vectors. The topographic error (TE) considers the number of input vectors to which the best- and second-matching units are not adjacent, and is approximated by (Tsai et al., 2017; Chen et al., 2020):
where u (xi) is set to 1 if the second-matching unit is not adjacent to the best-matching unit. We chose to produce a hexagonal lattice topological SOM map that displays the signal density of the topological structure and statistical characteristics of input patterns for pattern recognition, classification, and interpretation purposes.
Then based on the patterns of the ES in SOM, we re-classified the clusters into fewer categories representing the level of ES provision. For practical purposes, the simplified categories can structure the extent of the provision of ES according to the measured tree attributes. Furthermore, with the information assembled from the big data, a lookup table can be established for each tree species because of their physiological similarity. The lookup table can support a quick ES examination for the practitioners in the field to check the status of ES provision by using the measurements of DBH, height, and leaf area index (LAI). Lastly, we provide an example of applying this tool to assess the potential loss of ES from the long-term effects of natural and/or anthropogenic disturbances and highlight improvement areas.
The steps in our approach are summarized in Figure 1, starting from the assemblage of tree inventory data for an investigation of the current status of the street tree community, evaluating their ES values, clustering by a SOM analysis, synthesizing for efficient gross ES estimates, examining the potential loss of ES, and providing reference and guidelines for urban forestry management.
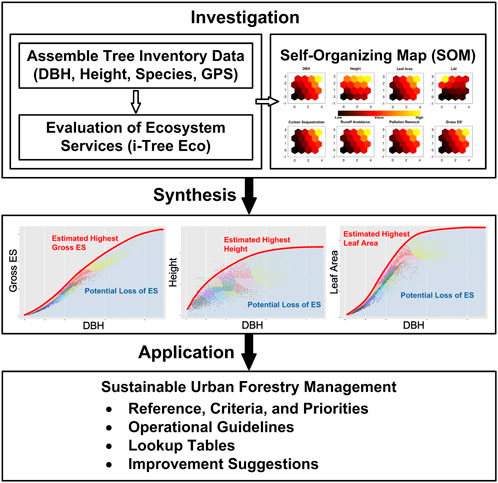
FIGURE 1. The flow chart of the study presents the general framework of the AI-based approach allowing assessment and detection of hidden problems and issues for urban forestry management.
3 Results
In this study, we assess the structure and ES values of a total of 87,014 Taipei street trees containing a high diversity of 215 species. The DBH of street trees ranges from 1 to over 100 cm, with the majority covering the DBH from 15 to 30 cm (37.9%) and 30–60 cm (36.5%), while small DBH trees (1–15 cm) account for 21.7%, and trees with DBH over 60 cm are about 3.8% (Table 1 and Figure 2). Based on the i-Tree Eco estimates, the highest ES value provided by each individual street tree was on average the carbon sequestration, valued at $3.45 USD, followed by the ES of air pollution removal at $2.3 USD, and the lowest for the ES of runoff avoidance of $1.9 USD per tree per year.

TABLE 1. Summary of the top 10 species of the Taipei street trees in quantity (N), population percentage (%), percentage by DBH classification, and mean DBH (cm).
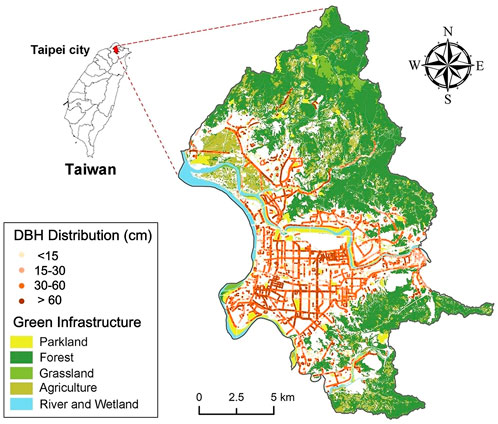
FIGURE 2. Location and DBH distribution of the street trees in Taipei city with local green infrastructure information.
Determined by the quantization error (QE) and topographic error (TE), the primary clustering size of SOM was 16 (i.e., 4 × 4 neurons) for visualization and exploration purposes (Figure 3). The SOM preserved a distance gradient among clusters to classify the street trees by multi-relationships among individual tree’s attributes of DBH and height, LA, LAI, and their ES values for carbon sequestration, runoff avoidance, air pollution removal, and gross ES. The color patterns demonstrated similar trends of ES values of carbon sequestration, runoff avoidance, and pollution removal to the gross ES. Their color patterns all transited from black in neuron I at the lower-left corner to a yellow color in neuron XVI at the upper-right corner. The color codes denoted the values. Values from low to high were represented by black, dark brown, brown, red, orange, light orange, and yellow across the clusters (Figure 3). Therefore, based on the level of ES patterns in the SOM, we further simplified the 16 clusters into four categories representing the superior, good, fair, and poor levels of the gross ES (Figure 3).
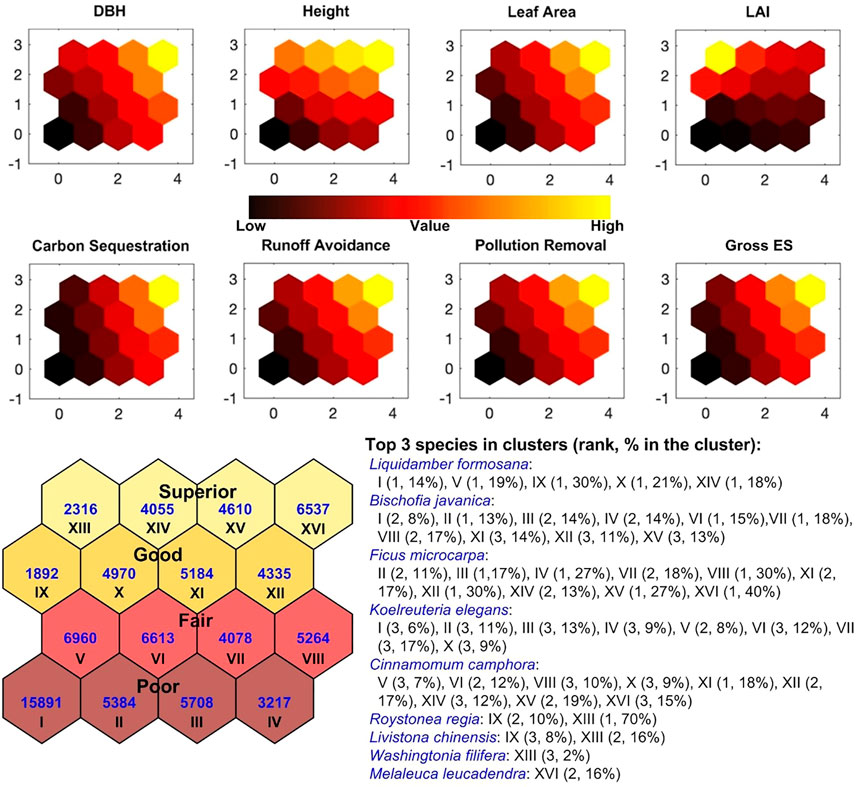
FIGURE 3. SOM map with 16 neurons (i.e., 4 × 4) representing associations of DBH, height, leaf area, and LAI, to the ES of carbon sequestration, runoff avoidance, pollutant removal, and gross ES. The lower left presented the re-classification into four categories of superior (yellow), good (orange), fair (red), and poor (brown) gross ES with neuron numbers of the SOM from I to XVI and the number of input records (shown in blue) in each neuron. The lower right listed the top 3 species in the 16 clusters.
The DBH and leaf area displayed similar color patterns to various ES values, showing their close associations (Figure 3). The variable height was not directly associated with the various ES values. The highest value of height shown in yellow color appeared in the upper right corner, the same as the DBH, leaf area, and various ES values, but the transit patterns differed. The top three highest values of height were lined up from right to left in neurons XVI, XV, XIV, and XIII. The pattern of LAI was the most different one among the variables (Figure 3). The highest value of LAI shown in yellow color appeared in neuron XIII, and its adjacent neurons of IX and XIV presented the next highest values shown in red colors. The top five species dominant in the most clusters were Liquidamber formosana, Bischofia javanica, Ficus microcarpa, Koelreuteria elegans, and Cinnamomum camphora, in contrast to the dominant species of Roystonea regia, Livistona chinensis, Washingtonia filifera, and Melaleuca leucadendra in neurons XIII, IX, and XVI that determined the discrepancies of LAI in the SOM (Figure 3).
Based on the SOM results, we extracted species-specific information and explored the associations among tree attributes to various ES by scatter plots using Cinnamomum camphora (a fast-growth species) and Koelreuteria elegans (a moderate-growth species) as examples (Figure 4). We found a non-linear relationship between DBH and various ES of carbon sequestration, runoff avoidance, pollution removal, and gross ES, in which the variations of ES estimates were greater in larger DBH (Figure 4). In contrast, leaf area showed a linear relationship with ES of runoff avoidance and pollution removal, but non-linear for carbon sequestration and gross ES (Figure 4). Height and LAI showed much larger variations in the associations to various ES than those seen with DBH or leaf area (Figure 4). Nonetheless, we did not find species-specific variability between leaf area to runoff avoidance or to pollution removal. The relationships were identical among different species (Figure 4).
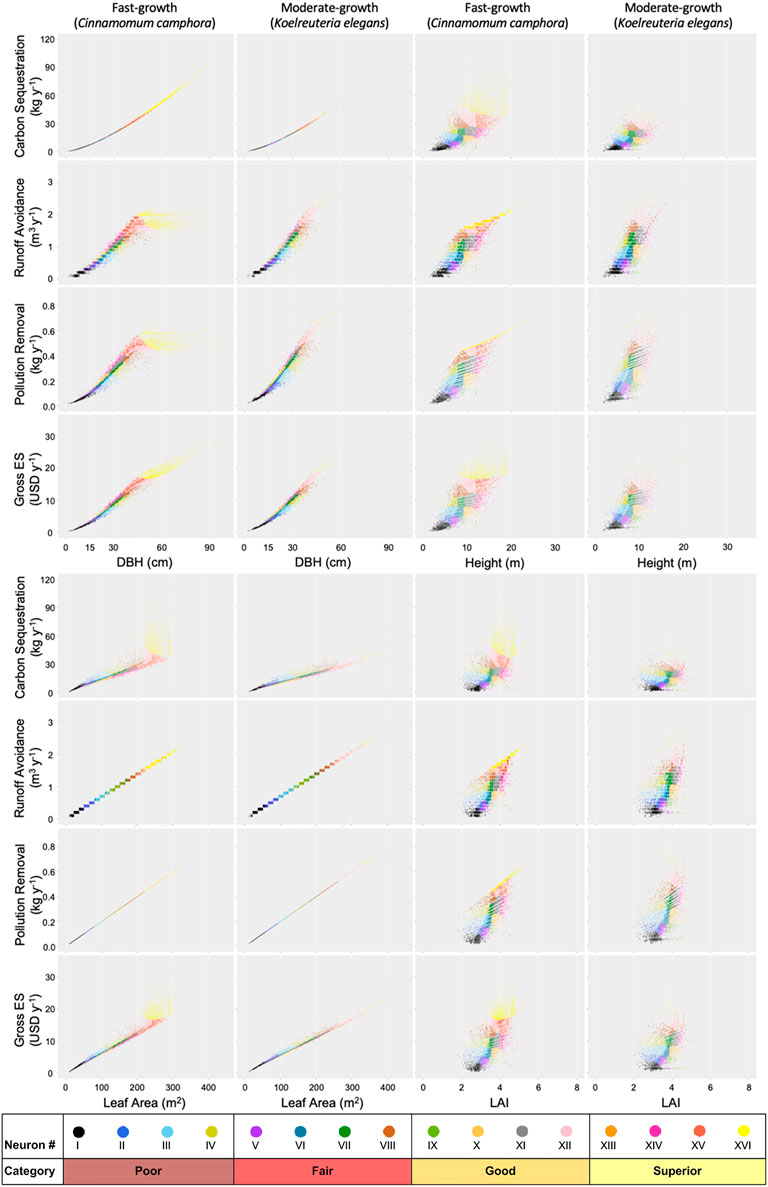
FIGURE 4. Based on the SOM, we used Cinnamomum camphora (a fast-growth species) and Koelreuteria elegans (a moderate-growth species) as examples to show the individual species’ associations of DBH, height, leaf area, and LAI to carbon sequestration, pollution removal, runoff avoidance, and gross ES by scatter plots.
We further investigated the relationships among DBH to leaf area, height, and LAI, and the results also appeared non-linear (Figure 5). The variations between DBH to height or LAI were much larger than those with gross ES or leaf area (Figure 5). Based on the upper boundary of the superior category, we obtained the estimated highest ES values. Underneath the estimated highest ES values presented the potential loss of ES. Results showed remarkable potential losses of ES for most DBH sizes of trees (Figure 5 and Table 2). Results found the highest potential loss in gross ES and in leaf area in the poor category, followed by the fair and the good, and the least in the superior category. We generated a table showing the percentage of the potential loss by individual species (Table 2). For example, for Ficus microcarpa, based on their current conditions, the average potential loss of gross ES in each neuron was estimated from 2.6% to 22.4%, in which neurons I to IV in the category of poor ES values had the largest potential loss, around 20% less than the estimated highest ES values (Table 2). The potential loss gradually decreased with the categories from poor to superior, such as the trend seen in neurons from 21.6% (neuron IV), 18.0% (neuron VIII), 15.0% (neuron XII) to 8.9% (neuron XVI), respectively. Negative values were found in Table 2, meaning that the actual gross ES of the tree was higher than the estimated highest. This is because the performance references were calculated as the average of the top 5%, when some individuals possessed higher ES values, it would result in negative values.
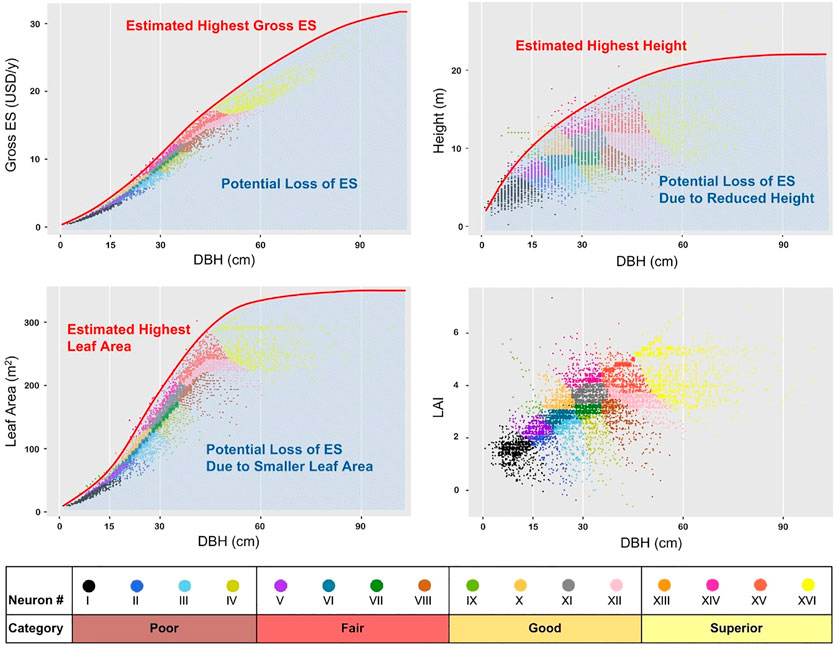
FIGURE 5. Based on the SOM, we display the individual species’ (e.g., Cinnamomum camphora here) associations of DBH to gross ES, leaf area, height, and LAI by scatter plots to detect potential issues for improving urban forestry management and enhancing ES.

TABLE 2. Examples of the percentage loss of gross ES and leaf area to the estimated highest values at DBH for dominant species clustered in each neuron with the number of individual trees (N).
The leaf area in the SOM results appeared similar trends to the various ES (Figure 3), demonstrating that the loss in leaf area can be directly associated with the loss of various ES, which was also reflected in the scatter plots a positive and linear influence of leaf area on runoff avoidance and pollution removal (Figure 4). Therefore, disturbances from either natural or anthropogenic disturbances, like windthrow or pruning can result in losses of leaf area, and in turn cause losses in ES. According to the inventory data, around 32.6% of Taipei street trees experienced less than 15% leaf area loss and 33.1% around 16–25% leaf area loss. Analysis results indicated that around 25.9% of trees underwent more than 25% leaf area loss (Table 3). The results revealed that for some tree species, the percentage loss of ES values was smaller than the correspondent percentage loss in leaf area, like Ficus microcarpa, Bischofia javanica, Cinnamomum camphora, Koelreuteria elegans, and Melaleuca leucadendra (Table 2). For other tree species, like Liquidambar formosana, and the palm trees of Roystonea regia, Livistona chinensis, and Washingtonia filifera, a greater percentage loss of ES values was found than the percentage loss in the leaf area (Table 2).
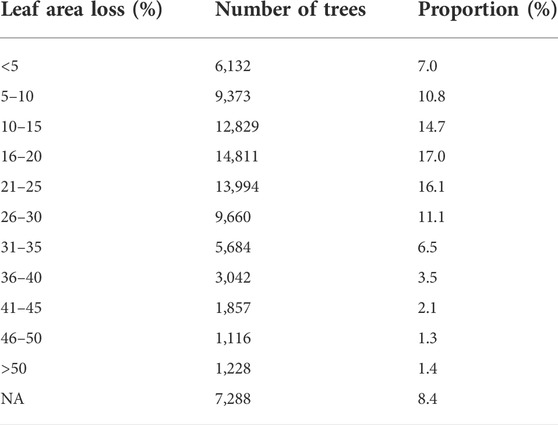
TABLE 3. Frequency distribution for potential leaf area loss based on the inventory data.
Results also found that trees with larger DBH can provide greater ES. Particularly the trees with DBH greater than 60 cm were mostly grouped in the superior category of gross ES. Nonetheless, results also showed that many of these big trees possessed notable potential loss of ES. For example, Cinnamomum camphora with DBH greater than 60 cm had an average percentage loss of 7.4% in gross ES in neuron XVI (Table 2). Considerable variations in the height, leaf area, or LAI representing potential losses in the gross ES were observed for trees grouped in the superior category (Figure 5).
The unique color pattern between DBH and LAI shown in the SOM result (Figure 3) was investigated by a scatter plot with a projected canopy cover (
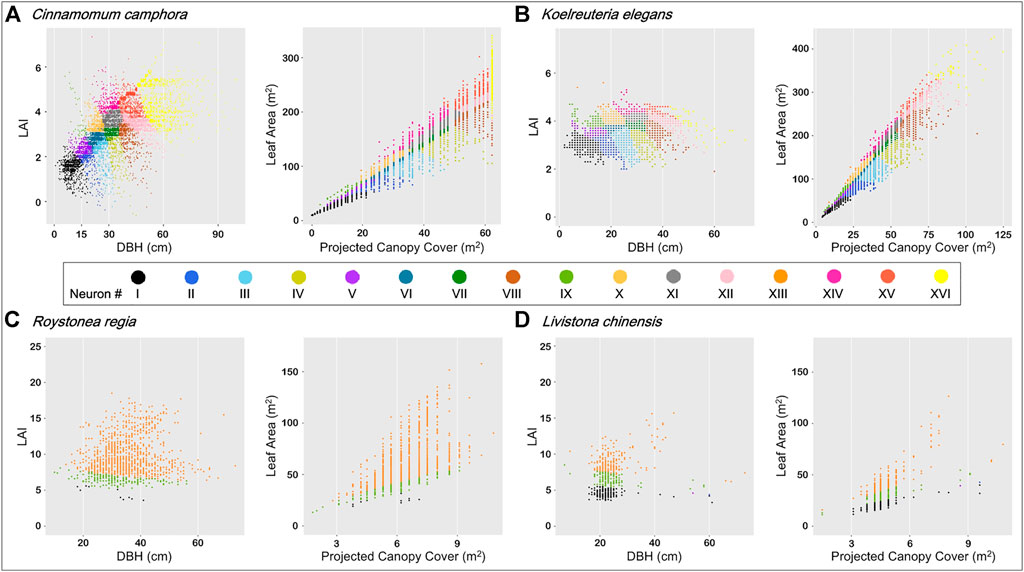
FIGURE 6. Scatter plots of DBH to LAI, and projected canopy cover to leaf area using examples of (A) Cinnamomum camphora (B) Koelreuteria elegans, (C) Roystonea regia, and (D) Livistona chinensis.
4 Discussion
In this study, we evaluated the conditions of the 87,014 street trees in Taipei. Extensive variations in the ES functions and values provided by trees were found driven by tree size and species traits. With the knowledge extracted from big data by the SOM approach, we are able to provide useful indicators of ES and rapid examination information for management. The best indicators/predictors of ES provision were DBH and leaf area. Height was found to determine the potential loss of ES, due to their being largely influenced by management practices or natural disturbances. The LAI of some species may be biased and is suggested as a supplementary indicator for the valuation of ES.
The use of this AI-based approach may emerge potential internal strengths and weaknesses and external opportunities and threats. Integrated by the SOM technique the bottom-up in-situ information of the tree attributes with the ES value estimations in the i-Tree Eco, our approach provides strengths in extracting from big data the efficient indicators of the commonly measured tree attributes to the level of ES provision and deriving easy-to-use lookup tables. Despite the complex and process-based models used in the i-Tree Eco to evaluate various ES values from various variables, the big-data mining of the 87,014 street trees revealed a strong association between ES values and DBH and leaf area. For annual carbon sequestration, the i-Tree Eco calculated the difference between carbon storage in successive years by classifying species into slow, moderate, and fast-growth species with different fixed growth rates, and then adjusted by different lengths of growing seasons in different climatic zones, competition status, and tree conditions (Nowak, 2020). The increase of DBH is calculated by the growth rate and then transformed into gross carbon sequestration by species-specific allometric equations. Based on the results, DBH was found to be the most efficient indicator for carbon sequestration. In Lin et al. (2020), DBH was as well reported the greatest influence on carbon sequestration. Since DBH is a relatively easy and widely measured variable in on-site forestry inventories, when encountering time, budget, and labor constraints, DBH can be used as the first choice to give a reasonable estimate of ES values. In contrast, height and LAI showed different patterns from that of various ES and gross ES. Similar DBH sizes were found to be clustered into different neurons, in which lower ES correspondent with lower heights. Height, in forest plantations, is used to assess site quality (Carmean, 1975), but in an urban setting, a lower height may imply several other possibilities, like maintenance practices, intensive pruning (Ryder and Moore, 2013; Fini et al., 2015; Wei and Cheng, 2022), bad health conditions, aging, inappropriate environment (Sanders and Grabosky, 2014), or windthrow and natural-disaster-caused consequences (Qin et al., 2022), than simply a reflection of the site condition. Our approach offers an explicit standard and convenient execution to help assess the status of the trees and their ES provision. A systematic evaluation of tree conditions also helps reduce the variation during tree inspection and maintenance judgment from person to person (Ordóñez et al., 2019). It can provide a comprehensive view and assist in identifying the existing tree problems requiring further inspection or practice adjustments for city-wise maintenance or detecting issues hindered in the complex natural and anthropogenic interactions for improving urban forestry management.
By compiling the relationships among tree attributes to various ES, the SOM technique solves the complexity in estimating ES from each street tree with different growth rate and distinct traits under various natural and anthropogenic disturbances. This approach helps identify efficient urban forest indicators of DBH and leaf area in estimating ES of carbon sequestration, runoff avoidance, and pollution removal. It also opens a way for providing an explicit ES assessment standard. With this standard, we enable a science-based opportunity for effective urban forestry management to help inspect the feasibility of the improvement strategies made by the authorities or the administrative organizations (Davies et al., 2017) and facilitate citizen participation or public engagement in the tree management process (Lawrence et al., 2013; Ordóñez & Duinker, 2013). This interconnects a good relationship among managers, the execution teams, stakeholders, and the public. In traditional urban forestry management, the assessment quality and the success of the urban forestry management heavily relied on the experience and judgment of the frontline personnel or managers/designers who develop the landscape planning (Lawrence et al., 2013; Piana et al., 2021). In recent years, citizen participation is important in promoting public affairs. The involvement of the citizens and integrating their perceptions in the management process will help create a win-win situation to facilitate the effectiveness of urban forestry planning, as well as to develop a long-term partnership between citizens and local government.
However, our approach has some weaknesses and limitations. First, uncertainties in the ES estimation can be difficult to assess due to the long-term climatic variations and disturbances (Reynolds et al., 2020) and the associated measuring errors on tree size and species traits, such as DBH, height, leaf area, and canopy cover, which may affect the accuracy of the ES estimation in i-Tree Eco (Nowak, 1996; Pace et al., 2018; Lin et al., 2020). Second, in the i-Tree Eco, the standardized growths limit species-specific differentiation in the model results. The lack of input on crown light exposure (CLE) and tree conditions may further constrain the accuracy of carbon sequestration estimations (Lin et al., 2020; Rötzer et al., 2020). Based on the parameterization in the i-Tree Eco, leaf-on and leaf-off dates are determined by frost to calculate the length of growing season. As a result, the temperature rarely below 10 °C prolongs the whole-year length of the growing season in Taipei. The warm weather also makes the dormancy of deciduous trees unclear. Defoliation can be sometimes observed in winter, but the leaf-off period is very short. We suspect that the defoliation mechanism in tropical or sub-tropical regions may differ from that in temperate regions. These may be why in our results species-specific variations in DBH to carbon sequestration are minimal due to a longer growing season and unclear dormancy for deciduous trees (Figure 4), contributing to greater ES of carbon sequestration. To improve the parameterization in the i-Tree Eco, more data from different regions should be included or experimental studies be conducted to compare the growth of trees for a more realistic match. Moreover, the amount of pollution removal and runoff avoidance by urban trees is determined by the pollution concentration and meteorological data (Nowak et al., 2008). However, the detailed calculation of the species-specific leaf trait to the ability of runoff avoidance and pollution removal is not provided in the i-Tree Eco. In the simulations, we used the same pollution concentration records and meteorological data provided by the Taipei weather station, producing no spatial variations in the environmental conditions. In terms of the association of leaf area to the provision of runoff avoidance and pollution removal, we did not observe a species-specific effect (Figure 4). This suggests that the species-specific air pollutant capturing efficiency or runoff avoidance ability may not be evaluated in the model.
It should be aware that external threats may occur in the implementation under dramatic climate change or socio-economic shifts (Reynolds et al., 2020; Mofrad et al., 2022) in the future because our approach cannot predict future situations unless new datasets are collected and included in the analysis. In addition, in the Taipei tree inventory, several crown-related features were not measured, such as dieback ratio, crown length, crown width, and crown light exposure (CLE), producing considerable uncertainty in the quantification of the overall leaf area. These crown parameters are more direct than DBH in reflecting the competition status and health condition of trees (Pace et al., 2018), and thus provide greater reliability in estimating leaf area, leaf biomass, and the associated estimations on ES provision when supplementing with DBH (Nowak, 1996). The leaf area, as a direct component for the utilization of solar radiation for photosynthesis, lies in the primacy to account for fundamental processes of plant growth, water use, energy absorption, and carbon balance (Robinson and Lundholm, 2012; Konôpka et al., 2016), so as to directly regulate the magnitude of ES. When lacking these measurements, the assumptions made in this study or empirical regression equations used in the i-Tree Eco may produce less reliable estimates, and more significantly, the variation in the results may be limited (Nowak, 1996). To reduce the uncertainty, managers can consider holding special personnel training to enhance measurement accuracy and future urban forestry inventories are recommended to add measurements in canopy-related variables, such as crown width and length, dieback ratio, and CLE.
The leaf area index (LAI), in our analysis, was not a straightforward indicator for ES values in comparison to DBH or leaf area (Figure 4). In forestry, LAI has been widely used as a collective measure to estimate the quantities of vegetation foliage (Watson, 1947) or as a central parameter to compute site-level primary production in vegetation (Kucharik et al., 1998; Parker, 2020). However, there have been debates about the suitability of LAI in estimating biomass production, because the value of LAI is sensitive to a variety of factors, such as weather, plant functional type, management treatment, disturbance history, and unexplored hidden parts (Parker, 2020). According to the SOM results, LAI was not a strong indicator of ES values, and the simulation results by i-Tree Eco spanned a wide range of LAI from 1.7 to 18.5, of which LAI greater than 8 was almost engaged with the plum trees, whereas for most species, LAI ranged from 2 to 6. Based on the calculation of i-Tree Eco on LAI as the portion of leaf area to the projected canopy cover, the plum trees happened to possess high values of LAI due to their unique trait of vegetation form and specific patterns and placement of the leaf organization in space. Therefore, we suggest using LAI as a supplementary variable with the direct tree attributes like DBH, height, and crown width/length for the valuation of ES, to avoid the greater errors hidden in the aggregation scheme of LAI.
Old trees are great assets for urban areas. In our analysis, we found that greater DBH trees provided higher gross ES. However, the SOM-based clusters indicated a situation of a much-reduced height for many old trees. This may imply a serious aging problem to retain normal growth and require an assessment of the old tree’s health. In Taipei, trees with DBH greater than 80 cm can be potentially designated as protected trees by the Forestry Act, Cultural Heritage Preservation Act, and Taipei City Tree Protection Regulation. Unfortunately, many of the designated protected trees are in bad condition, demanding further inspection and extra care to provide protection; an additional budget will be required for extra maintenance and costs to ensure the health and survival of the existing mature and old trees.
The current status of a tree can be viewed as a consequence of tree growth at a specific location under complex natural and anthropogenic disturbances. In this regard, the environmental settings and management practices are critical for major variations in the tree ES values (Nowak et al., 2008). To evaluate the long-term combined effects of maintenance practices like the pruning intensity, or natural disturbances on the provision of ES, an examination of the potential loss of the leaf area can provide some insights (Tables 3, 4). Results indicated that several Taipei street trees encountered a higher than 25% leaf area loss (Table 3), which exceeds a commonly suggested live foliage removal of 25% on an annual basis (American National Standard Institute [ANSI], 2008), and in many cities, a more conservative pruning intensity of 10% was applied to avoid defective tree physiology. Although pruning can be one of the most prevailing practices to rearrange branch distribution, enhance tree structure and growth, reduce competition between trees, and control pests or diseases (Badrulhisham and Othman, 2016), improper pruning operation can damage tree viability, induce new diseases, even lead to death (Clark and Matheny, 2010). Our analysis revealed that trees were clustered in different neurons reflecting different conditions in their leaf areas and thus causing losses in ES. Based on the difference between potential ES for a given DBH and ES value for a reduced leaf area, the results can be viewed as a reference to determine adjustments in the intensity of pruning or other maintenance practices. By checking tree performance along with frequencies, intensities, and forms of the operating maintenance procedure and practice, improvement of the urban forestry governance may be achieved.
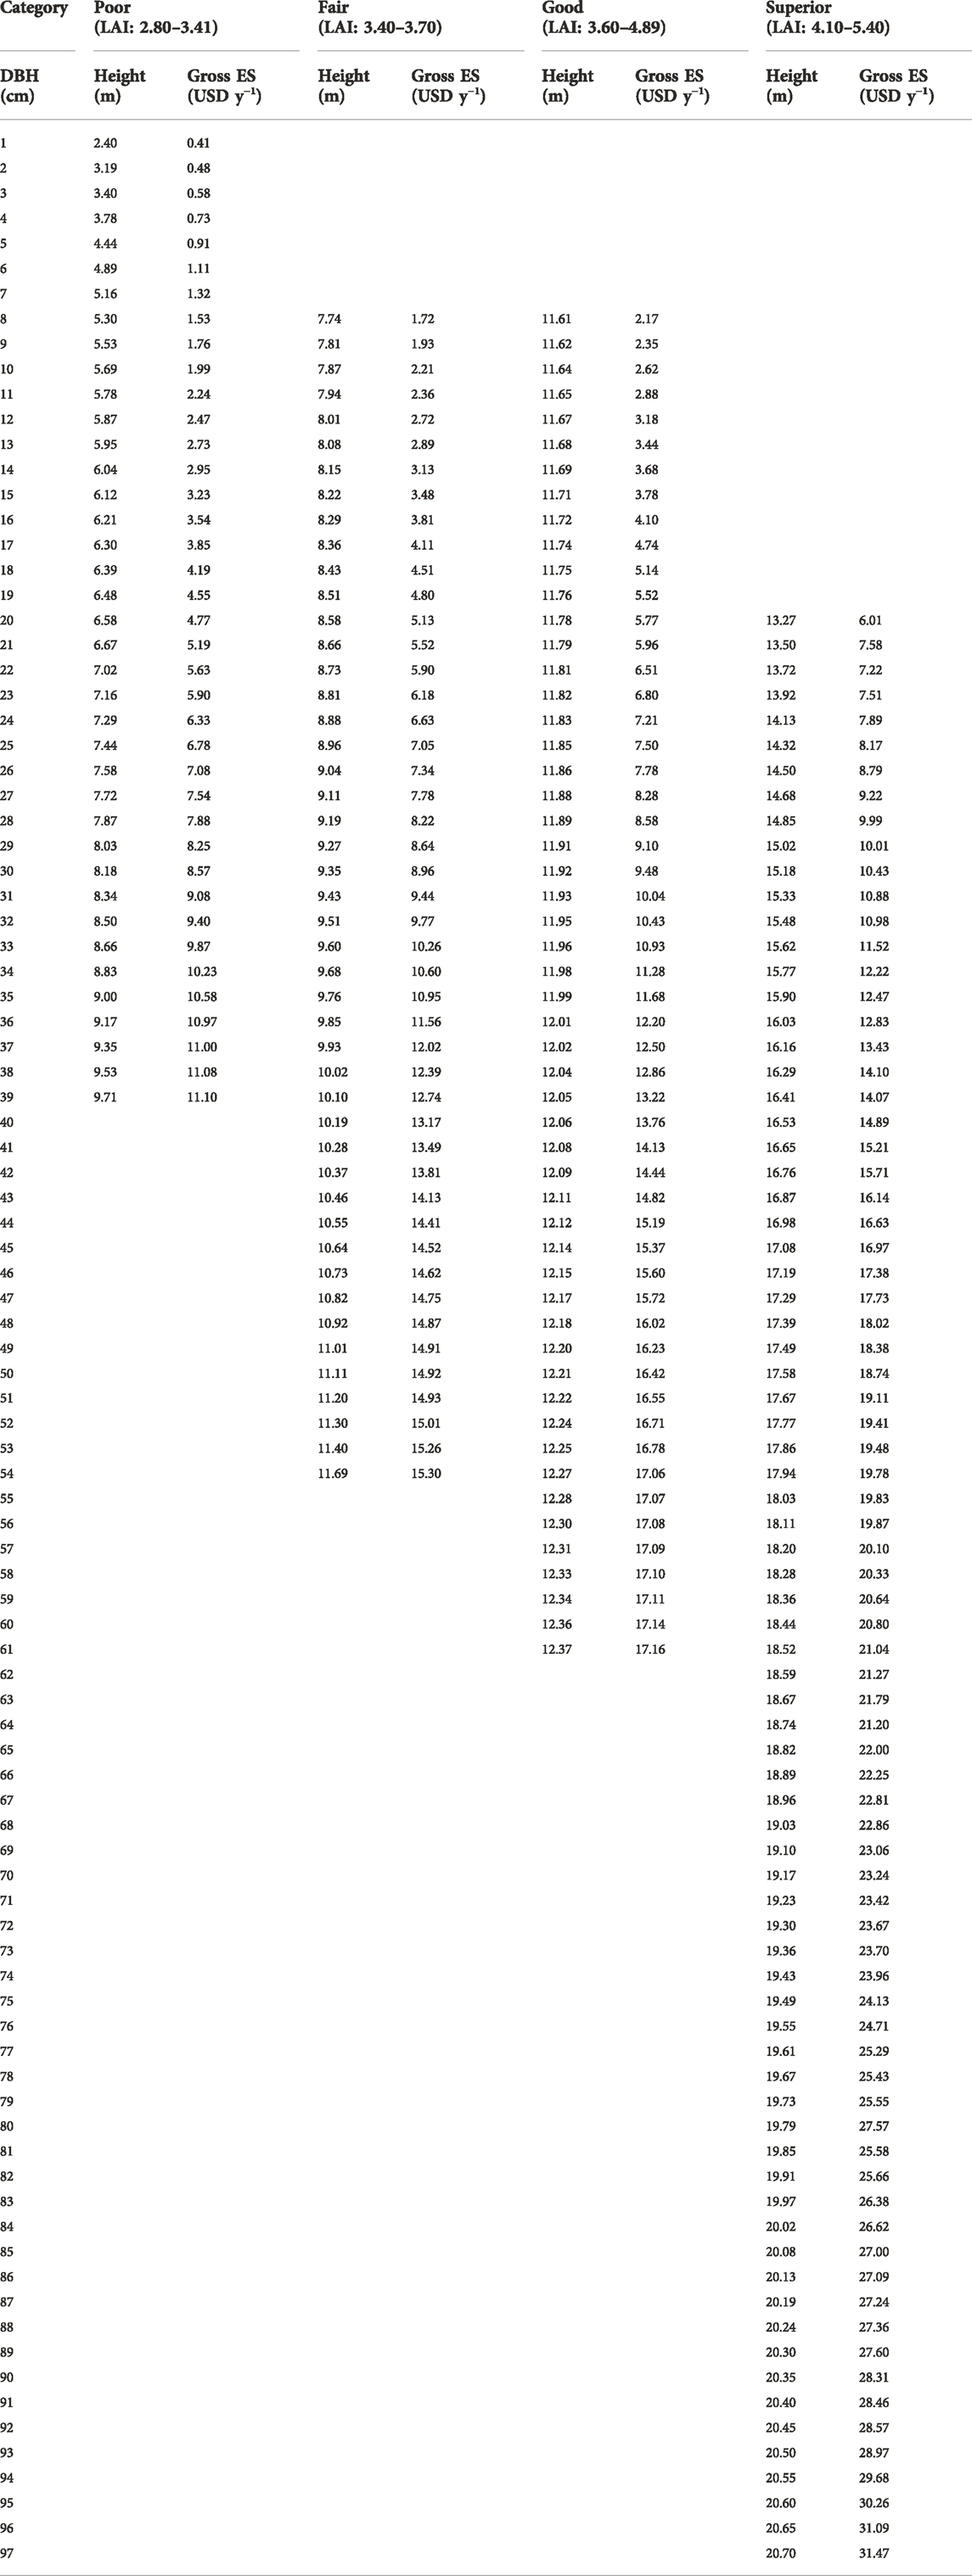
TABLE 4. An example of the lookup table for species Cinnamomum camphora.
Through the analytical method of SOM, the clear interconnected relationships between DBH and other variables can be used as a rapid and efficient examination tool for practical guidelines and references in urban forestry management. The classification can also be used to compare the current status of DBH distribution to the estimated highest gross ES and allow managers to set up priorities for inspections. Based on the explicit paired tree ID and location, possible issues can be detected by cross-checking the associations between the attributes of trees and their potential loss in ES (Figure 5). For example, for Cinnamomum camphora at DBH of 60 cm, the height varied from 7.9 to 18.5 m (Figure 5). Even though these trees were all classified in the same category of superior ES values, through a rapid check, managers can easily get an estimate of the potential loss due to the reduced height. Understanding the reason and improving the improper habitat condition can help increase ES toward a greener city.
The produced lookup tables can be used in the field to support a rapid examination on tree’s DBH and height to the gross ES. In Table 4, we provide an example of the lookup table for Cinnamomum camphora. For the frontline personnel, when they take measurements of trees, they can easily check with the table and know the growth condition of a tree. If the table refers to a tree being in poor condition, then it indicates an inspection should be done for potential problems and a regular followed up. It may imply a modification of the practice routines or an improvement in the habitat of the tree. In summation, with the SOM’s perceivable information, the problematic trees can be identified and cared for, the good performance trees can be used as models, and along with an examination of the potential loss of ES, practices, and operations can be reviewed and improved to develop a design platform for the right tree, right place, and proper maintenance practices towards sustainable urban forestry management and improving the ecosystem services.
5 Conclusion
This study develops a general framework of the AI-based SOM approach to assessing the ES provided by trees. This analytical approach provides a comprehensive understanding of the ES provision of trees varied with tree species, DBH, height, leaf area, and LAI. We found that the ES values are strongly associated with DBH, but can be further modified by the conditions of the tree, such as height and leaf area. LAI, in our analysis, is not an objective indicator for the valuation of ES, and for some species, it can even be misleading. By compiling all the data of the street trees, a lookup table can be used as a rapid examination tool in the field. Through the integration of the tree inventory data and the developed analytical approach, it is possible to apprise optimal species, criteria, and locations for city design. These findings can be applied to evaluate the long-term complex effects of natural and anthropogenic disturbances, as well as give practical guidance to help detect hidden problems and improve directions for a more sustainable future.
Data availability statement
Publicly available datasets were analyzed in this study. This data can be found here: https://data.gov.tw/dataset/128274 or https://tppkl.blob.core.windows.net/blobfs/TaipeiTree.xml.
Author contributions
STC designed the study and acquired the funding. SW compiled the data and prepared all the tables. SW and STC both contributed to data analysis, preparation of figures, interpretation, and manuscript writing and review.
Funding
This study was supported by the Ministry of Science and Technology, Taiwan (Grant No. MOST 107-2621-M-002-004-MY3 and MOST 108-2621-M-002-010-MY3), and Academia Sinica (AS-SS-108-03-1).
Acknowledgments
We sincerely thank Dr. Emily Nicholson at Deakin University, Australia for her suggestions and assistance with English writing that greatly improved this manuscript. We highly appreciate the Central Weather Bureau, Ministry of Transportation and Communication, Taiwan (R.O.C.), and Parks and Street Lights Office, Taipei City Government, for providing the meteorological and street tree inventory data, respectively.
Conflict of interest
The authors declare that the research was conducted in the absence of any commercial or financial relationships that could be construed as a potential conflict of interest.
Publisher’s note
All claims expressed in this article are solely those of the authors and do not necessarily represent those of their affiliated organizations, or those of the publisher, the editors and the reviewers. Any product that may be evaluated in this article, or claim that may be made by its manufacturer, is not guaranteed or endorsed by the publisher.
References
Abdi, B., Hami, A., and Zarehaghi, D. (2020). Impact of small-scale tree planting patterns on outdoor cooling and thermal comfort. Sustain. Cities Soc. 56, 102085. doi:10.1016/j.scs.2020.102085
American National Standard Institute [Ansi], (2008). ANSI A300, Part 1– Tree, shrub and other woody plant management–standard practice pruning. Londonderry, NH: Tree Care Industry Association.
Badrulhisham, N., and Othman, N. (2016). Knowledge in tree pruning for sustainable practices in urban setting: Improving our quality of life. Procedia - Soc. Behav. Sci. 234, 210–217. doi:10.1016/j.sbspro.2016.10.236
Berland, A., Shiflett, S. A., Shuster, W. D., Garmestani, A. S., Goddard, H. C., Herrmann, D. L., et al. (2017). The role of trees in urban stormwater management. Landsc. Urban Plan. 162, 167–177. doi:10.1016/j.landurbplan.2017.02.017
Chang, F. J., Huang, C. W., Cheng, S. T., and Chang, L. C. (2017). Conservation of groundwater from over-exploitation— scientific analyses for groundwater resources management. Sci. Total Environ. 598, 828–838. doi:10.1016/j.scitotenv.2017.04.142
Chang, L. C., Wang, W. H., and Chang, F. J. (2021). Explore training self-organizing map methods for clustering high-dimensional flood inundation maps. J. Hydrol. X. 595, 125655. doi:10.1016/j.jhydrol.2020.125655
Chen, Y. J., Nicholson, E., and Cheng, S. T. (2020). Using machine learning to understand the implications of meteorological conditions for fish kills. Sci. Rep. 10 (1), 17003. doi:10.1038/s41598-020-73922-3
Cheng, S. T., Tsai, W. P., Yu, T. C., Herricks, E. E., and Chang, F. J. (2018). Signals of stream fish homogenization revealed by AI-based clusters. Sci. Rep. 8, 15960. doi:10.1038/s41598-018-34313-x
Clark, J., and Matheny, N. (2010). The research foundation to tree pruning: A review of the literature. Arboric. Urban For. 36 (3), 110–120. doi:10.48044/jauf.2010.015
Davies, H. J., Doick, K. J., Hudson, M. D., and Schreckenberg, K. (2017). Challenges for tree officers to enhance the provision of regulating ecosystem services from urban forests. Environ. Res. 156, 97–107. doi:10.1016/j.envres.2017.03.020
Fini, A., Frangi, P., Faoro, M., Piatti, R., Amoroso, G., and Ferrini, F. (2015). Effects of different pruning methods on an urban tree species: A four-year-experiment scaling down from the whole tree to the chloroplasts. Urban For. Urban Green. 14, 664–674. doi:10.1016/j.ufug.2015.06.011
Jansson, Å. (2013). Reaching for a sustainable, resilient urban future using the lens of ecosystem services. Ecol. Econ. 86, 285–291. doi:10.1016/j.ecolecon.2012.06.013
Klobucar, D., and Subasic, M. (2012). Using self-organizing maps in the visualization and analysis of forest inventory. iForest 5, 216–223. doi:10.3832/ifor0629-005
Konôpka, B., Pajtík, J., Marušák, R., Bošefa, M., and Lukac, M. (2016). Specific leaf area and leaf area index in developing stands of Fagus sylvatica L. and Picea abies Karst. For. Ecol. Manag. 364, 52–59. doi:10.1016/j.foreco.2015.12.005
Koricho, H. H., Seboka, A. D., Fufa, F., Gebreyesus, T., and Cong, S. (2022). Study on the ecosystem services of urban forests: Implications for climate change mitigation in the case of adama city of oromiya regional sate, Ethiopia. Urban Ecosyst. 25, 575–584. doi:10.1007/s11252-021-01152-0
Kucharik, C. J., Norman, J. M., and Gower, S. T. (1998). Measurements of branch area and adjusting leaf area index indirect measurements. Agric. For. Meteorol. 91, 69–88. doi:10.1016/S0168-1923(98)00064-1
Lawrence, A., De Vreese, R., Johnston, M., Van Den Bosch, C. C. K., and Sanesi, G. (2013). Urban forest governance: Towards a framework for comparing approaches. Urban For. Urban Green. 12 (4), 464–473. doi:10.1016/j.ufug.2013.05.002
Lin, B. J., Kroll, C. N., and Nowak, D. J. (2020). Ecosystem service-based sensitivity analyses of i-Tree Eco. Arboric. Urban For. 46 (4), 287–306. doi:10.48044/jauf.2020.021
Livesley, S. J., Mcpherson, E. G., and Calfapietra, C. (2016). The urban forest and ecosystem services: Impacts on urban water, heat, and pollution cycles at the tree, street, and city scale. J. Environ. Qual. 45 (1), 119–124. doi:10.2134/jeq2015.11.0567
Mcpherson, E. G., van Doorn, N., and de Goede, J. (2016). Structure, function and value of street trees in California, 17. USA: Urban For Urban Gree, 104–115. doi:10.1016/j.ufug.2016.03.013
Miao, C., Yu, S., Hu, Y., Liu, M., Yao, J., Zhang, Y., et al. (2021). Seasonal effects of street trees on particulate matter concentration in an urban street canyon. Sustain. Cities Soc. 73, 103095. doi:10.1016/j.scs.2021.103095
Mofrad, F., Ignatieva, M., and Vernon, C. (2022). The discourses, opportunities, and constraints in canberra’s green infrastructure planning. Urban For. Urban Green. 74, 127628. doi:10.1016/j.ufug.2022.127628
Nowak, D. J., Crane, D. E., Stevens, J. C., Hoehn, R. E., Walton, J. T., and Bond, J. (2008). A ground-based method of assessing urban forest structure and ecosystem services. Arboric. Urban For. 34 (6), 347–358. doi:10.48044/jauf.2008.048
Nowak, D. J., Crane, D. E., and Stevens, J. C. (2006). Air pollution removal by urban trees and shrubs in the United States. Urban For. Urban Green. 4 (3-4), 115–123. doi:10.1016/j.ufug.2006.01.007
Nowak, D. J., and Crane, D. E. (2000). “The Urban Forest Effects UFORE model: Quantifying urban forest structure and functions,” in Integrated tools for natural resources inventories in the 21st century. General Technical Report NC-212. Editors M. Hansen, and T. Burk (St. Paul, MN -Pacific Southwest Research Station: U.S. Department of Agriculture, Forest Service), 714–720. Retrieved from https://www.nrs.fs.fed.us/pubs/gtr/gtr_nc212/gtr_nc212_714.pdf.
Nowak, D. J. (1996). Estimating leaf area and leaf biomass of open-grown deciduous urban trees. Sci 42 (4), 504–507.
Nowak, D. J. (2020). Understanding i-Tree: Summary of programs and methods. Madison, WI: U.S. Department of Agriculture, Forest Service, Northern Research Station, 100 [plus 14 appendixes]. doi:10.2737/NRS-GTR-200
Nytch, C. J., Meléndez-Ackerman, E. J., Pérez, M. E., and Ortiz-Zayas, J. R. (2019). Rainfall interception by six urban trees in San Juan, Puerto Rico. Urban Ecosyst. 22 (1), 103–115. doi:10.1007/s11252-018-0768-4
Ordóñez, C., and Duinker, P. N. (2013). An analysis of urban forest management plans in Canada: Implications for urban forest management. Landsc. Urban Plan. 116, 36–47. doi:10.1016/j.landurbplan.2013.04.007
Ordóñez, C., Threlfall, C. G., Kendal, D., Hochuli, D. F., Davern, M., Fuller, R. A., et al. (2019). Urban forest governance and decision-making: A systematic review and synthesis of the perspectives of municipal managers. Landsc. Urban Plan. 189 (4), 166–180. doi:10.1016/j.landurbplan.2019.04.020
Pace, R., Biber, P., Pretzsch, H., and Grote, R. (2018). Modeling ecosystem services for park trees: Sensitivity of i-tree eco simulations to light exposure and tree species classification. Forests 9 (2), 89–18. doi:10.3390/f9020089
Parker, G. G. (2020). Tamm review: Leaf area index (LAI) is both a determinant and a consequence of important processes in vegetation canopies. For. Ecol. Manage. 477, 118496. doi:10.1016/j.foreco.2020.118496
Pataki, D. E., Alberti, M., Cadenasso, M. L., Felson, A. J., McDonnell, M. J., Pincetl, S., et al. (2021). The benefits and limits of urban tree planting for environmental and human health. Front. Ecol. Evol. 9, 603757. doi:10.3389/fevo.2021.603757
Piana, M. R., Hallett, R. A., Johnson, M. L., Sonti, N. F., Brandt, L. A., Aronson, M. F., et al. (2021). Climate adaptive silviculture for the city: Practitioners and researchers co-create a framework for studying urban oak-dominated mixed hardwood forests. Front. Ecol. Evol. 9, 750495. doi:10.3389/fevo.2021.750495
Qin, L., Mao, P., Xu, Z., He, Y., Yan, C., Hayat, M., et al. (2022). Accurate measurement and assessment of typhoon-related damage to roadside trees and urban forests using the unmanned aerial vehicle. Remote Sens. (Basel). 14 (9), 2093. doi:10.3390/rs14092093
Revelli, R., and Porporato, A. (2018). Ecohydrological model for the quantification of ecosystem services provided by urban street trees. Urban Ecosyst. 21, 489–504. doi:10.1007/s11252-018-0741-2
Reynolds, H. L., Brandt, L., Fischer, B. C., Hardiman, B. S., Moxley, D. J., Sandweiss, E., et al. (2020). Implications of climate change for managing urban green infrastructure: An Indiana, US case study. Clim. Change 163, 1967–1984. doi:10.1007/s10584-019-02617-0
Riondato, E., Pilla, F., Basu, A. S., and Basu, B. (2020). Investigating the effect of trees on urban quality in Dublin by combining air monitoring with i-Tree Eco model. Sustain. Cities Soc. 61, 102356. doi:10.1016/j.scs.2020.102356
Robinson, S. L., and Lundholm, J. T. (2012). Ecosystem services provided by urban spontaneous vegetation. Urban Ecosyst. 15, 545–557. doi:10.1007/s11252-012-0225-8
Rötzer, T., Moser-Reischl, A., Rahman, M. A., Grote, R., Pauleit, S., and Pretzsch, H. (2020). “Modelling urban tree growth and ecosystem services: Review and perspectives,”. Progress in botany. Editors F. M. Cánovas, U. Lüttge, M. C. Risueño, and H. Pretzsch (Cham: Springer), 82. doi:10.1007/124_2020_46
Ryder, C. M., and Moore, G. M. (2013). The arboricultural and economic benefits of formative pruning street trees. Arboric. Urban For. 39, 17–24. doi:10.48044/jauf.2013.004
Sanders, J. R., and Grabosky, J. C. (2014). 20 years later: Does reduced soil area change overall tree growth? Urban For. Urban Green. 13 (2), 295–303. doi:10.1016/j.ufug.2013.12.006
Sang, Å. O., Hagemann, F. A., Ekelund, N., and Svännel, J. (2021). Urban ecosystem services in strategic planning in Swedish municipalities. Urban Ecosyst. 24, 1343–1357. doi:10.1007/s11252-021-01113-7
Speak, A. F., Montagnani, L., Solly, H., Wellstein, C., and Zerbe, S. (2022). The impact of different tree planting strategies on ecosystem services and disservices in the piazzas of a northern Italian city. Urban Ecosyst. 25, 355–366. doi:10.1007/s11252-021-01158-8
Tsai, W. P., Huang, S. P., Cheng, S. T., Shao, K. T., and Chang, F. J. (2017). A data-mining framework for exploring the multi-relation between fish species and water quality through self-organizing map. Sci. Total Environ. 579, 474–483. doi:10.1016/j.scitotenv.2016.11.071
Tsoka, S., Leduc, T., and Rodler, A. (2021). Assessing the effects of urban street trees on building cooling energy needs: The role of foliage density and planting pattern. Sustain. Cities Soc. 65, 102633. doi:10.1016/j.scs.2020.102633
USDA Forest Service (2016). i-Tree Eco User’s Manual v 6.0. Washington, DC: U.S. Department of Agriculture, Forest Service, Northeastern Research Station, 93.
Watson, D. J. (1947). Comparative physiological studies on the growth of field crops: I. Variation in net assimilation rate and leaf area between species and varieties, and within and between years. Ann. Bot. 11 (1), 41–76. doi:10.1093/oxfordjournals.aob.a083148
Wei, S., and Cheng, S. T. (2022). Estimating pruning-caused loss on ecosystem services of air pollution removal and runoff avoidance. Sustainability 14 (11), 6637. doi:10.3390/su14116637
Keywords: urban forestry, ecosystem services, street trees, i-Tree Eco, artificial intelligence, self-organizing map (SOM)
Citation: Wei S and Cheng ST (2022) An artificial intelligence approach for identifying efficient urban forest indicators on ecosystem service assessment. Front. Environ. Sci. 10:994389. doi: 10.3389/fenvs.2022.994389
Received: 14 July 2022; Accepted: 04 October 2022;
Published: 14 October 2022.
Edited by:
Ling Shang, Nanjing vocational college of informaiton technolgoy, ChinaReviewed by:
Diogo Guedes Vidal, University of Coimbra, PortugalGiuliano Maselli Locosselli, University of São Paulo, Brazil
Rocco Pace, Karlsruhe Institute of Technology (KIT), Germany
Copyright © 2022 Wei and Cheng. This is an open-access article distributed under the terms of the Creative Commons Attribution License (CC BY). The use, distribution or reproduction in other forums is permitted, provided the original author(s) and the copyright owner(s) are credited and that the original publication in this journal is cited, in accordance with accepted academic practice. No use, distribution or reproduction is permitted which does not comply with these terms.
*Correspondence: Su‐Ting Cheng, Y2hlbmdzdXRpbmdAbnR1LmVkdS50dw==