 Suria Tarigan
 Yudha Kristanto
 Waluyo Y. Utomo4
- 1Department of Soil Science and Land Resources Management, Faculty of Agriculture, IPB University, Bogor, Indonesia
- 2Centre for Transdisciplinary and Sustainability Sciences (CTSS), IPB University, Bogor, Indonesia
- 3Natural Resources and Environmental Management Science, Graduate School, IPB University, Bogor, Indonesia
- 4Directorate of Peat Ecosystem Degradation Control, Directorate General of Environmental Pollution and Degradation Control, Ministry of Environment and Forestry, Jakarta, Indonesia
Peatland is a fragile ecosystem in the tropical region which is prone to subsidence. Until now, there is still lack of procedure to rapidly assess a tropical peatland subsidence in a large area. Our objective was to compare subsidence in a used and restored zone in a peatland hydrological unit using synthetic aperture radar data from Sentinel-1A products (SAR data) in South Sumatra, Indonesia from the period of 2014–2021. The subsidence rate of used peatland estimated by the D-InSAR procedure were in the range of 28–80 cm year−1 in the early period of its utilization and becoming less for the consecutive year (16–48 cm year−1). Meanwhile, the subsidence rate based on the field surveys was in the range of 4–50 cm year−1 in the early period of peatland utilization. The subsidence rate in the used peatland zone (agriculture and plantations) was higher than that in the restoration zone for all SAR data pairs used in our study. The SAR data is a potential tool for the assessment, monitoring and differentiating subsidence rates among different peatland uses in a large area. This tool will help the Directorate of Peat Ecosystem Degradation Control, Directorate General of Environmental Pollution and Degradation Control, and Ministry of Environment and Forestry to plan for better peatland management and restoration.
1 Introduction
Peatlands of the world have the role to 1) store 525 Gt of global carbon, 2) supply 10% of the global freshwater, and 3) regulate floods (Joosten and Clarke, 2002; Jaenicke et al., 2008; Page et al., 2011; Acreman and Holden, 2013).
Peatland in Indonesia covers 13.9 million ha, being mostly located in Sumatra, Kalimantan, and Papua. Some peatlands in Indonesia are used for agriculture and plantation purposes, potentially accelerating their oxidation and decomposition processes. The continual oxidation and decomposition of peatlands can result in substantial land subsidence (Gambolati et al., 2005), and cumulative subsidence can reach between 100 and 150 cm in the peat of more than 300 cm thick over the first 5 years after its use in Southeast Asia (Hooijer et al., 2012a; Hooijer et al., 2012b). Large scale subsidence studies conducted in oil palm plantations on peatlands in South East Asia have reported that, at average water table depths of 0.7 m, the subsidence rate is high at the beginning of peat draining (Hooijer et al., 2012a; Hooijer et al., 2012b). Continuous land subsidence can lead to loss of land because it can cause permanently flooded areas, which results in a loss of future peatland ecosystem services, such as climate and water regulations (Jaenicke et al., 2008; Yule, 2010; Page et al., 2011; Gao et al., 2015; Tarigan et al., 2021). Therefore, monitoring is important for identifying areas experiencing substantial subsidence and preparing for the implementation of mitigation measures. Peatland ecosystems are commonly situated in remote areas, and often lack detailed biophysical data. For such areas, satellite products such as Sentinel-1 data offer a feasible option for identifying areas experiencing subsidence. Sentinel-1 data are free to access, and in combination with the D-InSAR method, can be used to inexpensively estimate peat subsidence (Lees et al., 2018; Khakim et al., 2020). Sentinel-1 data had been used in various peatland studies including study of soil moisture and groundwater table depths monitoring (Asmuss et al., 2019; Lees et al., 2021) and it can partially pass through the treetops depending on the crown’s characteristics (Czapiewski and Szumi´nska, 2022). The subsidence of peatlands correlates with the presence of drainage activities (Grzywna, 2017).
Our objective in this study was to identify subsidence rates in used and restored peatland based on interferometric synthetic aperture radar data from Sentinel-1A products (D-InSAR). The advantage of SAR products is their ability to record data from the Earth’s surface without depending on cloud conditions, which is often a major obstacle for remote-sensing products, for example, multispectral data (Shimada et al., 2016; Lees et al., 2018; Lal et al., 2021). The C-band dual-polarization Sentinel-1 data serve as an advantageous tool for monitoring tropical peatland and discriminating peat depth classes (Khakim et al., 2020). D-InSAR procedure can be used to accurately detect the location, range, spatial change trend, and basin edge information of mining subsidence (Chen et al., 2021). SAR data, in comparison with optical remote sensors, are advantageous because of their ability to penetrate vegetation canopies (Torbick et al., 2012; Merchant et al., 2017; Canisius et al., 2019). While the D-InSAR procedures had been used to monitor mining subsidence, its application to study peatland subsidence is still rare. The subsidence is an important indicator for peatland degradation and their contribution to carbon emission, especially in the tropical region. Our study examined the application of the D-InSAR procedure to characterize the peatland subsidence and then compared with available field survey data. The result of our study will help the relevant authority to use tool to monitor peatland subsidence in a large area which are very important for the mitigation of the peatland subsidence.
The two main InSAR methods used for subsidence identification are: a) D-InSAR and b) SBAS-InSAR. Both D-InSAR and SBAS-InSAR can be used to effectively monitor subsidence in real time (Yang et al., 2018; Chen et al., 2021). The D-InSAR method is used as a short-term baseline to minimize decorrelation due to temporal changes (Yang et al., 2018; Du et al., 2021). As our purpose in this study was to identify subsidence on a yearly basis, we selected the D-InSAR method as appropriate for application. Natural conditions such as peatland moisture content, atmospheric conditions, and vegetation canopy can affect the results of D-InSAR analysis (Khakim et al., 2020; Lal et al., 2021; Tampuu et al., 2021). Soil moisture is an important factor in determining the penetration depth of the radar signals. Changes in the soil volumetric water content can cause a change of up to 60 mm in C-band penetration depth (Nolan et al., 2003; Nolan and Fatland, 2003).
The D-InSAR method generates an interferogram of a pair of SAR images before and after subsidence and then subtracts the subsidence information from the differential interferogram (Massonnet et al., 1993). The basic principle of D-InSAR method is to generate an interferogram of two radar images before and after deformation, remove topographical factors using the difference from the external DEM to generate a differential interferogram (Chen et al., 2021), The result of D-InSAR processing is line-of-sight imagery (LOS), which provides displacement values in every pixel of the SAR data.
2 Materials and methods
2.1 Study area
The study area was in the Merang-Ngirawan peat hydrological unit (PHU) (Figure 1). A peatland hydrological unit (PHU) is a peat landscape between two rivers, often with one or more elevated peat domes (Tarigan et al., 2020). The PHU was 80,000 ha, with geographic coordinates of 01◦47′59″–02◦04′26″S and 103◦59′06″–104◦14′57″E., and the dominant peat thickness in the study area was between 300 and 450 cm. However, in some areas, the peat thickness could reach 800 cm. Part of the area in the northern part was used for agriculture and plantations. The other part in the southern area (24,000 ha) was managed as a peat restoration zone. The plantations in the northern part and the restoration in the southern part began around 2009 (Fitri, 2009). The study area has a fairly high annual average rainfall of 2,500 mm, with the highest rainfall occurring in December-January of 250–400 mm and the lowest in June of 64–86 mm. The annual average temperature is 26°C (Kelola Sendang Project, 2018).
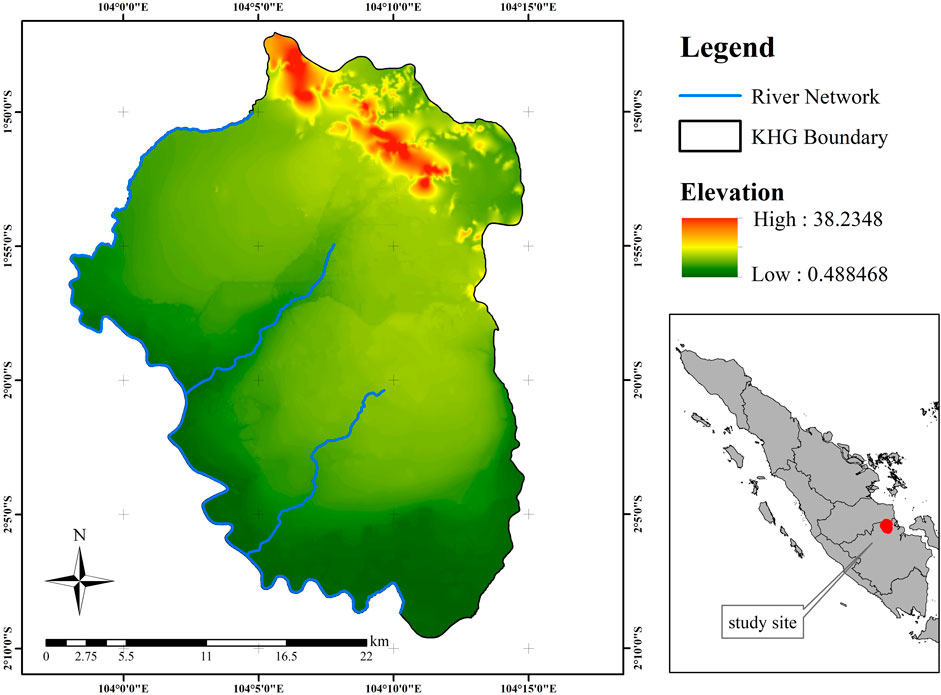
FIGURE 1. Study area in Merang-Ngirawan peatland hydrological unit (PHU), Sumatra Indonesia.
A time series land use map, Landsat images, LiDAR map, field data on peat thickness, and rainfall data were available for our study area (Table 1).
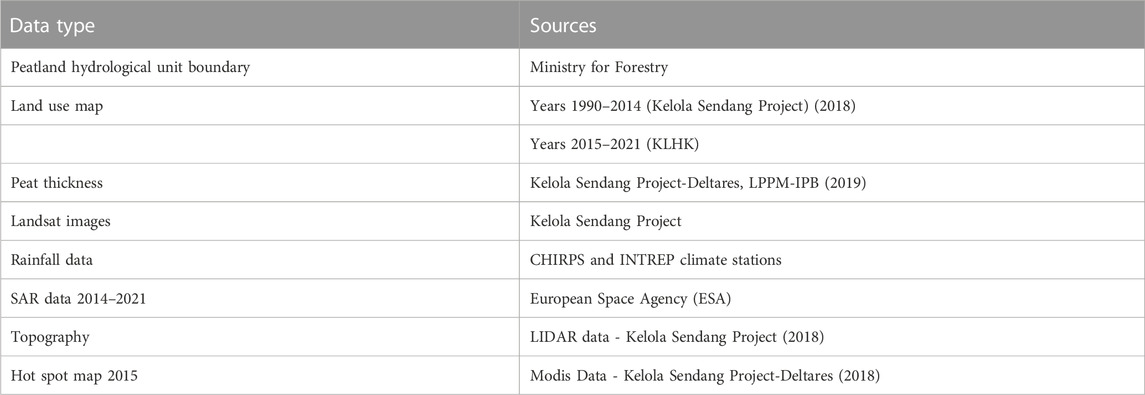
TABLE 1. Data description.
The land use data for years 1990–2014 was obtained from the Kelola Sendang Project and for years 2015–2021 from Ministry for Forestry. Together with the corresponding Landsat image, the land use map was used to identify the land use transitions, especially related to the period when the peatlands started to be used for agriculture and plantations and the existence of draining canal networks. The identification of this period was necessary in relation to changes in the subsidence rate.
2.2 Data analysis
2.2.1 Differential interferometry SAR (D-InSAR)
Vegetation canopy can reduce the temporal coherence of the D-InSAR procedure. To minimize the impact of the vegetation canopy, we used a pair of SAR acquisitions with a short time interval (1 year). In a 1-year interval, we expected minor vegetation changes of plantation as perenial crops. In the dry and rainy seasons, peatlands have different groundwater depths. During the dry season, the groundwater table decreases; consequently, the number of pores filled with the water in the peatland near the surface decreases, which can cause a temporary surface decrease (subsidence). To minimize the impact of different soil moisture contents between two SAR images, we only used images within month of a similar season. Atmospheric-induced errors should remain relatively constant over a few kilometers (Foster et al., 2006; Bekaert et al., 2015).
During the rainy season, the groundwater table fills all the peatland pores, which can slightly increase its surface level. The surface level differences in the dry and wet seasons are not categorized as subsidence because they are only temporary conditions due to groundwater level fluctuations in different seasons. In our study, we dealt with the permanent subsidence of the peatland surface. Permanent subsidence in peatlands is caused by decomposition, oxidation, and carbon emissions occurring over several years. In Table 2, we list the daily rainfall conditions during the acquisition days of the SAR data and monthly cumulative rainfall in December for each acquisition year. Moderate-to low-intensity rainfall events do not interfere with SAR data coherence (Khakim et al., 2020; Tampuu et al., 2021).
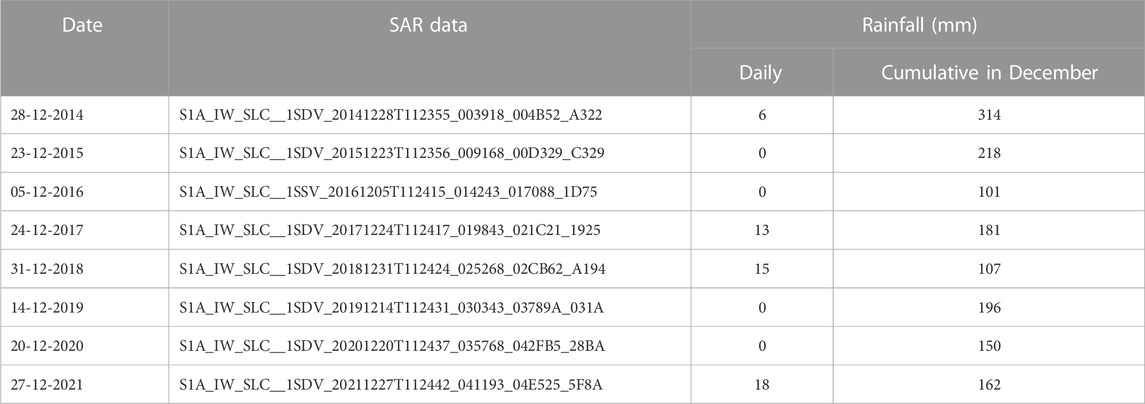
TABLE 2. Rainfall in study area according to CHIRPS data.
We analyzed peat subsidence by pairing yearly synthetic aperture radar (SAR) data between December 2014 and December 2021. In this study the SAR data available in the European Space Agency (ESA) website was used, i.e., Sentinel-1A Single Look Complex (SLC) and interferometric wide (IW). The resolution of the Sentinel-1A imagery is 20 m × 20 m (Tampuu et al., 2021). The SLC data consisted of several bursts, which were divided into three subswaths (i.e., IW1, IW2, and IW3). Our study area was situated in the IW2 subswath. We selected the VV polarization during the TOPS Split command to reduce the data volume. The VV coherence is more responsive to surface changes than the VH coherence (Abdikan et al., 2016). The scene was a subset of the boundary of the Merang-Ngirawan PHU (Figure 1). We used ESA SNAP software to process the SAR data, including splitting the subswath and selecting the bursts (TOPS Split) (Figure 2).
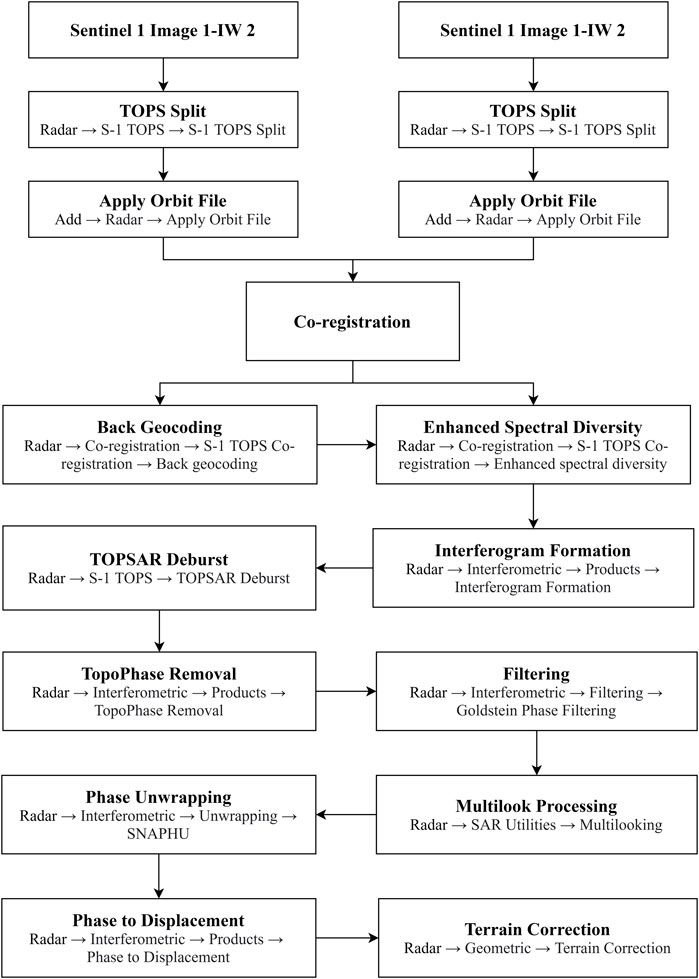
FIGURE 2. Flowchart for D-InSAR processing.
The D-InSAR processing steps included coregistration, interferogram formation, TOPS deburst, filtering, phase unwrapping using the statistical cost network flow algorithm for phase unwrapping (SNAPHU), and terrain correction (Braun and Veci, 2020). The coregistration step was necessary to align the pixels between one SAR datum to another in two images. We used the interferogram formation in the flattening step to change the projection field. This step also produced coherent information between the two images. Coherence indicates the consistency between pairs of SAR imagery. The coherence value ranges between 0 and 1, where a value of 0.2 is considered acceptable (Khakim et al., 2020). Topo phase removal was used to remove topographic effects using Digital Elevation Model (DEM) SRTM 30 m × 30 m data (Massonnet et al., 1993).
Phase unwrapping was performed to determine the absolute interferometric phase of the relative phase. The absolute phase has an interval value between -π and + π, which must be converted into metric units for more accurate interpretation of the result. The conversion to metric unit was carried out by performing phase unwrapping of the interferogram using the statistical cost network flow algorithm for phase unwrapping (SNAPHU) (Braun and Veci, 2020). Before phase unwrapping, we performed multilooking and coherence-weighted phase filtering of Goldstein phase filtering (Goldstein and Werner, 1998), separately. Phase filtering in the D-InSAR process is used to increase the signal-to-noise ratio (SNR) so that noise and orbit effects can be minimized. The final step of D-InSAR processing was terrain correction of the interferometric phase images into a geographic or UTM coordinate system.
2.2.2 Peat depth
Peat depth mapping in the study area has been conducted by several institutions since 2010 (LPPM-IPB, 2019). To calculate the actual subsidence rate, we used peat thickness data from the field surveys in 2014 and 2019 and calculated the thickness change. Peat thickness data for 2014 and 2019 were measured by drilling the peat in 43 and 135 sampling points, respectively. For both years, we chose several sampling positions that overlapped or were close to each other in the field. Peat thickness data comparisons in both years were only available in the used area in the northern part. After calculating the peatland subsidence based on the field surveys, we then compared the result to the subsidence rate identified using the differential interferometry SAR (D-InSAR) procedure in the used peatland.
3 Results
3.1 Land use change
Land uses in the PHU could be broadly categorized into two types, a) agricultural and plantation in the northern part and b) ecosystem restoration in the southern part (Figure 3C). Based on the time series Landsat image, the PHU was still dominated by secondary forests and shrub in 2005 (Figure 3A). Peatland use has started in the northern part since 2008–2009 (Fitri, 2009). In 2009, some anthropogenic activities in the northeastern part of the PHU were visible in the Landsat image, such as the opening of the secondary forest for the establishment of new plantations (purple) (Figure 3B). The restoration activities in the southern part of the PHU also started around 2009 (Fitri, 2009). We could visually identify both areas in the Landsat image 2014 (Figure 3C) and the corresponding land use maps (Figures 4A–C). Peatland use for agriculture and plantations requires water drainage. During the rainy season, water is drained from the peatland to maintain the required ground water level of 40 cm. Water is drained by constructed drainage canal networks. During the dry season, the drainage canals are closed to prevent water level drawdown. However, during prolonged dry seasons, the groundwater level may be lower than 100 cm in the used zone. During this period, intensive peatland oxidation and decomposition occur, leading to higher subsidence. In the conservation zone, no water draining is conducted during the rainy season. Excess water during the rainy season is maintained as much as possible in the field to maintain a high groundwater level throughout the dry season. In this case, the oxidation and decomposition remain low. Consequently, subsidence in the conservation zone is lower than that in the used zone.
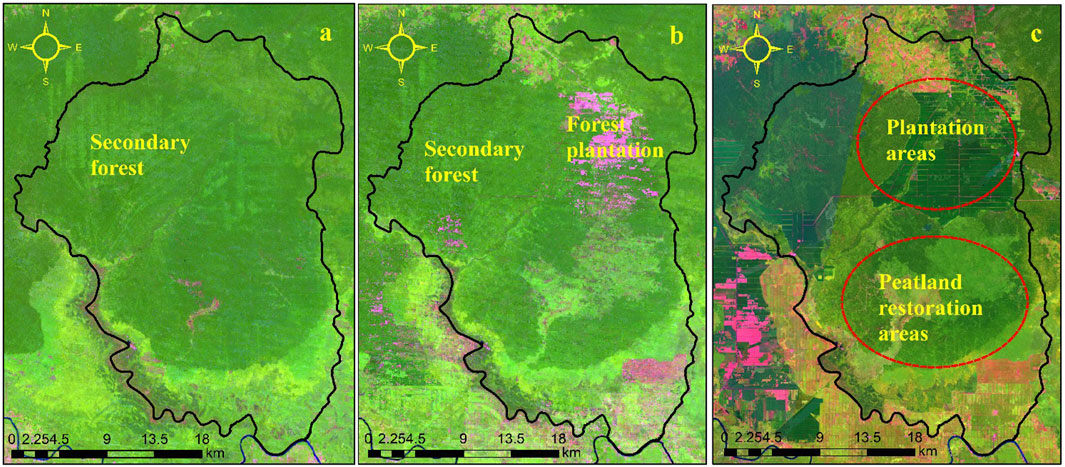
FIGURE 3. Landsat images of study area in (A) 2005, (B) 2009, and (C) 2014.
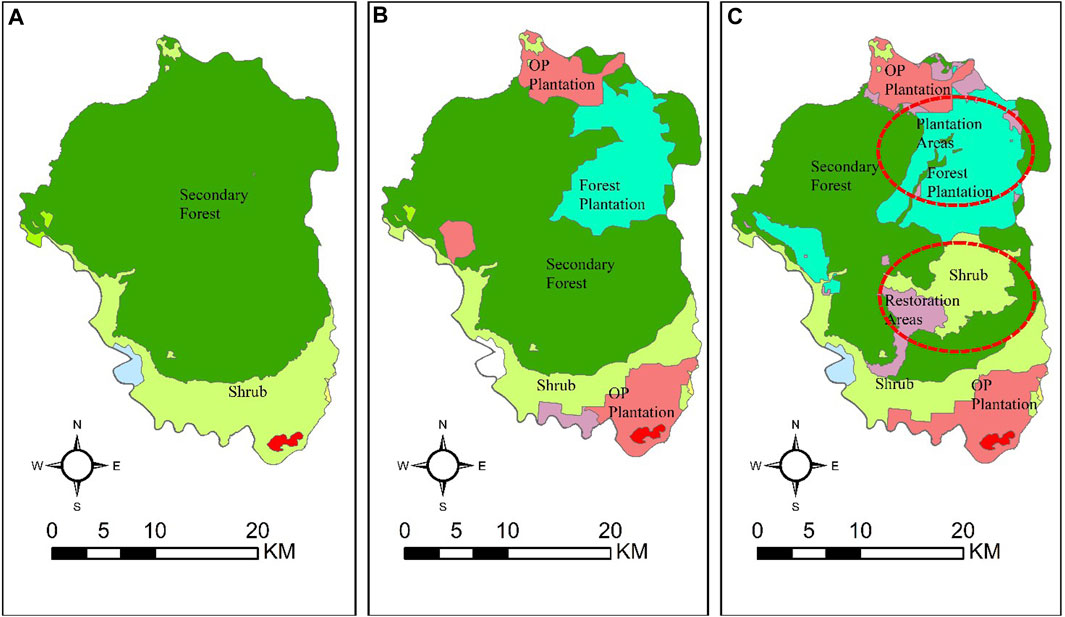
FIGURE 4. Land use map of study area in (A) 2005, (B) 2009, and (C) 2014.
In the 2014, the drainage canal networks in the northern part of the PHU were relatively developed and interconnected. If not properly managed, these draining canals accelerate peatland subsidence.
The establishment of plantations in the PHU occurred mainly during 2006–2009 (Figure 5). The plantation developments are in line with the decline of secondary forest and shrub areas at the same time periods. After 2014 the plantation areas seem to become constant.
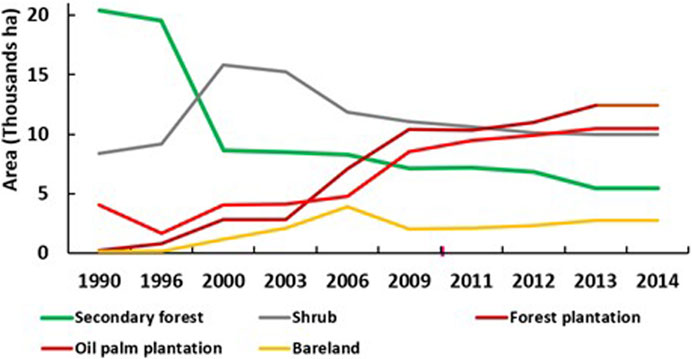
FIGURE 5. Main land use change dynamic in the study area during time period 1990–2014.
3.2 Identification of peatland subsidence with D-InSAR procedure
The accuracy of the D-InSAR procedure is reflected in the interferometric coherence value. In our D-InSAR analysis, 69% of the pixels in our study area had a coherence value > 0.2 (Figures 6A, B). Interferometric coherence is a normalized measure of the similarity between two SAR data acquisitions, which quantifies the changes in the amplitude and phase of the image pixels in an SAR image pair (Zebker and Villasenor, 1992; Preiss et al., 2006; Scott et al., 2017). Coherence is high when the position and physical properties of the scatterers within the averaging window are similar for both images between acquisitions (Tamm et al., 2016).
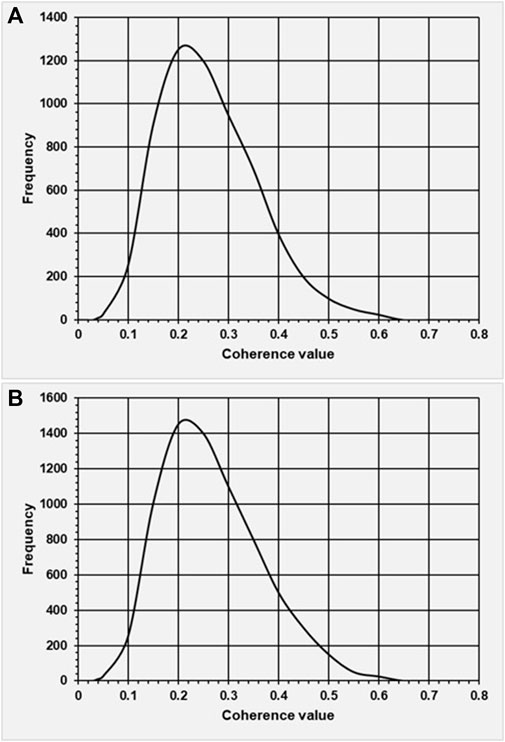
FIGURE 6. Coherence histogram for (A) 2014–2015 and (B) 2015–2016.
We identified subsidence using the D-InSAR method on a yearly basis starting from the period of 2014–2015 until the 2020–2021 data pairs. The results of the analysis show that a) relatively higher subsidence in the study area occurred in the northern part of the PHU, where peatland are used for plantations; b) the highest subsidence rate (>0.8 m/year) occurred in the early use of peatland in year 2014–2015 (Figure 7A). Thereafter, the peatland subsidence rate decreased (Figures 7B–F). In the restored areas, peatlands are not used for agriculture and plantations. The existing canal drainage are also blocked in these areas. This is the main reason why the subsidence rate in the southern area in all years considered was consistently lower than that in the northern part.
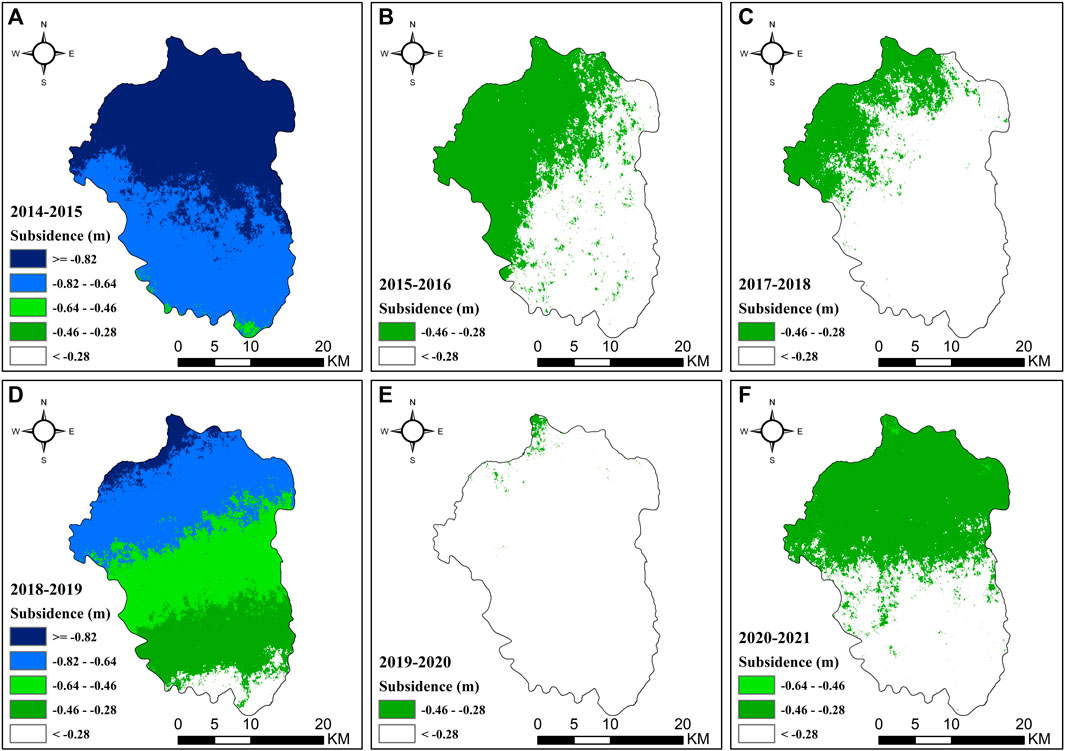
FIGURE 7. Yearly subsidence: (A) December 2014–December 2015, (B) December 2015–December 2016, (C) December 2017–December 2018, (D) December 2018–December 2019, (E) December 2019–December 2020, and (F) December 2020–December 2021.
Based on a field survey data (Table 3), in the early period of peatland utilization the subsidence rate was in the range of 4–50 cm year−1. Meanwhile, the subsidence rate estimation by the D-InSAR procedure were in the range of 28–80 cm year−1 in the early period of its utilization and becoming less for the consecutive year (16–48 cm year−1).
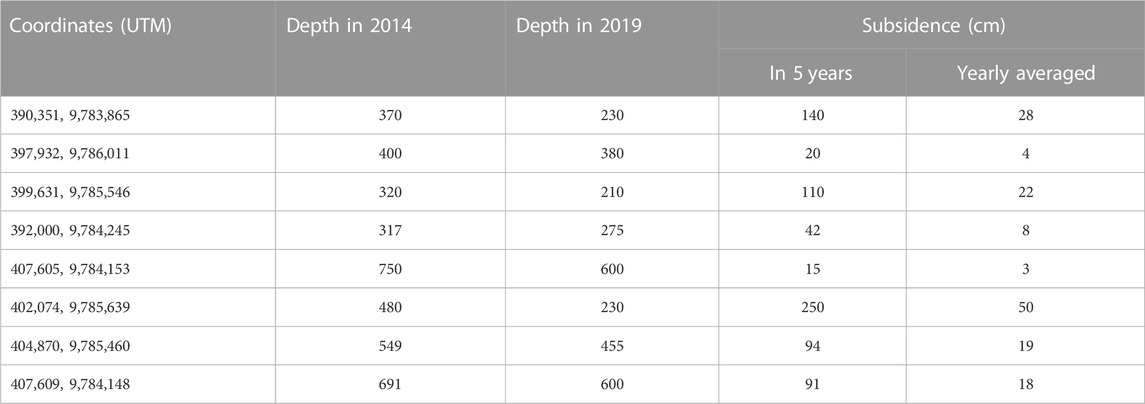
TABLE 3. Peat thickness change (cm) from 2014 until 2019 (5 years) based on the field surveys in northern part of PHU (agriculture and plantation zone).
3.3 Peat fire and subsidence
The study area experienced two peat fire events in 2015 and 2019, with that in 2015 being the most extensive, coinciding with El Niño 2015. The 2015 peat fires occurred in both the used and restoration zones. Peat fires can have impacts similar to those of peatland surface subsidence. The impact of peat fires in the PHU is often local. A detailed examination of the peat fire map in 2015 (Figure 8A) and the corresponding peat thickness map (Figure 8B) showed that the impact of the peat fire in August 2015 has left a burn scar (indicated by a rectangle box in Figure 8B). This burn scar occurred owing to the decreasing peat thickness in that area, which was caused by the peat fire event in 2015. When we located the corresponding location of the burn scar on the subsidence map based on D-InSAR 2014–2015 (Figure 8C), the location was displayed in a dark blue color, indicating a high subsidence rate (>80 cm). We subtracted Figure 8C from Figure 7A, and we found that the peatland fire only locally influenced subsidence. In contrast, peatland decomposition and oxidation affected all used peatlands in the northern part of the PHU.
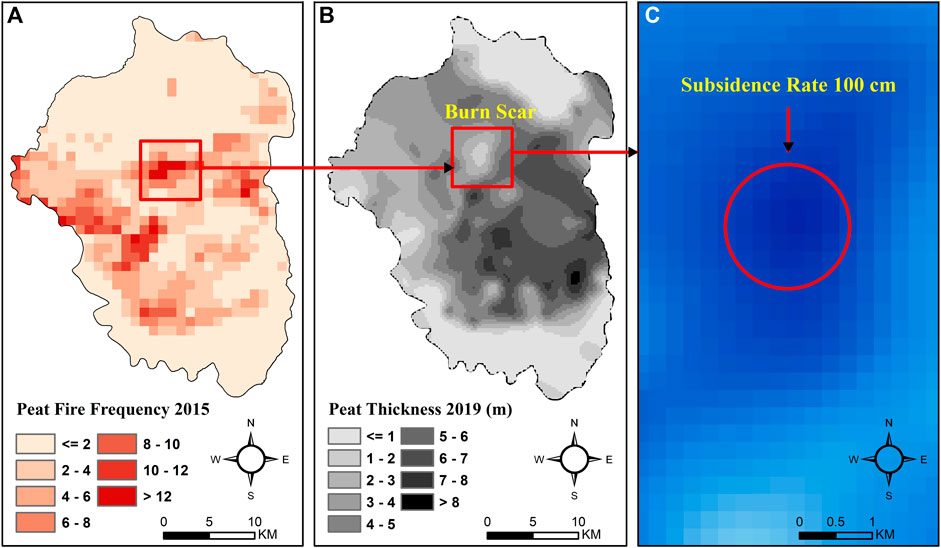
FIGURE 8. (A) Peat fire in 2015, (B) burn scar from 2015 fire, and (C) high subsidence rate in the burn scar area based on D-InSAR (dark blue).
3.4 Peat thickness and subsidence
The high subsidence rate during 2014–2015 (Figure 9B) mostly occurred in the deep peat (Figure 9A). The agricultural activities in the thick peat intensified the subsidence rate.
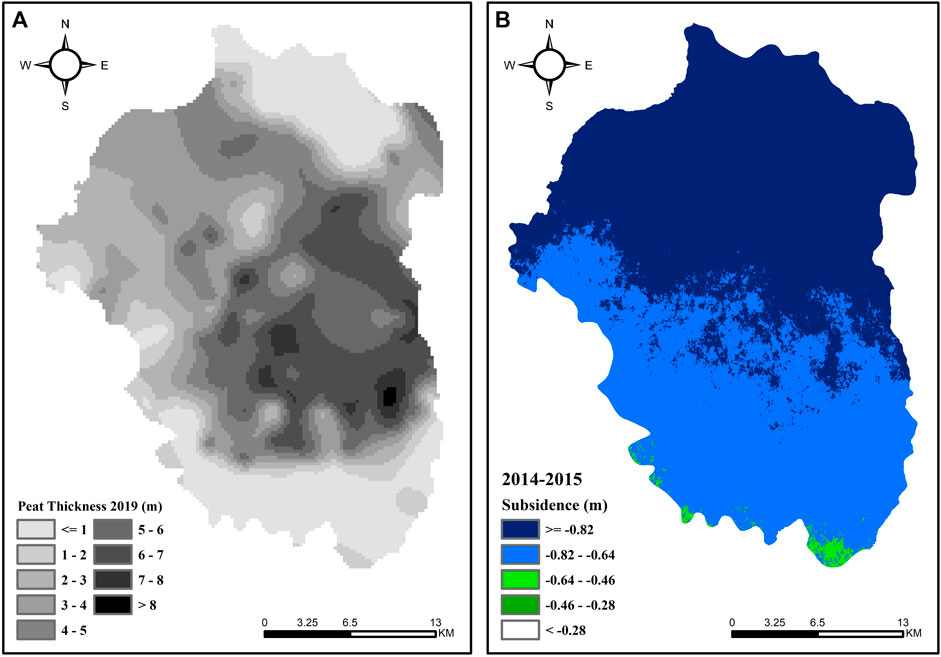
FIGURE 9. (A) Peat thickness and (B) subsidence during 2014–2015.
3.5 Topography
Each PHU has a peat dome. A peat dome in a PHU is characterized by a higher elevation than its surroundings. Depending on the form of the PHU, a peat dome can have a height difference of approximately 5–20 m from its lower part (Tarigan et al., 2020). Compared with the topographic map (Figure 10A), higher subsidence mostly occurred in the peat dome areas (Figure 10B), which were situated at a higher elevation (northeastern part of the PHU). Peatlands at higher elevations more easily drain than those at lower elevations. During months of water scarcity, peatlands at higher elevations dry before those at lower elevations. Consequently, peatlands at higher elevations are more susceptible to subsidence than those at lower elevations.
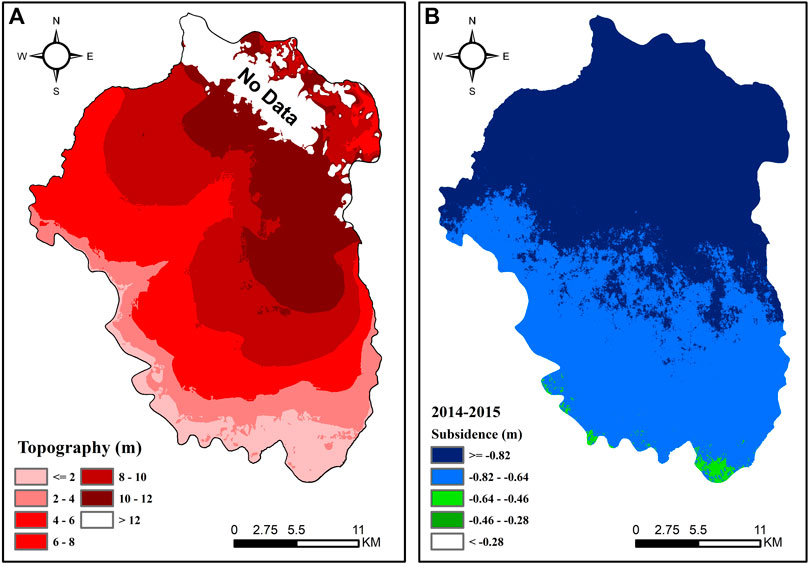
FIGURE 10. (A) Elevation map based on LiDAR data and (B) peat subsidence (m).
4 Discussion
The peatland water table and the peat thickness had been considered as the most influencing factor in the peatland subsidence in the previous studies (Hooijer et al., 2012a; Hooijer et al., 2012b). Our finding shows that the agriculture activities and the topography should be considered as important accompanying factors for the subsidence rate as well. The agriculture activities cause greater impact because they are associated with the establishment of the drainage network. The drainage network decreases the peatland water table providing conducive condition for peatland oxidation leading to a subsidence. Based on our findings in this study, the subsidence monitoring priority should be carried out in peatland area used as agriculture and situated in a higher topographical position with tick peat.
Indonesia has 13.8 million ha peatland, most of it is experiencing subsidence because of the anthropogenic influence, especially agriculture activities. Peatland ecosystem around the globe covers 423 million hectare or about 2.9% of land surface (Xu et al., 2018). Due to the serious consequences of the peatland subsidence around the globe, their subsidence monitoring should be carried out regularly to determine priority area for its mitigation before it is too late to mitigate. The remote sensing data (for example, the SAR data) provides realistic alternative to monitor the peatlands subsidence rapidly. Previous studies had applied the InSAR procedure with L-band from ALOS PALSAR data to estimate geological surface deformation (Khakim et al., 2020). However, the L-band data from ALOS 2 is very expensive and has less coverage. In contrast, C-band from Sentinel-1 data (SAR data) is free with a 12-days cycle in a single pass.
While the D-InSAR procedures had been used to monitor mining subsidence (Ren and Feng, 2020; Chen et al., 2021), its application to study peatland subsidence is still rare. Considering that the D-InSAR procedures only requires two SAR images from Sentinel-1 at the time, there is a potential use of D-InSAR in near-real-time routine monitoring of peatlands subsidence. The D-InSAR procedure can be effectively used for monitoring wide coverage areas at a low cost (Klein et al., 2017; Acosta et al., 2021).
However, there is a slight difference between the subsidence rate obtained using the D-InSAR procedure and the result of field survey data. The difference can be attributed to the limitation of the D-InSAR for subsidence measurement in vegetated area (Khakim et al., 2020; Lal et al., 2021; Tampuu et al., 2021). Despite this difference, our study showed that the subsidence rate based on the D-InSAR procedure was consistently higher in the agriculture zone, signifying the impact of agriculture activities in increasing the subsidence rate. We have minimized the impact of vegetation cover on the analysis by selecting a pair of SAR acquisitions with a short time interval (1 year). In a 1-year interval, we expected minor vegetation changes of the perennial crop in our study area.
5 Conclusion
The D-InSAR procedure proofed to be a potential and an effective tools to rapidly monitor wide coverage areas of peatland subsidence at a low cost. Our results showed that the subsidence rate in the used peatland zone (agriculture and plantations) was higher than that in the restoration zone for all data pairs used in our study. The average subsidence rate in the used zone, based on the field survey data, was in the range of 4–50 cm year−1. This value fit within the subsidence rates estimated by the D-InSAR procedure, which are in the range of 28–80 cm year−1 in the early period of its utilization and becoming less for the consecutive year (16–48 cm year−1). The topographical position in a PHU and the peat thickness intensified the impact of agriculture activities on the subsidence rate.
Data availability statement
The original contributions presented in the study are included in the article/Supplementary Material, further inquiries can be directed to the corresponding author.
Author contributions
ST designed the study. ST, YK, and WU collected the data. ST and YK wrote the manuscript. YK and WU reviewed the manuscript. All authors contributed to the article and approved the submitted version.
Funding
This study was funded by the Ministry of Education, Culture, Research, and Technology, Republic of Indonesia, under contract number 3640/IT3. L1/PT.01.03/P/B/2022 dated 15 March 2022.
Acknowledgments
The authors wish to thank the European Space Agency (ESA) for supplying the free Sentinel-1A SAR data and NASA for providing the SRTM3 DEM data. We would like to thank Editage (www.editage.com) for English language editing.
Conflict of interest
The authors declare that the research was conducted in the absence of any commercial or financial relationships that could be construed as a potential conflict of interest.
Publisher’s note
All claims expressed in this article are solely those of the authors and do not necessarily represent those of their affiliated organizations, or those of the publisher, the editors and the reviewers. Any product that may be evaluated in this article, or claim that may be made by its manufacturer, is not guaranteed or endorsed by the publisher.
References
Abdikan, S., Sanli, F. B., Ustuner, M., and Calò, F. (2016). Land cover mapping using sentinel-1 SAR data. Int. Arch. Photogramm. Remote Sens. Spat. Inf. Sci. - ISPRS Arch. 41, 757–761. doi:10.5194/isprsarchives-XLI-B7-757-2016
Acosta, G., Rodríguez, A., Euillades, P., Euillades, L., García, H., Rosell, P., et al. (2021). Detection of active landslides by DInSAR in andean precordillera of san juan, Argentina. J. S. Am. Earth Sci. 108, 103205. doi:10.1016/j.jsames.2021.103205
Acreman, M., and Holden, J. (2013). How wetlands affect floods. Wetlands 33, 773–786. doi:10.1007/s13157-013-0473-2
Asmuss, T., Bechtold, M., and Tiemeyer, B. (2019). On the potential of sentinel-1 for high resolution monitoring of water table dynamics in grasslands on organic soils. Remote Sens. 11, 1659. doi:10.3390/rs11141659
Bekaert, D. P. S., Walters, R. J., Wright, T. J., Hooper, A. J., and Parker, D. J. (2015). Statistical comparison of InSAR tropospheric correction techniques. Remote Sens. Environ. 170, 40–47. doi:10.1016/j.rse.2015.08.035
Braun, A., and Veci, L. (2020). Sentinel-1 toolbox TOPS interferometry tutorial. ESA. Available at: http://step.esa.int/docs/tutorials/S1TBX%20TOPSAR%20Interferometry%20with%20Sentin l-1%20Tutorial_v2.pdf (Accessed June 20, 2022).
Canisius, F., Brisco, B., Murnaghan, K., Van Der Kooij, M., and Keizer, E. (2019). SAR backscatter and InSAR coherence for monitoring wetland extent, flood pulse and vegetation: A study of the amazon lowland. Remote Sens. 11, 720. doi:10.3390/rs11060720
Chen, Y., Yu, S., Tao, Q., Liu, G., Wang, L., and Wang, F. (2021). Accuracy verification and correction of D-InSAR and SBAS-InSAR in monitoring mining surface subsidence. Remote Sens. 13, 4365. doi:10.3390/rs13214365
Czapiewski, S., and Szumi´nska, D. (2022). An overview of remote sensing data applications in peatland research based on works from the period 2010–2021. Land 11, 24. doi:10.3390/land11010024
Du, Y. L., Yan, S. Y., Yang, H. N., Jiang, J. X., and Zhao, F. (2021). Investigation of deformation patterns by DS-InSAR in a coal resource-exhausted region with spaceborne SAR imagery. J. Asian Earth Sci. 5, 100049. doi:10.1016/j.jaesx.2021.100049
Fitri, A. (2009). Hutan Rawa Gambut Merang Kepayang Masa lalu – masa kini – masa depan. Merang REDD Pilot Project (MRPP), Deutsche Gesellschaft für Technische Zusamenarbeit (GTZ) GmbH, Palembang, Indonesia
Foster, J., Brooks, B., Cherubini, T., Shacat, C., Businger, S., and Werner, C. L. (2006). Mitigating atmospheric noise for InSAR using a high-resolution weather model. Geophys. Res. Lett. 33, L16304. doi:10.1029/2006GL026781
Gambolati, G., Putti, M., Teatini, P., Camporese, M., Ferraris, S., Gasparetto Stori, G., et al. (2005). Peat land oxidation enhances subsidence in the venice watershed. Washington, DC: Eos, 86. doi:10.1029/2005EO230001
Gao, J., Holden, J., and Kirkby, M. (2015). The impact of land-cover change on flood peaks in peatland basins. Water Resour. Res. 52, 3477–3492. doi:10.1002/2015WR017667
Goldstein, R. M., and Werner, C. L. (1998). Radar interferogram filtering for geophysical applications. Geophys. Res. Lett. 25, 4035–4038. doi:10.1029/1998GL900033
Grzywna, A. (2017). The degree of peatland subsidence resulting from drainage of land. Environ. Earth Sci. 76, 559. doi:10.1007/s12665-017-6869-1
Hooijer, A., Page, S., Jauhiainen, J., Lee, W. A., Lu, X. X., Idris, A., et al. (2012a). Subsidence and carbon loss in drained tropical peatlands. Biogeosciences 9, 1053–1071. doi:10.5194/bg-9-1053-2012
Hooijer, A., Triadi, B., Karyanto, O., Page, S. E., van der Vat, M., and Erkens, G. (2012b). “Subsidence in drained coastal peatland in SE asian: Implications for sustainability,” in Proceedings of the 14th International Peat Congress, 1–8.
Jaenicke, J., Rieley, J. O., Mott, C., Kimman, P., and Siegert, F. (2008). Determination of the amount of carbon stored in Indonesian peatlands. Geoderma 147 (34), 151–158. doi:10.1016/j.geoderma.2008.08.008
Joosten, H., and Clarke, D. (2002). Wise use of mires and peatlands. International Mire Conservation Group and International Peat Society.
Kelola Sendang Project (2018). South Sumatra partnership for landscape management support Project (KELOLA Sendang): Annual report. Zoological Society of London.
Khakim, M. Y. N., Bama, A. A., Yustian, I., Poerwono, P., Tsuji, T., and Matsuoka, T. (2020). Peatland subsidence and vegetation cover degradation as impacts of the 2015 El niño event revealed by Sentinel-1A SAR data. Int. J. Appl. Earth Obs. Geoinformation 84, 101953. doi:10.1016/j.jag.2019.101953
Klein, E., Vigny, C., Fleitout, L., Grandin, R., Jolivet, R., Rivera, E., et al. (2017). A comprehensive analysis of the Illapel 2015 Mw8.3 earthquake from GPS and InSAR data. Earth Planet. Sci. Lett. 469, 123–134. doi:10.1016/j.epsl.2017.04.010
Lal, P., Kumar, A., Saikia, P., Das, A., Patnaik, C., KumarPandey, A. C., et al. (2021). Effect of vegetation structure on above ground biomass in tropical deciduous forests of Central India. Geocarto Int. 37, 6294–6310. doi:10.1080/10106049.2021.1936213
Lees, K. J., Artz, R. R. E., Chandler, D., Aspinall, T., Boulton, C. A., Buxton, J., et al. (2021). Using remote sensing to assess peatland resilience by estimating soil surface moisture and drought recovery. Sci. Total Environ. 761, 143312. doi:10.1016/j.scitotenv.2020.143312
Lees, K., Quaife, T., Artz, R., Khomik, M., and Clark, J. (2018). Potential for using remote sensing to estimate carbon fluxes across northern peatlands—a review. Sci. Total Environ. 615, 857–874. doi:10.1016/j.scitotenv.2017.09.103
LPPM-IPB (2019). Assessing below-ground carbon stocks of peatlands in Merang, buring and kepahyang watersheds. Bogor, Indonesia: Institut Pertanian Bogor.
Massonnet, D., Rossi, M., Carmona, C., Adragna, F., Peltzer, G., Feigl, K., et al. (1993). The displacement field of the Landers earthquake mapped by radar interferometry. Nature 364, 138–142. doi:10.1038/364138a0
Merchant, M. A., Adams, J. R., Berg, A. A., Baltzer, J. L., Quinton, W. L., and Chasmer, L. E. (2017). Contributions of C-band SAR data and polarimetric decompositions to subarctic boreal peatland mapping. IEEE J. Sel. Top. Appl. Earth Obs. Remote Sens. 10, 1467–1482. doi:10.1109/JSTARS.2016.2621043
Nolan, M., and Fatland, D. (2003). Penetration depth as a DInSAR observable and proxy for soil moisture. IEEE Trans. Geosci. Remote Sens. 41, 532–537. doi:10.1109/TGRS.2003.809931
Nolan, M., Fatland, D. R., and Hinzman, L. (2003). DInSAR measurement of soil moisture. IEEE Trans. Geosci. Remote Sens. 41, 2802–2813. doi:10.1109/TGRS.2003.817211
Page, S. E., Rieley, J. O., and Banks, C. J. (2011). Global and regional importance of the tropical peatland carbon pool. Glob. Change Biol. 17, 798–818. doi:10.1111/j.1365-2486.2010.02279.x
Preiss, M., Gray, D., and Stacy, N. (2006). Detecting scene changes using synthetic aperture Radar interferometry. IEEE Trans. Geosci. Remote Sens. 44, 2041–2054. doi:10.1109/tgrs.2006.872910
Ren, H. R., and Feng, X. M. (2020). Calculating vertical deformation using a single InSAR pair based on singular value decomposition in mining areas. Int. J. Appl. Earth Obs. Geoinf. 92, 102115. doi:10.1016/j.jag.2020.102115
Scott, C. P., Lohman, R. B., and Jordan, T. E. (2017). InSAR constraints on soil moisture evolution after the March 2015 extreme precipitation event in Chile. Sci. Rep. 7, 4903. doi:10.1038/s41598-017-05123-4
Shimada, S., Takada, M., and Takahashi, H. (2016). “Peat mapping,” in Tropical peatland ecosystems M. Osaki, and N. Tsuji (Japan: Springer Tokyo), 455–467.
Tamm, T., Zalite, K., Voormansik, K., and Talgre, L. (2016). Relating Sentinel-1 interferometric coherence to mowing events on grasslands. Remote Sens. 8, 802. doi:10.3390/rs8100802
Tampuu, T., Praks, J., Kull, A., Uiboupin, R., Tamm, T., and Voormansik, K. (2021). Detecting peat extraction related activity with multi-temporal Sentinel-1 InSAR coherence time series. Int. J. Appl. Earth Observations Geoinformation 98, 102309. doi:10.1016/j.jag.2021.102309
Tarigan, S., Siregar, I. Z., and Sudrajat, D. J. (2020). Milestone and knowledge management system of peatland restoration Indonesia. Jakarta, Indonesia: Peatland Restoration Agency-BRG. 978-623-95871-2-3.
Tarigan, S., Zamani, N. P., Buchori, D., Kinseng, R., Suharnoto, Y., and Siregar, I. Z. (2021). Peatlands are more beneficial if conserved and restored than drained for monoculture crops. Front. Environ. Sci. 9, 749279. doi:10.3389/fenvs.2021.749279
Torbick, N., Persson, A., Olefeldt, D., Frolking, S., Salas, W., Hagen, S., et al. (2012). High resolution mapping of peatland hydroperiod at a high-latitude Swedish mire. Remote Sens. 4, 1974–1994. doi:10.3390/rs4071974
Xu, J. R., Morris, P. J., Liu, J. G., and Holden, J. (2018). Peatmap: Refining estimates of global peatland distribution based on a meta-analysis. Catena 160, 134–140. doi:10.1016/j.catena.2017.09.010
Yang, Z. F., Li, Z. W., Zhu, J. J., Yi, H. W., Feng, G. C., Hu, J., et al. (2018). Locating and defining underground goaf caused by coal mining from space-borne SAR interferometry. ISPRS J. Photogramm. Remote Sens. 135, 112–126. doi:10.1016/j.isprsjprs.2017.11.020
Yule, C. M. (2010). Loss of biodiversity and ecosystem functioning in indo-malayan peat swamp forests. Biodivers. Conserv. 19, 393–409. doi:10.1007/s10531-008-9510-5
Keywords: D-InSAR, peatland restoration, subsidence, Sentinel data, agriculture activities
Citation: Tarigan S, Kristanto Y and Utomo WY (2023) Characterizing subsidence in used and restored peatland with Sentinel SAR data. Front. Environ. Sci. 11:1088923. doi: 10.3389/fenvs.2023.1088923
Received: 03 November 2022; Accepted: 18 July 2023;
Published: 31 July 2023.
Edited by:
Tianjie Zhao, Chinese Academy of Sciences (CAS), ChinaCopyright © 2023 Tarigan, Kristanto and Utomo. This is an open-access article distributed under the terms of the Creative Commons Attribution License (CC BY). The use, distribution or reproduction in other forums is permitted, provided the original author(s) and the copyright owner(s) are credited and that the original publication in this journal is cited, in accordance with accepted academic practice. No use, distribution or reproduction is permitted which does not comply with these terms.
*Correspondence: Suria Tarigan, c2R0YXJpZ2FuQGFwcHMuaXBiLmFjLmlk