 Di Zhu
 Zhi Yang
 Xiaojuan Chen
- Key Laboratory of Ministry of Water Resources for Ecological Impacts of Hydraulic-Projects and Restoration of Aquatic Ecosystem, Institute of Hydroecology, Ministry of Water Resources and Chinese Academy of Sciences, Wuhan, China
Multi-metric indicators based on fish assemblages have been widely applied to assess aquatic ecosystem biotic integrity. However, many of these were not detailed or standardized in metrics selection and reference status for a reservoir ecosystem under the long-term effects of hydro-electrical dam development. This makes it very difficult to determine the reference status and metrics because fish assemblages have been affected by human activities such as large reservoir operations. Based on long-term fish assemblage data, there were significant differences in fish composition between backwater and reservoir areas 10 years after the Three Gorges Reservoir (TGR) formation in China. We conducted this study to develop a new fish index of biotic integrity (IBI) to evaluate a large river reservoir ecosystem based on long-term monitoring data by establishing subregional habitat reference and selecting sensitive and concise metrics. In the Three Gorges Reservoir, we found that: 1) dynamic change is an important feature of fish assemblages in a relatively dynamic state after a decade of intensive disturbance caused by reservoir operations; 2) reference conditions for the reservoir evaluation should be selected in different stages for two different ecological habitats (lotic backwater and lentic reservoir reaches); 3) two core metrics and five sensitive metrics were selected to reflect fish assemblage degradation based on long term observations; and 4) overall fish biological integrity is generally “fair-poor,” in the reservoir area it is “fair” and “poor,” and in the reservoir lotic backwater it is “fair.” The long-term effects of large canyon reservoirs on biological integrity require long-term observation, and reasonable recovery targets should be set at different stages in reservoir management. In this study, a new biological integrity index was developed to screen and evaluate the ecological status of a semi-artificial reservoir ecosystem. Our results support reservoir biologically integrated management and green sustainable development goals.
1 Introduction
Reservoirs worldwide are increasingly being constructed. In China on 31 December 2011, there were more than 98,002 reservoirs, 46,758 hydropower dams, 268,476 sluices, and 2,685 rubber dams according to basic conditions of water structures (MWR&NBS, 2012). Hydropower development brings economic and social benefits but also causes various adverse effects on the ecological environment and fishery resources in river ecosystems (Baxter,1977; Han, 2010; Daufresne et al., 2015). The impact of dam construction on river systems has become one of six major reasons for freshwater ecosystem deterioration, the other five being respectively water pollution, invasion, habitat destruction, overfishing, and global climate change, respectively (Yang et al., 2020).
Natural hydrological conditions reflect the long-term stability pattern of native species’ adaptation to physical habitat, connectivity, and species interactions, shaping aquatic ecosystem structure and function (Vannote et al., 1980; Mims and olden, 2013; Herrera-Pérez et al., 2019). Maintaining natural river flow patterns along spatial and temporal gradients and biodiversity in well-maintained aquatic ecosystems is very important (Poff, 2018). However, operating high-water-level reservoirs has adverse potential effects on river ecology, aquatic organisms, and their life history stages in many ways (Hayes et al., 2019). For example, if river runoff alter during crucial periods (migration, spawning, and feeding) it may affect fish species’ life history (Mims and olden, 2013; Ru and Liu, 2013; Yang et al., 2018).
Biological integrity is the ability to support and maintain balanced, integrated, adaptive communities with species composition, diversity, and function comparable to that of the natural regional habitat (Karr, 1981). Aquatic ecosystems with biological integrity can withstand or rapidly recover from most perturbations imposed by natural environmental processes and survive many major human-induced disruptions (Simon, 1999). Aquatic ecosystems lacking biological integrity are often already degraded and further natural or human-induced events only accelerate the degradation (Karr et al., 1986). Briefly, biotic integrity is a feature of aquatic ecosystems where composition, structure, and function have not been adversely impaired by human activities.
After the first index of biotic integrity (IBI) was developed (Karr, 1981), a family of regionally adapted and calibrated, multi-metric indices have arisen (Simon, 1999; Zhu and Chang, 2008; Qadir and Malik, 2009). Fish assemblages have been used widely for a variety of ecotypes including streams (Karr et al., 1986), inland lakes (Simon and Lyons, 1995; Zhu and Chang, 2004), wetlands (Simon, 1999), and great lakes (Seegert, 2000). However, developing IBIs for large rivers has been considerably slower (Matthews and Marsh-Matthews, 2007). Representative sampling in a large river presents several unique problems that must be addressed before a general description of the ecological status of a large river basin can be attempted (Simon and Sanders, 1999). Reservoir ecosystems in large rivers are more difficult to describe because of human-induced changes, and most developing metrics are selected based on empirical judgment, making reasonable IBI development for large river reservoirs rudimentary (Simon and Sanders, 1999).
As the largest hydroelectric project in the world, the Three Gorges Reservoir (TGR) located in the upper Yangtze River has been in operation for 20 years since its first impoundment in 2003 and has achieved great benefits in power generation, flood control, and shipping. The Three Gorges Dam represented the apotheosis of environmental alteration of Asian rivers, the operation affected riverbed evolution, water resources, aquatic ecology, and water environments (Dudgeon, 2011). Among 162 native species of fish inhabiting the main channel of the upper Yangtze, 44 endemic species in the upper Yangtze River were extremely under serious threat of TGR via the modification and destruction of subterranean habitats (Park et al., 2003; Ye et al., 2011; Zhou et al., 2020).
Reservoir operation changes the physical aquatic habitat (water level, transparency, and temperature etc.), which affects fish’s natural breeding activities, especially in their early stages, was the main driver of the variation in fish assemblages’ structure, influencing fish resources and population structures to a certain extent, and will ultimately affect the reservoir and the whole river basin aquatic ecosystem structure and functional integrity (Silva-Sene et al., 2022). We hypothesized that: the Three Gorges Reservoir habitat rapidly formed the habitat differentiation after impoundment, and revealed 1) if the biological integrity has formed differentiation among different habitats; 2) if there was significant difference in the biological integrity in different sections of the same type habitat. Therefore, we conducted this study to develop a new fish IBI to evaluate a large river reservoir ecosystem based on long-term monitoring data by establishing subregional habitat reference and selecting sensitive and concise metrics.
2 Materials and methods
2.1 Study area
Yangtze River is the third longest river in the world with a watershed area of 1.8 million km2. The watershed has distinctive species richness and diversity, and comprises the largest component of China’s biological resources. The TGR is located at Sandouping Town, Hubei Provence, China, 40 km from Gezhouba Dam, which is a TGR flood-discharge reverse diversion dam. The TGR normal water level is 175.0 m, flood level, and the dead water level is 145.0 m. At the normal storage level of 175.00 m, TGR is 663 km long with an average surface width of 1.1 km, 1,084 km2 area, 39.3 billion m³ total capacity, and 22.15 billion m³ flood control capacity. The regulation performance is quarterly.
The TGR area has very abundant water resources, including more than 400 tributaries. There are 152 tributaries with a basin area >100 km2 in addition to the Jialing River and Wujiang River, and 19 of them are >1,000 km2. After the commissioning of the TGR, the natural reach of >600 km2 in the upper Yangtze River became a reservoir habitat, which changed from its original canyon torrent habitat to a complex gradient of flowing (riverine zone), slow-flowing (transitional zone) and static-water (lacustrine zone) from upstream to downstream. According to our previous study (Yang et al., 2020), five sections (from upstream to downstream, Jiangjin, Fuling, Yunyang, Wushan, and Zigui) were located along gradient environmental conditions through the TGR area including three different habitat types (Figure 1).
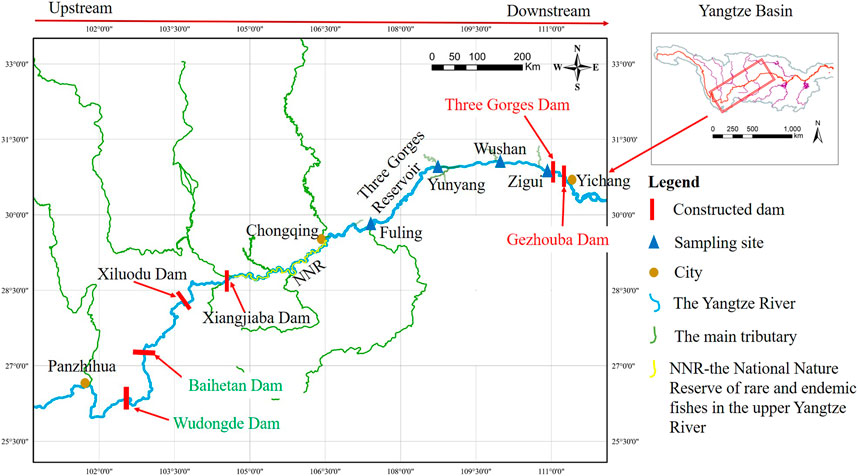
FIGURE 1. Five sampling sections in Three Gorges Reservoir watershed: from upstream to downstream: Jiangjin (JJ), Fuling (FL), Yunyang (YY), Wushan (WS), and Zigui (ZG).
Several notable events occurred during the construction and operation of the TGR Project (Figure 2): dam closure in November 1997, initial water storage of 135 m in June 2003, trial water storage of 175 m in December 2008, and relatively stable regulation from 2011 to now (Figure 3). After the TGR Project completion, Four cascade reservoirs (Xiangjiaba Dam in July 2014, Xiuluodu Dam in May 2014, Baihetan Dam in Juanuary 2020, and Wudongde Dam in September 2020) were built in the Jinsha River, in the upper reaches of the Yangtze River (Figure 2).
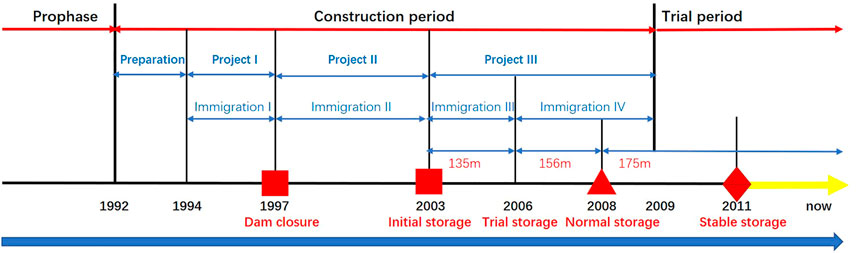
FIGURE 2. Notable events during Three Gorges Reservoir project construction and operation phases.
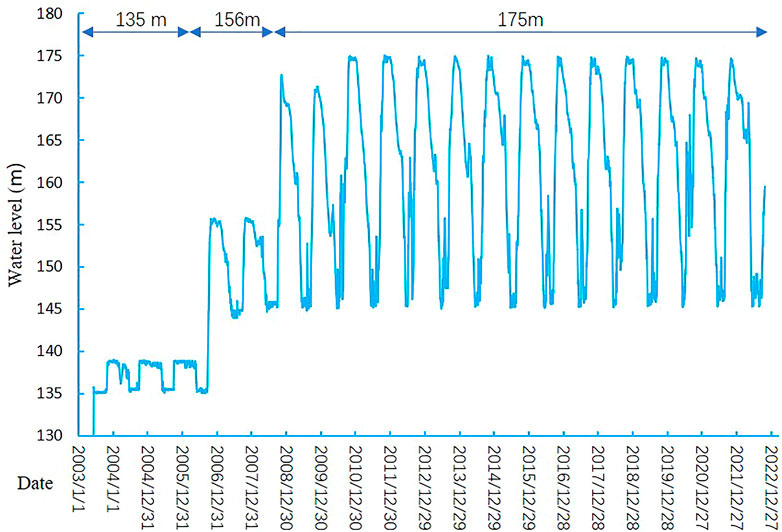
FIGURE 3. Water level of Three Gorges Reservoir in different water storage stages. Water level data were from Badong Hydrological Station (71 km from the Three Gorges Dam).
2.2 Fish sampling
Fish were collected from the TGR area in the 10 years from 2011 to 2020. Our investigation was carried out two times in spring (May-July) and autumn (September-December)c. Fish were caught using different samplers (fixed gill net, hook, and crayfish pot), depending on habitat type (rapids, pools, pits, covering big rock, gravel, and sand of bottom area and submerged vegetation). Generally, fixed gill nets with mesh sizes from 20 to 250 mm were set in deep-water areas. Bait hooks were used at different depths for different fish at different trophic levels. Crayfish pots were set in shallow water areas along the shoreline. Fish assemblages in river sections were sampled by a combination of day-and-night fishing (effort ≧500 m, sample until no new species were caught). All the fish were individually identified, measured (total length, body length, weight, and health condition) and classified into different ecological traits based on endemicity, flow preference, feeding habit, and spawning character (Park et al., 2003; Yang et al., 2020), including endemic fish species, eurytopic species, rheophilic species, carnivorous fish, omnivorous fish, herbivorous fish, phytoplanktivorous species, zoobenthivores species, fish species that spawn the drifting eggs, fish species that spawn the sticky demersal eggs. All sampled fish were checked and dissected to identify parasites and diseases.
2.3 IBI approach
A procedure was used to develop a new IBI for the TGR area after impoundment, which included the following steps: 1) the subregions evaluation of the TGR area based on fish assemblages’ analysis; 2) initial metrics selection around core metrics; 3) sensitive metrics analysis; 4) interpretation of IBI results. Initial metrics come from preliminary IBI metrics (Zhu and Chang, 2008) and expert consultation. Expert consultation was conducted three times during 2020–2021, experts give proposed candidate metrics based on ecological traits related to the TGR habitat, and finally decide initial metrics after three rounds of expert evaluation and scoring. Sensitive metrics were determined by statistical analysis (Fore et al., 1994) around the core metrics. To maintain reservoir ecosystem sustainability and biological integrity is the key protection objectives, it is necessary to maximize endemic species biodiversity and prevent alien species establishment and spread (Yang et al., 2021). Therefore, reservoir habitat core metrics were developed based on key protection objectives. The biological integrity is classified as five grades: if IBI value is ≥95% quantile of all the IBI values, biological integrity was “Excellent”; if IBI is between 0% and 95% quantile, it is divided into 4 equal segments, and their biological integrity are “Good,” “Fair,” “Poor,” and “Very poor,” respectively. Reference condition is critical to assess the biological integrity of the aquatic ecosystem. The regional-based reference condition can be derived from an aggregate of reference sites or an empirical expectations model that may include knowledge of the historical condition or extrapolated from ecological principles (Karr et al., 1986). Reference condition also represents the best physical, chemical, and biological conditions attainably. A regional-based reference is preferred over site-specific references for broader applications in evaluation programs. The reservoir ecosystem is constantly changing and cannot return to pre-dam conditions because the physical characteristics of the river habitats have been completely altered. To determine reference ecosystem status (i.e., pre-dam conditions or existing best state possible), referring to preliminary studies (Zhu and Chang, 2008; Yang et al., 2020) and relevant literature (Loures and Pompeu, 2019). In this study, reference conditions based on subregions were derived from a relatively stable conditions (similarity fish assemblages between sampling sites less than 5%) after the TGR operation of 175 m, and both of reference value and current value of all the selected metrics were calculated, respectively, these values (between 0 and 1) were the proportion of metrics in total native species sampled in subregion or each section.
2.4 Statistical analysis
Based on the 10-year fish assemblage data collected from five sampling sections, 50 samples were analyzed using Cluster Analysis (CA) based on the Bray-Curtis similarity matrix (Gorley and Clarke, 2006) to determine the potential spatial and temporal classification of fish assemblage. Percentage Similarity Analysis (SIMPER) was used to analyze community differences between different contributing species (Clarke, 1993). To avoid overcalculating some metric weights, those metrics with high auto-correlation were excluded using Pearson Correlation Analysis (PCCs, the correlation r always falls between −1 and 1, when |r| is 0.8–1.0, very strong correlation; |r| = 0.6–0.8 strong correlation; |r| is 0.4–0.6, moderate correlation; |r| is 0.2–0.4, weak correlation; 0.0–0.2, very weak or no correlation) (Swinscow and Campbell, 2002; Hering et al., 2006). Principal Component Analysis (PCA) was used to determine the contribution of metrics to the TGR inter-annual IBI scores. CA, SIMPER, PCCs, and PCA and were conducted using PRIMER-E (Version 6) (Anderson et al., 2008; Hennig, 2008).
3 Results
3.1 Fish assemblages
The original presence/absence of species are shown in Supplementary Table S1). From 2011 to 2020 there were 97 species collected in five sampling sections of the TGR watershed and from upstream to downstream these are Jiangjin (JJ), Fuling (FL), Yunyang (YY), Wushan (WS), and Zigui (ZG). The Cluster Analysis (CA) revealed two clusters on the level of 52.2% similarity: ZG-WS-YY and FL-JJ. These two clusters corresponded to two different subregional areas: upstream (the backwater area) and downstream (the reservoir area) and suggest compositional differences in fish species (Figure 4). Temporally, the five river sections changed significantly since 2014 after first 175 m water storage in TGR in 2009.
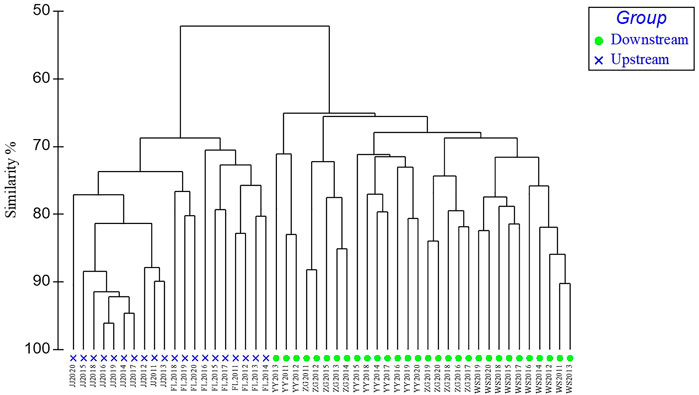
FIGURE 4. Fish assemblage Cluster Analysis (CA) dendrogram. Blue cross represent Group1 and green triangles Group 2. JJ- Jiangjin, FL- Fuling, YY- Yunyang, WS- Wushan, and ZG- Zigui.
SIMPER results showed the percentage similarity and the difference between the two groups and suggested that yearly differences were due to the contributions of rheophilic species (Table 1). The results also indicate that a brief list of the topmost contributing species in the groups are Gobiobotia (Gobiobotia) filifer (Garman), Jinshaia sinensis (Sauvage et Dabry), Lepturichthys fimbriata (Günther), and Liobagrus marginatus (Bleeker) based on their contributions.
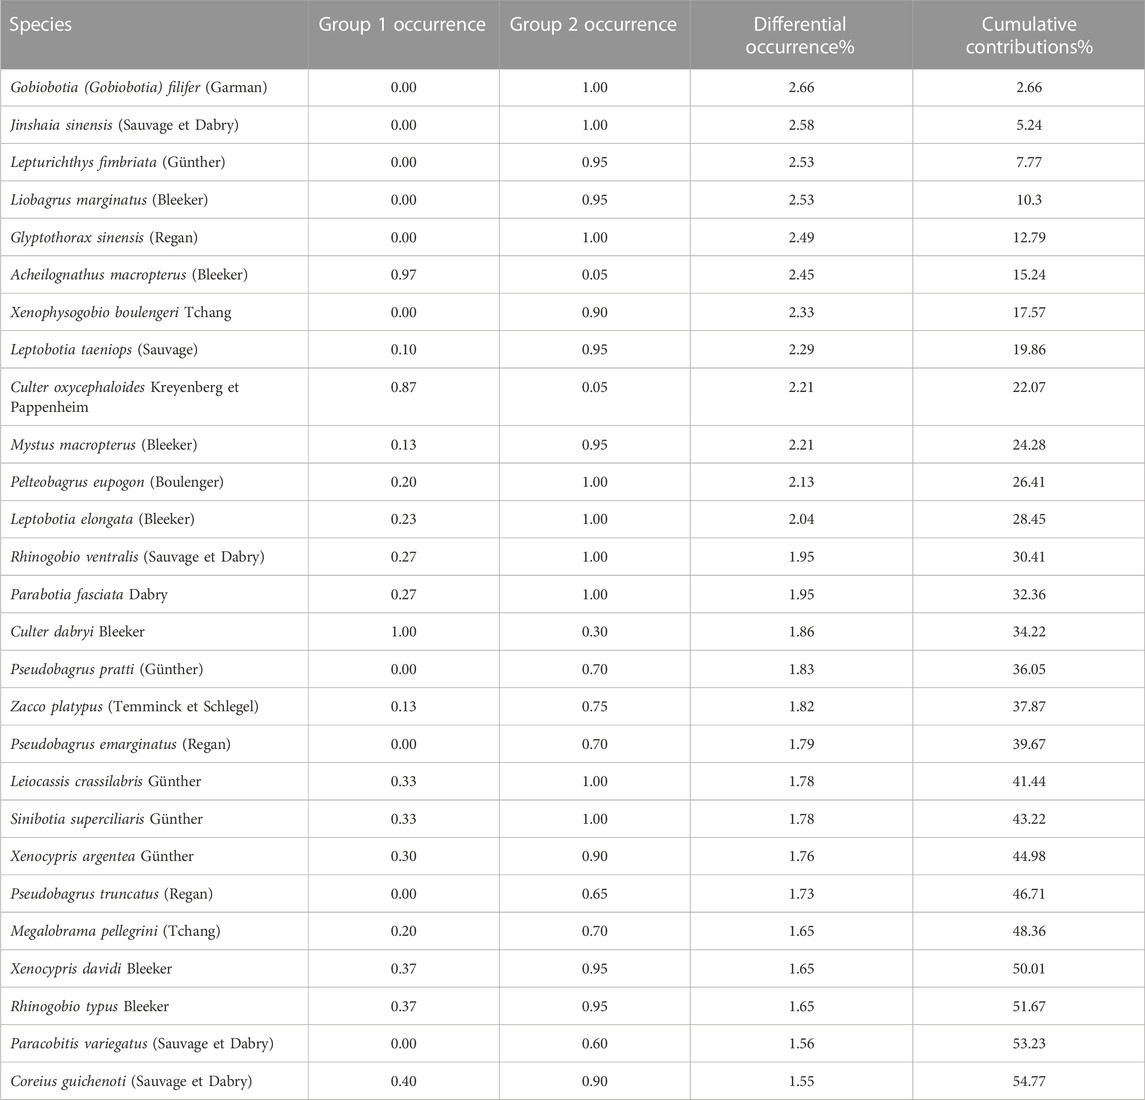
TABLE 1. SIMPER analysis of differential contributions of species for the two-group result.
3.2 New multi-metrics index
Based on expert recommendation and preliminary studies (Zhu and Chang, 2008; Yang et al., 2020), 11 initial metrics was selected, and endemic and exotic species were select as core metrics in the reservoir habitat (Table 2). These selected 11 primary candidate metrics belong to species tolerance on habitat alteration, trophic composition and breeding strategies.
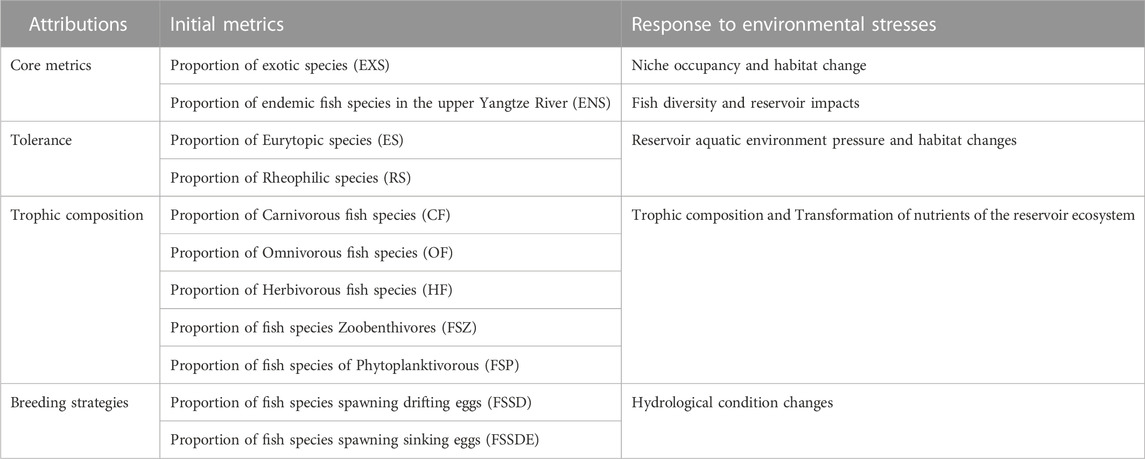
TABLE 2. Attributes of 11 initial metrics and their response to environmental stresses.
Based on the results of the TGR fish assemblage analysis (Figure 4) and the dam construction timeline (Figure 2), the TGR habitat differ into two subregional areas and entered a relatively stable fish assemblage stage after 2014. We then calculated the reference value for the integration of all species presence during 2014–2020 (Table 3).

TABLE 3. Reference values of each metrics in the two subregional areas (upstream and downstream in the reservoir basin).
3.3 TGR sensitive metrics selection and determination
Analysis of the TGR interference-response relationships was conducted by comparing the reference values and current values of the 11 initial indicators in the downstream and upstream of the Three Gorges Reservoir. Metrics sensitivity analysis (Figure 5) excluded three variables including Proportion of eurytopic species (ES), Proportion of Omnivorous fish species (OF), and Proportion of Herbivorous fish species (HF), eight metrics with a more significant response to reservoir operation interference were retained (Table 4).
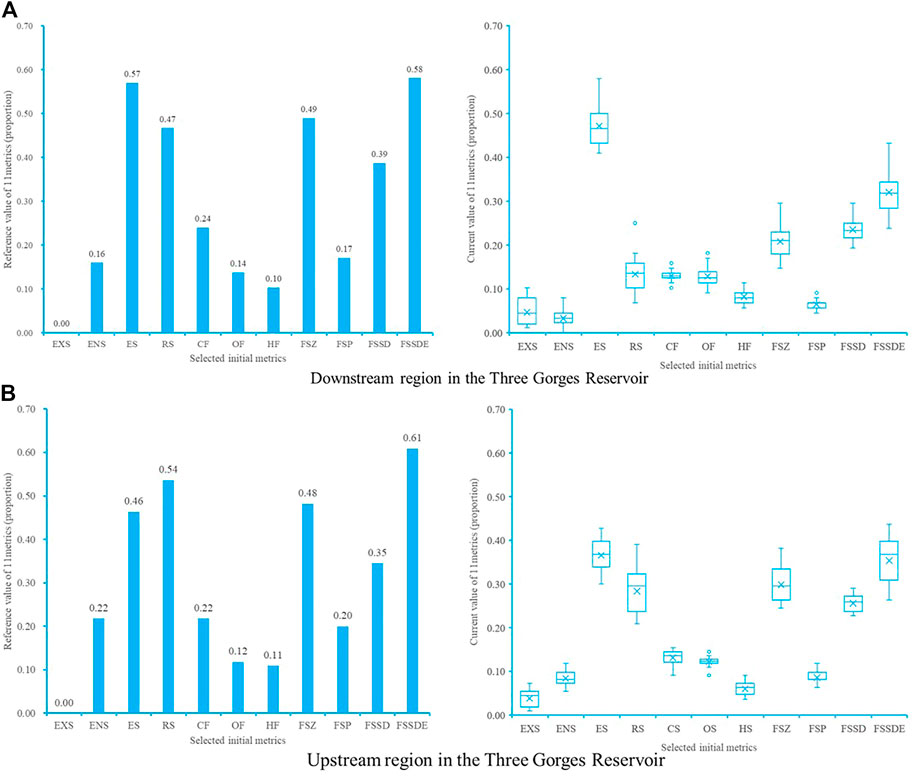
FIGURE 5. Box-and Whisker plots of 11 initial metrics using reference and current values in two subregions. All the value are calculated by their proportion (0–1) in native species sample in each section. (A) Downstream region in the TGR (B) Upstream region in the TGR. In box plots of 11 metrics, the sign × indicate the average value, the solid line indicates the median, borders of the box indicate the 25% and 75% percentiles, and the extremities indicate minimum and maximum, respectively. EXS, Proportion of exotic species; ENS, Proportion of endemic fish species in the upper Yangtze River; ES, Proportion of eurytopic species; RS, Proportion of Rheophilic species; CF, Proportion of Carnivorous fish species; OF, Proportion of Omnivorous fish species; HF, Proportion of Herbivorous fish species; FSZ-Proportion of fish species of Zoobenthivores; FSP, Proportion of fish species Phytoplanktivorous; FSSD, Proportion of fish species spawning drifting eggs; FSSDE, Proportion of fish species spawning sinking eggs.
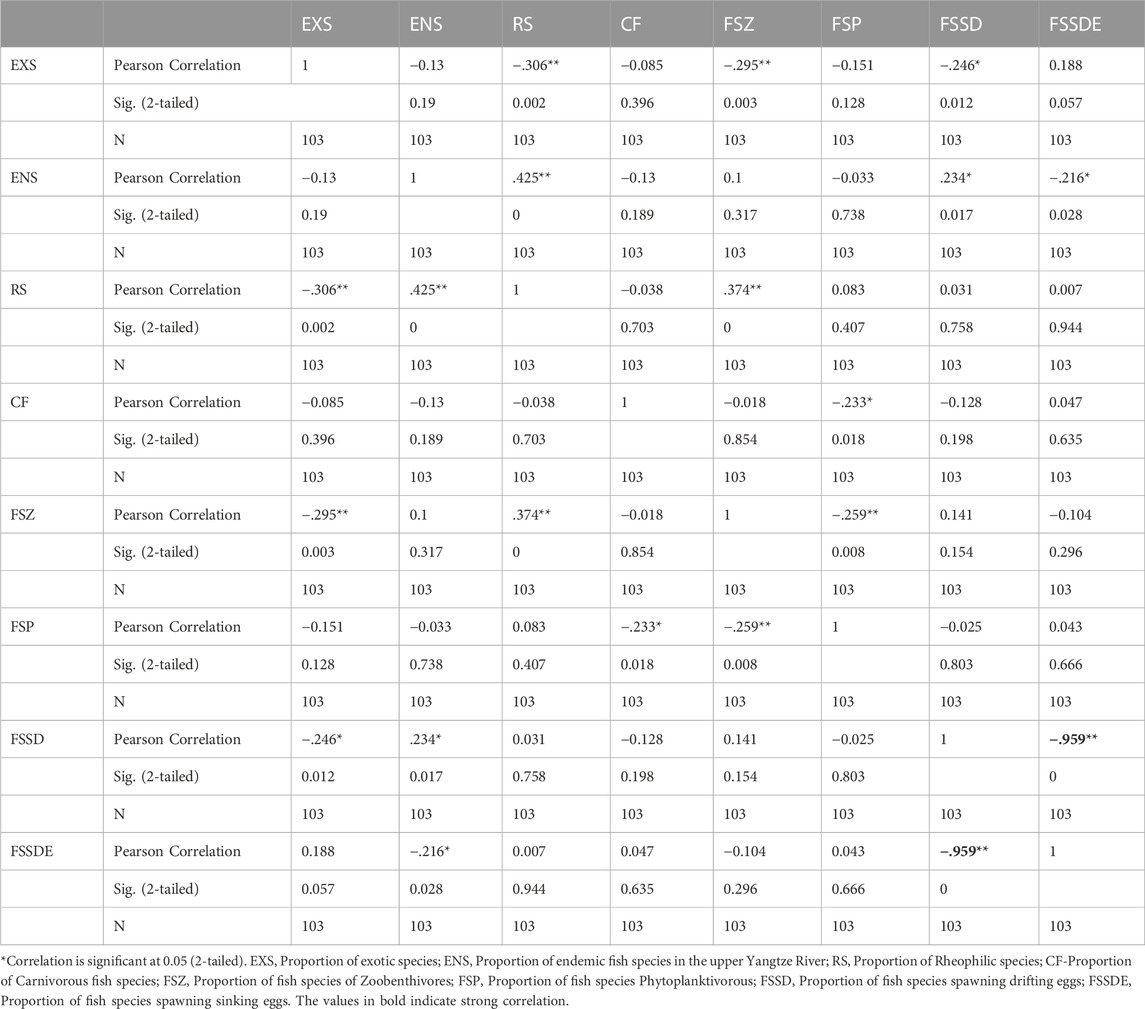
TABLE 4. Pearson correlations for 8 sensitive metrics.
The Pearson Correlation Analysis results showed a very strong correlation (r = −0.959, when |r | is 0.8–1.0, very strong correlation) between the Proportion of fish species spawning drifting eggs (FSSD) and the Proportion of fish species spawning sinking eggs (FSSDE), so one of these two metrics need to be excluded. Because FSSD also had a weak correlation with the two-core metrics (EXS, r = −.246, ENS, r = 0.234; when |r| is 0.2–0.4, weak correlation), it was excluded, and seven metrics were selected for the TGR (Table 4).
3.4 Temporal and spatial variation of the biological integrity
A total of 7 metrics were selected (Table 4) and accumulated to obtain a total IBI value between 0 and 7, it was divided equally into five grades: “Excellent” (6.65–7), “Good” (4.98–6.64), “Fair” (3.32–4.97), “Poor” (1.56–3.31), and “Very poor” (0–1.55), respectively. Subregional area comparisons and interannual variations in IBI were calculated in a 10-year period of each river section. IBI for the upstream flowing section (above Fuling) was clearly higher than for the downstream reservoir area (below Fuling) (Figure 6).
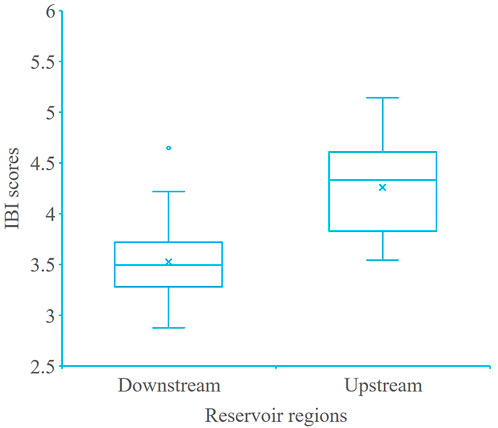
FIGURE 6. Comparison of IBI scores in two TGR subregional areas (upstream refers to the backwater reach and downstream refers to the reservoir reach). In the box plots, the sign × indicate the average value, the solid line in the box indicates the median, borders of the box indicate the 25% and 75% percentiles, and the extremities indicate minimum and maximum, respectively.
The IBI of each section was between 2.88 and 5.14 in the 10-year period (2011–2020), about 82% of the 50 sample evaluations were “general,” 16% were “poor,” and overall, biological integrity of most of the TGR was “fair-poor.” The inter-annual IBI scores during the 10-year period fluctuated (Figure 7), and the Jiangjin (JJ) sections in the TGR backwater area showed a downward trend.
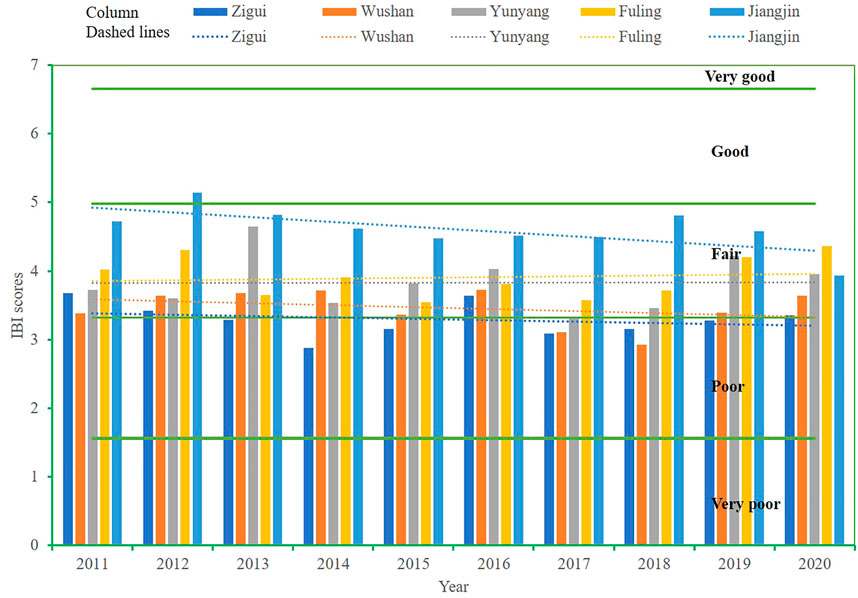
FIGURE 7. Temporal and spatial IBI scores and biological integrity in each section of TGR during 2011–2020. Columns represent IBI values in each section, dashed lines represent the temporal variation of IBI values in a section, and our green parallel solid lines (they are 6.65, 4.98, 3.32, and 1.56 of IBI values, respectively) divide the biological integrity into five classes represent five biological integrity grades.
PCA result explained the contribution of metrics to annual IBI scores (Figure 8), the two axes explained 89.6% of the total variation (PC1 = 74.1%, PC2 = 15.5%), and the top three metrics in terms of contribution to IBI scoring were the proportion of endemic fish species in the upper Yangtze River (ENS), the proportion of fish species Phytoplanktivorous (FSP) and the proportion of Rheophilic species (RF). Among them, native species conservation is still important and exotic species must be addressed because of the flowing habitat loss after reservoir formation and 175 m water level storage.
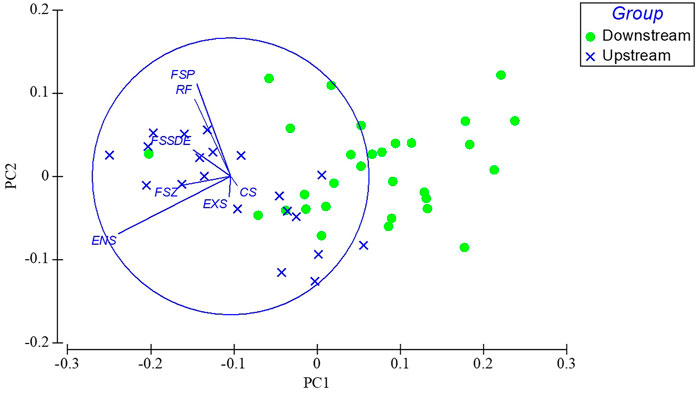
FIGURE 8. PCA analysis indicate the rank of 7 metrics in terms of their contributions to IBI scores. EXS, Proportion of exotic species; ENS, Proportion of endemic fish species in the upper Yangtze River; RS, Proportion of Rheophilic species; CF-Proportion of Carnivorous fish species; FSZ, Proportion of fish species of Zoobenthivores; FSP, Proportion of fish species Phytoplanktivorous; FSSDE, Proportion of fish species spawning sinking eggs.
4 Discussions
4.1 Fish assemblages and subregional evaluation
Generally, in impounded riverine systems fish assemblages differ from those in natural ecosystems because of habitat modifications that may reduce native species abundance and restructure communities (Xie et al., 2018). When a reservoir was formed, the lotic habitat over the dam became a semi-natural habitat, and distribution characteristics and ecological types of fish assemblages changed gradually (Gao et al., 2010; Agostinho et al., 2016; Li et al., 2020). Consequently, rheophilic species which rely on running water to complete their life history declined, especially the drifting-egg-spawning species (Agostinho et al., 2016; Yang et al., 2021). It is unknown for how long the variation in the fish assemblages’ composition and structure will be relatively stable after reservoir impoundment (Stein et al., 1995; Havel et al., 2005). Fish assemblage structure was still dynamic in reservoirs even over 28 years period (Loures and Pompeu, 2019), but a reservoir fish assemblage was observed relatively stable across 43 years’ changes (Gido et al., 2000). Yang et al. (2021) found that TGR fish assemblages changed distinctly after 175 m reservoir impoundments in 2009, but fish assemblages have entered a relatively stable period from 2014 even under the cumulative effects of two cascade reservoirs (Xiangjiaba Dam in July 2014 and Xiuluodu Dam in May 2014) built in the upper Jinsha River. Generally, there are three zones (lotic, transitional, and lentic habitat) along the longitudinal axis in a large reservoir (Thornton, 1990; Baumgartner et al., 2017), but when we looked at fish assemblage compositional similarity, two subregions were optimum for evaluating TGR biological integrity. Loures and Pompeu (2019) also found fish diversity varied in both lotic and lentic environments along a reservoir cascade.
4.2 Sampling methods and approaches for estimating fish assemblages
Sufficient sampling effort is key to estimate species richness and yield accurate data about the ecological condition of river sites (Hughes et al., 2021). A basic premise of IBI is that the entire fish fauna has been sampled in its true relative abundances without bias towards taxa or the size of rivers (Karr, 1981). Attaining this premise may be possible in wadable streams but it is very difficult and perhaps, even impossible in large rivers. In the last century, investigators already found that electrofishing is the best single-equipment approach (Ohio EPA, 1987; Fore et al., 1994; Simon and Sanders, 1999). It is equally effective at both high- and low-quality sampling sites and there is no bias regarding species richness or size. The second approach is to use multiple types of equipment. Such differences in guilds collected by the different gears indicate that combined methods are needed to make assessments in large river (Seegert, 2000; Goffaux et al., 2004). Catch rates in medium-large rivers are typically 2–3 times higher at night, and as much as 10-fold higher for some species (Simon and Sanders, 1999), and observed species richness is at least partially determined by sampling effort and site length (Smith and Jones, 2005; de Freitas Terra et al., 2013; Archdeacon et al., 2020). So large river sites should be sampled by a combination of night electrofishing (effort ≧500 m) and seining (sample until no new species are being collected). However, electrofishing is illegal in China, so we used fixed gill nets with mesh sizes from 20 to 250 mm set in deep-water areas, and baited hooks at different depths for different fish, and crayfish pots set in shallow water for 12 h overnight. Based on field experience, catch rates in medium to large rivers are typically twice-thrice higher at night, and as much as 10-fold higher for some species. Species richness is also higher at night (Simon and Sanders, 1999).
4.3 Ecological significance of metrics and reference status
The use of statistical methods to predict species occurrence or distribution is becoming an important tool in conservation planning and wildlife development (Pearce and Ferrier, 2000). In this study, we use statistical analysis to develop an adaptive IBI based on long-term fish assemblage data and expert consultation. Seven sensitive metrics were selected to describe the canyon reservoir’s biological integrity, and the two core metrics are endemic species and exotic species. Species and distribution will decline with the development of cascades (Li et al., 2020), and the effect increased non-native species from the upmost stream to the down most stream (Silva-sene et al., 2022). The risk of the exotic species on occupying the ecological niche of native fish species was reported a lot (Diamond and Serveiss, 2001; Park et al., 2003; Winters and Budy, 2015; Xiong et al., 2018; Liao et al., 2020), it also has been becoming a main ecological risk in TGR, so exotic species was chosen as one of two core metrics. During 2020–2021, 18 exotic species were sampled in TGR, and among them, five exotic species’ larvae have been found, which has proved that they can already complete their life history in the reservoir area. Compared with 12-metric IBI in Upper Yangtze River (Zhu and Chang, 2008), the performance of this new index provides more key information about fish assemblages variation under reservoir operation pressure. Expert consultation also explained the meaning of the seven metrics from an ecological principle’s perspective. Furthermore, we also demonstrated those metrics’ specific responses to different stressors, particularly in the multiple cascades reservoirs, which showed: 1) endemic fish species, as well as rheophilic, zoobenthivore, and phytobenthivore species, are easily affected by upstream cascade reservoirs, and 2) the longitudinal cascade reservoirs and the proximity of the downstream reservoir and upstream dam have cumulative effects on fish species composition for the increased habitat fragmentation. In this study, fish assemblages during 2014–2020 were combined as the reference, which was also the best existing condition after TGR construction and 175 m water storage in TGR area.
4.4 Temporal and spatial changes in TGR biological integrity
From fish assemblage changes and biological integrity evaluations, it appears that the biotic integrity has become relatively stable over the 10 years of TGR 175 m water storage, but two distinct ecological groups have differentiated in the upstream and downstream areas, which are strongly associated with reservoir habitat differentiation and river habitat loss (Mims and Olden, 2013). The fish assemblages’ structure and spatial gradients of diversity in a large tropical reservoir are completely different before and after dam construction (Sandhya et al., 2019). Reservoir operation will significantly change the hydrological pattern, and it affected the upstream river section more seriously than downstream (Han, 2010). According to our results in this study, even under the cumulative effects of Four cascade reservoirs (Location in Figure 1, Xiluodu Dam and Xiangjiaba Dam built in 2014, Baihetan Dam and Wudongde Dam built in 2020.) in Jinsha River of the upper Yangtze River, the biological integrity of TGR was less variable and relatively stable. We concluded that these results may be related to the retention of a free reach of 353.16 km long, which was the National Nature Reserve for rare and endemic fish in the upper reaches of the Yangtze River (Figure 1, NNR), strict management measures have been implemented. Although the free-flowing river section has changed to different degrees in the runoff, flow, and water level process of the aspects of the hydrological potential, it still retains the basic properties of the flowing river in the upstream of backwater area (Poff et al., 1997; Wang et al., 2013; Poff, 2018). Therefore, to prevent the ecological condition of the reservoir from deteriorating further, it is necessary to maintain a long enough flowing section in the reservoir without new hydropower development in the mainstream and tributaries of TGR, even removing the obstacles on some tributaries, while simulating suitable downstream hydrological conditions for natural fish breeding through reservoir operation.
5 Conclusion
In this study, a solution to provide more accurate and concise ecosystem information was proposed that could be used in different scenarios for addressing how to accurately assess the effects of human activities and natural succession on aquatic ecosystems of canyon reservoirs.
Presently, China is currently implementing aquatic ecological protection policies at the national level (Article 41, Law of the People’s Republic of China on Yangtze River Protection, implementation time from March 01, 2021), and to achieve these technical guidelines must first be established. Our study provides a new biological integrity index for semi-artificial reservoir ecosystems by connecting biodiversity science to the policy agenda. This index will be a national application as United Nations Environment Programme World Conservation Monitoring Centre and Luc Hoffmann Institute (2020) and Soto-Navarro et al. (2021) multidimensional biodiversity index.
(1) Through long-term data analysis of fish assemblage structure and composition after reservoir operation, we assessed the operation effects in reservoir habitats. The structure of fish assemblages have been changed, for example, the total number of native species declined and exotic species increased, these responses are selected as core metrics of TGR evaluation.
(2) Based on fish assemblages in TGR, adaptive and sensitive metrics are selected around two core metrics of the TGR ecosystem from candidate metrics by removing redundant information using statistical analysis. A more concise and scientific evaluation Index is suitable for the accurate evaluation of the reservoir status by subdividing the lotic and lentic reach and selecting the appropriate reference status for reservoir evaluation.
(3) Through communication among policymakers, researchers, and the public (Miranda and DeVries, 1996), a balanced and inspiring reference system should be chosen. There is generally a negative attitude toward whether the reservoir ecosystem can be fully recovered to pre-dam conditions after ecological restoration. In this study, we found that 2014–2020 is a relatively stable period after impoundment, so the fish assemblages combined during 2014–2020 was used as the reference value, which is more helpful for the attainment of sustainable development.
Data availability statement
The original contributions presented in the study are included in the article/Supplementary Material, further inquiries can be directed to the corresponding author.
Ethics statement
The animal study was reviewed and approved by the Ethics Committee, Institute of Hydroecology, Ministry of Water Resources and Chinese Academy of Sciences.
Author contributions
DZ: Methodology, analysis, writing, review, and editing; ZY: Investigation, Data curation, software analysis, drawing and visualization; XC, Reviewing and editing; YJ: Drawing and visualization; DL: Research design and review.
Funding
This study is supported by the National Key Research and Development Plan of China (Grant No. 2021YFC3200304), Key project of the National Natural Science Foundation of China (Grant No. U2040205), the Research of Changjiang Aquatic Biological Integrity Evaluation Index System (Grant No. 202003229) funded by China Three Gorges Corporation Co., LTD., and the Major Project of the Ministry of Water Resources of China (Grant No. SKR-2022015).
Acknowledgments
The authors would like to express their gratitude to EditSprings (https://www.editsprings.cn) for the expert linguistic services provided.
Conflict of interest
The authors declare that this study is one part of the Project Research of Changjiang Aquatic Biological Integrity Evaluation Index System (202003229) funded by China Three Gorges Corporation Co., LTD., which develops studies in partnership with other universities and Institutes in the search for better understanding of hydropower impacts, possible solutions and management measures to mitigate them, such as this study.
Publisher’s note
All claims expressed in this article are solely those of the authors and do not necessarily represent those of their affiliated organizations, or those of the publisher, the editors and the reviewers. Any product that may be evaluated in this article, or claim that may be made by its manufacturer, is not guaranteed or endorsed by the publisher.
Supplementary material
The Supplementary Material for this article can be found online at: https://www.frontiersin.org/articles/10.3389/fenvs.2023.1103801/full#supplementary-material
References
Agostinho, A. A., Gomes, L. C., Santos, N. C., Ortega, J. C., and Pelicice, F. M. (2016). Fish assemblages in Neotropical reservoirs: Colonization patterns, impacts and management. Fish. Res. 173, 26–36. doi:10.1016/j.fishres.2015.04.006
Anderson, M. J., Gorley, R. N., and Clarke, K. R. (2008). PERMANOVA + for PRIMER: Guide to software and statistical methods. Plymouth: PRIMER-E.
Archdeacon, T. P., Reale, J. K., Gonzales, E. J., and Grant, J. D. (2020). Effects of seining effort and site length on variability of small-bodied fish catch-rates in a sand-bed river. River Res. Appl. 36 (8), 1588–1597. doi:10.1002/rra.3666
Baumgartner, M. T., Baumgartner, G., and Gomes, L. C. (2017). Spatial and temporal variations in fish assemblage: Testing the zonation concept in small reservoirs. Braz. J. Biol. 78, 487–500. doi:10.1590/1519-6984.170424
Baxter, R. M. (1977). Environmental effects of dams and impoundments. Annu. Rev. Ecol. Syst. 8, 255–283. doi:10.1146/annurev.es.08.110177.001351
Clarke, K. R. (1993). Non-parametric multivariate analyses of changes in community structure. Aust. J. Ecol. 18, 117–143. doi:10.1111/j.1442-9993.1993.tb00438.x
Daufresne, M., Veslot, J., Capra, H., Carrel, G., Poirel, A., Olivier, J. M., et al. (2015). Fish community dynamics (1985–2010) in multiple reaches of a large river subjected to flow restoration and other environmental changes. Freshw. Biol. 60 (6), 1176–1191. doi:10.1111/fwb.12546
de Freitas Terra, B., Hughes, R. M., and Araújo, F. G. (2013). Sampling sufficiency for fish assemblage surveys of tropical Atlantic Forest streams, Southeastern Brazil. Fisheries 38 (4), 150–158. doi:10.1080/03632415.2013.775572
Diamond, J. M., and Serveiss, V. B. (2001). Identifying sources of stress to native aquatic fauna using a watershed ecological risk assessment framework. Environ. Sci. Technol. 35 (24), 4711–4718. doi:10.1021/es0015803
Dudgeon, D. (2011). Asian river fishes in the anthropocene: Threats and conservation challenges in an era of rapid environmental change. J. Fish Biol. 79 (6), 1487–1524. doi:10.1111/j.1095-8649.2011.03086.x
Fore, L. S., Karr, J. W., and Conquest, L. L. (1994). Statistical properties of an index of biological integrity used to evaluate water resources. Can. J. Fish. Aquatic Sci. 51 (5), 1077–1087. doi:10.1139/f94-107
Gao, X., Zeng, Y., Wang, J., and Liu, H. (2010). Immediate impacts of the second impoundment on fish communities in the three gorges reservoir. Environ. Biol. Fishes. 87 (2), 163–173.
Gido, K. B., Matthews, W. J., and Wolfinbarger, W. C. (2000). Long-term changes in a reservoir fish assemblage: Stability in an unpredictable environment. Ecol. Appl. 10 (5), 1517–1529. doi:10.1890/1051-0761(2000)010[1517:ltciar]2.0.co;2
Goffaux, D., Grenouillet, G., and Kestemont, P. (2004). Electrofishing versus gillnet sampling for the assessment of fish assemblages in large rivers. Arch. fur Hydrobiol. 162 (1), 73–90. doi:10.1127/0003-9136/2005/0162-0073
Han, B. (2010). Reservoir ecology and limnology in China: A retrospective comment. J. Lake Sci. 22 (2), 151–160. in Chinese with English abstract.
Havel, J. E., Lee, C. E., and Vander Zanden, J. M. (2005). Do reservoirs facilitate invasions into landscapes? BioScience 55 (6), 518–525. doi:10.1641/0006-3568(2005)055[0518:drfiil]2.0.co;2
Hayes, D. S., Moreira, M., Boavida, I., Haslauer, M., Unfer, G., Zeiringer, B., et al. (2019). Life stage-specific hydropeaking flow rules. Sustainability 11 (6), 1547. doi:10.3390/su11061547
Hennig, C. (2008). Dissolution point and isolation robustness: Robustness criteria for general cluster analysis methods. J. Multivar. analysis 99 (6), 1154–1176. doi:10.1016/j.jmva.2007.07.002
Hering, D., Feld, C. K., Moog, O., and Ofenböck, T. (2006). “Cook book for the development of a multimetric index for biological condition of aquatic ecosystems: Experiences from the European AQEM and STAR projects and related initiatives,” in The ecological status of European rivers: Evaluation and intercalibration of assessment methods. Developments in hydrobiology, vol 188. Editors M. T. Furse, D. Hering, K. Brabec, A. Buffagni, L. Sandin, and P. F. M. Verdonschot (Dordrecht: Springer). doi:10.1007/978-1-4020-5493-8_22
Herrera-Pérez, J., Parra, J. L., Restrepo-Santamaría, D., and Jiménez-Segura, L. F. (2019). The influence of abiotic environment and connectivity on the distribution of diversity in an andean fish fluvial network. Front. Environ. Sci. 7. doi:10.3389/fenvs.2019.00009
Hughes, R. M., Herlihy, A. T., and Peck, D. V. (2021). Sampling efforts for estimating fish species richness in Western USA river sites. Limnologica 87, 125859. doi:10.1016/j.limno.2021.125859
Karr, J. R., Fausch, K. D., Angermeier, P. L., Yant, P. R., and Schlosser, I. J. (1986). Illinois natural history survey, 5. Champaign: Special Publication, 1–28. Assessing biological integrity in running waters. A method and its rationale
Li, T., Tang, L., Wang, L., An, L., Wang, J., Mo, K. L., et al. (2020). Distribution characteristics and ecological types changes in fish communities under hydropower development from Xiluodu to Xiangjiaba reach. Acta Ecol. Sin. 40 (4), 1473–1485.
Liao, C., Chen, S., Correa, S. B., Li, W., Zhang, T., and Liu, J. (2020). Impoundment led to spatial trophic segregation of three closely related catfish species in the Three Gorges Reservoir, China. Mar. Freshw. Res. 7, 750–760. doi:10.1071/mf19181
Loures, R. C., and Pompeu, P. S. (2019). Temporal changes in fish diversity in lotic and lentic environments along a reservoir cascade. Freshw. Biol. 64 (10), 1806–1820. doi:10.1111/fwb.13372
Matthews, W. J., and Marsh-Matthews, E. (2007). Extirpation of red shiner in direct tributaries of lake texoma (Oklahoma-Texas): A cautionary case history from a fragmented river-reservoir system. Trans. Am. Fish. Soc. 136 (4), 1041–1062. doi:10.1577/t06-059.1
Mims, M. C., and Olden, J. D. (2013). Fish assemblages respond to altered flow regimes via ecological filtering of life history strategies. Freshw. Biol. 58 (1), 50–62. doi:10.1111/fwb.12037
Ministry of Water Recourses, National Bureau of Statistics P. R. China (2012). Bulletin of first national census for water. Beijing: China Water and Power Press. www.waterpub.com.cn.
L. E. Miranda, and D. R. DeVries (Editors) (1996). Multidimensional approaches to reservoir fisheries management (Bethesda, Maryland: American Fisheries Society), 16. Symposium.
Ohio Environmental Protection Agency (1987). Biological criteria for the protection of aquatic life: Volume II. Users manual for biological field assessment of Ohio surface waters. Surface Water Section, Columbus, Ohio.
Park, Y. S., Chang, J., Lek, S., Cao, W., and Brosse, S. (2003). Conservation strategies for endemic fish species threatened by the Three Gorges Dam. Conserv. Biol. 17 (6), 1748–1758. doi:10.1111/j.1523-1739.2003.00430.x
Pearce, J., and Ferrier, S. (2000). Evaluating the predictive performance of habitat models developed using logistic regression. Ecol. Model. 133 (3), 225–245. doi:10.1016/S0304-3800(00)00322-7
Poff, N. L., Allan, J. D., Bain, M. B., Karr, J. R., Prestegaard, K. L., Richter, B. D., et al. (1997). The natural flow regime: A paradigm for river conservation and restoration. BioScience 47, 769–784. doi:10.2307/1313099
Poff, N. L. (2018). Beyond the natural flow regime? Broadening the hydro-ecological foundation to meet environmental flows challenges in a non-stationary world. Freshw. Biol. 63 (8), 1011–1021. doi:10.1111/fwb.13038
Qadir, A., and Malik, R. N. (2009). Assessment of an index of biological integrity (IBI) to quantify the quality of two tributaries of river Chenab, Sialkot, Pakistan. Hydrobiologia 621 (1), 127–153. doi:10.1007/s10750-008-9637-0
Ru, H. J., and Liu, X. Q. (2013). River-lake migration of fishes in the Dongting Lake area of the Yangtze floodplain. J. Appl. Ichthyology 29, 594–601. doi:10.1111/jai.12116
Sandhya, K. M., Lianthuamluaia, L., Karnatak, G., Sarkar, U. K., Kumari, S., Mishal, P., et al. (2019). Fish assemblage structure and spatial gradients of diversity in a large tropical reservoir, Panchet in the Ganges basin, India. Environ. Sci. Pollut. Res. 26, 18804–18813. doi:10.1007/s11356-019-05314-8
Seegert, G. (2000). The development, use, and misuse of biocriteria with an emphasis on the index of biotic integrity. Environ. Sci. policy 3, 51–58. doi:10.1016/s1462-9011(00)00027-7
Silva-Sene, A. M., Loures, R. C., de Andrade Neto, F. R., and Pompeu, P. S. (2022). Fish assemblage distribution along free-flowing rivers entering a reservoir cascade. Environ. Biol. Fishes 105, 1535–1547. doi:10.1007/s10641-022-01345-2
T. P. Simon (Editor) (1999). Assessing the sustainability and biological integrity of water resources using fish communities. 1st ed. (Boca Raton, Florida: CRC Press). doi:10.1201/9781003068013
Simon, T. P., and Lyons, J. (1995). . “Application of the index of biotic integrity to evaluate water resource integrity in freshwater ecosystem,” in Biological assessment criteria: Tools for water resource planning and decision making. Editors W. S. Davis, and T. P. Simon (Boca Raton, Florida: CRC Press), 245–262.
Simon, T. P., and Sanders, R. E. (1999). Applying an index of biotic integrity based on great river fish communities: Considerations in sampling and interpretation. Boca Raton, Florida: CRC Press.
Smith, K. L., and Jones, M. L. (2005). Watershed-level sampling effort requirements for determining riverine fish species composition. Can. J. Fish. Aquatic Sci. 62 (7), 1580–1588. doi:10.1139/f05-098
Soto-Navarro, C. A., Harfoot, M., Hill, S. L. L., Campbell, J., Mora, F., Campos, C., et al. (2021). Towards a multidimensional biodiversity index for national application. Nat. Sustain. 4 (11), 933–942. doi:10.1038/s41893-021-00753-z
Stein, R. A., Devries, D. R., and Dettmers, J. M. (1995). Food-web regulation by a planktivore: Exploring the generality of the trophic cascade hypothesis. Can. J. Fish. Aquatic Sci. 52, 2518–2526. doi:10.1139/f95-842
Thornton, K. W. (1990) “Perspectives on reservoir limnology,” in Reservoir limnology: Ecological perspectives, Editors K. W. Thornton, B. L. Kimmel, and F. E. Payne (New York, NY: A Wiley-Interscience), 1–13.
United Nations Environment Programme World Conservation Monitoring Centre and Luc Hoffmann Institute (2020). Building a multidimensional biodiversity index: A scorecard for biodiversity health - project report. Available at: https://wedocs.unep.org/20.500.11822/38023.
Vannote, R. L., Minshall, G. W., Cummins, K. W., Sedell, J. R., and Cushing, C. E. (1980). The river continuum concept. Can. J. Fish. aquatic Sci. 37 (1), 130–137. doi:10.1139/f80-017
Wang, J. N., Dong, Z. R., Liao, W. G., Li, C., Feng, S., Luo, H., et al. (2013). An environmental flow assessment method based on the relation-ships between flow and ecological response: A case study of the three Gorges reservoir and its downstream reach. Sci. China-Technological Sci. 56, 1471–1484. doi:10.1007/s11431-013-5193-6
Winters, L. K., and Budy, P. (2015). Exploring crowded trophic niche space in a novel reservoir fish assemblage: How many is too many? Trans. Am. Fish. Soc. 144 (6), 1117–1128. doi:10.1080/00028487.2015.1083475
Xie, J., Tang, W., and Yang, Y. (2018). Fish assemblage changes over half a century in the Yellow River, China. Ecol. Evol. 8 (8), 4173–4182. doi:10.1002/ece3.3890
Xiong, W., Wang, H., Wang, Q., Tang, J., Bowler, P., A., Xie, D., et al. (2018). Non-native species in the three Gorges dam reservoir: Status and risks. BioInvasions Rec. 7, 153–158. doi:10.3391/bir.2018.7.2.06
Yang, Z., Tao, J., Qiao, Y., Xu, W., and Chang, J. (2018). Multivariate analysis performed to identify the temporal responses of fish assemblages to abiotic changes downstream of the Gezhouba Dam on the Yangtze River. River Res. Appl. 34 (9), 1142–1150. doi:10.1002/rra.3345
Yang, Z., Zhu, D., Zhu, Q., Hu, L., Wan, C., Zhao, N., et al. (2020). Development of new fish-based indices of biotic integrity for estimating the effects of cascade reservoirs on fish assemblages in the upper Yangtze River, China. Ecol. Indic. 119, 106860. doi:10.1016/j.ecolind.2020.106860
Yang, Z., Pan, X., Hu, L., Xu, W., Jin, Y., Zhao, N., et al. (2021). Effects of upstream cascade dams and longitudinal environmental gradients on variations in fish assemblages of the three gorges reservoir. Ecol. Freshwater Fish 30 (4), 503–518. doi:10.1111/eff.12600
Ye, S., Li, Z., Liu, J., Zhang, T., and Xie, S. (2011). “Distribution, endemism and conservation status of fishes in the Yangtze River basin, China,” in Ecosystems biodiversity. Editor Oscar Grillo (London, United Kingdom: InTech Open). doi:10.5772/23099
Zhou, H., Li, C., Deng, H., Tian, H., Chen, Y., Gao, X., et al. (2020). Research on status and dynamic varietal trends of rare and unique fish stocks in upper reaches of Yangtze River. Freshw. Fish. 50 (6), 3–14.
Zhu, D., and Chang, J. (2008). Annual variations of biotic integrity in the upper Yangtze River using an adapted index of biotic integrity (IBI). Ecol. Indic. 8 (5), 564–572. doi:10.1016/j.ecolind.2007.07.004
Keywords: three gorges reservoir (TGR), index of biotic integrity, multi-metrics, long-term effects, fish assemblages
Citation: Zhu D, Yang Z, Chen X, Jin Y and Li D (2023) Development of a biotic integrity index based on long-term fish assemblage changes after dam construction in China. Front. Environ. Sci. 11:1103801. doi: 10.3389/fenvs.2023.1103801
Received: 21 November 2022; Accepted: 30 January 2023;
Published: 15 February 2023.
Edited by:
Jingfu Wang, Institute of Geochemistry (CAS), ChinaReviewed by:
Pedro Monteiro Amaral, Minas Gerais State University, BrazilGonçalo Duarte, University of Lisbon, Portugal
Copyright © 2023 Zhu, Yang, Chen, Jin and Li. This is an open-access article distributed under the terms of the Creative Commons Attribution License (CC BY). The use, distribution or reproduction in other forums is permitted, provided the original author(s) and the copyright owner(s) are credited and that the original publication in this journal is cited, in accordance with accepted academic practice. No use, distribution or reproduction is permitted which does not comply with these terms.
*Correspondence: Dewang Li, NjQ2NDQyMDhAcXEuY29t