 C. Furlong
 A. Mugendi
 D. Brdjanovic
- 1Citywide Inclusive Sanitation Group, Water Supply, Sanitation and Environmental Engineering, IHE Delft, Delft, Netherlands
- 2Independant Consultant, Nairobi, Kenya
Background: In recent years the number of tools developed to help advance sustainable urban sanitation coverage in low- and middle-income countries has increased significantly, yet no study has been undertaken to determine their usage or impact. This paper explores the usage and impact of four urban sanitation tools: Shit flow Diagram (SFD), City Service Delivery Assessment (CSDA), SaniPath, and the Citywide Planning Tool.
Methods: A mixed methodology approach was used which included a questionnaire (n = 87) and interviewing the tools developers (n = 5) and users (n = 25).
Results and discussion: There was a high awareness of three of the tools (86%, n = 87), but relatively low usage (53%, n = 87). The questionnaire respondents and interviewees confused the Citywide Planning Tool with other tools, so no usage was found. The CSDA and SaniPath were being used beyond the groups that developed them and by their targeted group, but the main users were found to be researchers in academia. There was evidence that SFDs and CSDAs were evolving beyond their original scope, which was attributed to their use in academia. Their use in academia should not be dismissed as they may lead to future usage and impact. Although impact will take time and it is difficult to directly attribute impact to a specific tool, evidence of the impact of the SFD and SaniPath was found. This impact demonstrates how these tools can lead to improvements in urban sanitation. This study also highlights the need for further research into the drivers of tool usage.
1 Introduction
A majority of the world’s population lives in towns and cities (55%) and this is expected to increase to 68% by 2050 (UN DESA, 2019). Most of this urban growth (59%) is predicted to occur in low-and middle-income countries (LMICs) (UN DESA, 2019). Due to this rapid urban growth LMICs will struggle to meet the needs of their populations in terms of resources and infrastructure (Lüthi et al., 2010; Lüthi et al., 2011), this includes sanitation. Currently, only 39% of urban dwellers in LMICs have access to safely managed sanitation services as defined by the Sustainable Development Goals (SDGs) (WHO/UNICEF, 2020). There is a need to prioritize the provision of urban sanitation services in these regions due to the complexity of the enabling environment for sanitation, defined as aspects of policy, legislation and finance, etc., that facilitate the delivery of the service, and the competition for other urban services (Lüthi et al., 2011). Approaches to improve sanitation coverage has changed from a traditional hardware approach which involves the construction of infrastructure (as in the Millennium Development Goals era) to the more holistic systems approach of the SDGs (Gambrill et al., 2020; WHO/UNICEF, 2020), which also includes the enabling environment.
Over the years many tools have been developed to help advance sustainable sanitation coverage in LMICs. Although the overall aim of these tools is the same, to improve sustainable sanitation coverage, their objectives and approaches differ. The number of publications on sanitation tools has risen dramatically every decade over the past 40 years, from 19 in the 1980s to 24 in the 1990s, then 81 in the 2000s and finally 192 in the decade spanning 2010 to 2019 (Mugendi, 2021). When these tools are reviewed they can be broadly grouped into five categories (Mugendi, 2021):
1. Technology selection tools e.g., SaniTech (Water Aid, 2016)
2. Planning tools and approaches e.g., Sani-KIT Tool (CSE, 2021)
3. Costing, budgeting, and financing tools e.g., Life-Cycle Costing for WASH (Mathijs and Fonseca, 2019)
4. Situational analysis tools e.g., Shit Flow Diagram (SFD) (SFD-PI, 2018a)
5. Other decision-making tools e.g., SaniPath (Emory University, 2020), Sanitation Safety Planning (WHO, 2015)
A majority of these publications were on tool development with technology selection being the main type of tool (e.g., Kalbermatten et al., 1982). This was due to the traditional focus on sanitation hardware. More general tools were developed in the past, but over the last 20 years the focus has switched to urban sanitation (e.g., the Household-Centred Environmental Sanitation Approach, Schertenleib, 2000). It was noted by Dey et al., in 2016 that in the last 10 years, approximately 25 tools were developed to aid the implementation of urban sanitation. This is due to the complexity of the urban sanitation context which is linked to factors such as heterogonous populations, land tenure issues and institutional fragmentation (Lüthi et al., 2010). There have been several studies exploring sanitation tools and approaches over the years, yet none have specifically focused on urban sanitation. Peal et al., 2010 explored hygiene and sanitation approaches related to behaviour change and demand creation, Ddiba et al., 2021 focused on sanitation resource recovery, and Spuhler & Lüthi 2020 reviewed planning approaches with a focus on technical innovations and sustainability. Most of these studies aimed to help users to decide on the most appropriate tool, but the usage, outcomes and impact of the tools and approaches explored were only discussed in Peal et al., 2010.The development of these urban sanitation tools was predominately funded by large non-governmental organisations such as the World Bank (World Bank, 2016) and the Bill and Melinda Gates Foundation (BMGF) (Bill and Melinda Gates Foundation, 2021). Even with this ongoing investment and development of urban sanitation tools, there is little evidence of their usage (except in the case of SFD, SFD-PI, 2018b) or impact, hence this study aims to explore this. The four urban sanitation tools chosen were: SFD (SFD-PI, 2018a), City Service Delivery Assessment (CSDA) (Blackett and Hawkins, 2020), SaniPath (Emory University, 2020) and Citywide Planning Tool (FSMA, 2022a). They were selected as they cover three of the five types of tools (planning, situational analysis and other decision-making) and different aspects of sanitation (sanitation services, the enabling environment, planning, and other decision making tools). They were developed in the past 15 years at approximately the same time and were free and easy to access. Additionally, they had not been covered in any depth in the previous reviews (Peal et al., 2010; Spuhler and Lüthi, 2020; Ddiba et al., 2021). They also align with the current concepts of holistic urban sanitation, as their focus is not on technology selection.
2 Methods and materials
A brief description of each of the four tools can be found below:
2.1 Shit flow diagram (SFD)
SFD is an advocacy tool used for situational analysis and to support decision-making in urban sanitation (SFD-PI, 2018a). The tool was originally developed by the World Bank in 2014 (World Bank, 2016) and is currently hosted by the Sustainable Sanitation Alliance (SuSanA) (SuSanA, 2021) and funded by BMGF and other partners. The tool generates a diagram that shows the fate of excreta in a city and the percentage of the population’s excreta that is safely or unsafely managed, the diagram is embedded into a report which contains the data sources used and the service delivery context of the city or town (SFD-PI, 2018c). The website contains training materials and the SFD manual which is available in English, French, Arabic, Spanish, and Portuguese languages (SFD-PI, 2018c). The reports generated can be submitted to the SFD Promotion Initiative and uploaded to their website for sharing, currently over 200 reports are published on this website (SFD-PI, 2018b).
2.2 City service delivery assessment (CSDA)
CSDA is a diagnostic tool developed by the World Bank in 2014 and was initially for onsite sanitation only (World Bank, 2016; Scott et al., 2017). The tool aims to assess the enabling environment along the sanitation service chain (Scott et al., 2017). It has since been modified with the support from BMGF, to include offsite sanitation so that it can be used at a citywide level (Blackett and Hawkins, 2020). The CSDA tool and manual are available in English and are hosted on the tool developers’ website (Blackett and Hawkins, 2022) and in FSM Toolbox (FSMA, 2022c).
2.3 SaniPath
SaniPath is an exposure assessment tool developed in 2011 to assess the risks to the public due to exposure to faecal contamination through exposure pathways in urban neighbourhoods (Raj et al., 2020). It was developed with the support of the BMGF, the methodology and tutorials are in English and hosted on their website (Emory University, 2020) and a link is provided to the website from the FSM Toolbox (FSMA, 2022b). The SaniPath tool has been implemented in ten cities and 40 neighbourhoods (Raj et al., 2020) and this data are on their website (Emory University, 2020).
2.4 Citywide Planning Tool
Citywide Planning Tool is in the FSM Toolbox planning module (FSMA, 2022a). The initial version of the FSM Toolbox did not include this tool, it was developed in 2018 by Athena Infonomics with support from BMGF (KI-5). The toolbox and tool are in English and contain a video guide (FSMA, 2022a). The tool is used to help plan onsite sanitation systems at a city level (FSMA, 2022a).
2.5 Method
The terms; tool, output, outcome and impact are defined in Table 1, this is due to these terms having different meanings in different contexts.
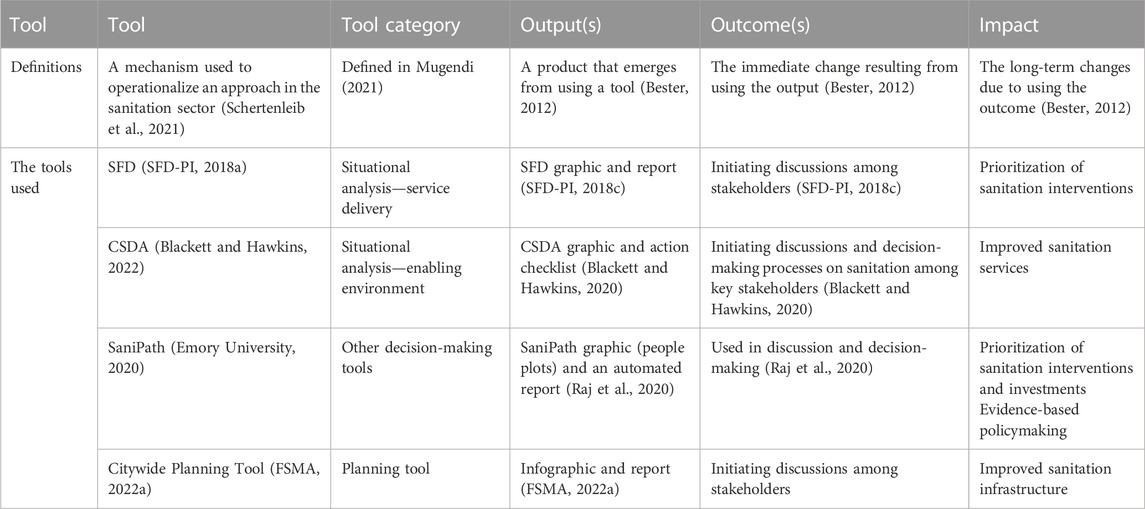
TABLE 1. Definitions of the terms used related to the tools.
A mixed methodology was used so data could be triangulated, validated, for completeness and to add explanation (Bryman, 2016). Secondary data was analysed to determine the users and the developers of the tools, usage of the tools and to assess the impacts of the tools. Primary data was gathered using an online questionnaire and semi-structured interviews.
The online questionnaire was developed in English on Survey Monkey© and was used to collect data on the users and usage, and the impact of the tools. The questionnaire consisted of seventeen open and closed questions and took approximately 8 min to complete. A blank version is available in the Supplementary Material for this paper. The questionnaire targeted sanitation professionals working in LMICs and was posted on the following forums: the Global Sanitation Graduate School (GSGS) (IHE Delft, 2022), SuSanA (SuSanA, 2021) and the Faecal Sludge Management Alliance (FSMA) via social media, e.g., Twitter, LinkedIn (FSMA, 2022d). The GSGS is a collective platform designed to disseminate knowledge on sanitation through courses and training, it also hosts a community of 234 sanitation experts (IHE Delft, 2022). SuSanA was founded in 2007 and is an online platform for people and organisations who share a common vision of sustainable sanitation and hosts the SFD tool (SuSanA, 2021). It has over 3,000 active members and 382 partners, who contribute to discussions and activities, and subscription is free (SuSanA, 2021). It is organized into thirteen sanitation-themed working groups such as Cities and Planning (SuSanA, 2021) where the questionnaire was posted. The FSMA aims to advocate for the adoption and implementation of faecal sludge management (FSM) in LMICs (FSMA, 2022d). Their online platform hosts the FSM Toolbox where the Citywide Planning Tool can be found as well as links to CSDA and SaniPath (FSMA, 2022d) and the organisation hosts the annual FSMA conference which targets professionals working in the FSM sector who use this platform for knowledge sharing (FSMA, 2021). The questionnaire was also emailed to FSMA Conference attendees from 2021 (FSMA, 2021) and MSc Sanitation alumni who are mid-career professionals, from IHE Delft. The survey was open for 2 months and participation was voluntary and anonymous, but respondents who had used any of the tools could opt to add their email address, so they could be contacted for a follow-up user interview.
Semi-structured online interviews were undertaken with the tool developers (n = 5, the co-developers of the CSDA tool were interviewed simultaneously) and the tool users (n = 25, SFD n = 12, CSDA n = 3, SaniPath n = 6, Citywide Planning Tool n = 4). These interviews lasted for approximately 40 min and were conducted in English and recorded, transcripts of the interviews were generated by Otter. ai software. The themes covered with the tool developers were the targeted users, usage and impact of their tools, while the interviews with the users were focused on usage, outcomes and impact. The tool developers were identified via secondary data sources or referrals and contacted via email. The users were self-identified via the questionnaire responses (20%, n = 25), via secondary data (12%, n = 25) or by referrals via the tool developers (68%, n = 25). Informed consent was given for all interviews and this study gained ethical approval from IHE, Delft in the Netherlands.
3 Results and discussion
3.1 Awareness and use
No secondary data on the use of the Citywide Planning Tool was found, but five users were self-identified through the questionnaire and four were interviewed (Table 2). From the questionnaire results (Table 2) it was found that 40% of the respondents who stated they had used the tool, had confused it with other planning frameworks, and the remaining respondents did not state how they had used the tool. A majority of those interviewed said they had used a former version of the FSM Toolbox, but not this tool (75%, n = 3). The remaining interviewee stated that they used the planning tool questions rather than the tool itself. As no users of this tool were identified this tool was not included in the discussions below.
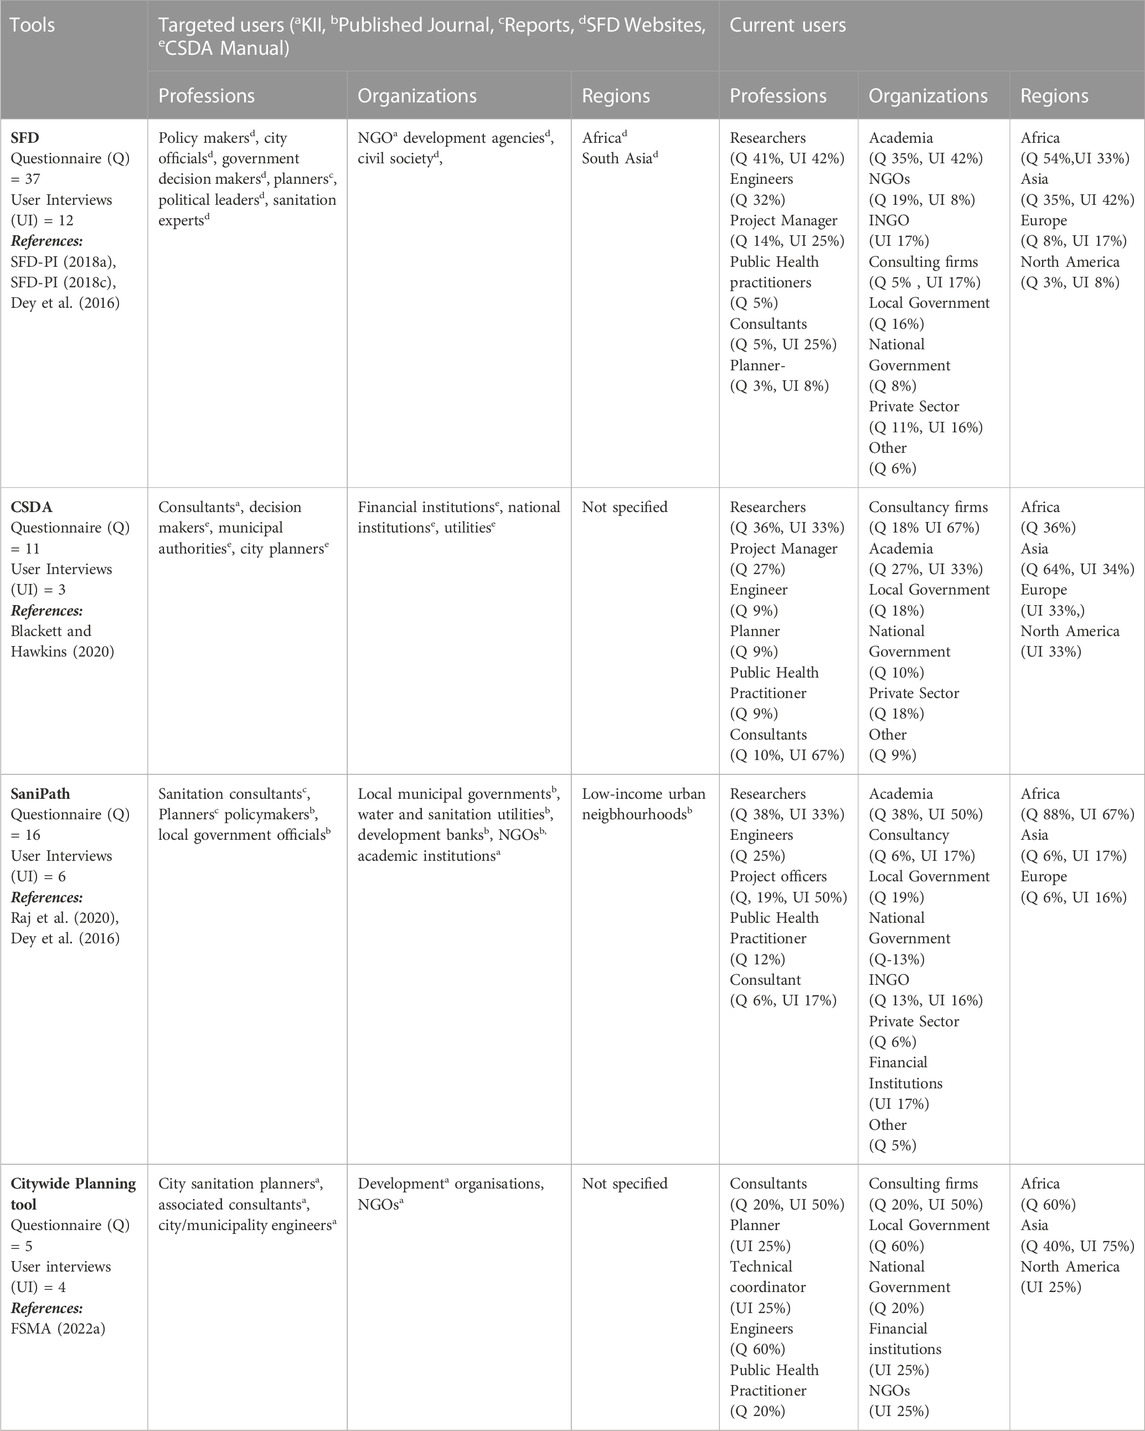
TABLE 2. Targeted and current tool users’ profiles.
The questionnaire completion rate was 52% (n = 167) and the responses were split across all three platforms (FSMA = 35, GSGS = 23, SuSanA = 20, Other, e.g., emails = 9). All data from the questionnaire is available in the Supplementary Material for this paper. Of those who completed the questionnaire 86% (n = 87) were aware of one or more of these tools. A majority of the respondents were aware of multiple tools (1 tool n = 19, 2 tools n = 33, 3 tools n = 23). The tool with the highest awareness was the SFD (83%, n = 87) followed by SaniPath (60%, n = 87) and CSDA (36%, n = 87), Figure 1. For all the tools most respondents heard about them in courses or training (Figure 1). Note that the category other included literature and websites such as SuSanA. Out of those who were aware of the tools 61% (n = 75) had used them, but a majority of the users had only used one tool (1 tool n = 30, 2 tools n = 14, 3 tools n = 2). The most popular tools mirrored awareness and as with awareness most of the users heard of the tools through courses or training (Figure 1). The high awareness and use of the SFD was possibly due to the high levels of ongoing promotion of this tool compared to the other tools (Peal et al., 2020). The transition from awareness to use was relatively low for all the tools (SFD = 51% n = 72, CSDA = 35%, n = 31, SaniPath = 31%, n = 52), therefore an area for further study for all tools could be how to convert awareness into use.
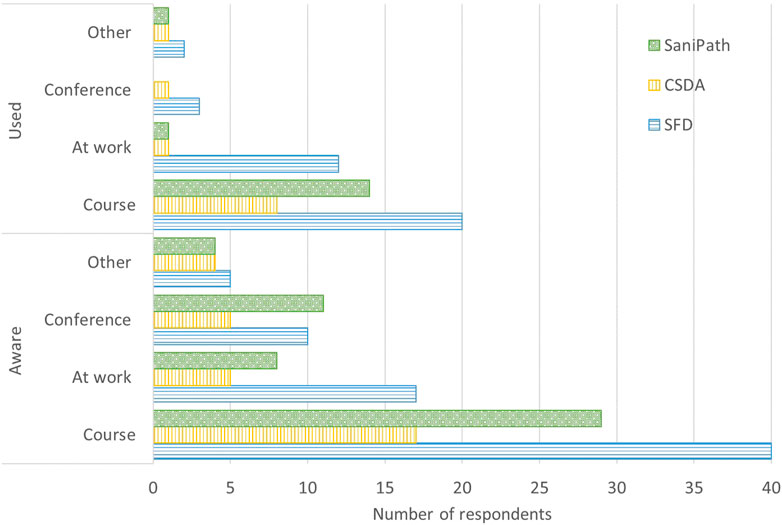
FIGURE 1. The questionnaire respondents’ awareness and use of each tool.
The number of user interviews varied by tool, with the highest number of user interviews being for the SFD tool (n = 12) and the lowest being for CSDA (n = 3). The difficulty in identifying users for some tools was probably linked to the low usage of the tools. It is acknowledged that this may have biased the results, there was a lack of data on the use of the CSDA and Citywide Planning Tool (Table 2) which led to a lack of data on the outputs, outcomes and impacts of these tools.
3.2 Tool usage
3.2.1 Shit Flow Diagram (SFD)
Since the development of the SFD in 2014 over 200 SFD reports have been published on the SFD website, 89 were authored or co-authored with organizations that developed the tool, while 113 were authored by other organizations (SFD-PI, 2018b). This demonstrates that this tool is being used outside the organizations which developed it. Additionally, it is known that the number of SFD graphics produced is higher than the number published on the website as many users do not submit them (Schertenleib et al., 2021). The promotion of SFD has been ongoing since its development, which has probably contributed to its wide usage (Peal et al., 2020). The online training and the SFD manual availability in different languages were also thought to play a role in its wide usage, although it should be noted that all of the reports published on the website, except two were in English (SFD-PI, 2018b). There is evidence of further development of this tool in literature, it has been used to predict the impact of sanitation interventions (Martinez Fernandez et al., 2017) and monitor the progress of citywide inclusive sanitation (Safi, 2019; Safi et al., 2022), and was adapted for FSM only (Chhajed-Picha and Narayanan, 2021).
3.2.2 City Service Delivery Assessment
Reports were identified on the use of the CSDA tool, including five World Bank piloting reports (World Bank, 2016), one published report (USAID, 2020), a journal article (Safi et al., 2022) and two MSc theses (Nyakutsikwa, 2018; Safi, 2019). The developers were only involved in the five piloting reports (World Bank, 2016), so the other reports demonstrate the usage of CSDA beyond the developers (Nyakutsikwa, 2018; Safi, 2019; USAID, 2020; Safi et al., 2022). Two of these studies were on the further development of the tool so it could be used to monitor citywide sanitation progress (Safi, 2019; Safi et al., 2022).
3.2.3 SaniPath
SaniPath tool has been deployed in ten cities; Accra, Kumasi, Lusaka, Vellore, Siem Reap, Dakar, Dhaka, Kampala, Maputo, and Atlanta with the involvement of the developers tool (Amin et al., 2019; Berendes et al., 2018; Berendes et al., 2020; Hurd et al., 2017; Raj et al., 2020; Robb et al., 2017; Teunis et al., 2016; Wang et al., 2017; Wang et al., 2022), these studies were on the development and deployment on the tool. Two studies were found which did not include the developers (Ronoh, 2019; Gizaw et al., 2022), demonstrating use beyond the tools developers. One study used the tool to explore the seasonal variation of faecal contamination in transmission pathways (Ronoh et al., 2020), which is beyond the tool’s intended scope (Table 1).
3.3 Who is using these tools?
Although the tools are very different there was very little difference in who each tool was targeting, all broadly target sanitation consultants and decision makers, e.g., planners, engineers, and local government (Table 2). From the questionnaire and interviews the predominant users of each of the tools (>30% for all tools for all types of respondents) were researchers, who were not being targeted by any of these tools (Table 2). The exception was for the CSDA as a majority of those interviewed were consultants (Table 2). The high number of researchers using these tools was unexpected as the questionnaire was posted on platforms which target sanitation professionals. This high academic usage could partially be due to SaniPath and SFD being developed (Emory University, 2020) and co-developed (SFD-PI, 2018d) by academic institutes, but this does not explain the high usage by academics of the CSDA which was developed without their involvement. High academic usage of the SFD tool was supported by the fact that 50% of the reports on their website were authored or co-authored by academics (SFD-PI, 2018b). In terms of SaniPath, a majority of the reports had been co-published by the developers who are from academia (Amin et al., 2019; Berendes et al., 2018; Berendes et al., 2020; Hurd et al., 2017; Raj et al., 2020; Robb et al., 2017; Teunis et al., 2016; Wang et al., 2017; Wang et al., 2022) and other documented uses were related to academic institutes (Ronoh, 2019; Ronoh et al., 2020; Gizaw et al., 2022). There was also evidence of CSDA usage in academia (Nyakutsikwa, 2018; Safi, 2019). The high number of academic users interviewed could have been due to bias related to the sampling strategy (those contacted via secondary data or referrals by the developers were more likely to be academics), but a similar pattern was seen in the questionnaire results which had a completely different sampling strategy. Although the predominant users of these tools were found to be researchers, over 50% of the users of each tool were found to fit with each tools’ target groups (Table 2). Some users were identified by the questionnaire from professions beyond the tools targeted user group such as public health practitioners and engineers (Table 2). The wider professional usage of the CSDA may be due to the current holistic approach to sanitation, which encompasses the enabling environment. The users who were noticeably absent for the SFD were political leaders, city officials, or the local communities, whereas for SaniPath it was local government officials (Table 2). It is thought that these user groups were more likely to be involved in reviewing the outputs (Table 1) than in using the tool. Their absence could partially be due to the sampling strategy as the platforms used target sanitation experts and practitioners.
3.4 What types of organizations do the users work for?
There was an overlap in the organizations which the different tools were targeting, but this was difficult to compare due to the difference in the terminology used (Table 1, 2). All three tools were targeting development banks (which could be considered development agencies or financial institutions, Table 2). Both SFD and SaniPath were targeting NGOs, and CSDA and SaniPath are targeting utilities, but this is where the overlap ends. CSDA is targeting national financial institutions, and SaniPath includes municipal governments (Table 2). For both the CSDA and the SFD the developers expanded the targeted organizations during the interviews beyond what was found in literature to include NGOs and academic institutes (Table 2). It was not surprising that the highest number of users (both identified by the questionnaire and interviewed) came from academia (Table 2). The exception was for the CSDA where more users were interviewed from consultancies. The SFD had the most variation in the user’s organization type (Table 2) although they were aligned with the professions targeted, they were not aligned to the types of organizations being targeted (Table 2), this was the same for CSDA (Table 2). For the SFD and CSDA under 40% of the users came from the targeted organizations (Table 2). SaniPath targeted a wider range of organizations, this meant that a majority of the users were from these organizations (Table 2). User organizations which were common to all tools were the private sector and consultancies, interestingly these types of organizations were not being specifically targeted by any of the tools. Although the tools are targeting specific types of organizations, they are all being used by organizations beyond this scope. These findings could help the tool developers refine the targeting of their tools, which could lead to more efficient promotion and subsequently increased usage.
The high usage of all tools by researchers and within academic organisations was surprising as they were not targeting this sector (except SaniPath). This high usage may be due to several reasons; some have already been discussed. Additional reasons are that the tools’ outputs visually summarise complex data which can be used for teaching, and the approaches provide a framework for data collection for student research. This is possibly why many of these tools had been used in student research projects (e.g., Fernandez-Martinez, 2016; Nyakutsikwa, 2018; Ronoh, 2019; Safi, 2019).
3.5 Geographies of usage
All of the tools had been predominately developed by organisations or individuals from high-income countries (HIC) (SFD-PI, 2018d; Emory University, 2020; Blackett and Hawkins, 2022), but they were targeting LMICs (Table 2). Several questions about geographies of use were used in the questionnaire to capture possible complexities of, e.g., a person might be based in a HIC, but implementing the tool in LMICs. It was found that a majority of the users identified through the questionnaires were nationals of LMICs (83%, n = 46), and only a few users were nationals of HICs (17%, n = 46). No users who were nationals of countries in Latin America and the Caribbean or Oceania were identified through the questionnaire or interviews (Figure 2). A reason for the lack of respondents from Latin America and the Caribbean may be due to the study’s English language bias. This was supported by the fact that most of the users identified through the questionnaire were from countries where English is an official language (32 out of 46). This could be linked to the fact that all of the tools were originally developed in English and that only one tool, the SFD is currently available in other languages (SFD-PI, 2018c). When a comparison was made between the users’ nationality, the location of their headquarters and the country they were currently based, there was no change in the dominant regions (Figure 2). Figure 2 hides some of the complexities of the geographies of use, e.g. three respondents had headquarters in HICs, but were currently working or based in different LMICs, and many of the users were working in additional countries or regions (48%, n = 46). This data demonstrates that although these tools were developed by organisations and individuals mainly from HICs, they are being used by people from, based in and working for organisations in LMICs, who are the targeted users of these tools (Table 2). As there was little difference geographies of use data, where the users were currently based was used for exploring this further in the section below.
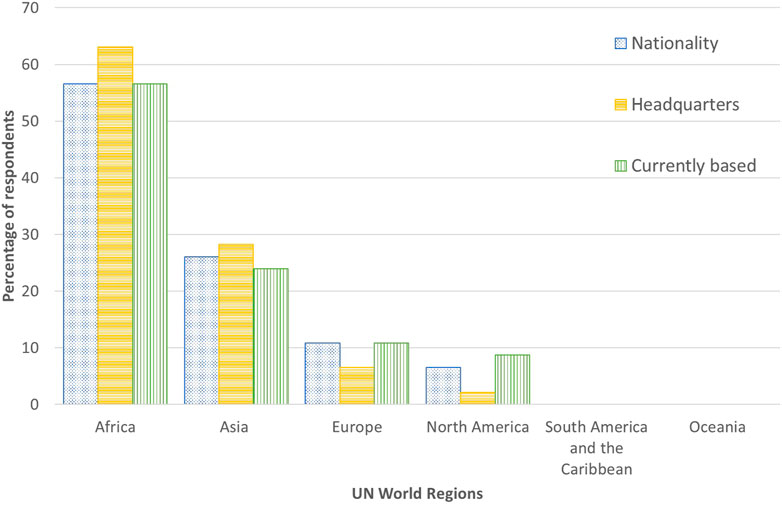
FIGURE 2. Questionnaire respondents’ nationalities, current working location and location of their headquarters (n = 46)
3.5.1 Shit flow diagram (SFD)
The SFD is aimed at urban areas in Asia and Africa (Table 2), predominately urban areas in LMICs. Of the reports published on the SFD website 97% are on cities in LMICs, 76% have been developed for cities in Asia and 18% have been developed for Africa (SFD-PI, 2018a). The high number of SFD reports for Asia could be attributed to the Indian government incorporating the tool into their city sanitation plans (KI-1, Peal et al., 2020), as 39% of the reports from Asia are from cities in India (SFD-PI, 2018a). A majority of the SFD users identified via the questionnaire were based in LMICs (Table 2), with the highest number based in Kenya (30%, n = 37) and then India (14%, n = 37). The high number of Indian-based users was expected, but the high number of Kenyan-based users was not. This was thought to be due to the highly developed and innovative sanitation sector in the country.
3.5.2 City service delivery assessment (CSDA)
The piloting studies on the CSDA tool covered five cities, in five countries Peru, Bolivia, Ethiopia, Bangladesh, and Indonesia, spanning Africa, Asia and South America (World Bank, 2016). Although neither the manual (Blackett and Hawkins, 2020) nor the developers (KI-2, KI-3) stipulated a target region or regions, the tool was originally developed for urban FSM, so it can be assumed to be targeting urban areas in LMICs. The CSDA tool has been used in other cities in LMICs including Aba, Nigeria (USAID, 2020), Tiruchirappalli, India (Safi, 2019; Safi et al., 2022) Kampala, Uganda (Nyakutsikwa, 2018; Blackett and Hawkins, 2022), and South Africa (KI-2, KI-3). The users identified from the questionnaire were based in Asia and Africa (Table 2), so they can be considered to be from LMICs. A majority of the users interviewed were from HICs (Table 2), this may be due to the small sample size. The lack of identified use of the tool in Latin America and non-Anglophone Africa may be due to the language barrier as the manual is only available in English (Blackett and Hawkins, 2020).
3.5.3 SaniPath
The SaniPath tool was designed to be used in low-resource urban areas (Raj et al., 2020), the tool developer did not state the targeted tool regions, but low-resource urban areas are mainly found in LMICs (KI-4). The SaniPath website states that the tool has been implemented in six African cities (Accra, Kumasi, Lusaka, Dakar, Kampala, Maputo) and three Asian cities (Dhaka, Vellore, Siem Reap) (Emory University, 2020). The users identified from the questionnaire were currently working in Africa (75% from Kenya) and Asia 7%, (Table 2). The high number of African users may be linked to the initial deployment of the tool in Africa (Emory University, 2020), but the high usage of the SaniPath tool in Kenya was unexpected as the tool had not been deployed in this country. Again, this could also be due to the highly developed and innovative sanitation sector in Kenya. While over half of the users interviewed were also working from Africa, it should be noted that some were working from Europe and North America (Table 2).
3.6 What are the tools being used for?
3.6.1 Shit flow diagram (SFD)
The SFD tool was designed for advocacy purposes to support decision-making on urban sanitation planning (SFD-PI, 2018a) this aim was reiterated by the developer (KI-1). This was the predominant theme identified by the users that were interviewed (40%, n = 12) and questionnaire respondents (40%, n = 37). One user stated that they used the SFD. ‘…to convey a complex message to decision-makers in a much easier way’ (U2). Another major use of the tool was found to be for academic purposes (questionnaire 28%, n = 37 and interviewees 26%, n = 12), although little information was given on what was meant by this. Other uses of this tool include situational analysis (questionnaire 24%, n = 37) and planning (interviews 17%, n = 12 and questionnaire 8%, n = 37) both of which could be considered advocacy to support decision making. Interestingly 17% of those who were interviewed (n = 12) reported using the tool for monitoring, this type of usage was also found in literature (Safi, 2019; Safi et al., 2022), demonstrating that the usage of the tool is evolving beyond its original scope. The users stated that the SFD report (output, Table 1) was used to support decision-making on sanitation planning (questionnaire respondents 38%, n = 37 and interviewees 50%, n = 12), which fits with its purpose (Table 1). Another usage of the outputs was to contribute to reports and academic articles (questionnaire 28%, n = 37 interview 25%, n = 12), which links to the high usage of the SFD tool in academia. The remaining participants did not state how they used the outputs (20%, n = 37) or the SFD process was still being implemented (14%, n = 37 and 25%, n = 12).
3.6.2 City Service Delivery Assessment (CSDA)
The CSDA tool aims to provide a situation analysis of the enabling environment along the service chain (Blackett and Hawkins, 2020; World Bank, 2016, KI-2, KI-3). In Nigeria the CSDA tool was used to study the city sanitation program, including policy and planning (USAID, 2020). The users of the CSDA identified through the questionnaire stated that they used the tool to understand the sanitation context of the city (45%, n = 11), for academic purposes (45%, n = 11) and the others did not explain how they used the tool (10%, n = 11). The output of the CSDA was designed to be used in stakeholder meetings and to support the development of projects (Table 1). A majority of the questionnaire respondents stated they used the output this way (63%, n = 11). Due to a large number of academic users the tool’s outputs were also used for academic purposes (interviewees 33%, n = 6, questionnaire participants 37%, n = 11). The other users interviewed mentioned that they did not use the outputs, due to uncompleted projects (67%, n = 6).
3.6.3 SaniPath
The SaniPath tool aims to identify and compare risks associated with exposure to faecal contamination across various exposure pathways due to poor sanitation in urban settings where there are low resources (Emory University, 2020; Raj et al., 2020), this was reiterated by the developer (KI-4). In addition, the tool helps prioritize sanitation investments based on exposures that have the greatest public health impact (KI-4). A majority of SaniPath users used the tool for its intended purpose (interviewees 67% n = 6, questionnaire 50%, n = 16), but again this tool was found to be used extensively for academic purposes (questionnaire respondent 50%, n = 16 and interviews (33%, n = 6). SaniPath’s outputs (Table 1) are designed for use in advocacy and to support decision-making on urban sanitation policies, investments, and programs (Raj et al., 2020), which was reiterated by the tool developer (KI-4). A majority of users were found to be using SaniPath for this purpose (questionnaire respondents 50%, n = 16, interview participants 67%, n = 6), one interviewee stated “…it is actually helped to make a decision on what we spend the money for sanitation improvement in Dhaka” (U12). In line with the use of the SaniPath tool, a high number of users used the output for educational purposes (questionnaire, 50%, n = 16 and interviews 33%, n = 6).
3.7 Is there any evidence of impact from these tools?
3.7.1 Shit Flow Diagram (SFD)
Impact (Table 1) is related to usage and time, therefore the most impactful tool should be the oldest tool which has been used the most. The three tools explored were all developed at approximately the same time (2011–2014), but approximately twice the number of users were identified via the questionnaire for the SFD compared to CSDA and SaniPath (Table 2). Several reasons were thought to have contributed to the high usage of the SFD compared to the other tools they include; ongoing promotion activities, comprehensive guidance, helpdesk accessibility, comprehensive training resources and activities, and ease of access. Additionally, the tool’s website and platform have remained consistent throughout its development. These aspects were not explored with the users and this highlights the need for further research into the drivers of tool usage. It was therefore expected that the SFD would have a higher impact than the other tools.
The impact of the SFD tool is defined in Table 1. The tool developer stated that it is impossible to claim any impact due to the complexity and diversity of cities and their sanitation landscape (KI-1). However, half of the users interviewed (50%, n = 12) mentioned impacts that occurred from using the tool. For example, one user stated that the impacts included securing funds, developing standard operating procedures for pit emptiers, and rebranding the sanitation and sewerage company (U6). Other impacts highlighted by the users included an increased mandate for utilities to cover both sewered and non-sewered sanitation and increased emphasis on the provision of safe sanitation (U8). This impact had not been documented in other publications. A quarter of the users interviewed could not state the impact of using the tool, this was due to the implementation of the tool being interrupted by the pandemic, and a further quarter of the users interviewed were using the tool as an academic exercise. Additionally, one paper documented the impact of using the tool in Indonesia (Trinanda, 2018). Through the questionnaire 18 out of 37 users stated that some impact had occurred from using this tool. The themes highlighted included creating more awareness of the sanitation situation (22%), encouraging communications amongst stakeholders (11%), greater buy-in from the government (8%), increasing the percentage of onsite sanitation users (9%), while 50% stated there was no impact after using the tool. The impacts stated by the questionnaire respondents are outcomes rather than impacts of using this tool (Table 1).
3.7.2 City Service Delivery Assessment (CSDA)
The impact of the CDSA is defined in Table 1, which was aligned with the developers’ views (KI-2). As the literature on CSDA was on the development and piloting of the tools (World Bank, 2016; Nyakutsikwa, 2018; Safi, 2019; Safi et al., 2022) impact was not described. The users that were interviewed (n = 3) were not able to describe any impact of these tools as they were using the tool for research purposes (33%), the tool results were not used (33%), or the program ended abruptly (33%). Some questionnaire respondents did highlight the impact of these tools (45%, n = 11), the themes highlighted included; a clear understanding of the sanitation status, prompt analysis, and understanding of the enabling environment. As with the SFD, all the themes highlighted by the questionnaire respondents were outcomes rather than impacts (Table 1). The other users identified through the questionnaire stated that they used the tool outputs for academic purposes (45%, n = 11) or did not state any usage and therefore could not account for any change (10%, n = 11). No impact from the use of this tool was found in this study.
3.7.3 SaniPath
The intended impact of the SaniPath tool according to the developer is to collect public health evidence for decision-making and advocacy purposes, as commented: “…and if we want sanitation investments, to have some sort of public health impact, we should be using some public health evidence to guide that decision” (KI-4), which is in line with the impact defined in Table 1. There is evidence of the impact of SaniPath in literature, e.g., evidence-based policymaking in Kumasi, Ghana (Emory University, 2020; Raj et al., 2020) and prioritisation of sanitation interventions and investments in Kumasi, Ghana and Lusaka, Zambia (Raj et al., 2020). The users identified through the questionnaire (n = 16) highlighted creating awareness and a better understanding of the exposure pathways (25%), as with the previous two tools this theme was related to outcomes rather than the impact of this tool (Table 1). A majority of the questionnaire respondents (75%, n = 16) did not state any impact or left this question blank. Two of the users that were interviewed were involved in the studies which had been published (Raj et al., 2020). They highlighted additional impact which was not captured in the publication such as the development of a waste management plan, redesigning of the water monitoring systems, and the introduction of a hygiene and behaviour change course in schools (U20). The other interviewees could not state any impact of the tool due to interruption of their projects or due to the tool being for academic purposes.
3.7.4 General impact
It was clear that questionnaire respondents struggled with the concept of impact and focused on the outcomes. This could be due to the complexity of linking impact back to these tools as described by KII-1 and perhaps due to a misunderstanding of the impact that these tools are trying to achieve which is broad and overarching (Table 1). In comparison, the outcomes were more tangible and can be easily linked with each tool. All of the tools had high usage in the academic sector, which none of these tools was targeting. This was linked to the low impact of these tools as they were not being used by practitioners, but as an academic exercise. This type of usage can increase awareness and usage of these tools, and the issues which they address. It is hypothesised that the students exposed to these tools will go on to become practitioners, which could lead to further usage and ultimately impact.
3.8 Study limitations
Some of the limitations of this study have been highlighted in the discussion. They include the English language bias, the literature review only searched for publications in English, the survey was written in English and the platforms where the survey was posted were English language only. The platforms used to distribute the survey were targeting urban sanitation specialists, which may be considered the users of the tools, rather than of the tools’ outputs. So those using the outputs of these tools are under-represented in this research. It was also assumed that the platforms used were targeting sanitation professionals not academics. The study was undertaken during the pandemic and those working in the sanitation sector were key workers, so may not have had time to participate in this study. This could account for the low number of people who were willing to be interviewed from the survey and who were identified by secondary data. The pandemic also impacted the use of these tools, it was noted some projects were put on hold during this period, so their usefulness could not be determined. Finally, many of those who participated in the study confused outcomes with impacts, which means that further impacts may have been uncovered if different methods had been used. A majority of those who were interviewed (68%) were referred by the tool developers which may have caused the results on impact to be positively biased.
4 Conclusion
Although the four tools had been developed within 3 years of each other very different usage was found, and no users were found for the Citywide Planning Tool. The high awareness and usage of SFD compared to the other tools was attributed to ongoing promotion activities, comprehensive guidance, helpdesk accessibility, training resources and activities and ease of access, the inverse of these factors could play a role in the lower usage of the other tools. More research is required on what factors drive tool usage, as this study shows that if a tool is developed it is not automatically used. This study found that the three of the tools were being used by those they were designed for and there was evidence of outcomes from using these tools, which were previously undocumented. While impact will take time and it can be complicated to directly attribute impact to a specific tool, evidence was found of the impact of the SFD and SaniPath. The authors would encourage the users of these tools and their outputs to document their experiences via publications and reports, so that we can further understand their usage and impact. Surprisingly researchers were found to be the main user group for these tools, this led to SFD and CSDA evolving beyond their original scope, which could have implications for future impact. The use of these tools in academia should not be undervalued, as this will probably lead to mainstreaming of these tools, future usage and impact.
Data availability statement
The raw data supporting the conclusion of this article will be made available by the authors, without undue reservation.
Ethics statement
The studies involving human participants were reviewed and approved by the Dr. Angeles Mendoza Sammet-IHE Delft. The patients/participants provided their written informed consent to participate in this study.
Author contributions
CF conceptualization of the study; CF and AM methodology, data analysis; AM data collection; CF and DB supervision; CF and AM writing original draft; CF, AM, and DB writing—review and editing. All authors contributed to the article and approved the submitted version.
Funding
This research was undertaken while studying for an MSc in Sanitation at IHE Delft Institute for Water Education, Netherlands with a scholarship funded by Bill and Melinda Gates Foundation under the following grant number: OPP1157500 and INV-009151.
Acknowledgments
Special thanks to AM’s co-mentor Eva Mary from FSMA and the FSMA team for their contribution to this research. We would like to thank everyone the participants of this study, without their responses and views this research would have not been possible.
Conflict of interest
The authors declare that the research was conducted in the absence of any commercial or financial relationships that could be construed as a potential conflict of interest.
Publisher’s note
All claims expressed in this article are solely those of the authors and do not necessarily represent those of their affiliated organizations, or those of the publisher, the editors and the reviewers. Any product that may be evaluated in this article, or claim that may be made by its manufacturer, is not guaranteed or endorsed by the publisher.
Supplementary material
The Supplementary Material for this article can be found online at: https://www.frontiersin.org/articles/10.3389/fenvs.2023.1109306/full#supplementary-material
References
Amin, N., Rahman, M., Raj, S., Ali, S., Green, J., Das, S., et al. (2019). Quantitative assessment of fecal contamination in multiple environmental sample types in urban communities in Dhaka, Bangladesh using SaniPath microbial approach. PLoS One 14, e0221193. doi:10.1371/journal.pone.0221193
Berendes, D. M., de Mondesert, L., Kirby, A. E., Yakubu, H., Adomako, L., Michiel, J., et al. (2020). Variation in E. coli concentrations in open drains across neighborhoods in Accra, Ghana: The influence of onsite sanitation coverage and interconnectedness of urban environments. Int. J. Hyg. Environ. Health 224, 113433. doi:10.1016/j.ijheh.2019.113433
Berendes, D. M., Kirby, A. E., Clennon, J. A., Agbemabiese, C., Ampofo, J. A., Armah, G. E., et al. (2018). Urban sanitation coverage and environmental fecal contamination: Links between the household and public environments of Accra, Ghana. PLoS ONE 13 (7), e0199304. doi:10.1371/journal.pone.0199304
Bester, A. (2012). “Results-based management in the united nations development system: Progress and challenges,” in A report prepared for the united nations department of economic and social affairs, for the quadrennial comprehensive policy review (Citeseer), 2730.
Bill and Melinda Gates Foundation (2021). Bill & Melinda Gates foundation-committed grants-university of leeds. Available at: https://www.gatesfoundation.org/about/committed-grants/2016/11/opp1153400 (Accessed December 14, 2021).
Blackett and Hawkins (2020). City service delivery assessment for citywide inclusive sanitation user guide. Available at: https://incsanprac.com/tools.html (Accessed May 1, 2021).
Blackett and Hawkins (2022). Inclusive Sanitation in Practice for healthy equitable cities. Available at: https://www.incsanprac.com/tools.html#CSDA (Accessed February 17, 2022).
Chhajed-Picha, P., and Narayanan, N. C. (2021). Refining the shit flow diagram using the capacity-building approach – method and demonstration in a south Indian town. J. Environ. Manage 294, 112971. doi:10.1016/j.jenvman.2021.112971
CSE (2021). SANI-Kit-Preparing a city sanitation plan. Available at: https://www.cseindia.org/sanikit/sani-kit.htm (Accessed September 27, 2021).
Ddiba, D., Andersson, K., Dickin, S., Ekener, E., and Finnveden, G. (2021). A review of how decision support tools address resource recovery in sanitation systems. Available at: https://ssrn.com/abstract=4220102 (Accessed May 1, 2023).
Dey, S., Patro, S. A., and Rathi, S. (2016). Sanitation tool compendium center for study of science, technology and policy. Bengaluru: Center for Study of Science, Technology, and Policy.
Emory University (2020). SaniPath approach-About the tool. Available at: https://www.sanipath.net/sanipath-approach (Accessed June 16, 2021)
Fernandez-Martinez, L. (2016). “Using the SFD methodology for modelling future scenarios in Kumasi, Ghana,”. MSc Thesis (Loughborough, UK: Water Engineering Development Center).
FSMA (2021). FSM conference. Available at: https://fsm-alliance.org/fsm-conference/ (Accessed April 14, 2022)
FSMA (2022c). FSM toolbox-assessment. Available at: https://www.fsmtoolbox.com/assessment (Accessed February 17, 2022).
FSMA (2022a). FSM toolbox-planning. Available at: https://www.fsmtoolbox.com/planning (Accessed June 20, 2021)
FSMA (2022d). FSMA-about the alliance. Available at: https://fsm-alliance.org/ (Accessed February 16, 2022).
FSMA (2022b). Other resources. Available at: https://www.fsmtoolbox.com/learn/other_resources (Accessed July 13, 2022)
Gambrill, M., Gilsdorf, R. J., and Kotwal, N. (2020). Citywide inclusive sanitation—business as unusual: Shifting the paradigm by shifting minds. Front. Environ. Sci. 201, 00201. doi:10.3389/fenvs.2019.00201
Gizaw, Z., Yalew, A. W., Bitew, B. D., Lee, J., and Bisesi, M. (2022). Fecal indicator bacteria along multiple environmental exposure pathways (water, food, and soil) and intestinal parasites among children in the rural northwest Ethiopia. BMC Gastroenterol. 22, 84–17. doi:10.1186/s12876-022-02174-4
Hurd, J., Hennink, M., Robb, K., Null, C., Peprah, D., Wellington, N., et al. (2017). Behavioral influences on risk of exposure to fecal contamination in low-resource neighborhoods in Accra, Ghana. J. Water, Sanitation Hyg. Dev. 7 (2), 300–311. doi:10.2166/washdev.2017.128
IHE Delft (2022). Global sanitation graduate school (GSGS). Available at: https://sanitationeducation.org/ (Accessed February 16, 2022).
Kalbermatten, J. M., Julius, D. S., Gunnerson, C. G., and Mara, D. D. (1982). Appropriate sanitation alternatives: A planning and design manual. Washington: The World Bank.
Lüthi, C., McConville, J., and Kvarnström, E. (2010). Community-based approaches for addressing the urban sanitation challenges. Int. J. Urban Sustain Dev. 1, 49–63. doi:10.1080/19463131003654764
Lüthi, C., Panasar, A., Schütze, T., Norström, A., McConville, J. A., Parkinson, J., et al. (2011). Sustainable sanitation in cities: A framework for action. Rijswijk, Netherlands: SuSanA, Papiroz Publishing House
Martinez Fernandez, L., Furlong, C., and Scott, R. (2017). Predicting the impact of sanitation investment projects on the Sanitation Service Chain (SSC), using excreta flow diagrams (SFDs). Available at: https://www.susana.org/en/knowledge-hub/resources-and-publications/library/details/2734 (Accessed May 1, 2023).
Mathijs, V., and Fonseca, C. (2019). Collecting life-cycle cost data for WASH services: A guide for practitioners “final draft for review”. Available at: https://www.ircwash.org/resources/collecting-life-cycle-cost-data-wash-services-guide-practitioners (Accessed May 1, 2023).
Mugendi, A. (2021). “Assessment of the global impact of selected current urban sanitation tools,”. MSc Thesis (Delft, Netherlands: IHE).
Nyakutsikwa, B. F. (2018). “Evaluation of existing services in Bushenyi and a comparison of the enabling environment with Kampala,”. MSc Thesis (Delft, Netherlands: IHE).
Peal, A., Evans, B., Ahilan, S., Ban, R., Blackett, I., Hawkins, P., et al. (2020). Estimating safely managed sanitation in urban areas; lessons learned from a global implementation of excreta-flow diagrams. Front. Environ. Sci. 8, 1. doi:10.3389/fenvs.2020.00001
Peal, A., Evans, B., and van der Voorden, C. (2010). Hygiene and sanitation software: An overview of approaches. Geneva, Switzerland: Water Supply & Sanitation Collaborative Council.
Raj, S. J., Wang, Y., Yakubu, H., Robb, K., Siesel, C., Green, J., et al. (2020). The SaniPath exposure assessment tool: A quantitative approach for assessing exposure to fecal contamination through multiple pathways in low resource urban settlements. PLoS One 15, e0234364. doi:10.1371/journal.pone.0234364
Robb, K., Null, C., Teunis, P., Yakubu, H., Armah, G., and Moe, C. L. (2017). Assessment of fecal exposure pathways in low-income urban neighborhoods in Accra, Ghana: Rationale, design, methods, and key findings of the SaniPath study. Am. J. Trop. Med. Hyg. 97, 1020–1032. doi:10.4269/ajtmh.16-0508
Ronoh, P., Furlong, C., Kansiime, F., Mugambe, R., and Brdjanovic, D. (2020). Are there seasonal variations in faecal contamination of exposure pathways? An assessment in a low–income settlement in Uganda. Int. J. Environ. Res. Public Health 17, 6355. doi:10.3390/ijerph17176355
Ronoh, P. K. (2019). “Exploring seasonal variation in faecal risk pathways in Rubaga division using SaniPath,”. MSc thesis (Delft, Netherlands: IHE).
Safi, F., Furlong, C., Luthra, B., Rohilla, S. K., and Brdjanovic, D. (2022). Monitoring progress in citywide sanitation. Front. Environ. Sci. 9, 751534. doi:10.3389/fenvs.2021.751534
Safi, F. (2019). “Monitoring changes in city-wide sanitation: An assessment of two tools,”. MSc thesis (Delft, Netherlands: IHE).
Schertenleib, R., Luthi, C., Panesar, A., Büürma, M., Kapur, D., and Narayan, A. (2021). A sanitation journey-principles, approaches and tools for urban sanitation. Bonn, Germany, Dübendorf, Switzerland: Sustain Sanit Alliance (SuSanA), GIZ Sect Program Sustain Sanit Eawag-Sandec
Schertenleib, R. (2000). “The Bellagio Principles and a household centered approach in environmental sanitation,” in Ecosan: Closing the loop in wastewater management (Eschborn, Germany: GTZ GmbH), 52.
Scott, R. E., Ross, I., and Smith, M. D. (2017). “Diagnostic and decision-support tools for effective faecal sludge management (FSM) services,” in 40th WEDC International Conference, Loughborough, UK, July 24-July 28, 2017.
SFD-PI (2018b). SFD data. Available at: https://sfd.susana.org/about/sfd-data (Accessed June 27, 2021)
SFD-PI (2018a). The SFD approach. Available at: https://sfd.susana.org/about/the-sfd (Accessed July 17, 2022)
SFD-PI (2018c). The SFD manual. Available at: https://sfd.susana.org/knowledge/the-sfd-manual (Accessed July 20, 2021)
SFD-PI (2018d). The SFD promotion initiative. Available at: https://sfd.susana.org/about/the-sfd-promotion-initiative (Accessed April 11, 2022)
Spuhler, D., and Lüthi, C. (2020). Review of frameworks and tools for urban strategic sanitation planning: Considering technology innovations and sustainability. J. Water, Sanitation Hyg. Dev. 10 (4), 768–785. doi:10.2166/washdev.2020.062
SuSanA (2021). Sustainaible national alliance-About Us. Available at: https://www.susana.org/en/about (Accessed February 16, 2022).
Teunis, P. F. M., Reese, H. E., Null, C., Yakubu, H., and Moe, C. L. (2016). Quantifying contact with the environment: Behaviors of young children in Accra, Ghana. Am. J. Trop. Med. Hyg. 94 (4), 920–931. doi:10.4269/ajtmh.15-0417
Trinanda, N. G. (2018). The Shit Flow Diagram in Indonesia–cities’ instrument towards universal access to sanitation. Available at: https://www.susana.org/en/knowledge-hub/resources-and-publications/library/details/3567 (Accessed May 1, 2023).
UN DESA (2019) United Nations, Department of Economic and Social Affairs, Population Division (2019). World Urbanization Prospects: The 2018 Revision (ST/ESA/SER.A/420). New York: United Nations.
USAID (2020). Effective water, sanitation, and hygiene services (E-WASH)sanitation mapping in five Nigerian cities -Aba city, abia state. Available at: https://www.rti.org/impact/effective-water-sanitation-and-hygiene-services-nigeria-e-wash (Accessed May 1, 2023).
Wang, Y., Mairinger, W., Raj, S. J., Yakubu, H., Siesel, C., Green, J., et al. (2022). Quantitative assessment of exposure to fecal contamination in urban environment across nine cities in low-income and lower-middle-income countries and a city in the United States. Sci. Total Environ. 806(3), 151273. doi:10.1016/j.scitotenv.2021.151273
Wang, Y., Moe, C. L., Null, C., Raj, S. J., Baker, K. K., Robb, K. A., et al. (2017). Multipathway quantitative assessment of exposure to fecal contamination for young children in low-income urban environments in Accra, Ghana: The SaniPath analytical approach. Am. J. Trop. Med. Hyg. 97 (4), 1009–1019. doi:10.4269/ajtmh.16-0408
Water Aid (2016). Comparison of tools & approaches for urban sanitation September 2016. Available at: https://r.search.yahoo.com/_ylt=AwrJETfatyBiXCcAAhA0AopQ;_ylu=Y29sbwNpcjIEcG9zAzEEdnRpZAMEc2VjA3Ny/RV=2/RE=1646340186/RO=10/RU=https%3A%2F%2Fwashmatters.wateraid.org%2Fpublications%2Furban-sanitation-tools-and-approaches/RK=2/RS=rHreNccNeqE24FXGviYY0Lp_fI (Accessed March 3, 2022)
Who, (2015). Sanitation safety planning: Manual for safe use and disposal of wastewater, greywater and excreta. Geneva, Switzerland: World Health Organization WHO.
WHO/UNICEF (2020). Joint monitoring programme for water supply, sanitation and hygiene (JMP). Available at: https://washdata.org/data/household#!/ (Accessed December 22, 2021).
World Bank (2016). Fecal sludge management tools. Available at: https://www.worldbank.org/en/topic/sanitation/brief/fecal-sludge-management-tools (Accessed July 16, 2021)
Keywords: shit (excreta) flow diagram, city service delivery assessment, citywide planning tool, SaniPath, FSM toolbox, faecal sludge management, citywide inclusive sanitation (CWIS)
Citation: Furlong C, Mugendi A and Brdjanovic D (2023) Exploring the usage and impact of urban sanitation tools targeting low- and middle-income countries. Front. Environ. Sci. 11:1109306. doi: 10.3389/fenvs.2023.1109306
Received: 27 November 2022; Accepted: 20 June 2023;
Published: 14 July 2023.
Edited by:
Zifu Li, University of Science and Technology Beijing, ChinaReviewed by:
Alison Parker, Cranfield University, United KingdomFreya Mills, University of Technology Sydney, Australia
Copyright © 2023 Furlong, Mugendi and Brdjanovic. This is an open-access article distributed under the terms of the Creative Commons Attribution License (CC BY). The use, distribution or reproduction in other forums is permitted, provided the original author(s) and the copyright owner(s) are credited and that the original publication in this journal is cited, in accordance with accepted academic practice. No use, distribution or reproduction is permitted which does not comply with these terms.
*Correspondence: C. Furlong, Yy5mdXJsb25nQHVuLWloZS5vcmc=; A. Mugendi, bXV0aG9uaWFubi5tYUBnbWFpbC5jb20=