 Jie Huang
 Qianqian Li1
 Minzhe Du
 Xiaoqing Chen
- 1Business School, Research Institute of the Economic and Social Development in the Dabie Mountains, Xinyang Normal University, Xinyang, Henan, China
- 2School of Economics and Management, South China Normal University, Guangzhou, Guangdong, China
Based on panel data of 282 cities in China from 2005 to 2019, this paper constructs an economic resilience evaluation index system in three dimensions and applies the entropy value method to measure it. The two-stage nested Thiel index, kernel density estimation and geographic detector methods are also used to explore the characteristics of their spatial and temporal divergence and their driving factors. We find that the economic resilience of Chinese cities has increased rapidly over the sample period, but with significant spatial variation, with the intra-provincial variation being the main source of the overall variation. Without considering the spatial conditions, the economic resilience of cities has a strong stability. In the case of spatial conditions, spatial factors have a significant impact on cities with low economic resilience, but not on cities with high economic resilience. Differences in technological innovation capabilities are a key driver of spatial divergence in the economic resilience of Chinese cities. The interaction of any two factors enhances their respective effects on the spatial differentiation of economic resilience in Chinese cities. Based on the above findings, cities should actively explore targeted and differentiated ways to improve economic resilience based on their comparative advantages, accelerate the construction of a collaborative improvement mechanism for urban economic resilience, and support the collaborative improvement of urban economic resilience in China. Our findings provide a useful reference for promoting the concerted improvement of economic resilience in Chinese cities.
1 Introduction
Economic resilience is an important performance of whether or not an economic entity can quickly make adaptations when suffers from shocks and a key indicator of sustainable economic development. In recent years, with the rapid development of urban economy, countries generally face problems such as increasing carbon emissions (Li et al., 2021a; Du et al., 2022; Wang et al., 2022a; Wang et al., 2023a) and environmental pollution (Li et al., 2021b; Yan and Shi, 2022; Wang et al., 2023b). Although China has entered a new urbanization development stage, China’s urban economic development still faces the shock of many uncertain factors such as frequent natural disasters, major unexpected events and increased financial risks. The key to resisting the shock of such uncertain factors as well as achieving high-quality economic development lies in enhancing the urban economic resilience. Despite the short-term impact of the epidemic, the basic properties of China’s strong economic resilience, potential enough and space for maneuvering have not changed, making China the only major economic entity to achieve positive economic growth in 2020 since the outbreak of the COVID-19 pandemic1. Yet, the diversities in locational conditions, economic foundation, and policy support among different cities result in their economic performance in the regional division of labor completely different (Huang and Zhong, 2022; Rong et al., 2023), and their economic resilience also shows significant distinction. In contrast, the spatial variation in the economic resilience of cities could further exacerbate the unevenness of China’s high-quality economic development. Therefore, in the face of external shocks, especially in the context of the COVID-19 pandemic hitting the global economy, it is of great practical significance to detect the characteristics and drivers of spatial and temporal divergence of economic resilience of Chinese cities for driving the synergistic enhancement of economic resilience of Chinese cities and promoting high-quality balanced economic development.
Drawing from physics concept, resilience is used to express the ability of an object deforms and returns to its original state at the times of external force. Holling (1973) first introduced it into the field of ecology, and later it was extended to the field of sociology and economics (Adger, 2000; Rose and Liao, 2005; Holling, 2001; Zhang, et al., 2018; Liao, et al., 2022; Huang et al., 2022; Assmann et al., 2021; Dormady et al., 2022; Itzhaki-Braun, 2022). The connotation of “resilience” has evolved gradually from engineering and ecological resilience to evolutionary resilience. Evolutionary resilience was regarded as more suitable to explain economic resilience due to considered economic systems as the systems without an equilibrium state of their own (Simmie and Martin, 2010). The current research on economic resilience focuses on the following three aspects. First, the measurement of economic resilience, which mainly include single-factor measure method and comprehensive indicator methods. The single-factor measure method refers to the selection of a variable that can intuitively reflect the strength of economic resilience, such as the change in the employment rate (Martin, 2011; Fingleton et al., 2012; Doran and Fingleton, 2016; Brown and Greenbaum, 2017; Giannakis and Bruggeman, 2017; Rocchetta and Mina, 2019), the change in the unemployment rate (Davies, 2011; Brakman et al., 2015), GDP growth rate (Martin and Gardiner, 2019; Hundt and Holtermann, 2020; Feng et al., 2022; Hu et al., 2022) and so on. However, since different economic entities have obvious heterogeneity in terms of the degree of development, external environment and internal structure, a single indicator may not be able to accurately reflect the economic resilience of each economic entity. In contrast, the comprehensive indicator method can construct a system of indicators to measure economic resilience from multiple perspectives, which can compensate the shortcomings of a single indicator to a certain extent. For example, Briguglio et al. (2006) took the lead in constructing an economic resilience evaluation index system from four aspects: macroeconomic stability, micro market efficiency, good economic governance and social development. Wang et al. (2022b) constructed an index system to measure the economic resilience of 286 cities in China from the economic performance, public perspective, public sanitation, regional epidemic management, and population information of the affected area. Ubago et al. (2019) constructed a comprehensive evaluation system of regional economic resilience in Spain from industrial structure, capital value, labor force, and economic development level. Jiang et al. (2022) selected five major indicators from the consumption, investment, import and export, government expenditure, and employment levels to establish an indicator evaluation system. Second, the study of spatial variation in economic resilience has been confirmed by existing scholars from diverse dimensions. Giannakis and Bruggeman (2017) found that rural areas are more resilient than urban areas by comparing economic resilience between rural and urban areas in Greece. Wang and Wei (2021) proposed that economic resilience was higher in Beijing, Guangdong, and Shanghai, while regions such as Xinjiang and Inner Mongolia ranked lowest in economic resilience nationally by studying economic resilience in 30 Chinese provinces. While Wu et al. (2020) detected that economic resilience is not only a key factor influencing the urban resilience, but also there is significant variability in spatial distribution by evaluating the resilience indices of 26 Chinese provinces. Du et al. (2019) studied on the economic resilience of cities in the Pearl River Delta and found that the economic resilience of core cities was high, while the economic resilience of peripheral cities was low. Hu et al. (2022) found that the economic resistance of the Northeast China is higher than the national average, but the ability of most cities to withstand shocks is weak, and large urban areas show greater vulnerability than small urban areas. Cheng et al. (2022) showed that the average urban economic resilience of the western region was the highest, followed by the central region, the northeast region, and the lowest in the eastern region. Third, the study of the drivers that affect economic resilience have been widely explored by scholars at home and abroad recently, such as the impact of policy and institutional environment (Boschma and Martin, 2007; Okafor et al., 2022), social capital and human capital (Adger, 2003; Di Caro, 2017; Sabatino, 2019; Wang et al., 2023c), industrial structure (Holm and Østergaard, 2013; Lagravinese, 2015; Brown and Greenbaum, 2017; Ray et al., 2017), innovation capacity (Bristow and Healy, 2018; Wang and Wei, 2021), location advantages (Angulo et al., 2018), cultural environment (Huggins and Thompson, 2015) and other factors on economic resilience. Angulo et al. (2018) looked at the factors influencing economic resilience in Spain and found that location advantages helped mitigate the negative effects of the crisis and that provinces with location advantages possessed higher economic resilience. Kitsos and Bishop (2018) discovered that regions with good initial economic conditions, industrial diversification, and a strong spirit of innovation were more resilient. Ray et al. (2017) detected that industrial structure was a crucial factor affecting the regional resilience of an economy in the face of shocks by studying the Canadian economic resilience. Bristow and Healy (2018) examined the influence of innovation performance on the economic resilience of EU countries, and found that regions with high innovation capacity had stronger economic resilience and thus could recover from economic crises faster. In addition, some scholars have also looked at the drivers of spatial divergence in economic resilience. For instance, Di Caro (2017) found that regional variations in economic resilience in Italy were mainly result from differences in economic diversity, trade openness, financial constraints, human capital and social capital.
Existing studies have laid a preliminary foundation for this paper, but there are still some drawbacks. First, in terms of the spatial divergence in China’s economic resilience, previous studies just only studied the three major regions of east, central and west China, but lacked attention to the spatial divergence in economic resilience in the two major regions of south and north. In recent years, China’s regional economy has emerged a new trend of economic growth rate “fast in the south and slow in the north” and economic proportion “rising in the south and falling in the north,” and this difference between the north and the south is still expanding, which could inevitably affect the development of economic resilience in the south and the north. Hence, it is necessary to study the spatial and temporal differences of economic resilience in the south and the north. Second, although some studies have confirmed the existence of obvious differences in economic resilience, they did not reveal the sources of spatial variation in economic resilience, nor have they conducted an in-depth analysis of the dynamic evolutionary trends of economic resilience. A comprehensive grasp of the sources of variation in urban economic resilience and its evolutionary trends is essential for developing of targeted strategies to enhance it. Third, most studies still focus on the impact on economic resilience itself. In contrast, studies on economic resilience area do not conduct an in-depth investigation of the spatially divergent drivers of economic resilience, which is critical to the development of differentiated economic resilience enhancement measures. Based on this, the marginal contribution of this paper is to expand the existing economic resilience research in terms of regions and methodology. In respect of the regions, 282 cities are horizontally divided into three major regions: east, central and west, and then vertically divided into two major regions: south and north2, to analyze the spatial and temporal divergence characteristics of their economic resilience and the driving factors respectively. As for the methodology, the two-stage nested Thiel index with cities as the basic spatial units is adopted to measure the spatial variation in economic resilience of 282 cities in China, and to decompose the sources of spatial variation in urban economic resilience. Then, we employ the spatial kernel density estimation to explore the dynamic evolutionary characteristics of the distribution of economic resilience in Chinese cities. Finally, with the advantages of the geographic detector method, we aim to empirically investigate the drivers of spatial divergence of economic resilience in Chinese cities.
The remaining of this paper is organized as follows. The next section introduces the index system and methods. Section 3 provides spatial and temporal distribution pattern, dynamic evolution and spatiotemporal differentiation driving factors of economic resilience in Chinese cities. Section 4 presents a brief discussion to analyze the differences from previous research conclusions. The last section concludes and proposes policy implications, and points out the limitations of this study.
2 Methodology
2.1 Economic resilience evaluation index system
Economic resilience mainly refers to an economic entity’s ability to recover, adjust and create new growth paths after an external shock. In this paper, with reference to previous studies (Graziano and Rizzi, 2016; Wu et al., 2020; Shi et al., 2022a; Shi et al., 2022b), we construct a system of urban economic resilience indicators in three dimensions: resistance and recovery capacity, adaptation and adjustment capacity, and innovation and transformation capacity, as shown in Table 1. Specifically, the resistance and recovery capacity consist of GDP per capita, savings and deposits of urban residents per capita, the percentage of urban registered unemployed, HHI Index (Herfindahl-Hirschman Index) and foreign trade dependence. They reflect the level of economic development, risk resistance of residents, risk resistance of enterprises, industrial structure diversification and foreign trade dependence of cities, respectively. Among them, the percentage of the unemployed population, HHI Index and foreign trade dependence are negative indicators. HHI Index is expressed as the sum of the squares of the percentages of the three industries. Foreign trade dependence is measured by the proportion of total imports and exports to GDP. Due to the different units, the total imports and exports indicators in United States dollars are converted into RMB at the average annual exchange rate. The adaptation and adjustment capacity are composed of per capita fiscal expenditure, fiscal self-sufficiency level, fixed asset investment as a share of GDP and per capita retail sales of social consumer goods. They are positive indicators which reflect the government’s ability to deploy resources, the strength of policy support, urban investment scale and market size separately. Among them, the level of fiscal self-sufficiency is evaluated by the ratio of fiscal revenue to fiscal expenditure. The innovation and transformation capacity is made up of the proportion of education expenses to fiscal expenditures, advanced industrialization, the number of patents granted per 10,000 people and the proportion of science and technology expenditures to fiscal expenditures. They demonstrate the level of government investment in education, the degree of industrial structure optimization, the capacity of technological innovation and the strength of investment in scientific research, respectively. The specific contents of the indicators are shown in Table 1.
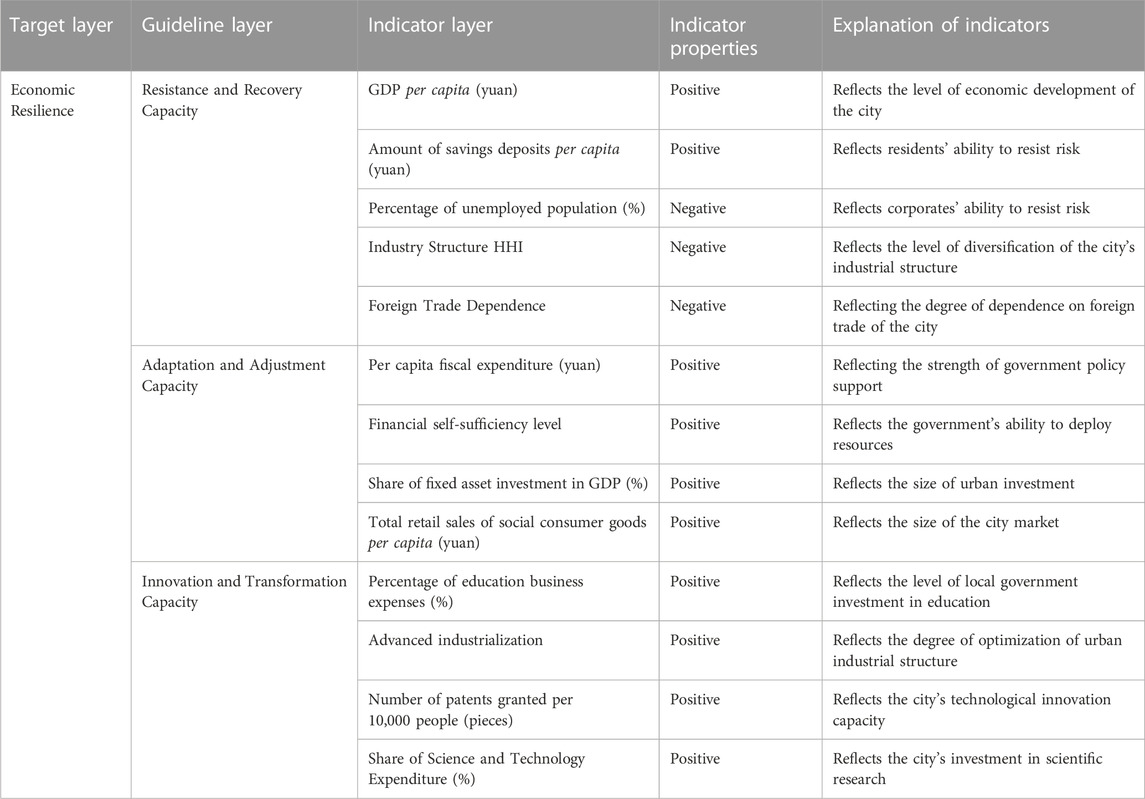
TABLE 1. Comprehensive evaluation index system of economic resilience.
2.2 Methods
2.2.1 Entropy value method
The entropy value method is an objective weighting method, which objectively determines the weight of each indicator based on the specific information that decided by the relative change of the indicator data. The fiercer the relative variation of the indicator data, the greater the utility value of the indicator information, the stronger its importance in the evaluation, as well as the greater its weight, and vice versa, the smaller the weight (Zhou et al., 2017; Wang et al., 2022c). Compared with the subjective weighting method, the entropy value method can avoid the problem of weight bias caused by human interference (Wang et al., 2018; Ding et al., 2019; Chen et al., 2021). Thus, this paper uses the entropy value method to measure the economic resilience of 282 cities in China from 2005 to 2019. The initial data are processed by the extreme deviation standardization method because of the different dimension of each indicator. The specific calculation formulas of the entropy value method are as follows.
Equations 1, 2 are used to standardize the original data in positive and negative indicators to obtain the standardized data
2.2.2 Two-stage nested Thiel index
The two-stage nested Thiel index is constructed by combining the Thiel index method (Shorrocks, 1980; Akita, 2003) and takes cities as the basic spatial units. This method can decompose the overall differences into inter-regional, inter-provincial and intra-provincial levels based on the three-level structural scale of “region-province-city.” For the two-stage decomposition of the Thiel index, it is necessary to analyze the differences between cities within provinces, but the four municipalities directly under the central government are unable to be decomposed due to the lack of prefecture-level administrative units. Therefore, this paper includes Beijing and Tianjin into Hebei province, Shanghai into Jiangsu province, and Chongqing into Sichuan province for empirical analysis. The source of overall spatial variation in the economic resilience of Chinese cities resolves into three components of intra-provincial, inter-provincial and inter-regional variation through decomposition as the following equation.
where
2.2.3 Spatial kernel density estimation
Kernel density is a non-parametric estimation method that uses continuous density function curves to describe the distribution pattern of random variables (Lv et al., 2021). The spatial kernel density estimation method is based on the traditional kernel density estimation method by adding time and space factors to estimate the probability density of random variables. It can reflect the distributional dynamics of economic resilience in Chinese cities under spatial conditions in a more comprehensive and objective way. Hence, exploiting spatial kernel density can effectively demonstrate the dynamic evolution of the distribution of economic resilience in Chinese cities (Quah, 1997). The specific formulas are as follows:
Equations 9, 10 are the traditional kernel density estimation formulas.
2.2.4 Geographic detector
Geographic detector is a statistical method to distinguish spatial divergence and reveal the driving factors behind it (Wang et al., 2010) and then widely used in economic and social fields (Ju et al., 2016; Yang et al., 2016; Hou et al., 2022; Liu et al., 2022; Meng et al., 2022; Quan et al., 2022; Wang et al., 2022a; Zhang et al., 2022), Compared with traditional statistical methods, geographic detector have the advantage of being immune to covariates between independent variables (Ding et al., 2019). It is possible to analyze not only the magnitude of the driving effects of the factors, but also the interactions between them (Feng et al., 2020). As a result, this paper examines the drivers of spatial divergence of economic resilience in Chinese cities and the interactions among the drivers by using factor detection and interaction detection in geographic detector.
Factor detection is employed to probe the extent to which factors explain the spatial divergence of the dependent variable by introducing a deterministic force indicator
where
Interaction detection is performed by comparing the single factor
2.3 Study area and data source
To accurately grasp the economic resilience of Chinese cities, this paper studies 282 prefecture-level cities in China as shown in Figure 1, and focusing on the period of 2005–2019. According to the 2006 China City Statistical Yearbook, there were 287 cities at the prefecture level and above in 2005. Based on the principle of comparability and consistency, only cities that co-existed between 2005 and 2019 are considered in this paper, and new prefecture-level cities established after 2005 and those abolished before 2019 are not considered. Thus 287 cities at the prefecture level and above in 2005 are taken as the basis. The cities of Chaohu in Anhui Province and Laiwu in Shandong Province, which were abolished in August 2011 and January 2019, are removed. In addition, the cities of Lhasa in Tibet and Guyuan and Zhongwei in Ningxia were excluded due to a large number of missing data, and a final panel of 282 cities was retained as the study sample. The data used are mainly from the 2006–2020 China City Statistical Yearbook, provincial statistical yearbooks and statistical yearbooks of prefecture-level cities. To make the indicators comparable, all indicators are used proportional data, and some missing values were made up by the interpolation method.
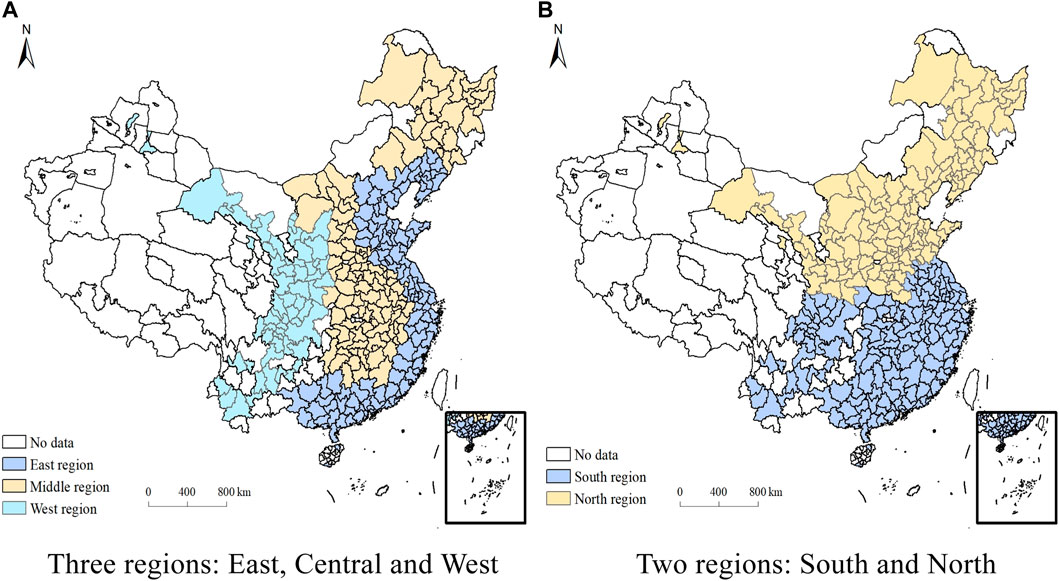
FIGURE 1. Study area of this paper. (A) Three regions: East, Central, and West. (B) Two regions: South and North.
3 Results
3.1 Spatial and temporal distribution pattern of economic resilience
3.1.1 The temporal evolution characteristics
The temporal evolution characteristics of economic resilience of Chinese cities are shown in Figure 2. As can be seen in Figure 2, urban economic resilience is on an upward trend in all regions of China. In terms of the east, central and west regions, the eastern region has the highest urban economic resilience, followed by the central region and the western region has the lowest urban economic resilience. In terms of growth rate, the growth rates of urban economic resilience in central region and west region were faster among the three major regions of east, central and west China and higher than the overall national economic resilience growth rate, and their average economic resilience values increased from 0.070 and 0.068 in 2005 to 0.140 and 0.129 in 2019, with an average annual increase of 5.1% and 4.7%, respectively. The growth rate of urban economic resilience in east region was lower than the overall national growth rate, that was the slowest growth rate among the three regions, with its average economic resilience value rising from 0.116 in 2005 to 0.211 in 2019, and its average annual growth rate of only 4.3%. This reflects a gap between the urban economic resilience of the central and western regions compared to the eastern region, but there is a trend towards convergence between the three regions. The possible reason is that the eastern region has benefited from the reform and opening-up policy and its economy has improved greatly. The total GDP remained above 50% since 2005, despite a decline in 2008 when it was hit by the financial crisis. In addition, the eastern region has continuously adjusted its industrial structure and transformed its mode of economic development, with the share of tertiary industries gradually increasing from 40.8% in 2005 to 56.6% in 2019, which has strongly supported the strong economic resilience of the eastern region. With the Western Development Strategy and the Central China Rise Strategy, the economic growth rate of the central and western regions has increased significantly, infrastructure construction has been perfected, and technological innovation capacity has been continuously improved, thus promoting the acceleration of the economic resilience of the central and western regions.
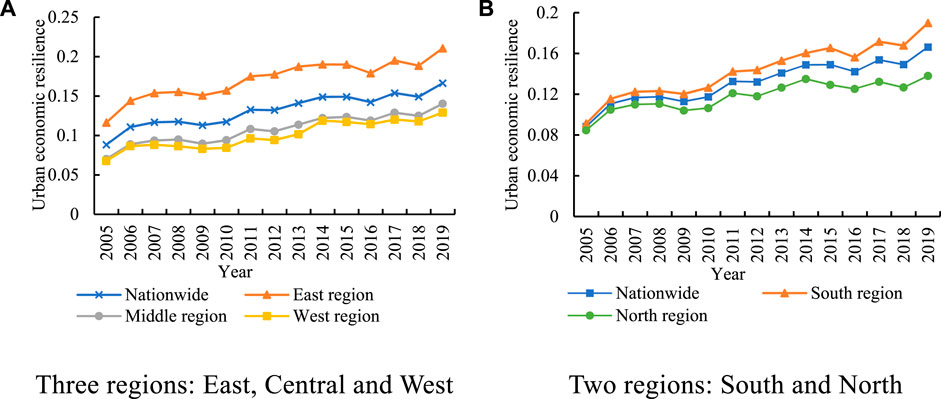
FIGURE 2. Temporal distribution characteristics of economic resilience. (A) Three regions: East, Central, and West. (B) Two regions: South and North.
In terms of the North and South regions, from another perspective, the economic resilience growth rate of cities in the south grew faster between the two regions of the south and north. It was higher than the overall economic resilience growth rate of the country, with the average value of economic resilience rising from 0.091 in 2005 to 0.190 in 2019, an average annual increase of 5.4%. In comparison, the economic resilience growth rate of cities in the north lowered than the overall growth rate of the country, with a slower growth rate of economic resilience whose average value rose from 0.085 in 2005 to 0.138 in 2019, with an annual average of 3.6%. With regard to spatial distribution, on the basis of the three major regions of east, central and west in China, the economic resilience of cities in the eastern region was higher, and its average economic resilience was higher than the overall national average. In contrast, the economic resilience of cities in the central and western regions was much lower than the overall national average, and the economic resilience of cities in the western region was the lowest, demonstrating a spatial distribution pattern of high in the east and low in the west. By the two regions of the south and north, the economic resilience of cities in the south was higher than the overall national average. Yet the economic resilience of cities in the north was lower than the overall national average, showing a spatial distribution pattern of strong in the south and weak in the north.
In the light of the spatial and temporal distribution of urban economic resilience, among the three regions of east, central and west China, the urban economic resilience of the central and western regions has a large gap compared with that of the eastern region. In recent years, the growth rates of urban economic resilience in the central and western regions are higher than that of the eastern region, and the urban economic resilience among the three regions has a convergence trend. The possible reason is that the urban economic resilience of the eastern region is the highest due to its obvious location advantage, open external environment and strong technical support. While with the implementation of the strategy of rising in the central region and the strategy of western development, the internal infrastructure construction of the central and western regions is improving, the industrial structure is continuously optimized and the innovation capacity is visibly promoted, which makes the urban economic resilience of the central and western regions improved significantly faster than that of the eastern region. Between the two regions of the south and north, the urban economic resilience of the southern region is not only higher than that of the northern region, but also faster than that of the northern region in terms of growth rate, so the distinction between the urban economic resilience of the two regions is gradually expanding. The possible reason is that there is a disparity between the northern region and the southern region as for industrial structure, openness to the outside world, talent innovation and urban governance, causing the urban economic resilience of the northern region performs worse than that of the southern region. Moreover, the industrial structure of the resource-based heavy industry in the north makes its pace of industrial transformation and upgrading slower, coupled with the decline in investment growth in recent years has also rendered a more significant impact on the economic development of the north, thus leading to the gradual widening of the gap between the urban economic resilience of the two regions in the north and the south.
3.1.2 Spatial distribution characteristics
In order to reflect the spatial distribution of China’s urban economic resilience, this paper visualizes the spatial development of China’s urban economic resilience in 2005 and 2019 in the form of a map using ArcGIS software, as shown in Figure 3. The spatial distribution of economic resilience in Chinese cities shows the following main characteristics. Firstly, few Chinese cities had high economic resilience in 2005, and the overall economic resilience of Chinese cities has improved significantly by 2019. Secondly, agglomeration distribution. Although the economic resilience of Chinese cities has increased rapidly over the sample period, the cities with higher economic resilience are still mainly concentrated in the Pearl River Delta and Yangtze River Delta regions. It indicates that there is a strong spatial clustering of economic resilience in Chinese cities. Thirdly, the situation of “East is strong and West is weak” and “South is strong and North is weak” coexist. Among the top five cities in terms of economic resilience in 2005, Shenzhen, Foshan, Beijing, Shanghai and Guangzhou are all located in the eastern region, which is much higher than the economic resilience of cities in the central and western regions. Although the economic resilience of Chinese cities has improved significantly in 2019, the cities with higher economic resilience are still mainly concentrated in the eastern region; as for the regions of the south and the north, the difference in the distribution of urban economic resilience in the north-south direction in 2005 is not yet obvious, and the cities with higher economic resilience are distributed in the north-south direction, with comparable urban economic resilience between the southern and northern regions. By 2019, however, the number of cities with high economic resilience in the South is significantly higher than in the North, and the gap between the economic resilience of cities in the South and North is gradually widening.
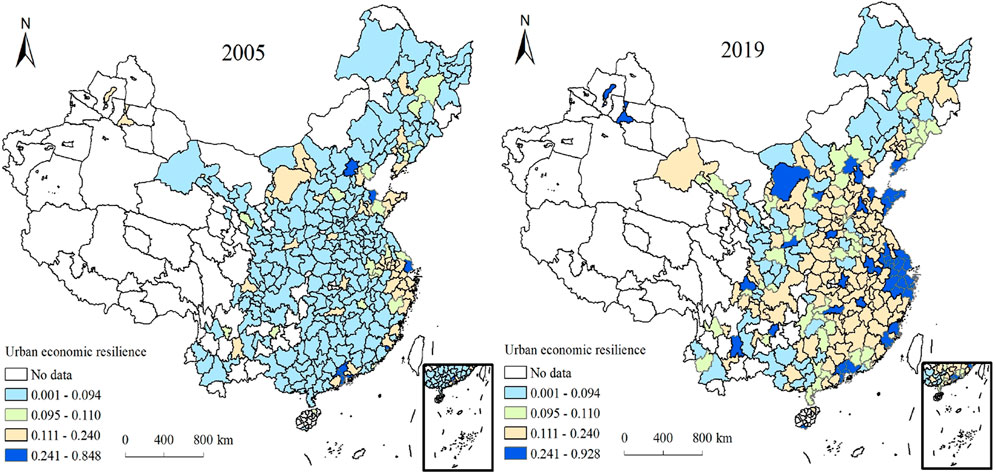
FIGURE 3. Spatial distribution characteristics of urban economic resilience.
3.2 Spatial variation in the characteristics of economic resilience
3.2.1 Overall spatial variation in the economic resilience
Figure 4 shows the overall spatial variation in the economic resilience of Chinese cities. Regarding the horizontal value, the mean value of the overall difference of economic resilience in Chinese cities during the sample examination period was 0.144, with significant spatial differences. From the change trend, the overall difference of economic resilience of Chinese cities appears a small increase in multi-frequency fluctuations. More precisely, the overall variance of economic resilience in Chinese cities demonstrated a rapid increase and reached its maximum value until 2009. It dropped sharply in 2011, with an average annual decrease of 11.6%. The overall variance value of economic resilience in Chinese cities rose again to 0.160 in 2013, then fell to a minimum value of 0.128 over the sample period in 2014, after which the overall variance rose again, to 0.148 in 2019. Compared with 2005, the overall spatial variance of economic resilience of Chinese cities was on the rise, with an average annual increase of 0.1%, but with large fluctuations.
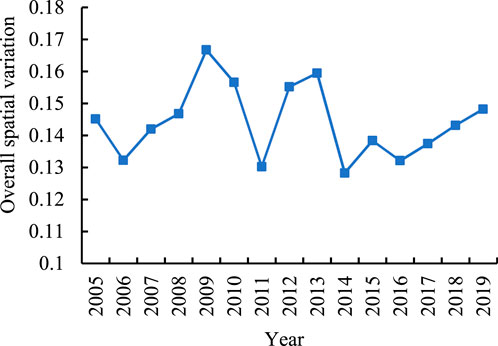
FIGURE 4. Overall variation in economic resilience of Chinese cities.
3.2.2 Intra-provincial differences in economic resilience
The intra-provincial differences reflect the differences in economic resilience among cities within different provinces, as shown in Table 2. Guangdong, Hebei, Jiangsu, Inner Mongolia and Anhui possess the top five intra-provincial differences in urban economic resilience nationwide, and Guangdong province has the largest intra-provincial difference in urban economic resilience, significantly higher than other provinces, with a mean difference of 0.333, which is 2.36 times higher than the intra-provincial difference in Hebei that ranks second. As for evolutionary trends, among the top five provinces, the intra-provincial variance of Inner Mongolia and Anhui presents an upward trend with an average annual growth rate of 5.7% and 2.7%, respectively. The intra-provincial variance of Guangdong, Hebei and Jiangsu Province severally shows a downward trend with an average annual decrease of 0.9%, 0.1%, and 2.9%. At the same time, the average value of urban economic resilience of the above five provinces are among the top ten in China, which points out that at this stage, the provinces with large intra-provincial differences in China’s urban economic resilience are mainly the provinces with high urban economic resilience. Thus, how to play the role of radiation driven by cities with high economic resilience to other cities in the province is the key issue that needs to be solved in the process of improving current urban economic resilience.
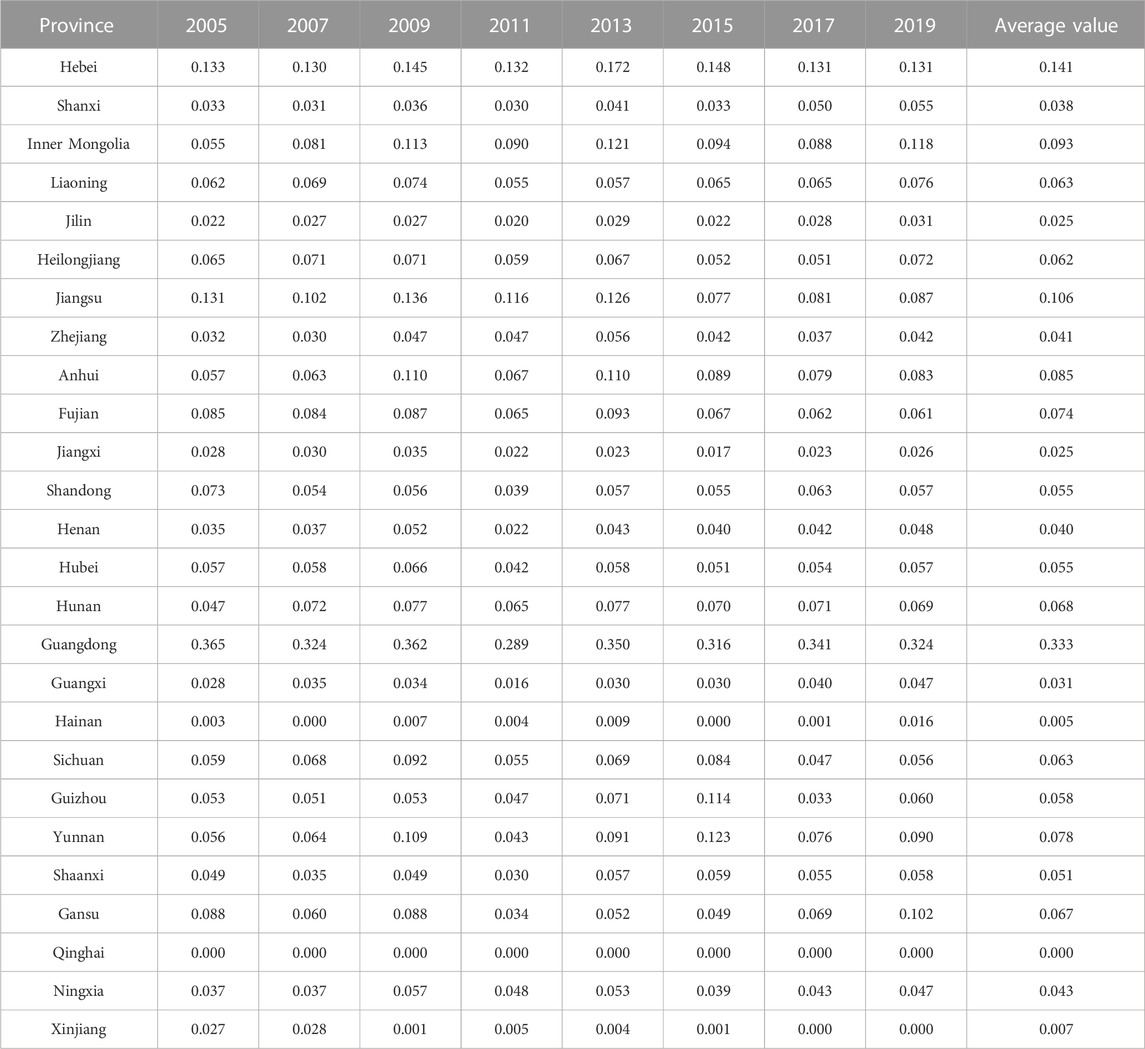
TABLE 2. Intra-provincial differences in economic resilience of Chinese cities.
3.2.3 Inter-provincial differences in economic resilience
The inter-provincial differences reflect the differences in urban economic resilience among the provinces in the region. As shown in Table 3, among the three major regions of east, central and west China, the largest inter-provincial differences are in the eastern region, followed by the western and central regions with the mean values of the differences of 0.058, 0.022, and 0.011, respectively. Drawing from evolutionary trends, the inter-provincial differences in the eastern and central regions were upward, with an average annual increase of 2.0% and 8.0%, respectively. The inter-provincial differences in the western region showed a decreasing trend, with an average annual decrease of 4.2%. Within the two major regions, the inter-provincial variation of urban economic resilience in the southern region is larger than that in the northern region with the average values of variation being 0.086 and 0.025, respectively. From an evolutionary trend point of view, the inter-provincial variation in the southern region emerged a declining trend with an average annual decrease of 2.1%. The inter-provincial variation in the northern region showed an upward trend at an average annual growth rate of 0.4%. These results indicate that in the process of improving urban economic resilience, we are supposed to focus on narrowing the inter-provincial differences in the eastern and southern regions, where urban economic resilience is relatively high for the sake of achieving a balanced development of urban economic resilience nationwide.
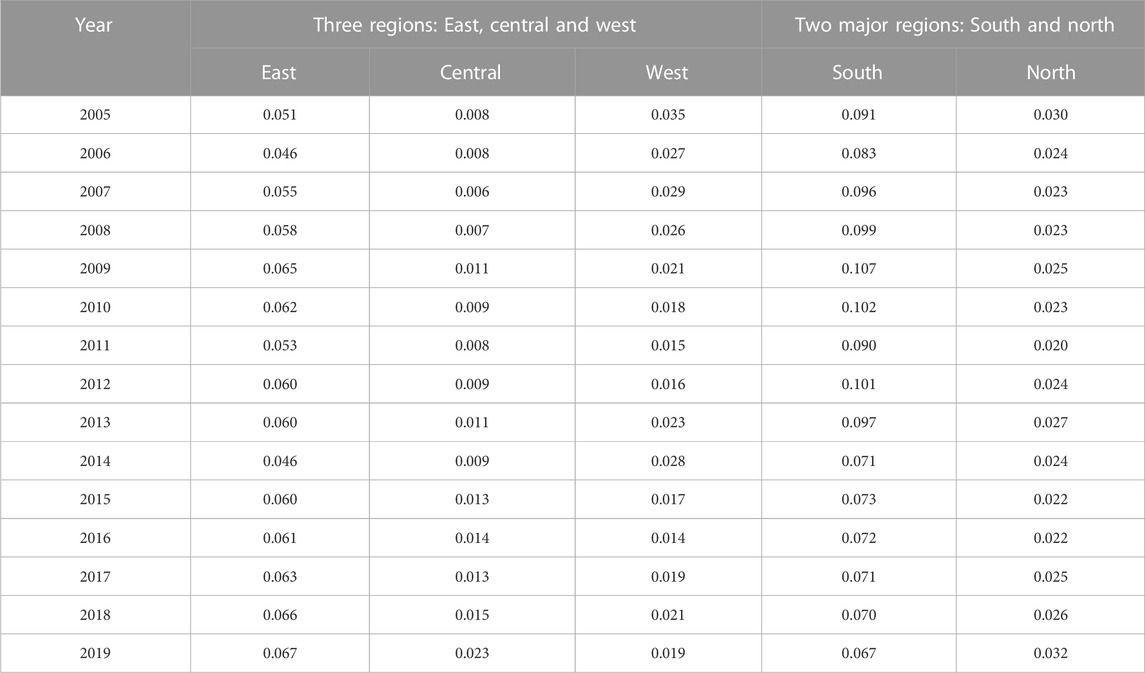
TABLE 3. Inter-provincial differences in economic resilience of Chinese cities.
3.2.4 Sources of spatial variation in the economic resilience
The two-stage nested Thiel index can decompose the overall variation of China’s urban economic resilience into intra-provincial variation, inter-provincial variation and inter-regional variation. As shown in Figures 5A, B, the intra-provincial variation of the China’s urban economic resilience is a main source of overall variation, both in the three regions of east, central and west China and the two regions of south and north. In terms of the change trend, the intra-provincial variation contribution rate evolved in a decreasing and then increasing trend during the examination period, and the intra-provincial variation contribution showed a fluctuating decreasing trend from 2005 to 2011, then presented a gradual increasing trend after 2011, and the variation contribution rate reached 57.1% in 2019. In comparison with 2005, the intra-provincial variation contribution of economic resilience of Chinese cities tends to rise amidst fluctuations. The inter-provincial variation contribution and inter-regional variation contribution are different in the three major regions of east, central and west China and the two major regions of south and north. As shown in Figure 5A, within the three major regions of east, central and west China, the mean values of inter-provincial and inter-regional variation contributions to China’s urban economic resilience are 22.5% and 21.1%, respectively. Inter-regional variation contributions to the overall variation were larger than inter-provincial variation contributions before 2014. In contrast, inter-provincial variation contributions have surpassed inter-regional variation contributions as the second largest source of the overall variation in China’s urban economic resilience since 2014. From an evolutionary trend point of view, the inter-provincial variation contribution showed an upward trend during the period under examination, with an average annual increase of 1.7%. While the inter-regional variation contribution showed an upward and then downward trend, with its variation contribution rate showing an upward trend before 2011, with an average annual increase of 2.3%, and then a decreasing trend after that, falling to 16.0% in 2019 with an average annual decrease of 6.0%. As shown in Figure 5B, within the two major regions of the south and north, the mean values of the contribution of inter-provincial and inter-regional variation in China’s urban economic resilience are 40.3% and 3.3% with the contribution of inter-provincial variation consistently greater than that of inter-regional variation, and second only to the contribution of intra-provincial variation to overall variation. In terms of change trends, the inter-provincial variance contribution showed a slow decreasing trend, with an average annual decrease of 1.7%. While the inter-regional variation contribution presented a rapidly increasing trend, with an average annual increase of 22.8%. The comprehensive analysis above shows that whether it is the horizontal east, central and west three regions or the vertical south and north two regions, the spatial divergence in China’s urban economic resilience during the examination period is mainly derived from intra-provincial variation, while the contribution of inter-provincial and inter-regional variation is smaller.
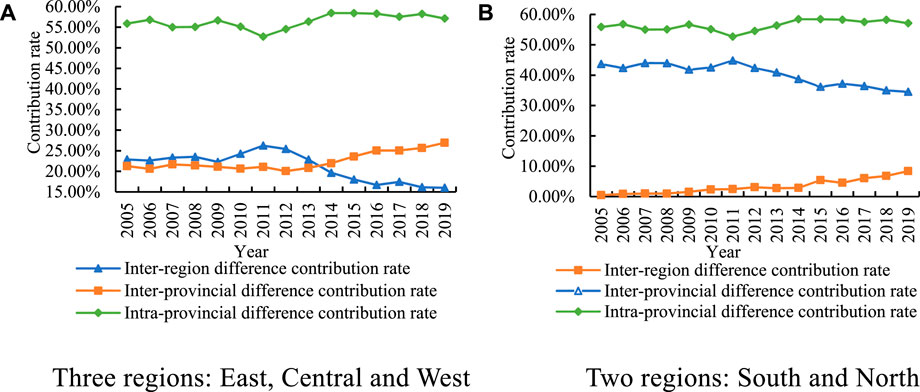
FIGURE 5. Contribution of overall variation in economic resilience of Chinese cities. (A) Three regions: East, Central, and West. (B) Two regions: South and North.
3.3 Dynamic evolution of economic resilience
In this section, we examine the impact of temporal and spatial factors on the trend of the evolution of economic resilience of Chinese cities from
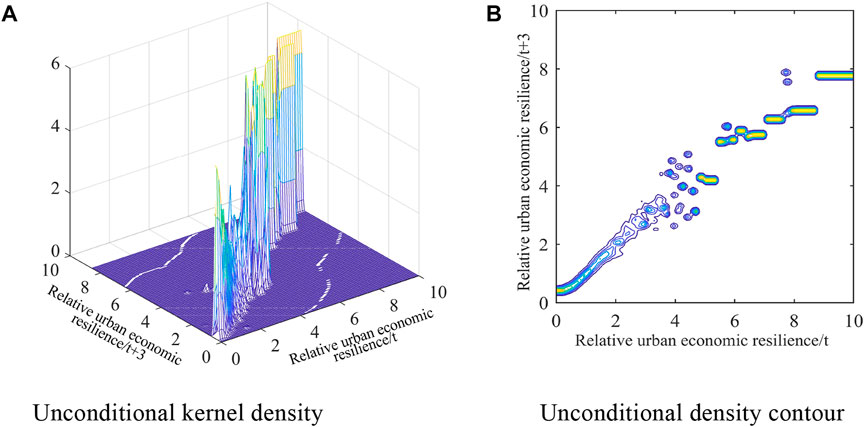
FIGURE 6. Unconditional kernel density of economic resilience in Chinese cities. (A) Unconditional kernel density. (B) Unconditional density contour.
The spatial kernel density is divided into static and dynamic. From the spatial kernel density estimation results in Figures 7A, B, when the relative economic resilience of neighboring cities is lower than 4.5, there is an obvious positive spatial correlation between the economic resilience of cities, namely, the phenomenon of low-low agglomeration and high-high agglomeration. When the relative economic resilience of neighboring cities is higher than 4.5, at this time, the correlation between city resilience gradually weakens, which indicates that when the economic resilience of cities is raised to a certain level, it does not help transfer their economic resilience upward even if they are neighbors of cities with high economic resilience. From Figures 7C, D, it is found that the economic resilience of Chinese cities shows similar evolutionary trends under spatial static and dynamic conditions. And the temporal conditions do not play a significant role in driving the upward shift of economic resilience in neighboring cities affecting them.
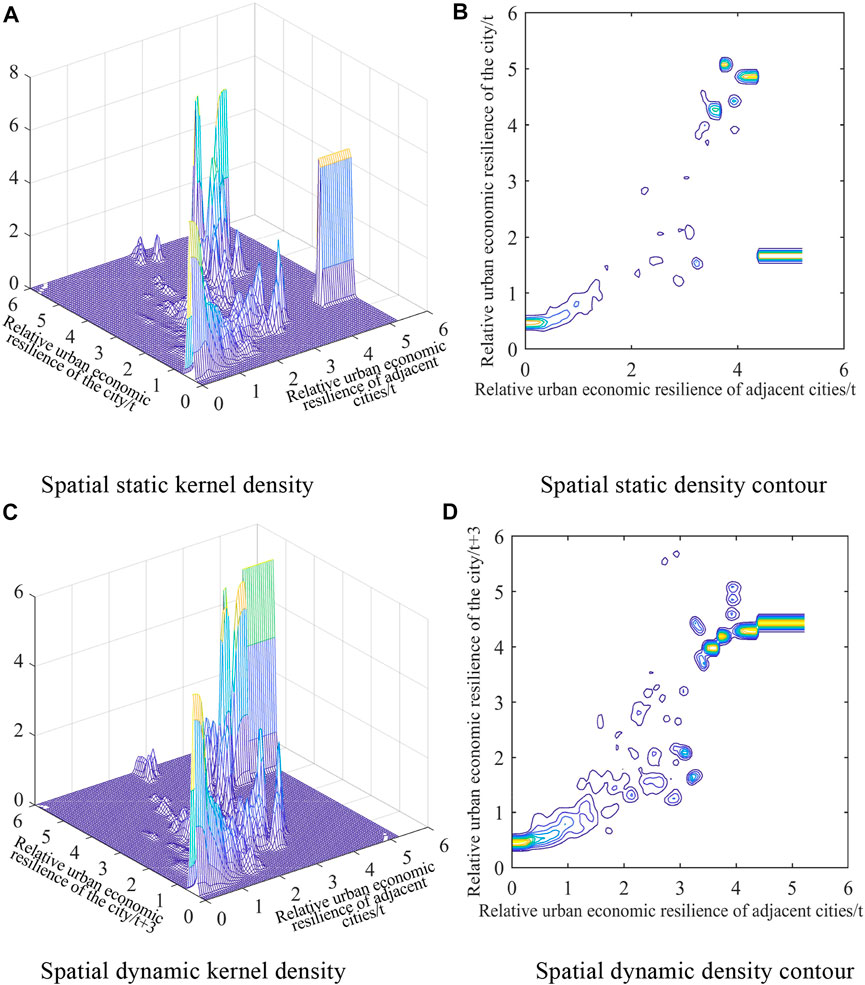
FIGURE 7. Spatial kernel density of economic resilience in Chinese cities. (A) Spatial static kernel density. (B) Spatial static density contour. (C) Spatial dynamic kernel density. (D) Spatial dynamic density contour.
3.4 Drivers of spatial and temporal divergence of economic resilience
In order to explore the driving factors, this paper takes urban economic resilience in China as the dependent variable. Also, we take GDP per capita (
3.4.1 Single factor analysis
As can be seen from Table 4, the explanatory power of each factor in descending order on the whole is: number of patents granted per 10,000 people (0.819) > total retail sales of consumer goods per capita (0.785) > GDP per capita (0.715) > amount of savings deposits per capita (0.678) > share of science expenditure in fiscal expenditure (0.650) > fiscal self-sufficiency level (0.648) > foreign trade dependence (0.553) > fiscal expenditure per capita (0.542) > HHI Index (0.473) > advanced industrialization (0.370) > registered urban unemployment population (0.100) > fixed asset investment as a share of GDP (0.088) > education expenditure as a share of fiscal expenditure (0.022). The top three factors in terms of explanatory power are the number of patents granted per 10,000 people, total retail sales of consumer goods per capita and GDP per capita, and their

TABLE 4. Drivers of spatial divergence of economic resilience in Chinese cities.
The dominant factors leading to differences in urban economic resilience vary in regions. Within the three major regions of east, central and west China, the number of patents granted per 10,000 people, total retail sales of consumer goods per capita and amount of savings deposits per capita are the most driving factors for the eastern region. As for the central region, the level of fiscal self-sufficiency, GDP per capita and the number of patents granted per 10,000 people are the main driving factors. In terms of the western region, the top three driving factors are the amount of savings deposits per capita, the number of patents granted per 10,000 people and fiscal self-sufficiency level. The effects of fixed asset investment as a share of GDP and education expenditure as a share of fiscal expenditure on the spatial divergence of urban economic resilience in the three regions of east, central and west are low. Within the two regions of the south and the north, the factors that drive the spatial divergence of urban economic resilience in the south are the number of patents granted per 10,000 people, total retail sales of consumer goods per capita and amount of savings deposits per capita. While in the north, the factors that drive with high effect are the number of patents granted per 10,000 people, GDP per capita, and fiscal self-sufficiency level. Similarly, the drivers of fixed asset investment as a share of GDP and education expenses as a share of fiscal expenditure are weaker. Whether in the three regions of the east, central and west or the two regions of the south and north, the differences in technological innovation capacity are the key drivers of the spatial divergence of urban economic resilience. Therefore, each region should concentrate on the differences in technological innovation capacity in the process of enhancing urban economic resilience, so as to promote the synergistic development of urban economic resilience.
3.4.2 Analysis of the interaction between factors
After exploring the influence of single factors on the spatial divergence of urban economic resilience in China, this paper further uses the interaction detection function of the geographic detector to quantitatively analyze the superposition effect of the drivers of spatial divergence of urban economic resilience, probe into the interactions among the drivers and identify their interaction types. Table 5 reports the top ten ranking of the interaction detection results of the overall and sub-regional drivers of urban economic resilience in China. The interaction of any two drivers enhances the explanatory power of a single factor for the spatial divergence of urban economic resilience both for cities overall and for sub-regions, namely, the spatial divergence of urban economic resilience in China is the result of multiple factors acting together. Also, among the top ten interactions for cities in general and for sub-regions, the interaction between the number of patent grants per 10,000 people and other factors accounts for the largest share, and the minimum value of the interaction is greater than 0.87, which further indicates that for cities in general and for sub-regions, differences in technological innovation capacity are the key drivers of spatial divergence in urban economic resilience.
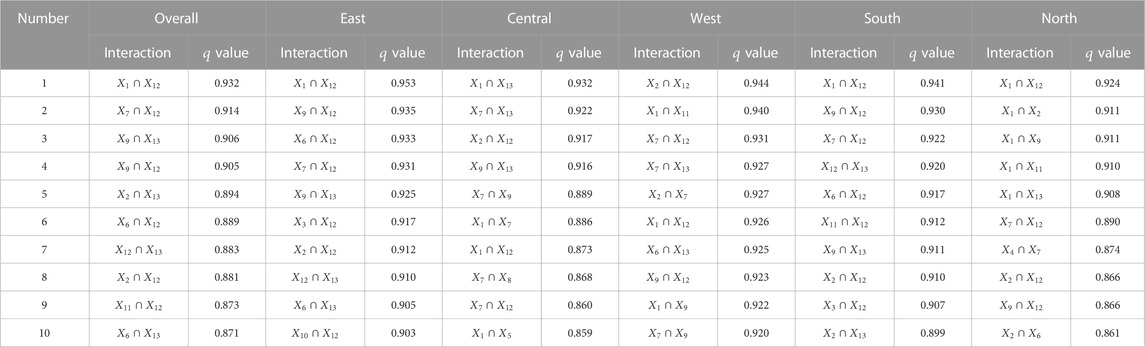
TABLE 5. Interaction between drivers.
4 Discussion
Economic resilience is an indispensable driver for quality and sustainable economic development, and building “resilient cities” has become an essential issue for academics and governments. Therefore, this paper examines the differences in their spatial and temporal distribution, sources, the drivers of their spatial and temporal divergence, based on a measure of economic resilience of 282 cities in China. By comparing and discussing the differences between the findings of this paper and previous studies, we can help each region to analyze its strengths and weaknesses, and formulate strategies to improve economic resilience in line with the actual situation of the region based on historical experience, so as to promote the cross-regional synergy in improving the economic resilience of Chinese cities. The differences between the findings of this paper and previous studies are mainly in terms of spatial and temporal differences and driving factors.
This study found that the overall economic resilience of Chinese cities improved significantly, with the highest urban economic resilience in the central-eastern region, followed by the central region, and the lowest urban economic resilience in the western region in terms of the spatial and temporal differences in the economic resilience. It is consistent with the findings of Guan and Zhang (2022). However, Wang et al. (2022c) found that the economic resilience of Chinese cities generally declined, and Cheng et al. (2022) found that the economic resilience at the regional level showed a distribution of high in the west and low in the east, which is different from the findings of this study. The reason is that both Wang et al. (2022a) and Cheng et al. (2022) studied the performance of urban economic resilience during the New Crown epidemic, which is completely different from the study interval of this paper. The New Crown epidemic, as a major global public health emergency, had a huge impact on the economic growth rate of various countries, and even though China adopted timely coping strategies, it was still difficult to get rid of its impact in a short period, resulting in the decline of urban economic resilience.
For the driving factors of spatial-temporal differentiation of economic resilience in Chinese cities, this study finds that the differences in urban technological innovation capacity, differences in residents’ risk resistance capacity, and differences in economic development level have a greater driving effect on the spatial differentiation of economic resilience in Chinese cities, and differences in technological innovation capacity is the key driving factor. This is similar to the studies of Bristow and Healy (2018) and Hu et al. (2022). However, Hu et al. (2022) found that cities with higher GDP per capita, the higher economic level of the city, the more severely affected by the crisis, unlike this paper which uses GDP per capita as a positive measure of economic resilience of cities. The reason is that Hu et al. (2022) conducted only in the first quarter of 2020 during the COVID-19, and the higher the economic level of the city, the higher the concentration of the population and the faster the epidemic spreads, leading to a lower level of economic resilience. In addition, Ženka et al. (2021) used the HHI index to measure the industrial structure, and further divided into the impact of relevant diversification and irrelevant diversification on economic resilience, and found that the economic resilience of regions with tertiary sector and diversified industrial enterprise scale structure is higher than those with a higher share of agriculture and manufacturing industry. This paper focuses on the impact of regional industrial structure differences on urban economic resilience differences. They showed that although industrial structure differences are not the main driving factors of spatial-temporal differentiation of urban economic resilience in China, they have an important impact on all regions, and there are differences in the driving effect of urban economic resilience differences among regions. For the three regions of east, west and central China, the strongest driving effect is on the spatial differences of urban economic resilience in the western region, and the driving effect on the differences of urban economic resilience between the two regions of the south and north is comparable.
5 Conclusion and policy implications
This paper constructs a comprehensive evaluation index system of China’s urban economic resilience in three dimensions: resistance and recovery capacity, adaptation and adjustment capacity, and innovation and transformation capacity. The entropy value method is used to measure the economic resilience of 282 cities in China from 2005 to 2019, so as to analyze the spatial distribution characteristics from the horizontal three major regions of the east, central and west and the vertical two regions of the south and north respectively. Next, we exploit the two-stage nested Thiel index method to reveal the spatial variation of economic resilience in Chinese cities and its sources. We also use spatial kernel density estimation method to investigate the dynamic evolution trend of economic resilience in Chinese cities. At last, we analyze the driving factors of the spatial divergence of economic resilience in Chinese cities by the geographic detector method. The main conclusions obtained from this paper are as follows.
First, in terms of the overall spatial distribution pattern, the overall economic resilience of Chinese cities improves significantly from 2005 to 2019, gradually spreading from point to surface, but still has obvious spatial clustering distribution characteristics, and cities with high economic resilience are mainly clustered in the Pearl River Delta and the Yangtze River Delta region. From the regional distribution pattern point of view, the urban economic resilience of the eastern region is higher than that of the central and western regions, but its growth rate is slow. With the Western Development Strategy and the Central China Rise Strategy, the central and western regions have a faster growth rate of urban economic resilience, which has a “catch-up” effect on the eastern region. China’s urban economic resilience shows a convergence trend in the east, central and west. But the gap in urban economic resilience between the south and the north continues to widen.
Second, the results of the two-stage nested Thiel index suggest that the overall spatial variation of economic resilience in Chinese cities shows a slightly fluctuating increasing trend. Intra-provincial variation is the main source of spatial variation in the economic resilience of Chinese cities, while inter-provincial and inter-regional variation contribute less to the overall variation; in particular, the inter-provincial variation in the eastern region is much larger than that in the central and western region, and the inter-provincial variation in the southern region is larger than that in the northern region.
Third, the kernel density estimation results manifest that the economic resilience of each city has strong persistence without considering spatial factors, but cities with lower urban economic resilience have an upward trend after a certain period, while cities with higher economic resilience may experience a decline. If we take spatial conditions into account, both static and dynamic estimation results show that when the relative economic resilience of neighboring cities is below 4.5, the economic resilience of Chinese cities presents a positive spatial correlation. However, when the relative economic resilience of neighboring cities is higher than 4.5, the increase in economic resilience of neighboring cities does not affect each other. By comparing the static and dynamic estimation results, it is clear that temporal conditions do not play a significant driving role in the upward shift of neighboring cities affecting the economic resilience of the city.
Fourth, the results of the geographic detector indicate that all factors, on the whole, technological innovation capacity, market size, and economic development level are the key drivers of spatial differentiation of economic resilience in Chinese cities. Among the regions, the dominant factors leading to differences in urban economic resilience vary, but differences in technological innovation capacity are the key drivers of spatial divergence in urban economic resilience for all examined regions. In addition, the interaction detection results account for the spatial divergence of urban economic resilience in China is the result of a combination of factors, and there is an enhanced synergy among the drivers, as well as the interaction of any two drivers will enhance their explanatory power for the spatial divergence of urban economic resilience.
Based on the above conclusions, some valuable policy implications for promoting a concerted improvement in the economic resilience of Chinese cities are proposed. First, the actual situation of different regions should be fully considered. The differentiated strategies should be implemented to improve the economic resilience of cities in each region. The formulation of an urban economic resilience improvement strategy cannot be generalized, but needs to adequately take the actual situation of the region into account and implement localized improvement strategies. Specifically, for the three regions of east, central and west China, the eastern region has strong economic resilience but the growth rate has slowed down in recent years, thus it should further accelerate the pace of industrial structure upgrading and make full use of the economic development advantages to achieve rapid improvement of urban economic resilience. The central and western region has weak economic resilience and there is greater room for improvement. So it is supposed to continue to undertake the industrial transfer of the eastern coastal region on the basis of the rise of central and western development strategy to promote the accelerated landing of urban infrastructure and supporting facilities and other investments for the purpose of enhancing the resistance of the regional economy to external shocks. For the two regions in the south and north, the southern region should continue to maintain the rapid growth of urban economic resilience, whereas the northern region should promote the optimization and upgrading of industrial structure while enhancing its technological innovation capacity in order to disperse the risks that may arise from external shocks and expedite the improvement of urban economic resilience.
Second, it is important to accurately grasp the intra-provincial variation in the economic resilience of Chinese cities and motivate the synergistic enhancement of urban economic resilience. Intra-provincial variation is the main source of the overall variation in the economic resilience of Chinese cities. As for provinces such as Guangdong, Hebei and Jiangsu, where there are high differences in intra-provincial urban economic resilience, governments at all levels need to break administrative boundaries, establish a sound mechanism for coordinated development of intra-provincial cities, strengthen the interconnection of cities in the province in terms of capital, technology and labor, promote the adequate flow of various factors of production within the region to achieve the optimal and rational allocation of resources and factors, and create a favorable external environment for reducing the differences in economic resilience among cities in the province. Moreover, the positive correlation between neighboring cities should be fully utilized to enhance the leading role of cities with high economic resilience to cities with low economic resilience, so as to improve the spatial resilience of economic development, drive the resilient development of less resilient cities in the region and narrow the development gap of urban economic resilience.
Finally, we should focus on the dominant factors affecting the spatial divergence of economic resilience in Chinese cities, and help them play a favorable interaction role to enhance urban economic resilience. Differences in technological innovation capacity are the key driving factors of the spatial divergence of economic resilience of cities in China as a whole and in each region. Therefore, cities with stronger technological innovation capacity should accelerate the pace of building international science and technology innovation center cities and strengthen their competitiveness in science and technology innovation. With regard to cities with lower technological innovation capacity not only should increase the investment in science and technology innovation funds and perfect the construction of scientific infrastructure, but they also need actively absorb high-tech talents, highlight the main position of enterprise technological innovation, and promote the transformation of scientific research results for injecting vitality into regional economic development. At the same time, we ought to make full use of the advantage that the interaction among various factors is greater than their respective driving effects, especially the synergy between technological innovation capacity and other factors, and accelerate the transformation of technological advantages into economic advantages to achieve the balanced development of urban economic resilience.
It is worth noting that due to the limitation of data, the evaluation indicators constructed in this paper are still not comprehensive enough to reflect the connotation of economic resilience, and further completion of economic resilience-related indicators is needed in the future. In addition, the study of the drivers of spatial divergence of urban economic resilience in China in this paper only examines the influence of endogenous factors, and the influence of exogenous factors on the spatial divergence of urban economic resilience in China needs to be investigated in the future. At the same time, the influential mechanism of the drivers on urban economic resilience should be further investigated.
Data availability statement
The raw data supporting the conclusion of this article will be made available by the authors, without undue reservation.
Author contributions
JH: Conceptualization, Formal analysis, Software, Validation, Data curation, Writing—original draft and review, Funding acquisition. QL: Formal analysis, Supervision, Visualization. MD: Conceptualization, Methodology, Formal analysis, Writing—review and editing, Project administration. XC: Formal analysis, Writing—review and editing.
Funding
This work is supported by the National Natural Science Foundation of China (72203197). Nanhu Scholars Program for Young Scholars of XYNU.
Conflict of interest
The authors declare that the research was conducted in the absence of any commercial or financial relationships that could be construed as a potential conflict of interest.
Publisher’s note
All claims expressed in this article are solely those of the authors and do not necessarily represent those of their affiliated organizations, or those of the publisher, the editors and the reviewers. Any product that may be evaluated in this article, or claim that may be made by its manufacturer, is not guaranteed or endorsed by the publisher.
Footnotes
1See the 2021 Government Report at: http://www.gov.cn/premier/2021-03/12/content_5592671.htm.
2In 1986, the national “Seventh Five-Year Plan” divided the country into three major economic zones in the east, central and west China; the Qinling-Huaihe River line was used as the dividing line between the northern and southern regions.
References
Adger, W. N. (2000). Social and ecological resilience: Are they related? Prog. Hum. Geogr. 24 (3), 347–364. doi:10.1191/030913200701540465
Adger, W. N. (2003). Social capital, collective action, and adaptation to climate change. Econ. Geogr. 79 (4), 387–404. doi:10.1111/j.1944-8287.2003.tb00220.x
Akita, T. (2003). Decomposing regional income inequality in China and Indonesia using two-stage nested theil decomposition method. Ann. Regional Sci. 37 (1), 55–77. doi:10.1007/s001680200107
Angulo, A. M., Mur, J., and Trívez, F. J. (2018). Measuring resilience to economic shocks: An application to Spain. Ann. Regional Sci. 60 (2), 349–373. doi:10.1007/s00168-017-0815-8
Aroca, P., Bosch, M., and Maloney, W. F. (2005). Spatial dimensions of trade liberalization and economic convergence: Mexico 1985-2002. World Bank Econ. Rev. 19 (3), 345–378. doi:10.1093/wber/lhi018
Assmann, M. L., Tolgensbakk, I., Vedeler, J. S., and Bøhler, K. K. (2021). Public employment services: Building social resilience in youth? Soc. Policy Adm. 55 (4), 659–673. doi:10.1111/spol.12649
Boschma, R., and Martin, R. (2007). Editorial: Constructing an evolutionary economic geography. J. Econ. Geogr. 7 (5), 537–548. doi:10.1093/jeg/lbm021
Brakman, S., Garretsen, H., and van Marrewijk, C. (2015). Regional resilience across europe: On urbanisation and the initial impact of the great recession. Camb. J. Regions, Econ. Soc. 8 (2), 225–240. doi:10.1093/cjres/rsv005
Briguglio, L., Cordina, G., Bugeja, S., and Farrugia, N. (2006). Conceptualizing and measuring economic resilience. Canberra, Australia: ANU Press.
Bristow, G., and Healy, A. (2018). Innovation and regional economic resilience: An exploratory analysis. Ann. Regional Sci. 60 (2), 265–284. doi:10.1007/s00168-017-0841-6
Brown, L., and Greenbaum, R. T. (2017). The role of industrial diversity in economic resilience: An empirical examination across 35 years. Urban Stud. 54, 1347–1366. doi:10.1177/0042098015624870
Chen, Y., Su, X., and Zhou, Q. (2021). Study on the spatiotemporal evolution and influencing factors of urban resilience in the yellow river basin. Int. J. Environ. Res. Public Health 18 (19), 10231. doi:10.3390/ijerph181910231
Cheng, T., Zhao, Y., and Zhao, C. (2022). Exploring the spatio-temporal evolution of economic resilience in Chinese cities during the COVID-19 crisis. Sustain. Cities Soc. 84, 103997. doi:10.1016/j.scs.2022.103997
Davies, S. (2011). Regional resilience in the 2008-2010 downturn: Comparative evidence from European countries. Camb. J. Regions, Econ. Soc. 4 (3), 369–382. doi:10.1093/cjres/rsr019
Di Caro, P. (2017). Testing and explaining economic resilience with an application to Italian regions. Pap. Regional Sci. 96 (1), 93–113. doi:10.1111/pirs.12168
Ding, X., Chong, X., Bao, Z., Xue, Y., and Zhang, S. (2019). Using the geographical detector technique to explore the impact of socioeconomic factors on PM2.5 concentrations in China. J. Clean. Prod. 211, 1480–1490. doi:10.1016/j.jclepro.2018.11.159
Doran, J., and Fingleton, B. (2016). Employment resilience in europe and the 2008 economic crisis: Insights from micro-level data. Reg. Stud. 50 (4), 644–656. doi:10.1080/00343404.2015.1088642
Dormady, N. C., Rose, A., Roa-Henriquez, A., and Morin, C. B. (2022). The cost-effectiveness of economic resilience. Int. J. Prod. Econ. 244, 108371. doi:10.1016/j.ijpe.2021.108371
Du, Z., Zhang, H., Ye, Y., Jin, L., and Xu, Q. (2019). Urban shrinkage and growth: Measurement and determinants of economic resilience in the Pearl River Delta. J. Geogr. Sci. 29 (8), 1331–1345. doi:10.1007/s11442-019-1662-6
Du, M., Feng, R., and Chen, Z. (2022). Blue sky defense in low-carbon pilot cities: A spatial spillover perspective of carbon emission efficiency. Sci. Total Environ. 846, 157509. doi:10.1016/j.scitotenv.2022.157509
Feng, X., Xiu, C., Bai, L., Zhong, Y., and Wei, Y. (2020). Comprehensive evaluation of urban resilience based on the perspective of landscape pattern: A case study of shenyang city. Cities 104, 102722. doi:10.1016/j.cities.2020.102722
Feng, Y., Lee, C. C., and Peng, D. (2022). Does regional integration improve economic resilience? Evidence from urban agglomerations in China. Sustain. Cities Soc. 88, 104273. doi:10.1016/j.scs.2022.104273
Fingleton, B., Garretsen, H., and Martin, R. (2012). Recessionary shocks and regional employment: Evidence on the resilience of U.K. Regions. J. Regional Sci. 52 (1), 109–133. doi:10.1111/j.1467-9787.2011.00755.x
Giannakis, E., and Bruggeman, A. (2017). Determinants of regional resilience to economic crisis: A European perspective. Eur. Plan. Stud. 25, 1394–1415. doi:10.1080/09654313.2017.1319464
Graziano, P., and Rizzi, P. (2016). Vulnerability and resilience in the local systems: The case of Italian provinces. Sci. Total Environ. 553, 211–222. doi:10.1016/j.scitotenv.2016.02.051
Guan, C., and Zhang, J. (2022). Vulnerability and resilience in the local systems: The case of Italian provinces. Open J. Bus. Manag. 10, 2629–2649. doi:10.4236/ojbm.2022.105131
Holling, C. S. (1973). Resilience and stability of ecological systems. Annu. Rev. Ecol. Syst. 4, 1–23. doi:10.1146/annurev.es.04.110173.000245
Holling, C. S. (2001). Understanding the complexity of economic, ecological, and social systems. Ecosystems 4, 390–405. doi:10.1007/s10021-001-0101-5
Holm, J. R., and Østergaard, C. R. (2013). Regional employment growth, shocks and regional industrial resilience: A quantitative analysis of the Danish ict sector. Reg. Stud. 49, 95–112. doi:10.1080/00343404.2013.787159
Hou, M., Deng, Y., and Yao, S. (2022). Coordinated relationship between urbanization and grain production in China: Degree measurement, spatial differentiation and its factors detection. J. Clean. Prod. 331, 129957. doi:10.1016/j.jclepro.2021.129957
Hu, X., Li, L., and Dong, K. (2022). What matters for regional economic resilience amid COVID-19? Evidence from cities in northeast China. Cities 120, 103440. doi:10.1016/j.cities.2021.103440
Huang, J., Sun, Z., and Du, M. (2022). Differences and drivers of urban resilience in eight major urban agglomerations: Evidence from China. Land 11 (9), 1470. doi:10.3390/land11091470
Huang, J., and Zhong, P. (2022). Spatial difference and dynamic evolution of the development level of new urbanization in henan province. J. Xinyang Normal Univ. (Philos. Soc. Sci. Ed.) 42 (6), 21–27. doi:10.3969/j.issn.1003-0964.2022.06.004
Huggins, R., and Thompson, P. (2015). Local entrepreneurial resilience and culture: The role of social values in fostering economic recovery. Camb. J. Regions, Econ. Soc. 8 (2), 313–330. doi:10.1093/cjres/rsu035
Hundt, C., and Holtermann, L. (2020). The role of national settings in the economic resilience of regions—evidence from recessionary shocks in europe from 1990 to 2014. Growth Change 51 (1), 180–206. doi:10.1111/grow.12356
Itzhaki-Braun, Y. (2022). Coping with COVID-19: Resilience factors amongst community social workers. Br. J. Soc. Work 52 (6), 3443–3459. doi:10.1093/bjsw/bcab250
Jiang, D., Wang, X., and Zhao, R. (2022). Analysis on the economic recovery in the post-COVID-19 era: Evidence from China. Front. Public Health 9, 787190. doi:10.3389/fpubh.2021.787190
Ju, H., Zhang, Z., Zuo, L., Wang, J., Zhang, S., Wang, X., et al. (2016). Driving forces and their interactions of built-up land expansion based on the geographical detector-A case study of beijing, China. Int. J. Geogr. Inf. Sci. 30 (11), 2188–2207. doi:10.1080/13658816.2016.1165228
Kitsos, A., and Bishop, P. (2018). Economic resilience in great britain: The crisis impact and its determining factors for local authority districts. Ann. Regional Sci. 60 (2), 329–347. doi:10.1007/s00168-016-0797-y
Lagravinese, R. (2015). Economic crisis and rising gaps north-south: Evidence from the Italian regions. Camb. J. Regions, Econ. Soc. 8 (2), 331–342. doi:10.1093/cjres/rsv006
Li, F., Liu, J., Liu, W., and Liao, S. (2021a). Spatiotemporal dynamics analysis of carbon emissions from nighttime light data in beijing-tianjin-hebei counties. J. Xinyang Normal Univ. 2, 230–236. doi:10.3969/J.ISSN.1003-0972.2021.02.010
Li, R., Wang, Q., Liu, Y., and Jiang, R. (2021b). Per-capita carbon emissions in 147 countries: The effect of economic, energy, social, and trade structural changes. Sustain. Prod. Consum. 27, 1149–1164. doi:10.1016/j.spc.2021.02.031
Liao, L., Du, M., and Huang, J. (2022). The effect of urban resilience on residents’ subjective happiness: Evidence from China. Land 11 (11), 1896. doi:10.3390/land11111896
Liu, W., Zhan, J., Zhao, F., Wang, C., Zhang, F., Teng, Y., et al. (2022). Spatio-temporal variations of ecosystem services and their drivers in the Pearl River Delta, China. J. Clean. Prod. 337, 130466. doi:10.1016/j.jclepro.2022.130466
Lv, C., Bian, B., Lee, C. C., and He, Z. (2021). Regional gap and the trend of green finance development in China. Energy Econ. 102, 105476. doi:10.1016/j.eneco.2021.105476
Martin, R., and Gardiner, B. (2019). The resilience of cities to economic shocks: A tale of four recessions (and the challenge of brexit). Pap. Regional Sci. 98 (4), 1801–1832. doi:10.1111/pirs.12430
Martin, R. (2011). Regional economic resilience, hysteresis and recessionary shocks. J. Econ. Geogr. 12 (1), 1–32. doi:10.1093/jeg/lbr019
Meng, F., Luo, M., Sa, C., Wang, M., and Bao, Y. (2022). Quantitative assessment of the effects of climate, vegetation, soil and groundwater on soil moisture spatiotemporal variability in the Mongolian plateau. Sci. Total Environ. 809, 152198. doi:10.1016/j.scitotenv.2021.152198
Okafor, L. E., Khalid, U., and Burzynska, K. (2022). Does the level of a country's resilience moderate the link between the tourism industry and the economic policy response to the COVID-19 pandemic? Curr. Issues Tour. 25 (2), 303–318. doi:10.1080/13683500.2021.1956441
Quah, D. T. (1997). Empirics for growth and distribution: Stratification, polarization, and convergence clubs. J. Econ. Growth 2 (1), 27–59. doi:10.1023/a:1009781613339
Quan, Q., Liang, W., Yan, D., and Lei, J. (2022). Influences of joint action of natural and social factors on atmospheric process of hydrological cycle in inner Mongolia, China. Urban Clim. 41, 101043. doi:10.1016/j.uclim.2021.101043
Ray, D. M., MacLachlan, I., Lamarche, R., and Srinath, K. P. (2017). Economic shock and regional resilience: Continuity and change in Canada’s regional employment structure, 1987-2012. Environ. Plan. A Econ. Space 49 (4), 952–973. doi:10.1177/0308518x16681788
Rocchetta, S., and Mina, A. (2019). Technological coherence and the adaptive resilience of regional economies. Reg. Stud. 53 (10), 1421–1434. doi:10.1080/00343404.2019.1577552
Rong, P., Shen, W., and Zhao, Q. (2023). Study on spatial differentiation of urban tourism economy in the yellow river basin and its influencing fators. J. Xinyang Normal Univ. (Nat. Sci. Ed.) 1, 59–67. doi:10.3969/j.issn.1003-0972.2023.01.010
Rose, A., and Liao, S. (2005). Modeling regional economic resilience to disasters: A computable general equilibrium analysis of water service disruptions. J. Regional Sci. 45 (1), 75–112. doi:10.1111/j.0022-4146.2005.00365.x
Sabatino, M. (2019). Economic resilience and social capital of the Italian region. Int. Rev. Econ. Finance 61, 355–367. doi:10.1016/j.iref.2019.02.011
Shi C, C., Guo, N., Gao, X., and Wu, F. (2022a). How carbon emission reduction is going to affect urban resilience. J. Clean. Prod. 372, 133737. doi:10.1016/j.jclepro.2022.133737
Shi T, T., Qiao, Y., Zhou, Q., and Zhang, J. (2022b). The regional differences and random convergence of urban resilience in China. Technol. Econ. Dev. Econ. 28 (4), 979–1002. doi:10.3846/tede.2022.16721
Shorrocks, A. F. (1980). The class of additively decomposable inequality measures. Econometrica 48 (3), 613–625. doi:10.2307/1913126
Silverman, B. W. (1986). Density estimation for statistics and data analysis. London: Chapman & Hall.
Simmie, J., and Martin, R. (2010). The economic resilience of regions: Towards an evolutionary approach. Camb. J. Regions, Econ. Soc. 3 (1), 27–43. doi:10.1093/cjres/rsp029
Ubago, Y., Lautre, I. G., Iraizoz, B., and Pascual, P. (2019). Why are some Spanish regions more resilient than others? Pap. Regional Sci. 98 (6), 2211–2231. doi:10.1111/pirs.12464
Wang, J., Li, X., Christakos, G., Liao, Y., Zhang, T., Gu, X., et al. (2010). Geographical detectors-based health risk assessment and its application in the neural tube defects study of the heshun region, China. Int. J. Geogr. Inf. Sci. 24, 107–127. doi:10.1080/13658810802443457
Wang, J., Zhang, T., and Fu, B. (2016). A measure of spatial stratified heterogeneity. Ecol. Indic. 67, 250–256. doi:10.1016/j.ecolind.2016.02.052
Wang, M., Zhao, H., Cui, J., Fan, D., Lv, B., Wang, G., et al. (2018). Evaluating green development level of nine cities within the Pearl River Delta, China. J. Clean. Prod. 174, 315–323. doi:10.1016/j.jclepro.2017.10.328
Wang, Q., Wang, X., and Li, R. (2022b). Does urbanization redefine the environmental kuznets curve? An empirical analysis of 134 countries. Sustain. Cities Soc. 76, 103382. doi:10.1016/j.scs.2021.103382
Wang, S., Wang, L., Huan, Y., Wang, R., and Liang, T. (2022a). Concentrations, spatial distribution, sources and environmental health risks of potentially toxic elements in urban road dust across China. Sci. Total Environ. 805, 150266. doi:10.1016/j.scitotenv.2021.150266
Wang, X., Wang, L., Zhang, X., and Fan, F. (2022c). The spatiotemporal evolution of COVID-19 in China and its impact on urban economic resilience. China Econ. Rev. 74, 101806. doi:10.1016/j.chieco.2022.101806
Wang, Q., Zhang, F., and Li, R. (2023a). Revisiting the environmental kuznets curve hypothesis in 208 counties: The roles of trade openness, human capital, renewable energy and natural resource rent. Environ. Res. 216, 114637. doi:10.1016/j.envres.2022.114637
Wang, Q., Wang, L., and Li, R. (2023b). Trade protectionism jeopardizes carbon neutrality–decoupling and breakpoints roles of trade openness. Sustain. Prod. Consum. 35, 201–215. doi:10.1016/j.spc.2022.08.034
Wang, Q., Yang, T., and Li, R. (2023c). Does income inequality reshape the environmental kuznets curve (ekc) hypothesis? A nonlinear panel data analysis. Environ. Res. 216, 114575. doi:10.1016/j.envres.2022.114575
Wang, Z., and Wei, W. (2021). Regional economic resilience in China: Measurement and determinants. Reg. Stud. 55 (7), 1228–1239. doi:10.1080/00343404.2021.1872779
Wu, Y., Que, W., Liu, Y., Cao, L., Liu, S., and Zhang, J. (2020). Is resilience capacity index of Chinese region performing well? Evidence from 26 provinces. Ecol. Indic. 112, 106088. doi:10.1016/j.ecolind.2020.106088
Yan, X., and Shi, W. (2022). Study on eco-environmental effects of urban green space based on membership function value method. J. Xinyang Normal Univ. (Nat. Sci. Ed.) 3 (35), 410–416. doi:10.3969/j.issn.1003-0972.2022.03.012
Yang, R., Xu, Q., and Long, H. (2016). Spatial distribution characteristics and optimized reconstruction analysis of China’s rural settlements during the process of rapid urbanization. J. Rural Stud. 47, 413–424. doi:10.1016/j.jrurstud.2016.05.013
Zhang, Y., Xie, X., Lin, C., Wang, M., and He, X. (2018). Development as adaptation: Framing and measuring urban resilience in beijing. Adv. Clim. Change Res. 9 (4), 234–242. doi:10.1016/j.accre.2018.12.002
Zhang, M., Du, H., Zhou, G., Mao, F., Li, X., Zhou, L., et al. (2022). Spatiotemporal patterns and driving force of urbanization and its impact on urban ecology. Remote Sens. 14 (5), 1160. doi:10.3390/rs14051160
Zhou, X., Lei, K., Meng, W., and Khu, S. T. (2017). Industrial structural upgrading and spatial optimization based on water environment carrying capacity. J. Clean. Prod. 165, 1462–1472. doi:10.1016/j.jclepro.2017.07.246
Keywords: urban economic resilience, spatial and temporal divergence, drivers, geographic detectors, China
Citation: Huang J, Li Q, Du M and Chen X (2023) Spatial and temporal variation of economic resilience and its drivers: Evidence from Chinese cities. Front. Environ. Sci. 11:1109857. doi: 10.3389/fenvs.2023.1109857
Received: 28 November 2022; Accepted: 06 February 2023;
Published: 16 February 2023.
Edited by:
Qingling Shi, East China Normal University, ChinaReviewed by:
Wei Shui, Fuzhou University, ChinaQiang Wang, China University of Petroleum, Huadong, China
Copyright © 2023 Huang, Li, Du and Chen. This is an open-access article distributed under the terms of the Creative Commons Attribution License (CC BY). The use, distribution or reproduction in other forums is permitted, provided the original author(s) and the copyright owner(s) are credited and that the original publication in this journal is cited, in accordance with accepted academic practice. No use, distribution or reproduction is permitted which does not comply with these terms.
*Correspondence: Minzhe Du, bWluemhlX2R1QDEyNi5jb20=