 Li-Juan Yang1†
 Ya Tao1†Xia Jiang2Ying Wang1Ye-Hao Li1Long Zhou1Pu-Ze Wang1Yuan-Yuan Li1Xu Zhao1
 Hai-Jun Wang1*
 Erik Jeppesen1,3,4,5,6
 Ping Xie1,7
- 1Institute for Ecological Research and Pollution Control of Plateau Lakes, School of Ecology and Environmental Science, Yunnan University, Kunming, China
- 2State Key Laboratory of Environmental Criteria and Risk Assessment, Chinese Research Academy of Environmental Sciences, Beijing, China
- 3Department of Ecoscience, Aarhus University, Aarhus, Denmark
- 4Sino-Danish Centre for Education and Research, Beijing, China
- 5Limnology Laboratory, Department of Biological Sciences and Centre for Ecosystem Research and Implementation (EKOSAM), Middle East Technical University, Ankara, Türkiye
- 6Institute of Marine Sciences, Middle East Technical University, Mersin, Türkiye
- 7Donghu Experimental Station of Lake Ecosystems, State Key Laboratory of Freshwater Ecology and Biotechnology, Institute of Hydrobiology, Chinese Academy of Sciences, Wuhan, China
Both eutrophication and salinization are growing global environmental problems in freshwater ecosystems, threatening the water quality and various aquatic organisms. However, little is known about their interactive effects on theses stressors and the role of lake depth on these interactions. We used field surveys to compared zooplankton assemblages over four seasons in eight Yunnan Plateau lakes with different trophic states, salinization levels, and water depths. The results showed that: 1) the species number (S), density (DZoop), and biomass (BZoop) of zooplankton exhibited strong seasonal dynamics, being overall higher in the warm seasons. 2) Data collected over four seasons and summer data both revealed highly significant positive relationships of S, DZoop, and BZoop with total nitrogen (TN), total phosphorus (TP), and phytoplankton chlorophyll a (Chl a). 3) S, DZoop, and BZoop displayed a unimodal relationship with salinity, peaking at 400–1000 μS/cm (conductivity, to reflect salinity). 4) The two large-sized taxa (cladocerans and copepods) generally increased at low-moderate levels of TN, TP, Chl a, and Cond and was constant or decreased at high levels. The average body mass (biomass/density) of crustaceans decreased with increasing TN, TP, Chl a, and conductivity. Our findings indicate that zooplankton may be more vulnerable in deep lakes than in shallow lakes when exposed to conductivity stress even under mesotrophic conditions, and the overall decrease in size in zooplankton assemblages under the combined stress of eutrophication and salinization may result in a lowered grazing effect on phytoplankton.
1 Introduction
With increasing human activities, lake eutrophication has become a global environmental problem (Wurtsbaugh et al., 2019), causing deteriorated water quality and loss of biodiversity (Wang et al., 2014; Lürling et al., 2017). Moreover, eutrophication may show unexpected effects when interacting with other environmental changes such as global warming (Moss et al., 2011; Nazari-Sharabian et al., 2018). For example, the mass deaths of African elephants in Botswana in 2020 were attributed to a combination of eutrophication and elevated levels of cyanobacterial toxins caused by frequent hot-dry climates (Wang et al., 2021). In some areas, eutrophication may interact with lake salinization; an issue receiving increasing attention particularly in arid and semi-arid zones due to decreased precipitation, increased evaporation, and an increasing demand for food and hence irrigation by a growing population (Williams, 1999; Yılmaz et al., 2021; Cunillera-Montcusí et al., 2022).
Salinization of lakes may inhibit zooplankton and thus promote the development of phytoplankton being released from grazing (O’Neil et al., 2012; Jeppesen et al., 2015; Hintz and Relyea, 2019; He et al., 2020; Jeppesen et al., 2020a). Moreover, greatly decreased diversity, abundance, and hatching rates of zooplankton have been observed at high salinities (Schallenberg et al., 2003; Jeppesen et al., 2015), and a test of five cladocerans (Alona rectangula, Daphnia pulex, Moina macrocopa, Ceriodaphnia dubia, and Simocephalus vetulus) exposed to high salinity showed strongly reduced survival and reproduction (Sarma et al., 2006). A study comparing lakes with wide salinity gradients in north-west China showed a significant functioning loss of the lake ecosystem with increasing salinity, suggested by drastic reduction of biodiversity, food chain length, and average trophic position in the food chain (Vidal et al., 2021). A study of 45 Tibetan lakes in China, moreover, showed that pronounced shifts in the structure and functions of lake ecosystems may be expected when certain critical salinity levels are passed (Lin et al., 2017).
When facing combined stress from salinization and eutrophication, larger changes in lake ecosystems may be expected. For example, an outdoor mesocosm experiment showed that eutrophication and salinization jointly promoted large blooms of phytoplankton and periphyton while causing declines in the abundance of many invertebrate and macrophyte species (Lind et al., 2018). Another example is a study of bacterial communities in selected lakes and rivers in the semi-arid Inner Mongolia Plateau, which showed combined stressor effects of salinity and nutrients on the aquatic bacterial community, leading to a major decline in species diversity (Tang et al., 2021). A study of 20 lakes with different trophic status and salinity in southern Siberia revealed that an increase in the nutrient load led directly to an increase in zooplankton biomass, while an increase in salinity indirectly led to a decrease in zooplankton biomass (Zadereev et al., 2022). Other studies, however, indicate that zooplankton communities developed in eutrophic systems are less sensitive to salinization due to cross-tolerance effects (Ersoy et al., 2022).
Water depth may play a vital role for the interactive effects of eutrophication and salinization in lakes. A study using a global lake data set (573 lakes) demonstrated that the relative roles of nitrogen and phosphorus in affecting eutrophication were determined by water depth, where shallow lakes were mainly eutrophic and dominated by nitrogen limitation, while deep lakes were dominated by phosphorus limitation (Qin et al., 2020). Stratified deep lakes tend to have better water quality and lower biomass of both phytoplankton and zooplankton (Zadereev et al., 2022). Generally, shallow lakes are more susceptible to eutrophication (Qin et al., 2006). Shallow lakes, because of their large surface: volume ratio, are also more vulnerable to drought and imbalanced ratios between evaporation and precipitation (Coops et al., 2003; Jeppesen et al., 2009). However, little is known about the potential role of water depth in influencing the responses of zooplankton to increasing nutrient and salinity levels.
The Yunnan Plateau is an area rich in lakes that experience both eutrophication and salinization. Due to excessive loading of nutrients, many Yunnan Plateau lakes have shifted to a eutrophic state (Liu et al., 2012). Simultaneously, droughts have occurred frequently in the area in recent years; e.g., the average drought frequency increased by 29% from 2009 to 2018; in 2019, the area suffering from extreme drought, which is far more than the normal (Ding and Gao, 2020; Wang and Yu, 2021). The Yunnan Plateau is characterized by lakes with a wide range of depths, and thus exhibit a mosaic of lakes with different eutrophic status, salinities, and depths.
We studied zooplankton in eight lakes at the Yunnan Plateau with contrasting depths, nutrient levels and salinities and had the following hypotheses: 1)The zooplankton biomass will increase with increasing nutrients levels, but less so at high salinities not least at low nutrient concentrations due to an expected cross-tolerance effects in the eutrophic lakes; 2) the zooplankton response to nutrients and salinity will differ between deep and shallow lakes, being stronger for nutrients and less strong for salinity in the shallow lakes.
2 Materials and methods
2.1 Study area
The eight study lakes were Lake Luguhu, Lake Chenghai, Lake Yangzonghai, Lake Erhai, Lake Xingyunhu, Lake Dianchi, Lake Yilonghu, and Lake Qiluhu, with widely varying trophic states ranging from oligotrophic to eutrophic, salinity levels ranging from freshwater to brackish, and an average water depth ranging from 2.2 m to 38.6 m (Figure 1). The area is dominated by a subtropical humid semi-arid monsoon climate (Zheng et al., 2010). Lake Xingyunhu, Lake Dianchi, Lake Yilonghu, and Lake Qiluhu have differed in trophic state in recent years (Supplementary Table S1). The salinity of Lake Chenghai gradually increased between 950–1200 mg/L during 2006–2016 (Supplementary Figure S1).
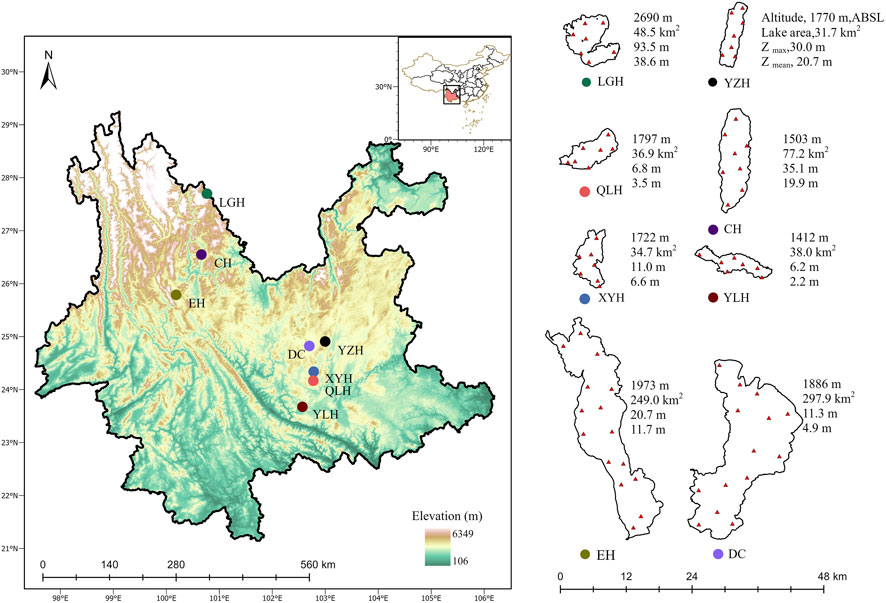
FIGURE 1. Location and sampling sites of the studied lakes. Panels show the geographical location (left) and the basic lake characteristics and sampling sites (right). Zmax, maximum depth; Zmean, mean depth. LGH, Lake Luguhu; CH, Lake Chenghai; YZH, Lake Yangzonghai; EH, Lake Erhai; XYH, Lake Xingyunhu; DC, Lake Dianchi; YLH, Lake Yilonghu; QLH, Lake Qiluhu.
2.2 Sampling and analysis
2.2.1 Water sample collection and analyses
Depending on the morphological characteristics of the lakes, 7–15 sites were selected randomly and sampled in October and December 2020 and April and July 2021. The sampling included physical variables such as water temperature (WT, °C), dissolved oxygen (DO, mg/L), pH, and conductivity (Cond, µS/cm), measured in situ by a multiparameter water quality sonde (EXO2, Xylem, United State). Turbidity (Turb) was measured by a HACH 2100 Q turbidimeter. Water depth (ZM) and Secchi depth (ZSD) were measured by a depth sounder and a Secchi disc, respectively. Water samples were collected at 0.5 m, 3 m and 5 m depth at each sampling site with a 5 L water collector and then mixed. A 1 L subsample was used for water quality determination in the lab. Chlorophyll a (Chl a), total nitrogen (TN), total phosphorus (TP), soluble reactive phosphate (SRP), and nitrate-nitrogen (NO3-N) were analyzed according to the standard methods described by the Editorial Board of Water and Wastewater Monitoring and Analysis Methods of the Ministry of Environmental Protection of the People’s Republic of China (State Environmental Protection Administration, 2002). TN was determined by an alkaline potassium persulfate digestion-UV spectrophotometric method. TP was determined by an ammonium molybdate-ultraviolet spectrophotometric method after being digested with K2S2O8 solution. Chl a was extracted using 90% acetone (at 4°C for 24 h) after filtration through Whatman GF/C filters (0.45 μm, GE Healthcare United Kingdom Limited, Buckinghamshire, United Kingdom), and absorbance was then read at 665 nm and 750 nm, both before and after acidification with 10% HCl by spectrophotometry. For specific variable and season, we averaged all sample points within each lake and then applied the average of the four seasons as the composite value for the whole lake. Because SRP in most of the lakes we studied was below the detection limit, coupled with the fact that TN and nitrate nitrogen were highly correlated (Supplementary Figure S11), we used TN and TP for subsequent analysis.
2.2.2 Zooplankton sample collection and analysis
For zooplankton analysis, a 20 L subsample (a mix of the samples taken at 0.5, 3, and 5 m depth) was concentrated to 50 mL by filtering it through a 64 μm nylon net to collect zooplankton. The samples were fixed with a formaldehyde solution (3%–5% final conc.) and identified microscopically at a magnification of either ×100 or ×200 (Zhang and Huang, 1991). Zooplankton biomass was estimated by multiplying the averaged density with the average dry mass for specific species taken from the literature, i.e., “Specifications for freshwater plankton surveys (SC/T 9402–2010)” (The Ministry of Agriculture of the People’s Republic of China, 2011), and the identification of zooplankton species was mainly conducted according to “New Technology of Micro-biological Monitoring”, “Freshwater Rotifera of China”, and “Zoology of China-Freshwater Copepoda” (Wang, 1961; Editorial Committee of Zoology of China and Chinese Academy of Sciences, 1979; Shen, 1990).
2.3 Data processing and analyses
A comprehensive trophic level index (TLI) of the studied lakes was calculated based on Chl a, TN, TP, and ZSD (Jin and Tu, 1990; Jing et al., 2008). The TLI value for the whole lake is the average of each sampling site during the four seasons.
where TLIj is the comprehensive trophic level index of the Jth parameter, Wj is the relative weight of the trophic level index of the Jth parameter, and rij is the correlation coefficient between the Jth parameter and the reference parameter Chl a.
where the units Chl a, TP, TN, and SD were μg/L, mg/L, mg/L, and m, respectively. The trophic status partition criterion was based on the TLI scores. Oligotrophic, TLI<30; mesotrophic, 30 ≤ TLI≤50; slightly eutrophic,50 < TLI ≤60; medium eutrophic, 60 < TLI ≤70; and highly eutrophic, TLI >70.
Using an average water depth of 10 m as a threshold, the eight lakes were roughly divided into deep (with clear thermal stratification) and shallow (without clear thermal stratification) ones to analyze the potential role of water depth for the response of zooplankton to eutrophication and salinization. Due to the strong spatial heterogeneity of water depth at the different sampling sites in each lake, all the site-specific data from all four seasons were used in the correlation analysis to reveal the potential role of water depth. Moreover, analyses based on average data for the four seasons were performed. To ease comparison with other research studies, the Cl− concentration (mg/L) was converted to conductivity (μS/cm) by the function of Moffet et al. (Afonina and Tashlykova, 2020), and salinity (g/L) was converted to conductivity by dividing by 0.774 (Boros and Vörös, 2010).
Functional Plotting Software (Origin, version 9.1; OriginLab Corp., United State), Statistical Program for Social Sciences (SPSS, version 24.0; International Business Machines Corp., United State) and The R Programming Language (R, version 4.2.0; University of Auckland, NZ) were used to analyze data and draw graphs. The data were Log10-transformed (zooplankton species number and density, Log10 (X + 1); zooplankton biomass, Log10 (X + 0.001)), and SPSS was used to verify whether the data were in line with normal distribution. The “ggpubr”, “ggplot2”, “ggsci”, and “mgcv” packages in R were used for generalized additivity model (GAM) analysis. To develop the GAM model, we first used zooplankton species number and abundance as response variables, and physicochemical indicators of the water environment such as TN, TP, Chl a, conductivity, water depth, transparency and turbidity as independent variables, all variables being log-transformed. Then, we excluded independent variables that were highly correlated with each other. In addition, we used F-statistics and stepwise regression to select significant predictor variables. The final GAM model included four variables of TN, TP, Chl a, and conductivity. To explore the response of zooplankton to nutrient and salinity at different water depths, the lakes were first divided into two groups: deep and shallow. In addition, multiple stepwise regression analysis was performed using SPSS to determine the significance levels of the independent variables, here also including lake depth. In order to determine presence of interactions between nutrients, conductivity and water depths, we developed a regression model including the independent variables and the product terms of the independent variables, i.e., “A*B” model (using spss to convert the variables and build a linear regression model). A second-order polynomial analysis was done using the converted variables (TN*Cond and TP*Cond), with the species number and biomass of zooplankton as response variables, to investigate the interaction between nutrients and conductivity at different water depths.
3 Results
3.1 Main limnological characteristics
The eight lakes formed a clear gradient in nutrient status and salinity measured as conductivity (Cond) (Table 1). Based on the calculated Trophic Level Index (TLI) values, the lakes were categorized as eutrophic (Lakes Xingyunhu, XYH; Dianchi, DC; Yilonghu, YLH; Qiluhu, QLH), mesotrophic (Lakes Chenghai, CH; Yangzonghai, YZH; Erhai, EH), and oligotrophic (Lake Luguhu, LGH). According to the measured Cond, the lakes could be classified into three groups, with the highest levels in CH and QLH, moderate levels in YZH, EH, XYH, DC, and YLH, and the lowest levels in LGH.
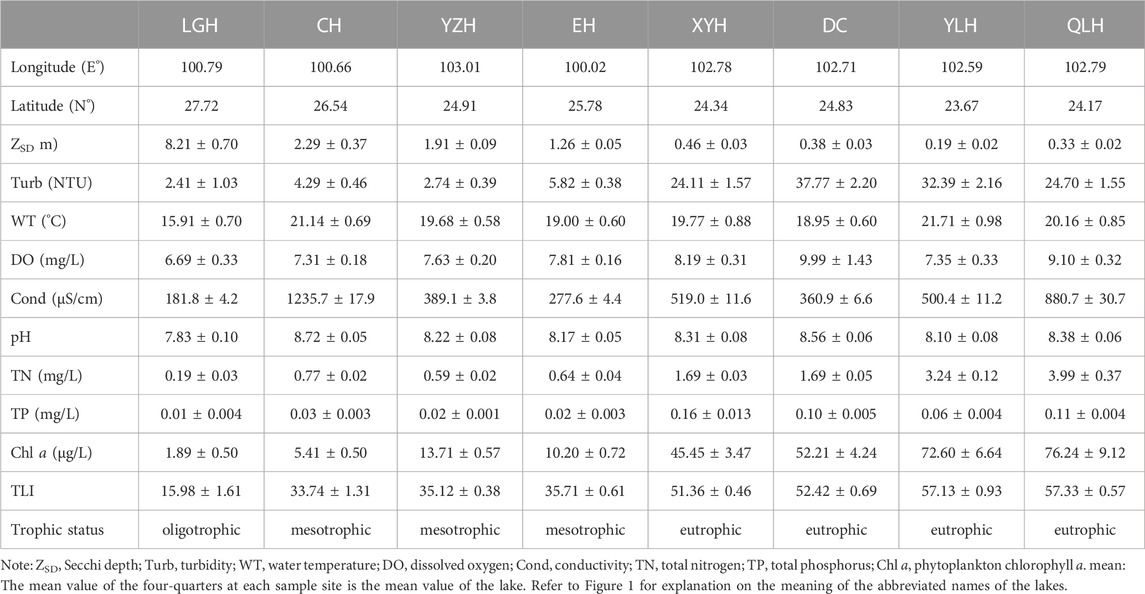
TABLE 1. Main limnological characteristics (mean ± SE) of the eight studied lakes.
3.2 Zooplankton assemblages
The single factor ANOVA analysis indicated that species number, density and biomass of zooplankton differed significantly among the eight lakes (Supplementary Table S2). We found large differences in zooplankton species number S) among the lakes (Figure 2). In general, Ss of cladocerans and copepods was lower than that of rotifers and protozoans except for CH where S for cladocerans and rotifers were higher than for the other two taxa (Figure 2A). S was generally higher in the warm than in the cold seasons except for QLH (Figure 2B).
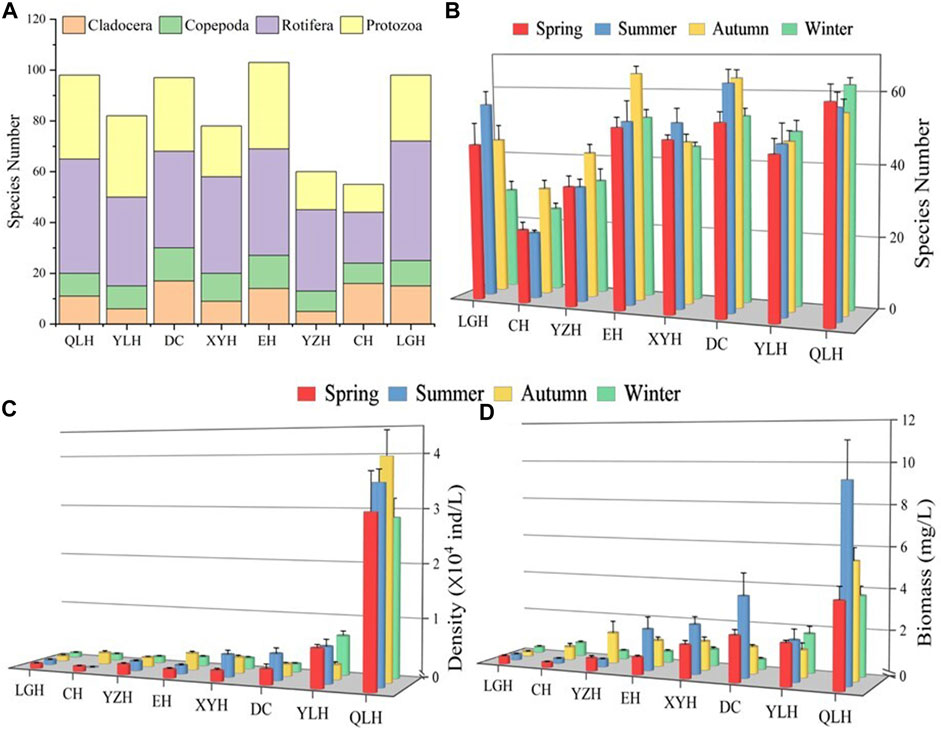
FIGURE 2. Zooplankton assemblage composition in the eight studied lakes. (A) Species number of the eight major taxa, (B) species number in the four seasons. Density (C) and biomass (D) of the main zooplankton groups. Explanation of the abbreviated lake names is given in Figure 1.
The density and biomass of zooplankton (DZoop, BZoop) showed an increasing trend with increasing nutrient status assessed by TLI (Figures 2C, D) and were mostly higher in the warm than in the cold seasons. Rotifers and protozoans were generally dominant (>60%) in density, except for the overwhelming dominance of copepods in CH in summer (>70%) (Figure 3). In terms of biomass, rotifers and copepods dominated in all the studied lakes, while cladocerans also accounted for a large proportion of CH, EH, XYH, and DC (Figure 3).
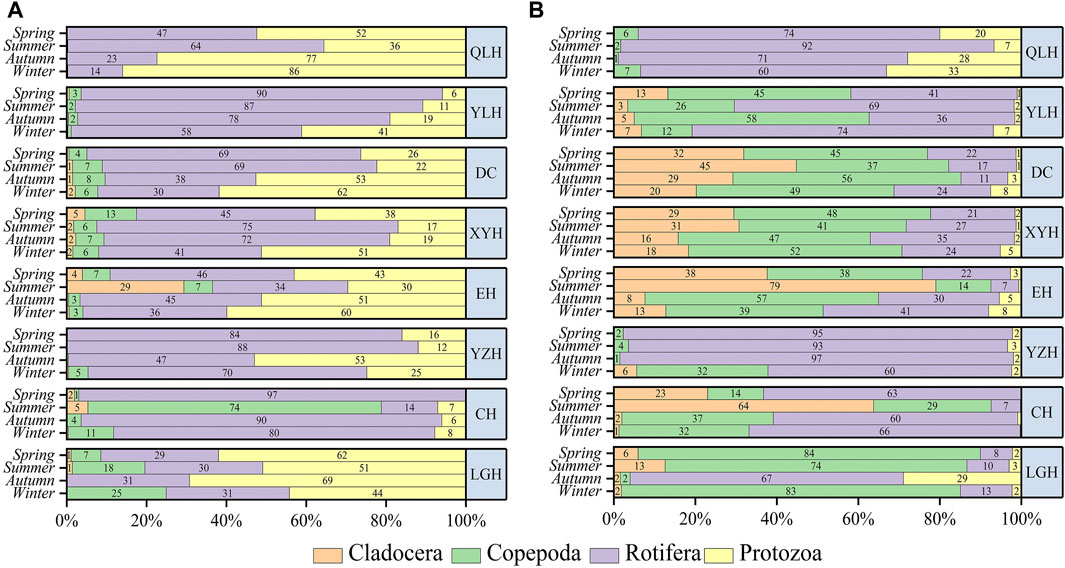
FIGURE 3. Percentage shares of the density (A) and biomass (B) of zooplankton in the studied lakes in the four seasons. The lakes are presented in a decreasing order of trophic status from top to bottom.
3.3 Relationships between zooplankton and the environments
Spearman rank correlation analyses showed highly significant positive relationships between the zooplankton variables (S, DZoop, and BZoop) and TN, TP, Chl a, WT, and TLI and negative relationships with ZM and ZSD (Supplementary Figure S2).
Generally, S displayed increasing trends with TN, TP, and Chl a (Figures 4A–C). There is a unimodal trend between S and conductivity (Cond), with S peaking at intermediate Cond and decreasing at higher Cond (Figure 4D). In comparison, S was much higher in shallow and hypertrophic Lake QLH with similar Cond. The S of cladocerans and copepods generally increased at low-moderate levels of TN, TP, Chl a, and Cond and was constant or decreased at high levels (Figures 4E–L). Differently, the S of rotifers and protozoans showed a relatively pronounced increasing slope at high levels of TN and Chl a and a drop at high Cond (Figures 4M–T). The analyses for summer (Supplementary Figure S4) and four-season mean data in each lake (Supplementary Figure S7) revealed similar results as those of the annual full data set.
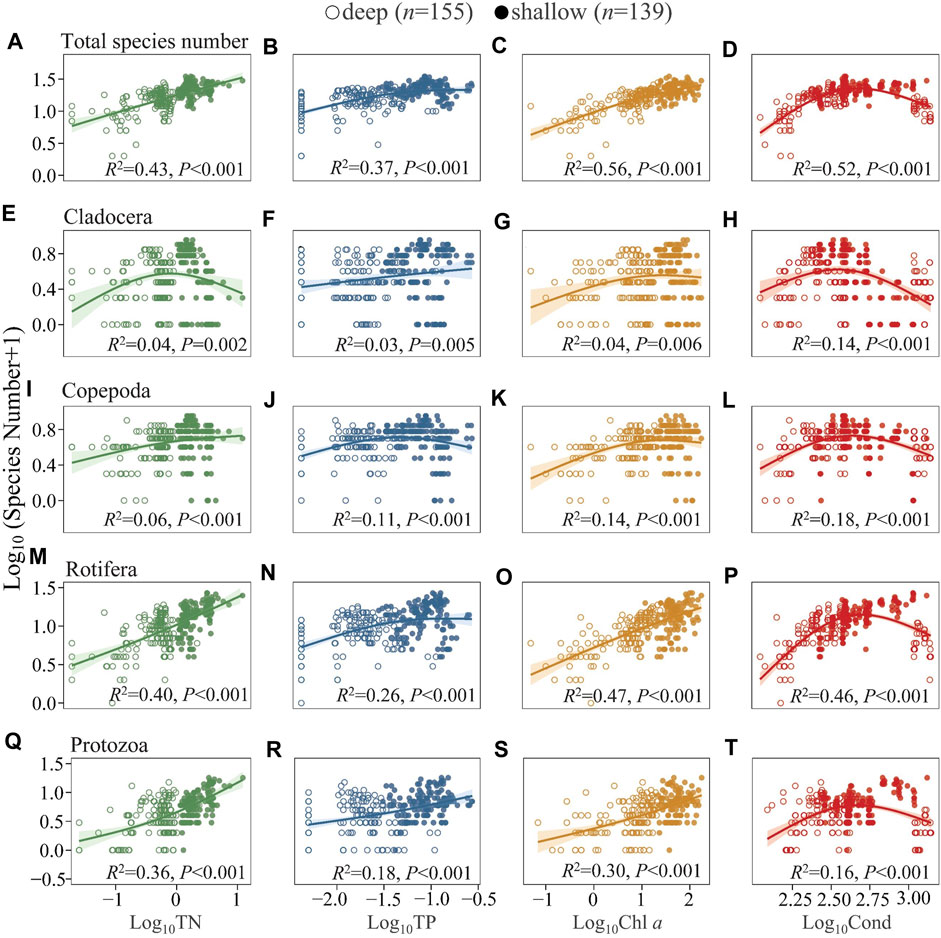
FIGURE 4. Generalized additive model of the relationships between TN, TP, Chl a, and Cond with the species number of total zooplankton (A–D), Cladocera (E–H), Copepoda (I–L), Rotifera (M–P), and Protozoa (Q–T) in the studied lakes. The studied lakes were divided into two groups according to mean depth (Z), i.e., DC, XYH, YLH, and QLH as shallow lakes with Z < 10 m, LGH, CH, YZH, and EH deep lakes with Z > 10 m. See Supplementary Table S3 for model parameters.
Similarly, both DZoop and BZoop increased significantly with increasing TN, TP, and Chl a (Figure 5 and Supplementary Figures S3A–C), with larger slopes at high TN and Chl a and gentler slopes at high TP. There was a unimodal relationship between DZoop and BZoop and Cond, with DZoop and BZoop peaking at intermediate Cond and decreasing at higher Cond (Figure 5 and S3 d). DZoop and BZoop of cladocerans decreased but increased significantly for protozoans at high TN (Figure 5, Supplementary Figures S3E–Q). At high Cond, the abundances of all four taxa in the deep lakes decreased significantly; in shallow lakes, a clear decline was found for the abundance of cladocerans and copepods (Figure 5, Supplementary Figures S3H–L), while rotifer and protozoan abundances maintained increasing trends with Cond (Figure 5, Supplementary Figure S3P–T). The analyses of the summer (Supplementary Figures S5, S6) and annual lake averages for the four season (Supplementary Figures S8, S9) revealed similar results as those of the annual full data set. In the analysis of species number and abundance in relation to TN and TP, the R2 values for relationship to TN were higher than those to TP. The protozoans and rotifers showed the same pattern, while for cladocerans and copepods the relationship were more closely related to TP than to TN.
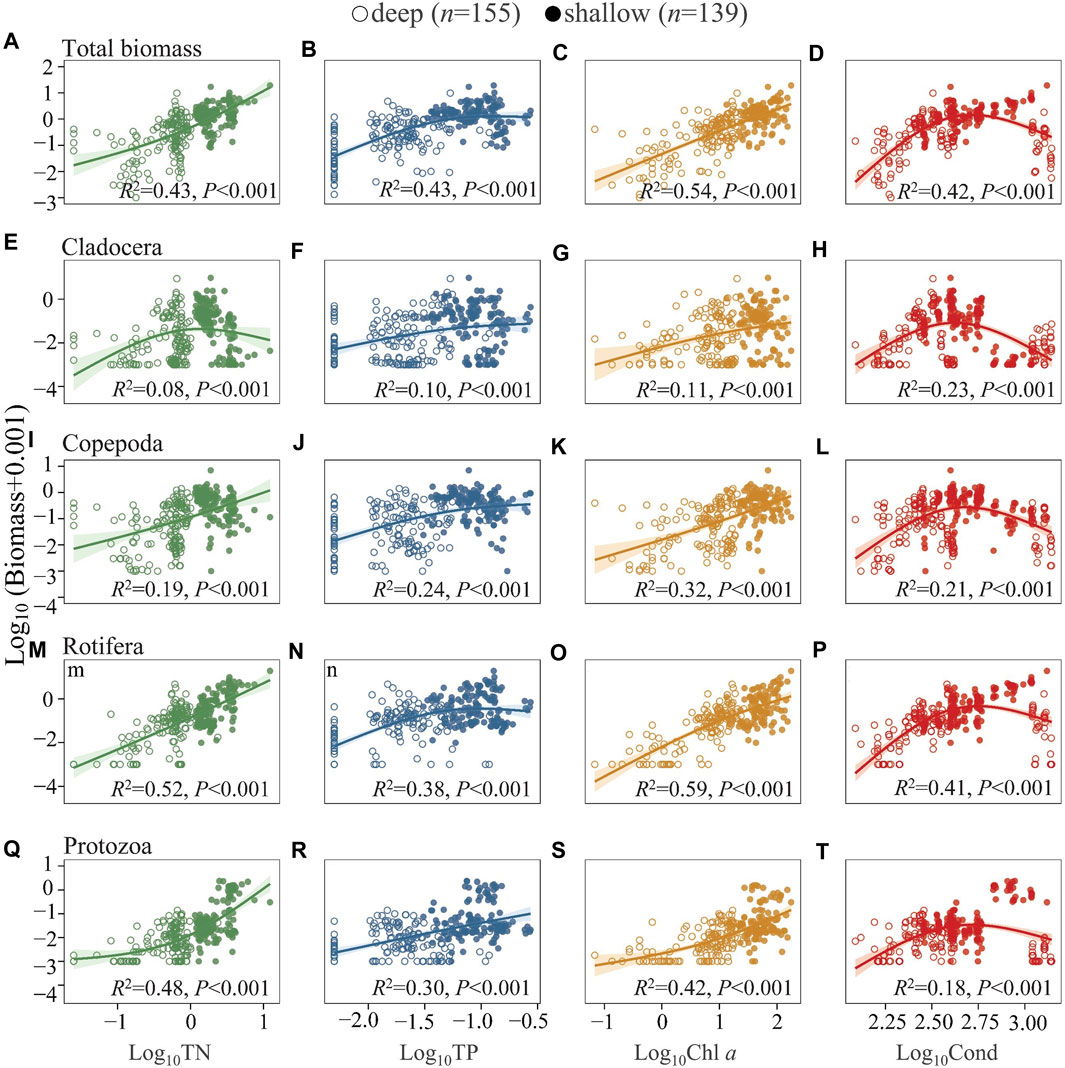
FIGURE 5. Generalized additive model of the relationships between TN, TP, Chl a, and Cond with the biomass of total zooplankton (A–D), Cladocera (E–H), Copepoda (I–L), Rotifera (M–P), and Protozoa (Q–T) in the studied lakes. See Figure 4 for the classification of deep and shallow lakes and Supplementary Table S3 for model parameters.
The ratio of zooplankton biomass to density was also analyzed to elucidate changes in body mass (Leptodora kindti and Simocephalus vetulus were excluded from the 17 sampling sites in Lake Dianchi and from one sampling site in Lake Luguhu in this analysis as the results were biased due to larger size) (Figure 6). Generally, the biomass/density of total zooplankton gradually decreased with increasing TN, TP, Chl a, and Cond (Figures 6A–D). The ratio of cladocerans was generally relatively constant along the environmental gradients studied (Figures 6E–H). Copepods showed a decreasing trend, but in the deep lakes there was a slight increase along the TN and Chl a gradient, and this pattern was consistent for crustaceans (cladocerans and copepods) (Figures 6I–P). We further analyzed the ratio of zooplankton biomass to phytoplankton biomass (because L. kindti is a top predator that never eats phytoplankton, it was subtracted from the 17 sampling sites in Lake Dianchi in this analysis), which generally showed a weak change with TN, TP, and Cond (Supplementary Figure S10). The ratio averaged 0.18 in the deep lakes and 0.10 in the shallow lakes.
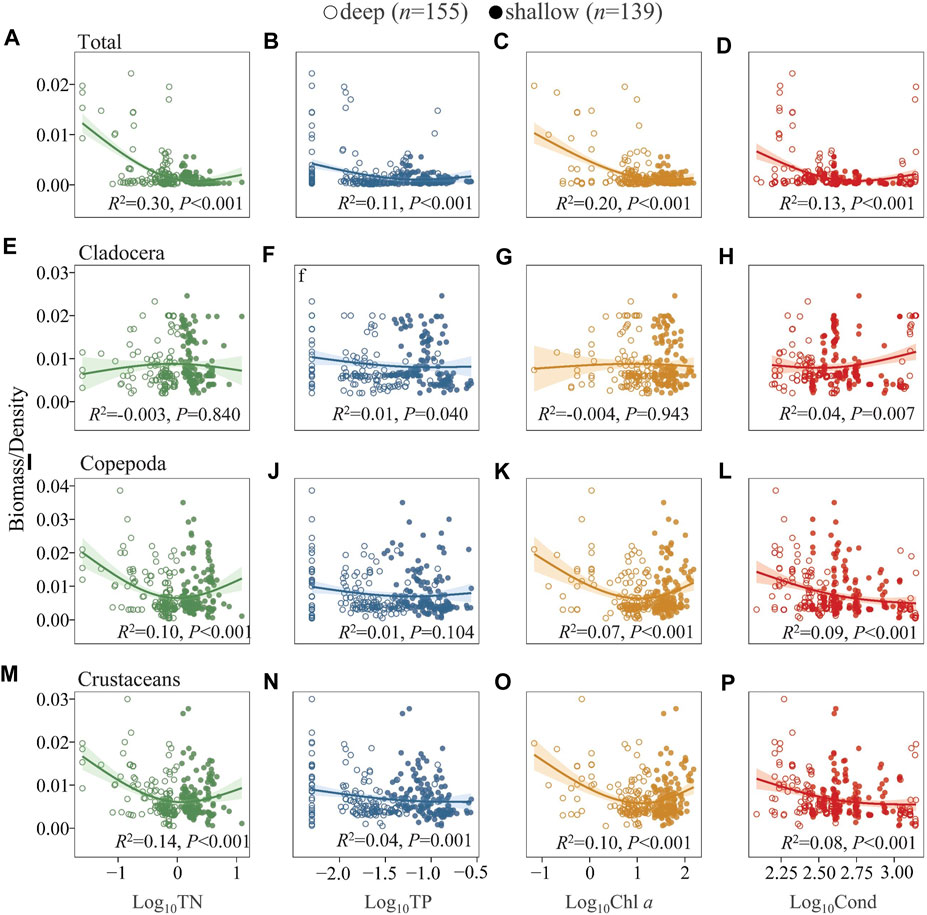
FIGURE 6. Generalized additive model of the relationships between TN, TP, Chl a, and Cond with the biomass/density of total zooplankton (A–D), Cladocera (E–H), Copepoda (I–L), Crustaceans (M–P) in the studied lakes. See Figure 4 for the classification of deep and shallow lakes and Supplementary Table S6 for model parameters.
Multiple stepwise regression analyses showed that TN, Cond, TP and water depth (ZM) were the key driving environmental factors for zooplankton species number (decline with depth), but Cond showed no significant effects on total density and biomass (Table 2). TN, TP, Cond, TN*Cond, TP*Cond, TN*Cond*ZM, TP*Cond*ZM in the regression model (Table 3) were all statistically significant, indicating that interactive effects of Cond with TN and TP, and the water depth played an important role in this interaction. Second-order polynomial analysis showed that both species number and biomass of zooplankton first increased and then decreased with TN*Cond and TP*Cond in the deep lakes, with an overall negative correlation, while a significant positive correlation was found for the shallow lakes (Figure 7).
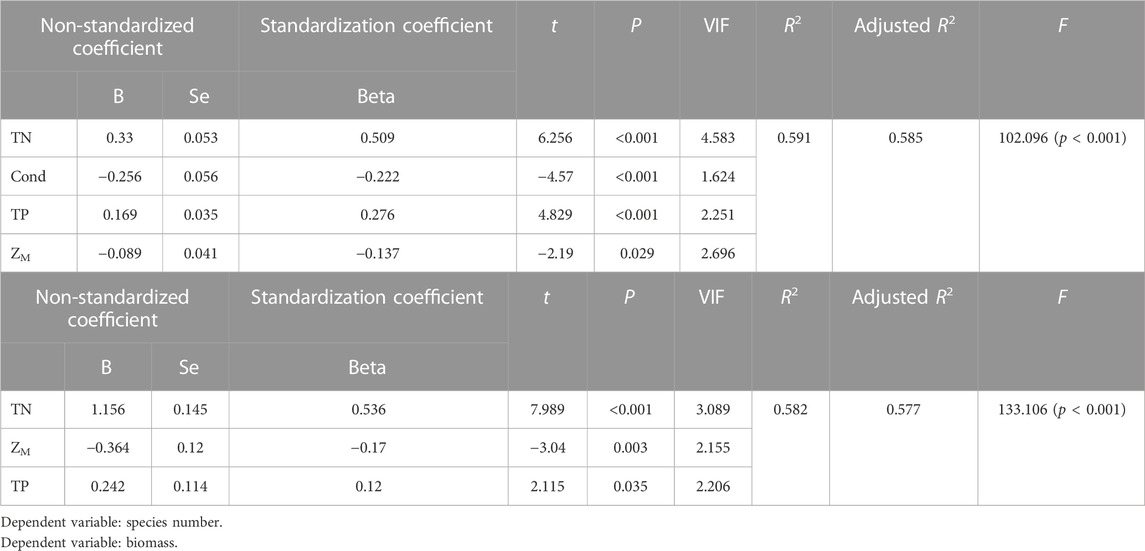
TABLE 2. Multiple stepwise regression analysis of zooplankton species number, biomass and environmental parameters.
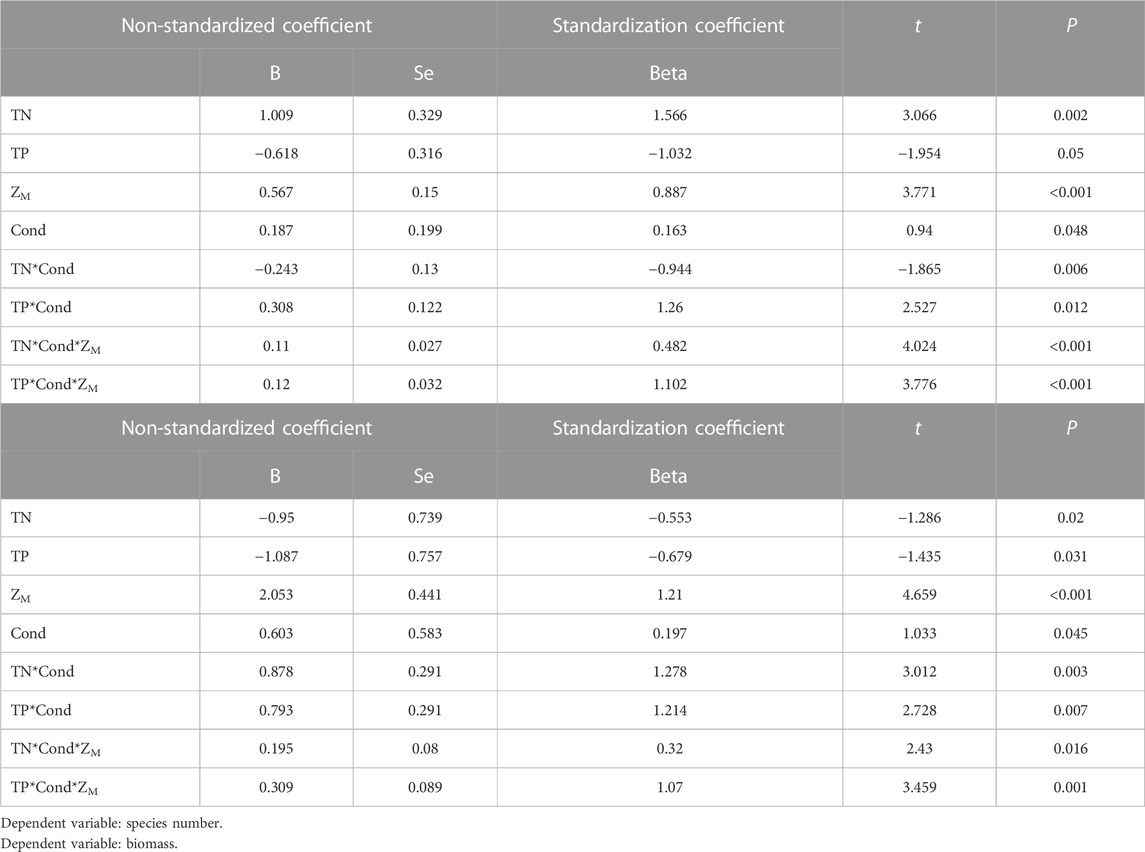
TABLE 3. Analysis of zooplankton species number, biomass and environmental parameters by “A*B” regression model.
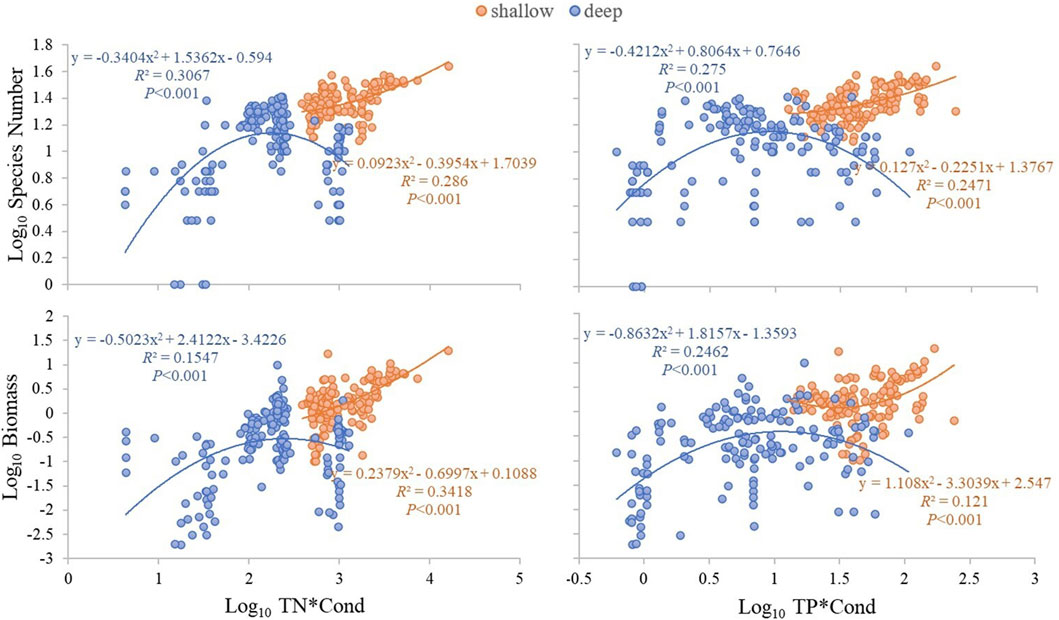
FIGURE 7. Second-order polynomial analysis of the relationship between TN*Cond and TP*Cond and zooplankton species number and biomass in the studied lakes.
4 Discussion
4.1 Changes in zooplankton species diversity and abundance
Our study, based on the mean of four seasons’ data of eight plateau lakes, revealed that both species number and biomass of zooplankton generally increased with increasing nutrient status (TP range 0.005–0.27 mg/L, TN range 0.025–6.09 mg/L), though leveling off at high TP. This concurs with the results of numerous other studies revealing that zooplankton abundance is generally lowest in oligotrophic lakes (May and O’Hare, 2005; Lampert and Sommer, 2007; García-Chicote et al., 2018). Some studies have reported a lower or a decreasing trend in species richness at high nutrient status. Investigations of lakes in Denmark, United State, and Italy found decreased zooplankton species richness above 0.05 mg TP/L, while the abundance of zooplankton increased above 0.09 mg TP/L (Havens et al., 2009; Jeppesen et al., 2011). A study of Danish lakes showed that, within the TP range 0.02–0.99 mg/L, a decreasing trend in species number levelled out at 0.1 mg TP/L while that of biomass remained high until 0.4 mg TP/L (Jeppesen et al., 2000). Studies in theUnited State (Lake Apopka, Florida) and Europe (Lago Trasimeno, Umbria, Italy) showed an increasing trend in zooplankton biomass in the TN range of approximately 0.75–5.7 mg/L (Havens et al., 2009). Another study in Lake Erhai in Yunnan plateau showed an increase in crustacean abundance in the TN range of 0.3–0.8 mg/L (Yin et al., 2023). The widely occurrence of low SRP under detection limit in these lakes might indicate P-limitation on productivity.
We further found water depth (ZM) to be an important influencing factor. ZM was significant negatively correlated with the species number and abundance of zooplankton. Others have also highlighted the role of lake depth. For example, an analysis of data from 1151 lakes (America and the Europe) showed that deep lakes usually have larger volume and a greater environmental capacity to better buffer, dilute and settle incoming nitrogen and phosphorus nutrients than shallow lakes (Zhou et al., 2022). Another example is a study of 30 lakes in the Yangtze River showing that a TP regime shifts thresholds between a clear water state dominated by submerged macrophytes and a turbid water state dominated by phytoplankton varied little at moderate depths, but decreased significantly when the depth exceeded 3–4 m and increased sharply when the depth was below 1-2 m (Wang et al., 2014).
After dividing the eight lakes into deep and shallow, we found that the species number and abundance of zooplankton in deep lakes were more significantly correlated with TN, TP and Chl a than in shallow lakes. Along TN*Cond and TP*Cond gradients, the species number and biomass of zooplankton showed a unimodal relationship in deep lakes, while they increased monotonically along these gradients in the shallow lakes.
Along the conductivity gradient, both the species number and biomass of zooplankton showed increasing trends at a conductivity level as high as 1085 μS/cm in the shallow lakes but were lower at a similar conductivity level (1096 μS/cm) in the deep lake. Similar unimodal changes (as in the deep lake) in the species richness of zooplankton have been reported in some other studies but at different salinity levels, e.g., > 1.4 g/L (1808 μS/cm) in endorheic soda lakes in southeastern Transbaikalia (Russia) (Afonina and Tashlykova, 2020), >500 μS/cm in the Carpathian Basin (Horváth et al., 2014), 0-1 g/L (0–1290) μS/cm in Lake Waihola, New Zealand (Schallenberg et al., 2003), and 1 g/L in a mesocosm experiment (1290 μS/cm) (Nielsen et al., 2008). Increases in the species number and biomass of zooplankton with increasing nutrient levels have also been reported in Danish lakes with conductivities in the range of 0.5–1.2 g/L (646–1550 μS/cm) (Jensen et al., 2010) and in the range of 1745–5790 μS/cm for 24 lakes in Xinjiang, China (Gutierrez et al., 2018). In our study, we demonstrated the interaction between TN, TP and Cond, respectively, and that such interactions differed significantly in deep and shallow (eutrophic) lakes. This indicates a buffering effect of eutrophication, i.e., communities developed under eutrophic conditions may be less sensitive to salinization due to cross-tolerance effects (Ersoy et al., 2022). The shallow lakes in our study and those from Denmark and Xinjiang, China, were mostly eutrophic, while the deep lakes in our study and those with decreased zooplankton at high conductivity were all in an oligotrophic or mesotrophic state.
In addition to the factors already discussed, variation in ion composition may also play a role because salinization effects depend on the composition and concentration of ions, both in terms of background salinity and the ‘chemical cocktails’ of ions created by anthropogenic activities (Schuler and Relyea, 2018; Kaushal et al., 2019; Zadereev et al., 2022). A discrepancy was also found between the effects of conductivity on zooplankton species number (significantly negative) and abundance (weak), as suggested by the results of multiple regression analyses. This may reflect the shift in assemblage composition, i.e., protozoans and rotifers are more tolerant to salinity (Sarma et al., 2006; Hintz et al., 2017) and both dominate and maintain the total density and biomass at high conductivity, as discussed in the following section.
4.2 Zooplankton decline in body mass along with eutrophication and salinization
We found that the average body mass (biomass/density) of crustaceans (cladocerans and copepods) decreased with increasing TN, TP, and Chl a due to changes in species composition. This is consistent with previous studies (e.g., Uye, 1994; Ostojić, 2000; Qin et al., 2013). A survey of 74 lakes in northeastern Poland with TP levels ranging from 0.02 to 0.94 mg/L and Chl a from 1.1 to 182 μg/L, revealing a decrease in average body mass of crustaceans with increasing TP (Ejsmont-Karabin and Karabin, 2013). Another example is a study of 71 shallow lakes in Denmark with a mean summer TP range of 0.02–1 mg/L, revealing that the average body mass of cladocerans decreased with increasing TP (Jeppesen et al., 2000). A study in 631 Danish lakes also showed a weak trend of decreasing body mass of crustaceans in the TP range 0.015–0.3 mg/L (Jeppesen et al., 2020b).
We found that the biomass ratio of zooplankton:phytoplankton decreased weakly with increasing TN and TP but it was overall low; thus, the ratio averaged 0.18 in deep lakes and 0.10 in shallow lakes. Although weak, this relationship was similar to those found elsewhere. For example, a study of 1656 shallow lakes from Florida and Denmark showed a decreasing trend of the zooplankton:phytoplankton ratio within the TP range 0.015–0.3 mg/L (Jeppesen et al., 2020b). A study of 71 shallow lakes in Denmark showed that the zooplankton: phytoplankton ratio was approximately 0.45 at 0-0.05 mg TP/L,.0.25 at 0.05–0.1 mg TP/L, 0.15 at 0.1-0.2 mg TP/L, and 0.1 at 0.2–0.4 mg TP/L (Jeppesen et al., 2000). A study of data collected in 466 lakes in Greenland, Denmark, New Zealand, and Norway showed that the zooplankton:phytoplankton ratio decreased within the range 0.003–0.8 mg/L (from a mean value of 0.35 in the most oligotrophic lakes to less than 0.1–0.2 in the most eutrophic lakes) and that the fish predation pressure on large-bodied cladocerans was overall unimodally related to TP (Jeppesen et al., 2003). Analysis of data collected from lakes and reservoirs across the United States from the 2012 National Lake Assessment also shows that in eutrophic lakes, increasing eutrophication caused a decrease in the ratio between zooplankton and phytoplankton (Yuan and Pollard, 2018).
The generally low biomass of cladocerans, low average body mass of crustaceans and low zooplankton:phytoplankton biomass ratio suggest a strong top-down control by fish of zooplankton (Hrbáček et al., 1961; Brooks and Dodson, 1965; Li et al., 2022), which is typical for (sub) tropical lakes (Jeppesen et al., 2020b). Unfortunately, fish data were not available for the eight lakes in this study due to the fishing ban policy. However, from the published literature, fish in Yunnan Plateau lakes are mainly dominated by planktivores, herbivores, and omnivores (Yuan et al., 2010), many of which prey on zooplankton. The eutrophic study lakes (e.g., YLH, QLH, XYH, and DC) are dominated by planktivorous fish, including silver carp (Hypophthalmichthys molitrix) and bighead carp (Aristichys nobilis) (Guan and Huang, 2014; Wang, 2017; Xue et al., 2017). The lakes with the lowest nutrient levels are dominated by omnivores, planktivores, and herbivores. For example, the main fish species in EH are silver carp (H. molitrix), bighead carp (A. nobilis), grass carp (Ctenopharyngodon Idella), blunt snout bream (Megalobrama amblycephala), salangid icefish (Neosalanx taihuensis), and other fishes such as stone moroko (Fei, 2012). The main fish in LGH are omnivores such as goldfish (Carassius auratus) and carp (Cyprinus carpio) (Huang et al., 2020). The fish in YZH are mainly goldfish, silver carp, bighead carp, tilapia, banded catfish (Pelteobagrus fulvidraco), and small fish such as stone moroko (An et al., 2015). The fish in CH are mainly salangid icefish (Dong and Wang, 2013). Thus, all the lakes were dominated by fish having the potential of feeding on zooplankton.
Along with increasing eutrophication, species richness and the abundance of crustaceans (sum of cladocerans and copepods) showed a weaker upward trend than the abundance of rotifers and protozoans, while cladocerans exhibited a decrease at high TN, all groups demonstrated a decrease at the higher salinity levels, not least in the deep lakes. The average body mass (biomass/density) of crustaceans decreased with increasing TN, TP, Chl a, and conductivity. Such changes have been widely reported in mesocosm experiments (Thompson and Shurin, 2012; Lind et al., 2018; Moffett et al., 2020; Coldsnow and Relyea, 2021; Greco et al., 2022; Hébert et al., 2022; McClymont et al., 2022) and field investigations (Brucet et al., 2009; He et al., 2020; Zadereev et al., 2022) at moderate to low conductivities. However, at higher conductivities, the food web transforms from three-trophic to two-trophic without fish, and large cladocerans such as Daphnia may become dominant until they reach a critical level at high conductivities (Lin et al., 2017).
5 Conclusion
Our study showed interaction effects of nutrients and conductivity (i.e., salinity) on zooplankton and that water depth may play an important role in this interaction. Eutrophication apparently mitigated the effect of salinity stress on zooplankton abundance to some extent. Both eutrophication and salinization led to a decrease in zooplankton body size. At the same TN*Cond and TP*Cond gradients, the species number and biomass of zooplankton showed a decreasing trend in the deep lakes, while the opposite was true in the shallow lakes, suggesting that the salt tolerance of zooplankton in the shallow lake may be higher than that in the deep lake, but further studies are needed to confirm this. In addition, fish apparently had strong control of large-bodied consumer zooplankton in the studied Yunnan Plateau lakes, not least the eutrophic ones.
Data availability statement
The original contributions presented in the study are included in the article/Supplementary Materials, further inquiries can be directed to the corresponding author.
Author contributions
Conceptualization, LY, YT, HW, and PX; methodology, LY, YW, LZ, PW, YHL, YYL, and XZ; formal analysis, LY and YW; writing—original draft preparation, LY; writing—review and editing, HW, XJ, PX, and EJ; supervision, HW and EJ All authors: contributed to the article and approved the submitted version.
Funding
This research was supported by the Yunnan Provincial Department of Science and Technology (202103AC100001; 202001BB050078) and the Strategic Priority Research Program of the Chinese Academy of Sciences (XDB31000000). EJ was also supported by the TÜBITAK program BIDEB2232 (Project 118C250).
Acknowledgments
The authors would like to thank Hui-Lin Bi for helping with the experiments, Ye-Xin Yu, Qing-L-JY Rao, Lei Shi, Yan-Feng Sun, and Hao-Jie Su for their help in data analysis. We thank Anne Mette Poulsen for valuable English editions.
Conflict of interest
The authors declare that the research was conducted in the absence of any commercial or financial relationships that could be construed as a potential conflict of interest.
Publisher’s note
All claims expressed in this article are solely those of the authors and do not necessarily represent those of their affiliated organizations, or those of the publisher, the editors and the reviewers. Any product that may be evaluated in this article, or claim that may be made by its manufacturer, is not guaranteed or endorsed by the publisher.
Supplementary material
The Supplementary Material for this article can be found online at: https://www.frontiersin.org/articles/10.3389/fenvs.2023.1110746/full#supplementary-material
References
Afonina, E. Y., and Tashlykova, N. A. (2020). Fluctuations in plankton community structure of endorheic soda lakes of southeastern Transbaikalia (Russia). Hydrobiologia 847, 1383–1398. doi:10.1007/s10750-020-04207-z
An, L., Yang, J., Zhang, L., Peng, J., and Quan, W. (2015). “Investigation of fish resources in Lake Yangzonghai,” in Lakes and Wetlands and Green Development: Proceedings of the 5th China Lakes Forum.
Boros, E., and Vörös, L. (2010). A magyarországi szikes tavak sótartalma és ionösszetétele. Acta Biol. Debrecina, Suppl. Oecol. Hung. 22, 37–51.
Brooks, J. L., and Dodson, S. I. (1965). Predation, Body Size, and Composition of Plankton: The effect of a marine planktivore on lake plankton illustrates theory of size, competition, and predation. Science 150, 28–35. doi:10.1126/science.150.3692.28
Brucet, S., Boix, D., Gascón, S., Sala, J., Quintana, X. D., Badosa, A., et al. (2009). Species richness of crustacean zooplankton and trophic structure of brackish lagoons in contrasting climate zones: North temperate Denmark and mediterranean catalonia (Spain). Ecography 32, 692–702. doi:10.1111/j.1600-0587.2009.05823.x
Coldsnow, K. D., and Relyea, R. A. (2021). The combined effects of macrophytes and three road salts on aquatic communities in outdoor mesocosms. Environ. Pollut. 287, 117652. doi:10.1016/j.envpol.2021.117652
Coops, H., Beklioglu, M., and Crisman, T. L. (2003). The role of water-level fluctuations in shallow lake ecosystems–workshop conclusions. Hydrobiologia 506, 23–27. doi:10.1023/b:hydr.0000008595.14393.77
Cunillera-Montcusí, D., Beklioğlu, M., Cañedo-Argüelles, M., Jeppesen, E., Ptacnik, R., Amorim, C. A., et al. (2022). Freshwater salinisation: a research agenda for a saltier world. Trends Ecol. Evol. 37, 440–453. doi:10.1016/j.tree.2021.12.005
Ding, T., and Gao, H. (2020). The record-breaking extreme drought in Yunnan Province, Southwest China during spring-early summer of 2019 and possible causes. J. Meteorol. Res. 34, 997–1012. doi:10.1007/s13351-020-0032-8
Dong, Y., and Wang, Z. (2013). Annual variation of zooplankton population characteristics and abundance in Lake Chenghai. J. Hydroecol. 34, 17–24.
Editorial Committee of Zoology of ChinaChinese Academy of Sciences (1979). Zoology of China “freshwater copepoda”. Beijing: Science Press.
Ejsmont-Karabin, J., and Karabin, A. (2013). The suitability of zooplankton as lake ecosystem indicators: Crustacean trophic state index. Pol. J. Ecol. 61, 561–573.
Ersoy, Z., Abril, M., Cañedo-Argüelles, M., Espinosa, C., Vendrell-Puigmitja, L., and Proia, L. (2022). Experimental assessment of salinization effects on freshwater zooplankton communities and their trophic interactions under eutrophic conditions. Environ. Pollut. 313, 120127. doi:10.1016/j.envpol.2022.120127
Fei, J. (2012). Studies on the present condition of fish stocks and its spatial structure, growth characteristics in Lake Erhai. Hangzhou: Hangzhou Normal University.
García-Chicote, J., Armengol, X., and Rojo, C. (2018). Zooplankton abundance: a neglected key element in the evaluation of reservoir water quality. Limnologica 69, 46–54. doi:10.1016/j.limno.2017.11.004
Greco, D. A., Arnott, S. E., Fournier, I. B., and Schamp, B. S. (2022). Effects of chloride and nutrients on freshwater plankton communities. Limnol. Oceanogr. Lett. 8, 48–55. doi:10.1002/lol2.10202
Guan, P., and Huang, G. (2014). Present situation and suggestion of fishery proliferation and release in Lake Xingyunhu. Mod. Agric. Sci. Technol., 250.
Gutierrez, M. F., Tavşanoğlu, Ü. N., Vidal, N., Yu, J., Teixeira-de Mello, F., Çakiroglu, A. I., et al. (2018). Salinity shapes zooplankton communities and functional diversity and has complex effects on size structure in lakes. Hydrobiologia 813, 237–255. doi:10.1007/s10750-018-3529-8
Havens, K. E., Elia, A. C., Taticchi, M. I., and Fulton, R. S. (2009). Zooplankton–phytoplankton relationships in shallow subtropical versus temperate lakes Apopka (Florida, USA) and Trasimeno (Umbria, Italy). Hydrobiologia 628, 165–175. doi:10.1007/s10750-009-9754-4
He, H., Jeppesen, E., Bruhn, D., Yde, M., Hansen, J. K., Spanggaard, L., et al. (2020). Decadal changes in zooplankton biomass, composition, and body mass in four shallow brackish lakes in Denmark subjected to varying degrees of eutrophication. Inland Waters 10, 186–196. doi:10.1080/20442041.2020.1732782
Hébert, M.-P., Symons, C. C., Cañedo-Argüelles, M., Arnott, S. E., Derry, A. M., Fugère, V., et al. (2022). Lake salinization drives consistent losses of zooplankton abundance and diversity across coordinated mesocosm experiments. Limnol. Oceanogr. Lett. 8, 19–29. doi:10.1002/lol2.10239
Hintz, W. D., and Relyea, R. A. (2019). A review of the species, community, and ecosystem impacts of road salt salinisation in fresh waters. Freshw. Biol. 64, 1081–1097. doi:10.1111/fwb.13286
Hintz, W. D., Mattes, B. M., Schuler, M. S., Jones, D. K., Stoler, A. B., Lind, L., et al. (2017). Salinization triggers a trophic cascade in experimental freshwater communities with varying food-chain length. Ecol. Appl. 27, 833–844. doi:10.1002/eap.1487
Horváth, Z., Vad, C. F., Tóth, A., Zsuga, K., Boros, E., Vörös, L., et al. (2014). Opposing patterns of zooplankton diversity and functioning along a natural stress gradient: when the going gets tough, the tough get going. Oikos 123, 461–471. doi:10.1111/j.1600-0706.2013.00575.x
Hrbáček, J., Dvořáková, M., Kořínek, V., and Prochazkova, L. (1961). Demonstration of the effect of the fish stock on the species composition of zooplankton and the intensity of metabolism of the whole plankton association: With 22 figures on 2 folders. SIL Proc. 14, 192–195. doi:10.1080/03680770.1959.11899269
Huang, S., Li, L., Dao, W., and Li, X. (2020). Spatial distribution characteristics analysis and resources assessment of fish in Lake Luguhu. South China Fish. Sci. 16, 53–61.
Jensen, E., Brucet, S., Meerhoff, M., Nathansen, L., and Jeppesen, E. (2010). Community structure and diel migration of zooplankton in shallow brackish lakes: role of salinity and predators. Hydrobiologia 646, 215–229. doi:10.1007/s10750-010-0172-4
Jeppesen, E., Peder Jensen, J., Søndergaard, M., Lauridsen, T., and Landkildehus, F. (2000). Trophic structure, species richness and biodiversity in Danish lakes: Changes along a phosphorus gradient. Freshw. Biol. 45, 201–218. doi:10.1046/j.1365-2427.2000.00675.x
Jeppesen, E., Jensen, J. P., Jensen, C., Faafeng, B., Hessen, D. O., Søndergaard, M., et al. (2003). The impact of nutrient state and Lake depth on top-down control in the pelagic zone of lakes: a study of 466 lakes from the temperate zone to the arctic. Ecosystems 6, 313–325. doi:10.1007/pl00021503
Jeppesen, E., Kronvang, B., Meerhoff, M., Søndergaard, M., Hansen, K. M., Andersen, H. E., et al. (2009). Climate change effects on runoff, catchment phosphorus loading and lake ecological state, and potential adaptations. J. Environ. Qual. 38, 1930–1941. doi:10.2134/jeq2008.0113
Jeppesen, E., Noges, P., Davidson, T. A., Haberman, J., Noges, T., Blank, K., et al. (2011). Zooplankton as indicators in lakes: a scientific-based plea for including zooplankton in the ecological quality assessment of lakes according to the European water framework directive (WFD). Hydrobiologia 676, 279–297. doi:10.1007/s10750-011-0831-0
Jeppesen, E., Brucet, S., Naselli-Flores, L., Papastergiadou, E., Stefanidis, K., Noges, T., et al. (2015). Ecological impacts of global warming and water abstraction on lakes and reservoirs due to changes in water level and related changes in salinity. Hydrobiologia 750, 201–227. doi:10.1007/s10750-014-2169-x
Jeppesen, E., Beklioğlu, M., Özkan, K., and Akyürek, Z. (2020a). Salinization increase due to climate change will have substantial negative effects on inland waters: A call for multifaceted research at the local and global scale. Innovation 1, 100030. doi:10.1016/j.xinn.2020.100030
Jeppesen, E., Canfield, D. E., Bachmann, R. W., Søndergaard, M., Havens, K. E., Johansson, L. S., et al. (2020b). Toward predicting climate change effects on lakes: a comparison of 1656 shallow lakes from Florida and Denmark reveals substantial differences in nutrient dynamics, metabolism, trophic structure, and top-down control. Inland Waters 10, 197–211. doi:10.1080/20442041.2020.1711681
Jin, X., and Tu, Q. (1990). Specification for eutrophication survey of Lakes. Beijing: China Environmental Science Press.
Jing, H., Hua, L., Sun, C., and Guo, J. (2008). Analysis on urban lakes’ eutrophication status in Beijing. J. lake Sci. 20, 357–363. doi:10.18307/2008.0315
Kaushal, S. S., Likens, G. E., Pace, M. L., Haq, S., Wood, K. L., Galella, J. G., et al. (2019). Novel ‘chemical cocktails’ in inland waters are a consequence of the freshwater salinization syndrome. Philos. Trans. R. Soc. B-Biol. Sci. 374, 20180017. doi:10.1098/rstb.2018.0017
Lampert, W., and Sommer, U. (2007). Limnoecology: The ecology of lakes and streams. Oxford: Oxford University Press.
Li, Y., Wang, R., Su, H., Wang, J., Xie, P., and Chen, F. (2022). Eutrophication and predation mediate zooplankton diversity and network structure. Limnol. Oceanogr. 67, S133–S145. doi:10.1002/lno.11957
Lin, Q., Xu, L., Hou, J., Liu, Z., Jeppesen, E., and Han, B.-P. (2017). Responses of trophic structure and zooplankton community to salinity and temperature in Tibetan lakes: Implication for the effect of climate warming. Water Res. 124, 618–629. doi:10.1016/j.watres.2017.07.078
Lind, L., Schuler, M. S., Hintz, W. D., Stoler, A. B., Jones, D. K., Mattes, B. M., et al. (2018). Salty fertile lakes: How salinization and eutrophication alter the structure of freshwater communities. Ecosphere 9, e02383. doi:10.1002/ecs2.2383
Liu, W., Li, S., Bu, H., Zhang, Q., and Liu, G. (2012). Eutrophication in the Yunnan Plateau lakes: the influence of lake morphology, watershed land use, and socioeconomic factors. Environ. Sci. Pollut. Res. 19, 858–870. doi:10.1007/s11356-011-0616-z
Lürling, M., Van Oosterhout, F., and Faassen, E. (2017). Eutrophication and warming boost cyanobacterial biomass and microcystins. Toxins 9, 64. doi:10.3390/toxins9020064
May, L., and O’Hare, M. (2005). “Changes in rotifer species composition and abundance along a trophic gradient in Loch Lomond, Scotland, UK,” in Rotifera x (Springer), 397–404.
McClymont, A., Arnott, S. E., and Rusak, J. A. (2022). Interactive effects of increasing chloride concentration and warming on freshwater plankton communities. Limnol. Oceanogr. Lett. 8, 56–64. doi:10.1002/lol2.10278
Moffett, E. R., Baker, H. K., Bonadonna, C. C., Shurin, J. B., and Symons, C. C. (2020). Cascading effects of freshwater salinization on plankton communities in the Sierra Nevada. Limnol. Oceanogr. Lett. 8, 30–37. doi:10.1002/lol2.10177
Moss, B., Kosten, S., Meerhoff, M., Battarbee, R. W., Jeppesen, E., Mazzeo, N., et al. (2011). Allied attack: Climate change and eutrophication. Inland Waters 1, 101–105. doi:10.5268/IW-1.2.359
Nazari-Sharabian, M., Ahmad, S., and Karakouzian, M. (2018). Climate change and eutrophication: a short review. Eng. Technol. Appl. Sci. Res. 8, 3668–3672. doi:10.48084/etasr.2392
Nielsen, D. L., Brock, M. A., Vogel, M., and Petrie, R. (2008). From fresh to saline: a comparison of zooplankton and plant communities developing under a gradient of salinity with communities developing under constant salinity levels. Mar. Freshw. Res. 59, 549–559. doi:10.1071/mf07166
O’Neil, J. M., Davis, T. W., Burford, M. A., and Gobler, C. J. (2012). The rise of harmful cyanobacteria blooms: the potential roles of eutrophication and climate change. Harmful algae 14, 313–334. doi:10.1016/j.hal.2011.10.027
Ostojić, A. M. (2000). Effect of eutrophication on changes in the composition of zooplankton in the Grošnica Reservoir (Serbia, Yugoslavia). Hydrobiologia 436, 171–178. doi:10.1023/a:1026539616969
Qin, B., Yang, L., Chen, F., Zhu, G., Zhang, L., and Chen, Y. (2006). Mechanism and control of lake eutrophication. Chin. Sci. Bull. 51, 2401–2412. doi:10.1007/s11434-006-2096-y
Qin, B., Gao, G., Zhu, G., Zhang, Y., Song, Y., Tang, X., et al. (2013). Lake eutrophication and its ecosystem response. Chin. Sci. Bull. 58, 961–970. doi:10.1007/s11434-012-5560-x
Qin, B., Zhou, J., Elser, J. J., Gardner, W. S., Deng, J., and Brookes, J. D. (2020). Water depth underpins the relative roles and fates of nitrogen and phosphorus in lakes. Environ. Sci. Technol. 54, 3191–3198. doi:10.1021/acs.est.9b05858
Sarma, S., Nandini, S., Morales-Ventura, J., Delgado-Martínez, I., and González-Valverde, L. (2006). Effects of NaCl salinity on the population dynamics of freshwater zooplankton (rotifers and cladocerans). Aquat. Ecol. 40, 349–360. doi:10.1007/s10452-006-9039-1
Schallenberg, M., Hall, C. J., and Burns, C. W. (2003). Consequences of climate-induced salinity increases on zooplankton abundance and diversity in coastal lakes. Mar. Ecol.-Prog. Ser. 251, 181–189. doi:10.3354/meps251181
Schuler, M. S., and Relyea, R. A. (2018). A review of the combined threats of road salts and heavy metals to freshwater systems. BioScience 68, 327–335. doi:10.1093/biosci/biy018
Shen, Y. (1990). New Technology of micro-biological monitoring. Beijing: China Building Industry Press.
State Environmental Protection Administration (2002). Water and wastewater monitoring and analysis methods. 4th ed. Beijing: China Environmental Science Press.
Tang, X., Xie, G., Shao, K., Tian, W., Gao, G., and Qin, B. (2021). Aquatic bacterial diversity, community composition and assembly in the semi-arid inner mongolia plateau: Combined effects of salinity and nutrient levels. Microorganisms 9, 208. doi:10.3390/microorganisms9020208
The Ministry of Agriculture of the People’s Republic of China (2011). Specifications for freshwater plankton surveys (SC/T 9402-2010). Beijing: China Agriculture Press.
Thompson, P. L., and Shurin, J. B. (2012). Regional zooplankton biodiversity provides limited buffering of pond ecosystems against climate change. J. Anim. Ecol. 81, 251–259. doi:10.1111/j.1365-2656.2011.01908.x
Uye, S. (1994). “Replacement of large copepods by small ones with eutrophication of embayments: Cause and consequence,” in Ecology and morphology of copepods (Springer), 513–519.
Vidal, N., Yu, J., Gutierrez, M. F., de Mello, F. T., Tavşanoğlu, Ü. N., Çakiroglu, A. I., et al. (2021). Salinity shapes food webs of lakes in semiarid climate zones: a stable isotope approach. Inland Waters 11, 476–491. doi:10.1080/20442041.2020.1859290
Wang, J., and Yu, Y. (2021). Comprehensive drought monitoring in Yunnan Province, China using multisource remote sensing data. J. Mt. Sci. 18, 1537–1549. doi:10.1007/s11629-020-6333-7
Wang, H.-J., Wang, H.-Z., Liang, X.-M., and Wu, S.-K. (2014). Total phosphorus thresholds for regime shifts are nearly equal in subtropical and temperate shallow lakes with moderate depths and areas. Freshw. Biol. 59, 1659–1671. doi:10.1111/fwb.12372
Wang, H.-J., Xu, C., Liu, Y., Jeppesen, E., Svenning, J.-C., Wu, J., et al. (2021). From unusual suspect to serial killer: Cyanotoxins boosted by climate change may jeopardize megafauna. Innovation 2, 100092. doi:10.1016/j.xinn.2021.100092
Wang, S. (2017). Biodiversity evaluation study of the Lake Qiluhu in Tonghai. Heilongjiang: Protection Forest Science and Technology, 76–79.
Williams, W. D. (1999). Salinisation: A major threat to water resources in the arid and semi-arid regions of the world. Lake Reserv. Manage 4, 85–91. doi:10.1046/j.1440-1770.1999.00089.x
Wurtsbaugh, W. A., Paerl, H. W., and Dodds, W. K. (2019). Nutrients, eutrophication and harmful algal blooms along the freshwater to marine continuum. WIREs Water 6, e1373. doi:10.1002/wat2.1373
Xue, S., Wang, W., Zhang, W., Xiong, Y., and Luo, Y. (2017). “The evaluation of fish productivity based on the monitoring of the plankton in Lake Dianchi,” in Collection of abstracts from the 2017 Annual Meeting of Chinese Fisheries Society.
Yılmaz, G., Çolak, M. A., Özgencil, İ. K., Metin, M., Korkmaz, M., Ertuğrul, S., et al. (2021). Decadal changes in size, salinity, waterbirds, and fish in lakes of the Konya Closed Basin, Turkey, associated with climate change and increasing water abstraction for agriculture. Inland Waters 11, 538–555. doi:10.1080/20442041.2021.1924034
Yin, C., Yang, Y., Ni, L., Chen, Y., Wen, Z., Su, H., et al. (2023). Temperature, nutrients and planktivorous fish predation interact to drive crustacean zooplankton in a large plateau lake, southwest China. Aquat. Sci. 85, 22–10. doi:10.1007/s00027-022-00921-z
Yuan, L. L., and Pollard, A. I. (2018). Changes in the relationship between zooplankton and phytoplankton biomasses across a eutrophication gradient. Limnol. Oceanogr. 63, 2493–2507. doi:10.1002/lno.10955
Yuan, G., Ru, H., and Liu, X. (2010). Fish diversity and fishery resources in lakes of Yunnan Plateau during 2007-2008. J. Lake Sci. 22, 837–841.
Zadereev, E., Drobotov, A., Anishchenko, O., Kolmakova, A., Lopatina, T., Oskina, N., et al. (2022). The structuring effects of salinity and nutrient status on zooplankton communities and trophic structure in siberian lakes. Water 14, 1468. doi:10.3390/w14091468
Zhang, Z., and Huang, X. (1991). Freshwater plankton research methods. China: Beijing: Science Press.
Zheng, J., Yin, Y., and Li, B. (2010). A new scheme for climate regionalization in China. Acta Geogr. Sin. 65, 3–12.
Keywords: eutrophication, salinization, interactive effects, water depth, zooplankton, miniaturization
Citation: Yang L-J, Tao Y, Jiang X, Wang Y, Li Y-H, Zhou L, Wang P-Z, Li Y-Y, Zhao X, Wang H-J, Jeppesen E and Xie P (2023) Interactive effects of nutrients and salinity on zooplankton in subtropical plateau lakes with contrasting water depth. Front. Environ. Sci. 11:1110746. doi: 10.3389/fenvs.2023.1110746
Received: 29 November 2022; Accepted: 16 February 2023;
Published: 27 February 2023.
Edited by:
Angela Helen Arthington, Griffith University, AustraliaReviewed by:
Richard George Pearson, James Cook University, AustraliaAlbert Luiz Suhett, Universidade Federal Rural do Rio de Janeiro, Brazil
Copyright © 2023 Yang, Tao, Jiang, Wang, Li, Zhou, Wang, Li, Zhao, Wang, Jeppesen and Xie. This is an open-access article distributed under the terms of the Creative Commons Attribution License (CC BY). The use, distribution or reproduction in other forums is permitted, provided the original author(s) and the copyright owner(s) are credited and that the original publication in this journal is cited, in accordance with accepted academic practice. No use, distribution or reproduction is permitted which does not comply with these terms.
*Correspondence: Hai-Jun Wang, d2FuZ2hhaWp1bkB5bnUuZWR1LmNu
†These authors share first authorship